


Abstract
Metabolic phenotype can be affected by multiple factors, including allelic variation and interactions with inhibitors. Human CYP2D6 is responsible for approximately 20% of cytochrome P450–mediated drug metabolism but consists of more than 100 known variants; several variants are commonly found in the population, whereas others are quite rare. Four CYP2D6 allelic variants—three with a series of mutations distal to the active site (*34, *17-2, *17-3) and one ultra-metabolizer with mutations near the active site (*53), along with reference *1 and an active site mutant of *1 (Thr309Ala)—were expressed, purified, and studied for interactions with the typical substrates dextromethorphan and bufuralol and the inactivator SCH 66712. We found that *34, *17-2, and *17-3 displayed reduced enzyme activity and NADPH coupling while producing the same metabolites as *1, suggesting a possible role for Arg296 in NADPH coupling. A higher-activity variant, *53, displayed similar NADPH coupling to *1 but was less susceptible to inactivation by SCH 66712. The Thr309Ala mutant showed similar activity to that of *1 but with greatly reduced NADPH coupling. Overall, these results suggest that kinetic and metabolic analysis of individual CYP2D6 variants is required to understand their possible contributions to variable drug response and the complexity of personalized medicine.
Introduction
CYP2D6 is responsible for approximately 20% of cytochrome P450 (P450)-mediated drug metabolism, although it constitutes only about 2%–5% of the total P450 content in the human liver (Guengerich, 2015; Rendic and Guengerich, 2015). Examples of CYP2D6 substrates include tamoxifen, codeine, bufuralol, debrisoquine, and dextromethorphan, among many others (Ingelman-Sundberg, 2005).
The more than 100 different allelic variants of CYP2D6 with metabolic profiles ranged from poor to ultrarapid (Zanger and Schwab, 2013). Each allelic variant is described by star allele nomenclature in which variants are numbered in the order of their discovery (Robarge et al., 2007). Using this naming system, 2D6*1 is the reference form to which all other sequences are compared. Identified mutations and possible metabolic effects associated with each variant can be found on the Pharmacogene Variation Consortium at www.PharmVar.org.
Previously, our group investigated structural fluctuations by using molecular dynamics of four allelic variants: *34, *17-2, *17-3, and *53, in comparison with the reference *1 (de Waal et al., 2014). Variant *34 was chosen because it has an Arg296Cys alteration that is commonly found in allelic variants of CYP2D6 (Table 1). Variant *17 was chosen for its clinical relevance since it is found in 9%–34% of Africans and African Americans (Ingelman-Sundberg, 2005; Zhou, 2009). In addition, *17-2 and *17-3 provide a series of sequential amino acid changes that include the Arg296Cys change in *34 (Table 1). All three of these allelic variants are associated with reduced activity (Oscarson et al., 1997; Zhou, 2009; Sridar et al., 2011). *53 was included in our study because it may cause an ultra-metabolizer phenotype without a gene-duplication event (Sakuyama et al., 2008; Muroi et al., 2014).
CYP2D6 enzymes used in this study
Allelic variants of CYP2D6 can lead to altered drug responses since CYP2D6 variants affect the pharmacokinetics of ∼50% of 2D6-metabolized drugs (Ingelman-Sundberg, 2005). Personalized medicine is a way to combat differences in drug responses through adjusting doses according to genotype and phenotype (Kirchheiner and Rodriguez-Antona, 2009) or prescribing different medications ((Chicago, 2016). As the demand grows for personalized medicine, understanding the effects of allelic variants will be needed, especially on major drug metabolizing enzymes like CYP2D6 (Yamazaki, 2017).
Inhibitors can also affect CYP2D6 phenotype. Inhibition can be reversible or irreversible. When inhibition is irreversible and is caused by a substrate that is metabolized into a reactive intermediate that covalently modifies the enzyme, it is classified as a mechanism-based inactivator (MBI). MBIs can alter extensive and intermediate metabolizer phenotypes to become poor or null metabolizer phenotypes. MBI can occur through three mechanisms: covalent modification of an amino acid in the enzyme, coordination to the heme, or causing the heme to become covalently bound to the enzyme (Correia and Hollenberg, 2015). Inactivation is NADPH-, time-, and concentration-dependent and creates a loss of enzyme activity for an extended period since the enzyme is rendered completely inactive and must be synthesized anew.
The most potent MBI of CYP2D6 is SCH 66712 (Palamanda et al., 2001; Nagy et al., 2011; Livezey et al., 2012). SCH 66712 was a lead compound as a human dopamine receptor antagonist but was dropped after it was identified as a CYP2D6 inactivator (Palamanda et al., 2001). Our group previously determined that SCH 66712 inactivates 2D6 through protein adduction, although the site of adduction has yet to be identified (Nagy et al., 2011). Molecular docking experiments suggested that Thr309, a nucleophile in the active site, might be the possible target (Nagy et al., 2011). Thus, in the current study, we have also included a CYP2D6 active-site mutant, Thr309Ala. Thr309 is thought to be involved in the oxidation mechanism, regioselectivity, and determining heme spin equilibrium (Keizers et al., 2005a; Bonifacio et al., 2006). Thr309 may also serve as a nucleophile for reactive inactivating electrophiles as the corresponding threonine has been the site of inactivation for MBIs with other P450s (Gay et al., 2011; Lin et al., 2011; Nagy et al., 2011; Zhang et al., 2011).
Allelic variants and MBIs can cause adverse drug-drug interactions and lead to serious side effects and increase the cost of health care (Classen et al., 1997). Gaining a better understanding of mechanism-based inactivators and allelic variants is one step that can be taken to reduce this toxicity (Yamazaki, 2017).
The current study aims to characterize the activity of a few CYP2D6 variants. The results presented with the allelic variants allow for a better understanding of enzyme structure and function of CYP2D6 and the effects of amino acid changes on substrate catalysis and inactivation.
Materials and Methods
Chemicals.
We obtained SCH 66712 from Schering-Plough Research Institute (now Merck & Co., Inc., Kenilworth, NJ) and reconstituted in water for use in assays described to follow. Ultrapure solvents (water, acetonitrile, and methanol) for mass spectrometry (MS) were purchased from EMD Chemicals, Inc. (Gibbstown, NJ). All other solvents were high-performance liquid chromatography (HPLC)-grade and purchased from Sigma-Aldrich (St. Louis, MO). Bufuralol (a mixture of enantiomers) and hydroxyl-bufuralol were from Toronto Research Chemical (Toronto, ON, Canada). Nickel-NTA agarose was from Qiagen (Germantown, MD). NuPAGE Novex 10% Bis-Tris Mini Gels, SimplyBlue, NuPAGE MES SDS Running Buffer, and NuPAGE LDS Sample Buffer were from Invitrogen (now Thermo Fischer Scientific, Waltham, MA). Cumene hydroperoxide (CuOOH) was purchased from TCI America (Portland, OR) and used after washing and extraction (vide infra). Potassium phosphate, NADPH, 1,2-didodecanoyl-sn-glycero-3-phosphocholine phospholipids, acetonitrile, catalase, super oxide dismutase, dextromethorphan, dextrorphan, chymotrypsin, trypsin, wide-range SigmaMarker molecular weight markers, and all other reagents were purchased from Sigma-Aldrich.
Preparation of CuOOH.
Caution! Strong oxidant and can be explosive. CuOOH used in metabolite experiments was prepared by diluting 5 ml of CuOOH containing ∼20% aromatic hydrocarbons (as purchased) with 20 ml of CH2Cl2. The diluted CuOOH was twice washed with 25 ml of 2 M NaOH, followed by two washes with water. The organic layer containing the CuOOH was collected and dried with Na2SO4. After filtering of Na2SO4, the CH2Cl2 layer was removed by roto-evaporation, leaving purified CuOOH that was stored neat at 4°C. Aqueous dilutions of CuOOH (5 mM) were prepared for use in metabolite studies.
Enzymes.
The starting human *1 plasmid (the DB11 construct containing an N-terminal truncation to MARQVHSSWNLPP (as previously reported by Gillam et al., 1995)) with a four-His tag on the C-terminal end (as previously described by Hanna et al. (2001)) and a rat NADPH-reductase plasmid (Gillam et al., 1993) were gifts from Professor F. Guengerich (Vanderbilt University) (Gillam et al., 1993, 1995; Hanna et al., 2001). Allelic variants *34, *17-2, *17-3, and *53, as well as the CYP2D6_Thr309Ala mutant, were prepared by site-directed mutagenesis of the *1 plasmid by Genewiz (Southfield, NJ), and the resulting mutations were confirmed by plasmid sequencing. Recombinant human *1, CYP2D6_Thr309Ala, and allelic variants *34, *17-2, *17-3, and *53 were expressed in Escherichia coli along with the pGro7 plasmid for expression of the chaperone proteins GroEL and GroES (Takara Bio Inc., Shiga, Japan) as previously described (Gillam et al., 1995; Wang et al., 2012). Briefly, purification involved preparation of spheroplasts, followed by nickel-NTA agarose column chromatography and desalting using Pierce Zeba spin columns owing to the tendency of CYP2D6 to aggregate upon dialysis. No stabilizing CYP2D6 ligands were included in the expression or purification steps. P450-reduced CO difference spectra were measured using the methods of Omura and Sato to calculate active P450 concentration (Omura and Sato, 1964). Levels of P420 were also determined using the method of Omura and Sato as summarized by Guengerich (2014), but only P450 values were used in the calculations of enzyme concentrations for assays described below. Purified CYP2D6 enzymes were also examined for the extent of purification by SDS-PAGE on 10% acrylamide gels. Recombinant P450 NADPH-reductase (reductase) was purified from E. coli as previously described and analyzed for purity and mass by whole protein MS (Shen et al., 1989; Holmans et al., 1994).
Determination of Km and vmax with CYP2D6 Enzymes.
Purified CYP2D6 enzymes (0.2 μM) were individually reconstituted with reductase (0.4 μM) and freshly sonicated 1,2-didodecanoyl-sn-glycero-3-phosphocholine phospholipids (30 μM) for 10 minutes at room temperature. Bufuralol (0600 μM) or dextromethorphan (0–1000 μM) and potassium phosphate (pH 7.4, 100 mM, final) were added to achieve a final reaction volume of 100 µl. The reaction mixture was incubated in a 30°C shaking bath for 3 minutes and then initiated with NADPH-generating system (5 mM glucose 6-phosphate, 0.5 mM NADP+, and 0.5 U/ml glucose-6-phosphate dehydrogenase). An incubation temperature of 30°C rather than 37°C was selected to ensure more reproducible activity of all the variants. Reactions were quenched with 20 µl of acetonitrile and placed on ice after a time previously determined to be in the linear product formation range. Samples were then centrifuged (16,100g) for 5 minutes, and the supernatant was injected onto a Kinetex 100 Å C18 column (2.6 μM, 4.6 × 100 mm; Phenomenex, Torrance, CA) with a guard column attached to a Waters e2965 HPLC (Milford, MA) paired with a Waters 474 fluorescence detector. Isocratic mobile phases were used in both bufuralol and dextromethorphan analysis (30% acetonitrile, 70% water, 1 mM perchloric acid for bufuralol and 20% acetonitrile, 0.8% acetic acid, 0.05% triethylamine for dextromethorphan). The excitation and emission wavelengths for bufuralol assays were 252 and 302 nm, respectively, and 280 and 310 nm for dextromethorphan. The velocity of product formed per minute per picomole of 2D6 was calculated based on the concentration of dextrorphan or 1′-hydroxybufuralol product by comparison with a standard curve.
Substrate Depletion Analysis.
Assays were completed by the method of Obach and Reed-Hagen (2002). Briefly, reactions contained dextromethorphan (0.5–1000 µM) and *1, *53, or the Thr309Ala mutant (0.6 µM) reconstituted with reductase (1.2 µM) and lipids (90 µM) in 100 mM potassium phosphate buffer. Reactions were initiated with NADPH (1 mM) and at 0, 1, 2, 5, 10, 20, and 30 minutes, aliquots (20 µl) were removed and quenched with acetonitrile (20 µl). Samples (10 µl) were analyzed by HPLC as described except, instead of dextrorphan, the dextromethorphan peak was quantitated. The depletion rate constant was then determined by plotting the log percentage of dextromethorphan remaining versus the time fitted to a first-order decay function. The depletion rates for each concentration were then plotted against a log scale of dextromethorphan concentration, and the Km was determined with the following equation described by Obach and Reed-Hagen (2002): kdep = kdep([S] = 0) × [1 − ([S]/[S] + Km)], where kdep is the depletion rate constant, kdep([S] = 0) is the theoretical maximum consumption rate at an infinitesimally low substrate concentration, [S] is the substrate concentration, and Km is the Michaelis constant. The Km was determined by the inflection point for the resulting curve.
NADPH Coupling to Metabolite Formation.
P450 2D6 variants (final concentration 0.1 µM) were reconstituted with lipids (30 µM) and reductase (0.2 µM) on ice for 20 minutes before potassium phosphate buffer (pH 7.4, 100 mM) and bufuralol (100 µM) or dextromethorphan (100 or 600 µM) were added. Before initiation of the reaction, each sample was heated in a 30°C water bath with shaking for 3 minutes. The reaction was then initiated with NADPH (0.3 mM), transferred to a quartz microcuvette, and monitored at 340 nm for 10 minutes at 30°C in a spectrophotometer (Varian Cary-300, now Agilent) (Santa Clara, CA). Final reaction volume was 333 µl. The reactions were quenched with acetonitrile once removed from the spectrophotometer. The steady-state rate of NADPH consumption (nanomoles of NADPH per minute per nanomoles CYP2D6) was found using the slope of the linear portion of the resulting spectra for the entire 10 minutes. The products were analyzed by HPLC as described already, and peaks were quantitated by comparison with the appropriate standard curves to calculate picomoles product formed per minute per picomoles CYP2D6. Product formation for each reaction was quantified after quenching of the NADPH consumption reactions. The rate of product formation divided by the rate of NADPH consumption was used to determine the extent of coupling.
Metabolites.
Metabolites formed in separate assays with dextromethorphan and bufuralol with each variant, as well as the Thr309Ala mutant, were analyzed using LC-electrospray ionization (ESI)-MS detection and MSn. P450 2D6 variants (final concentration 1 µM) were reconstituted with lipids (30 µM) and reductase (2 µM) on ice for 20 minutes before potassium phosphate buffer (pH 7.4, 100 mM), substrate (30 µM for dextromethorphan and bufuralol) and water were added. Samples were placed in a water bath at 30°C with shaking for 3 minutes and then initiated with either an NADPH-generating system (final reaction volume was 100 µl) or with CuOOH (500 µM). The NADPH-generating system consisted of glucose 6-phosphate (5 mM), NADP+ (0.5 mM), and glucose-6-phosphate dehydrogenase (0.5 U/ml). The reactions proceeded for 30 minutes before each sample was quenched with acetonitrile, centrifuged, and analyzed using a Waters Alliance 2690 HPLC system in conjunction with a Thermo-Fisher Scientific LXQ MS. Separation was achieved with a Kinetex C18 column (2.5 µm, 100 Å, 100 × 2.10 mm; Phenomenex) and a flow rate of 0.1 ml/min. The mobile phase for isocratic separation of the dextromethorphan samples was as described: 20% acetonitrile, 0.8% acetic acid, and 0.05% triethylamine in MS-grade water. For bufuralol samples, the HPLC conditions were modified to a gradient separation as follows: solvent A, 10% acetonitrile, 1 mM perchloric acid in MS grade water; solvent B: 30% acetonitrile, 1 mM perchloric acid in MS-grade water; t = 0 minute, 100% A; t = 5 minutes, 100% A; t = 25 minutes, 0% A; t = 35 minutes, 0% A; t = 40 minutes, 100% A; t = 55 minutes, 100% A. The column effluent was directed into an LXQ mass analyzer operated in the positive ion mode using the Xcalibur software package. The ESI conditions were as follows: sheath gas, 19 arbitrary units; auxiliary gas, 10 arbitrary units; spray voltage, 5.5 kV; capillary temperature, 275°C; capillary voltage, 10 V; and tube lens offset, 15 V.
Spectral Binding Titrations.
Spectral binding titration studies were carried out with recombinant purified CYP2D6 enzymes (1 µM) in potassium phosphate buffer (100 mM, pH 7.4). The solution was evenly divided between two cuvettes, and the experiments were performed at room temperature using a Cary 300 dual-beam spectrophotometer (Varian, Inc., Walnut Creek, CA). A baseline correction was recorded (350–500 nm). Substrate, typically 1–300 µM, was then titrated into the sample cuvette, and the equivalent volume of water was added to the reference cuvette; the spectra were recorded (350–500 nm) after each addition. The difference between the absorbance maximum and minimum was plotted against substrate concentration, and the data were analyzed by a nonlinear regression using KaleidaGraph (Synergy Software, Reading, PA). The dissociation constant, Ks, was determined using the following quadratic velocity equation: [CYP2D6 • substrate] = 0.5 (Ks + Et + St) − [0.25 (Ks + Et + St)2 − EtSt]1/2, where St represents substrate concentration, Et is the total enzyme concentration, and Ks is the spectral dissociation constant for the reaction CYP2D6 + substrate ↔ [CYP2D6 • substrate].
SCH 66712 Metabolite Analysis.
Metabolites of SCH 66712 formed by all purified CYP2D6 enzymes were determined by LC-ESI-MS as previously described (Nagy et al., 2011; Bolles et al., 2014). Briefly, purified 2D6 enzymes (1 μM), lipids (30 μM), and reductase (2 μM) were reconstituted for 10 minutes at room temperature, followed by the addition of potassium phosphate (100 mM, pH 7.4), SCH 66712 (100 µM), and ultrapure water in a volume of 200 µl. The mixture was preincubated for 3 minutes at 37°C in a water bath with shaking followed by the addition of NADPH-generating system (30 µl) or CuOOH (500 µM). The reaction proceeded for 40 minutes at 37°C with shaking in a water bath. The reaction was quenched with acetonitrile (30 µl) and placed on ice. The sample was then centrifuged for 5 minutes at 13,800g, and the supernatant was collected without disrupting the pellet. The samples were analyzed using LC-ESI-MS as previously described (Nagy et al., 2011).
Determination of KI and kinact.
Purified CYP2D6 enzymes (3 μM) were individually reconstituted with reductase (6 μM) and freshly sonicated lipids (90 μM) for 20 minutes on ice. To this, potassium phosphate (pH 7.4, 100 mM), superoxide dismutase (80 U/ml), catalase (5 mg/ml), and SCH 66712 (0–48 μM) were added. The final reaction volume was 200 μl. This primary reaction mixture was incubated in a 30°C shaking bath for 3 minutes and then initiated with NADPH (1 mM). Aliquots (10 μl) of the primary reaction were removed at 0, 1, 2, 5, or 9 minutes and added to the secondary reaction containing NADPH (1 mM) and dextromethorphan or bufuralol (100 μM) in potassium phosphate, pH 7.4 (100 mM) (final volume 200 μl). Reactions were quenched with 30 µl of acetonitrile and placed on ice after 10 minutes. Samples were then centrifuged (16,100g) for 5 minutes and an aliquot of the supernatant (10 µl) was analyzed by HPLC as described above for analysis of 1′-hydroxybufuralol or dextrorphan.
Trapping Agents.
*53 (3 µM) was reconstituted with reductase (6 µM) and lipids (90 µM) for 20 minutes on ice. After reconstitution, potassium phosphate buffer (100 mM, pH 7.4) and freshly prepared solutions of NAC (2 mM) or glutathione (GSH) (2 mM) were added in a final reaction volume of 200 µl. Reactions were preincubated for 3 minutes at 30°C and then initiated with NADPH (1 mM), except the no NADPH control reaction that received an equal volume of water. After 45 minutes, the reactions were quenched with 30 µl of acetonitrile and placed on ice. Samples were then centrifuged, and the supernatant was collected for analysis by LC/MS conditions as described with a solvent system consisting of A (0.05% trifluoroacetic acid, 10% methanol, 90% water) and B (0.05% trifluoroacetic acid, 10% methanol, 90% acetonitrile). After an initial 5-minute hold at 95% A, a linear gradient of 95% A to 50% A over 20 minutes was applied for resolution of reaction components followed by a 1-minute hold at 50% A and then return to the initial conditions.
Partition Ratio.
Primary reaction mixtures contained purified *1 (3 µM), the Thr309Ala mutant (3 µM), or *53 (1 µM), reductase (6, 6, or 2 µM, respectively), lipids (30 µM), potassium phosphate buffer (100 mM, pH 7.4), and varying concentrations of SCH 66712 (0–150 μM) in a final volume of 100 µl. The primary reaction mixtures were preincubated in a shaking water bath at 30°C for 3 minutes, and then all primary reactions except the control were initiated with NADPH (1 mM). The control received an equal volume of water. The primary reactions were then incubated for 30 minutes to ensure inactivation was complete. Aliquots of 10 μl were added to the secondary reactions, and the samples were incubated and analyzed as described. From a plot of the percent remaining activity versus [inactivator]/[CYP2D6], the partition ratio was calculated by the method of Silverman using the intersection of the linear regression of the steeper slope of the high ratios with the x-axis (Silverman, 1988). All experiments were done in triplicate.
Molecular Visualization and Docking.
Substrates were docked in to the active site of CYP2D6 (PDB ID 3QM4) using AutoDock Vina (http://autodock.scripps.edu) (Morris et al., 1998; Huey et al., 2007). Only chain A of 3QM4 and its corresponding heme cofactor were used; crystallographic waters and prinomastat were removed before docking studies. All molecular structures were produced using PyMOL Molecular Graphics System, Version v1.7.6.6 (Schrödinger, Portland, OR).
Results
Expression and Purification of CYP2D6 Enzymes.
Each CYP2D6 enzyme expression culture, except *1, showed ∼230–350 nmol of P450 per liter of culture as determined from reduced CO-difference spectra of whole E. coli cells at the time of cell harvest; *1 showed higher expression at ∼650 nmol/liter. Final purification indicated > ∼90% homogeneity (Supplemental Fig. 1). Reduced CO-difference spectra at the end of purification showed 3–14 µM P420 compared with 17–96 µM P450 (Fig. 1; Supplemental Table 1). For *17-2 and *17-3, the levels of P420 were prominent and accounted for ∼25%–40% of the enzyme present. For use in assays, the concentration of active enzyme for each variant was determined using reduced CO-difference spectra at 450 nm, and P420 was not used to calculate enzyme concentration.

Reduced Fe2+-CO difference spectra for each purified CYP2D6 enzyme. (A) *1. (B) *53. (C) Thr309Ala mutant. (D) *34. (E) *17-2. (F) *17-3. Supplemental Table 1 has calculated P450 and P420 for each spectrum shown.
Michaelis-Menten Analysis.
Purified enzymes were analyzed with regard to steady-state enzyme kinetics with two typical CYP2D6 substrates: bufuralol and dextromethorphan. Both substrates are widely used in the characterization of CYP2D6 activity, and both possess aromatic rings and a basic nitrogen that are characteristic of CYP2D6 substrates; however, dextromethorphan is more rigid and has fewer degrees of rotation than bufuralol.
All CYP2D6 enzymes were active in metabolism of bufuralol and dextromethorphan with the greatest metabolic efficiency observed with *53 (Fig. 2; Table 2). The overall efficiency, as calculated by vmax/Km, of *53, was nearly an order of magnitude greater than *1 when bufuralol was the substrate and only ∼1.5× higher than *1 with dextromethorphan as substrate, although this latter value is an underestimate due to the presence of additional and quantitatively significant metabolites of dextromethorphan formed by *53 samples (vide infra). Likewise, the Thr309Ala mutant had similar efficiency as *1 with bufuralol as substrate (89%), but the efficiency was reduced when dextromethorphan was the substrate (54%). Again, this was due to the presence of additional products formed by Thr309Ala that were not formed by *1 (or by *53). The *34, *17-2, and *17-3 enzymes had lower overall activity compared with *1, regardless of substrate (Fig. 2; Table 2).

Michaelis-Menten analysis of purified CYP2D6 enzymes determined with (A) bufuralol as substrate and (B) dextromethorphan as substrate. Rates of product formation were fit to the Michaelis-Menten equation, and Km and vmax values were determined. Km, vmax, and vmax/Km values are shown in Table 2. Reactions catalyzed by *1 (●), *34 (○), *17-2 (▪), *17-3 (□), *53 (▲), and Thr309Ala (△) are shown.
Summary of kinetic parameters from Michaelis-Menten analysis of 2D6 enzymes
All values are mean ± S.D. of an experiment completed in triplicate. Km is expressed in micromolars, vmax is in picomoles of product per minute per picomoles of 2D6, and efficiency is defined as vmax/Km. Products measured were 1′-hydroxybufuralol in assays with bufuralol as substrate and dextrorphan in assays with dextromethorphan as substrate. Note: *53 and the Thr309Ala mutant produced other significant metabolites of dextromethorphan that are not included in the product calculations here owing to a lack of standards for quantification of absolute amount of product formed.
To gain additional understanding of Km with dextromethorphan as substrate for *53 and the Thr309Ala mutant that produced multiple products in addition to dextrorphan, substrate depletion analysis via the method of Obach and Reed-Hagen was completed with *53, the Thr309Ala mutant, and, for comparison, *1 (Obach and Reed-Hagen, 2002) (Supplemental Fig. 2). The value for Km with *1 using this method was 30 ± 4 µM, lower, but comparable to, the value determined by Michaelis-Menten analysis (120 ± 30 µM). The Km for *53 as measured using substrate depletion was 270 ± 76 µM, similar to the reported value of 300 ± 80 µM). With the Thr309Ala mutant, the Km measured by substrate depletion was 21 ± 7 µM. The substrate depletion value of Km was much lower in this case than the value determined by Michaelis-Menten because the Thr309Ala mutant favored production of N-oxide and N-demethylation products and produced less dextrorphan than *1 and *53 (vide infra). Finally, using substrate depletion analysis with dextromethorphan revealed that the Km values for *1 and the Thr309Ala mutant metabolism of dextromethorphan were similar (30 and 21 µM, respectively), as they were with bufuralol metabolism, where both enzymes produced the same major product. The substrate depletion method does not allow for calculation of vmax.
Metabolism of Bufuralol and Dextromethorphan.
Metabolites of bufuralol and dextromethorphan, identified based on MS2 fragmentation patterns (data not shown), were examined with each variant. In reactions containing bufuralol (262 m/z) as substrate, product distributions among 1′-, 4-, and 6-hydroxybufuralol eluting at 25, 28, and 35 minutes, respectively, were similar among variants, and additional, novel mono-oxygenated metabolites of 278 m/z were not observed (Fig. 3A; note that chromatograms are on the same scale with the normalized level indicated on the figure). Dehydrogenated (Δ1′,2′) bufuralol eluted later than the hydroxylated products at 41 minutes (labeled f) and was formed by all variants as well, but at an order of magnitude lower level than the mono-oxygenated products (Fig. 3B). The peak at 25 minutes (labeled d) in the 260 m/z extracted ion chromatogram (XIC) was a contaminant that was present in the standard as well as in all in the reactions with NADPH and CuOOH (Fig. 3B; Supplemental Fig. 3). Also, an additional metabolite with 260 m/z was formed by the Thr309Ala mutant and eluted at 28 minutes (labeled e, Fig. 3B). The identity of the metabolite is unknown, but the collision-induced disassociated (CID) fragmentation is consistent with dehydrogenation possibly at the amine (Supplemental Fig. 3).
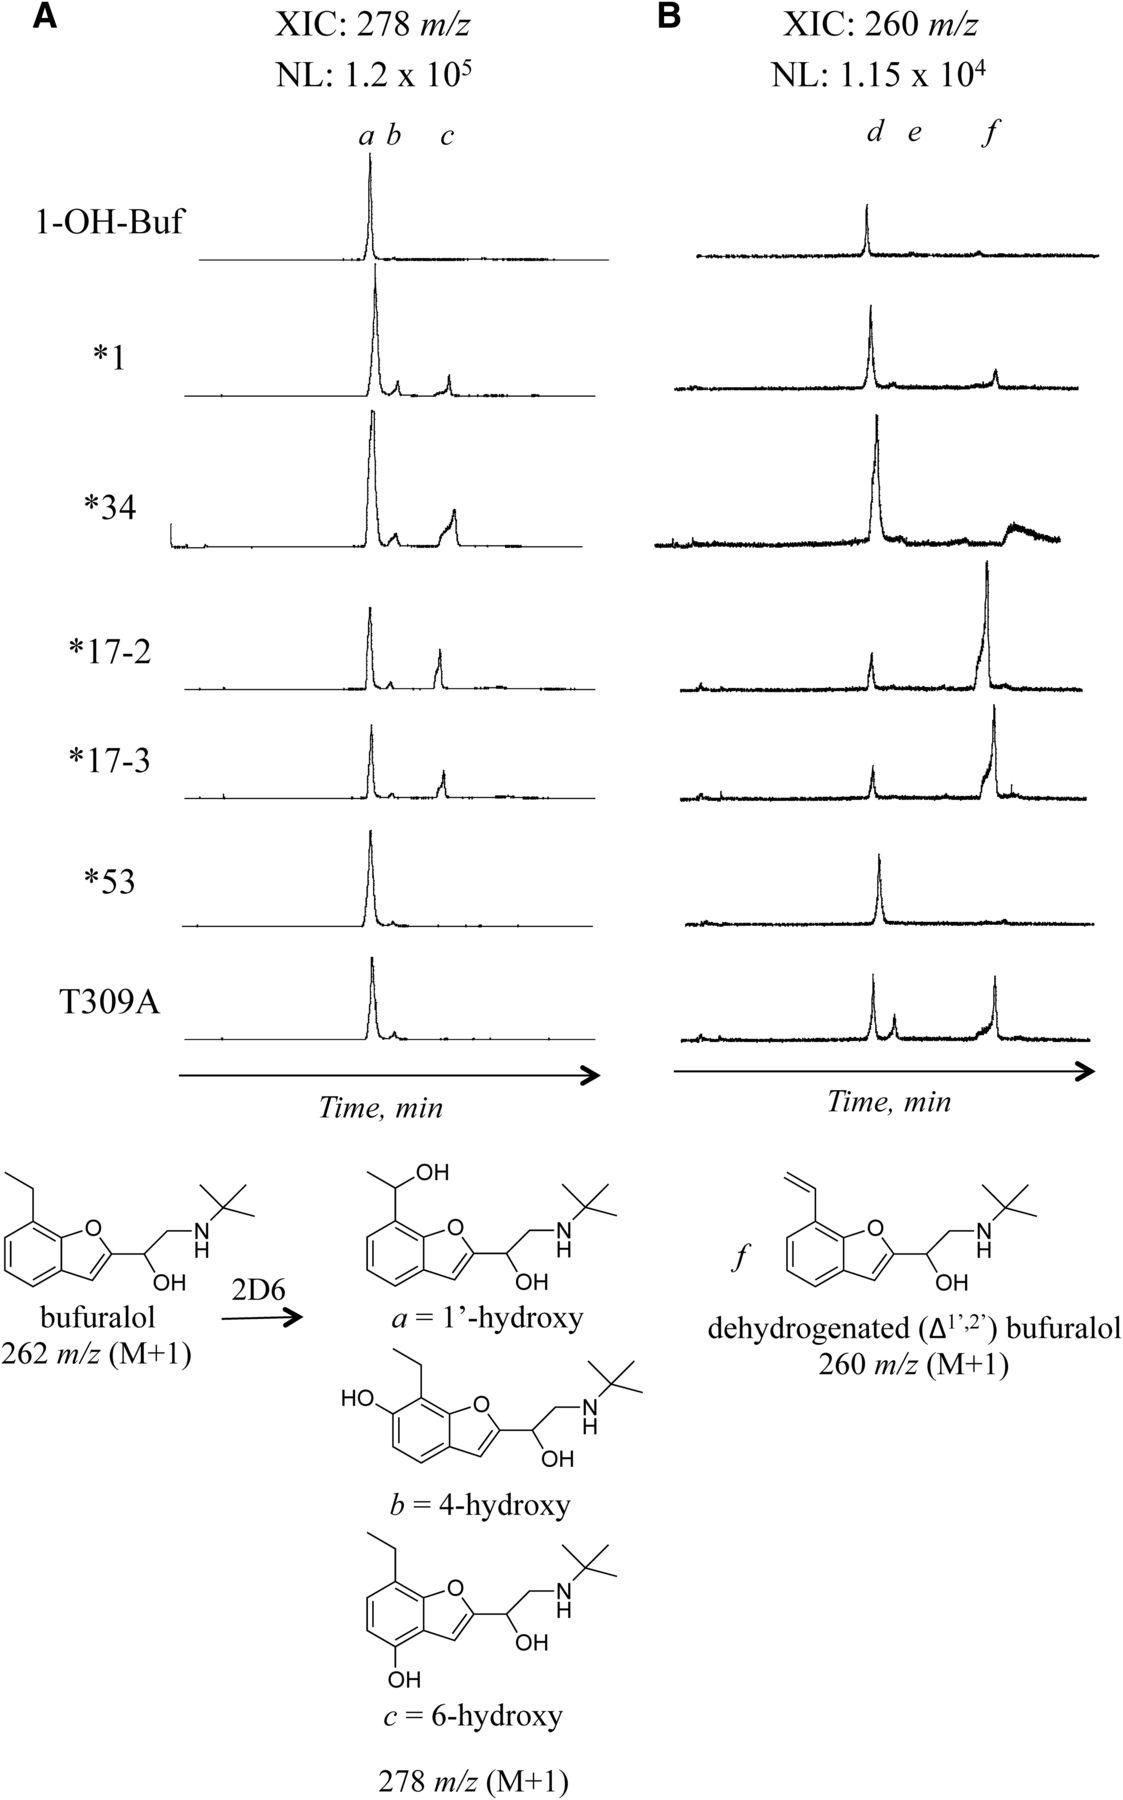
Extracted ion chromatograms of bufuralol metabolites formed by purified CYP2D6 enzymes in the presence of NADPH-generating system. (A) Extracted ion chromatograms for hydroxybufuralol (278 m/z, M + H). 1′-Hydroxy-, 4-hydroxy-, and 6-hydroxybufuralol eluted at 25, 28, and 35 minutes (a, b, and c), respectively, with 1′-hydroxybufuralol (a) as the major metabolite in reactions with NADPH. The chromatograms were converted to the same scale with a normalized level of 1.2 × 10⁵. (B) Extracted ion chromatograms for dehydrogenated (Δ1’,2’) bufuralol (260 m/z, M + H) eluting at 41 minutes (f). The peak at 25 minutes (d) was a contaminant present in the standard. Also, an additional metabolite was formed by the Thr309Ala mutant and eluted at 28 minutes (e) (see Supplemental Fig. 3 for MS). The chromatograms were converted to the same scale, with a normalized level of 1.15 × 10⁴, an order of magnitude less than the 278 m/z XIC in (A).
With the more rigid substrate dextromethorphan (272 m/z), all variants produced the expected dextrorphan metabolite (labeled a at 6 minutes with 258 m/z) (Fig. 4A); however, a more abundant 258 m/z peak in reactions with Thr309Ala appeared at a later retention time (22 minutes, labeled b) and had a mass spectrum and retention time consistent with the formation of 3-methoxymorphinan (N-demethylation; Fig. 4A). Some 3-methoxymorphinan (labeled b) was formed by all the variants, but it was greatest with the Thr309Ala mutant. All the variants also produced some low levels of 3-hydroxymorphinan (both O- and N-demethylation, labeled c), although *17-2 and *17-3 produced levels at the limit of detection (Fig. 4B).

Extracted ion chromatograms of dextromethorphan metabolites formed by purified CYP2D6 enzymes in presence of an NADPH-generating system. (A) Extracted ion chromatograms for dextrorphan eluting at 6 minutes and 3-methoxymorphinan at 22 minutes (258 m/z, M + H) (a and b, respectively). Chromatograms were converted to the same scale with a normalized level of 8 × 10⁴. (B) Extracted ion chromatograms for 3-hydroxymorphinan (c) (244 m/z, M + H). Chromatograms were converted to the same scale with a normalized level of 2 × 10³. (C) Extracted ion chromatograms for mono-oxygenated dextromethorphan (288 m/z, M + H). CYP2D6*53 formed hydroxylated dextromethorphan products eluting at 5.6 and 7.5 minutes (d and e) (see Supplemental Fig. 4 for MS). All CYP2D6 enzymes formed some N-oxide at 33 minutes (h), with Thr309Ala producing the highest levels. All chromatograms were converted to the same scale with a normalized level of 2.6 × 10⁴.
Mono-oxygenated dextromethorphan products (288 m/z) were detected in assays with the variants with the most notable peaks in reactions with *53 and the Thr309Ala mutant (Fig. 4C). With *53, there were two mono-oxygenation peaks eluting at ∼5.5 and ∼7.5 minutes (labeled d and e). One of the mono-oxygenation peaks is likely a 7-hydroxylation product that was observed by Flanagan et al. (2004) with a Phe120Val mutant. The other mono-oxygenation peak showed the same fragmentation pattern upon MSn analysis and, based on MS2, might represent a hydroxylation at the neighboring carbon-6 position (Supplemental Fig. 4). In addition, all variants, but particularly the Thr309Ala mutant, produced a 288 m/z product with a much later retention time (∼33 minutes, labeled h) (Fig. 4C). The CID for the later peak showed a 272 m/z fragment consistent with loss of an oxygen. Furthermore, upon treatment with TiCl3, the peak was no longer detectable, supporting the designation of the metabolite as an N-oxide (data not shown). The levels of the mono-oxygenation peaks formed by *53 and the Thr309Ala mutant are similar to those of dextrorphan and explain why the Michaelis-Menten analysis with dextromethorphan as substrate produces lower enzyme efficiency than with bufuralol since only the dextrorphan metabolite was quantitated in the Michaelis-Menten analysis. Peaks labeled f and g were not identified; peak g was only seen in reactions with the Thr309Ala mutant (Fig. 4C).
When CuOOH was used to support the metabolism of bufuralol, only the 1′-hydroxybufuralol peak was detected among the hydroxlated bufuralol products (Supplemental Fig. 5). Conversely, dehydrogenated (Δ1′,2′) bufuralol (labeled f) was retained in reactions with CuOOH and, for *1, *34, and *53, higher levels of the dehydrogenated product were observed than in reactions with NADPH (Supplemental Fig. 5). In reactions with dextromethorphan and CuOOH as an oxygen surrogate, dextrorphan was the only observed major metabolite (Supplemental Fig. 6). In addition, we observed decreased enzyme activity in reactions with CuOOH (data not shown), consistent with inactivation of CYP2D6 by CuOOH, as has been reported with other P450s such as 2B1, 3A4, 1A1, and so forth (Yao et al., 1993; Yu et al., 1996; He et al., 1998).
Coupling of NADPH Consumption to Substrate Metabolism.
Since differences in Michaelis-Menten kinetics and enzyme efficiencies for the CYP2D6 variants may be due at least partially to differences in the ability of the variants to pass electrons from the reductase to the active site of 2D6, a set of NADPH-metabolite coupling experiments with all variants were completed using bufuralol as substrate. Bufuralol was chosen for the experiments with all variants because of the negligible levels of competing products formed; that is, 1′- hydroxybufuralol was the major metabolite formed by all the variants and therefore readily quantitated in relationship to NADPH consumption (vs. dextromethorphan products were quite different among the variants).
The rate of NADPH consumption with bufuralol as substrate ranged from ∼7.5 to 31.6 minutes−1 and the rate of metabolite formation from ∼0.50 to 5.2 minutes−1 with the overall percent coupling from ∼4% to 18% (Table 3). *53 and *1 demonstrated similar coupling of ∼17%–18%. Although the Thr309Ala mutant produced the same amount of product as *1, the rate of NADPH consumption was approximately quadruple that of *1, leading to a much lower coupling at only ∼4.5%, lower than that of *34 and *17-3, variants that displayed much lower enzyme activity than the Thr309Ala mutant in Michaelis-Menten analysis (Fig. 2).
Estimation of coupling of NADPH consumption to product formation
Since Michaelis-Menten analysis showed a greater vmax for *34, *17-2, and *17-3 when dextromethorphan was used as the substrate versus bufuralol, NADPH coupling experiments were also completed for these variants with dextromethorphan as substrate. NADPH coupling was similar for dextromethorphan metabolism, as it was for bufuralol metabolism by these variants (Table 3). No difference was found in NADPH coupling in reactions with dextromethorphan at 100 µM versus 600 µM (data not shown).
Spectral Binding with SCH 66712.
SCH 66712 displayed type 1 substrate binding upon titration with all the purified CYP2D6 enzymes in this study (Supplemental Fig. 7). Fit of the binding data for *1 with the quadratic equation yielded a Ks of 35 ± 8 µM (Supplemental Fig. 7). Fits for all CYP2D6 enzymes in this study yielded similar Ks values between 15 and 60 µM (Table 4).
Spectral binding constants for SCH 66712 with CYP2D6 enzymes
All enzymes displayed type 1 spectral binding as shown in Supplemental Fig. 2.
Inactivation of CYP2D6 Enzymes by SCH 66712.
We have previously shown potent inactivation by SCH 66712 of CYP2D6 in Supersomes (Nagy et al., 2011). In the present study, we examined the susceptibility to time- and concentration-dependent inactivation of purified, recombinant CYP2D6 variants by SCH 66712 using Kitz-Wilson analysis with either bufuralol or dextromethorphan as reporter substrates (Fig. 5; Supplemental Fig. 8; Table 5).

Kitz-Wilson analysis of inactivation of purified CYP2D6 enzymes *1, *34, *53, and Thr309Ala by SCH 66712 (0, 4, 8, 16, 32, and 48 µM). Bufuralol was used as the reporter substrate. (A) Inactivation of *1. (B) KI and kinact for the inactivation of *1 by SCH 66712 were 10 ± 3 µM and 0.14 ± 0.01 minute−1, respectively, as determined using Kitz-Wilson analysis and nonlinear regression. (C) Inactivation of *34. (D) KI and kinact for the inactivation of *34 by SCH 66712 were 6.6 ± 0.9 µM and 0.096 ± 0.004 minute−1, respectively. (E) Inactivation of *53. (F) KI and kinact for the inactivation of *53 by SCH 66712 were 5.7 ± 0.9 µM and 0.074 ± 0.003 minute−1, respectively. (G) Inactivation of Thr309Ala by SCH 66712. (H) KI and kinact for the inactivation of Thr309Ala by SCH 66712 were 1.0 ± 0.4 µM and 0.042 ± 0.004 minute−1, respectively. Results are summarized in Table 5.
Kinetic constants for inactivation of purified CYP2D6 enzymes by SCH 66712 using bufuralol or dextromethorphan as reporter substrate
All experiments were done in triplicate.
With bufuralol as reporter substrate, purified, recombinant *1 showed a kinact of 0.14 ± 0.01 minute−1 and KI of 10 ± 3 µM. For the allelic variant *34, the inactivation kinetics were similar to *1, with a kinact of 0.096 ± 0.004 minute−1 and KI of 6.6 ± 0.9 µM (Fig. 5; Table 5). Results from inactivation assays with dextromethorphan as reporter substrate were comparable (Supplemental Fig. 8; Table 5). The activity of allelic variants *17-2 and *17-3 was too low for reliable measurement of inactivation kinetics.
The allelic variant *53 showed much greater enzyme activity and product formation than *1 in Michaelis-Menten analysis with both bufuralol and dextromethorphan; however, in Kitz-Wilson analysis *53 was less susceptible to inactivation. In assays with bufuralol as substrate, kinact was 0.074 ± 0.003 minute−1 and KI was 5.7 ± 0.9 µM (Fig. 5; Table 5). With dextromethorphan as substrate, the kinact was 0.05 ± 0.02 minute−1 and KI was ∼3 µM. Accurate measurement of KI was more difficult because of low levels of inactivation (Table 5).
The kinact and KI values from Kitz-Wilson analysis of the Thr309Ala mutant were 0.042 ± 0.004 minute−1 and 1.0 ± 0.4 µM, respectively, with bufuralol as substrate and 0.034 ± 0.002 minute−1 and 1.7 ± 0.5 µM, respectively, with dextromethorphan as substrate (Table 5). Although the rates of inactivation, kinact, for the Thr309Ala mutant were lower than for *1 and *53, the lower KI values resulted in little change in overall inactivation (kinact/KI). Inclusion of the nucleophilic trapping agents NAC or GSH in inactivation assays did not prevent or reduce the amount of inactivation observed in reporter reactions (data not shown). Furthermore, no NAC or GSH adducts of SCH 66712 or SCH 66712 metabolites were observed in mass spectral analysis (data not shown).
Partition Ratio.
Partition ratio is a measure of the number of turnovers on average an enzyme completes prior to an inactivation reaction that halts the enzyme’s activity. (Silverman, 1988). The lower the partition ratio, the fewer turnovers completed before inactivation. Previously, we showed the partition ratio for *1 in Supersomes to be ∼3 (Nagy et al., 2011). The partition ratio measured for purified, recombinant *1 in the current study was ∼3, and the partition ratio for *53 was ∼24, as estimated from the intercept of the linear regression line obtained from the lower ratios of SCH 66712 to CYP2D6 and the line obtained from higher ratios of SCH 66712 to CYP2D6 for each enzyme inactivation assay (Fig. 6). With the Thr309Ala mutant, a partition ratio could not be determined owing to the low rate of inactivation (no more than 20%–40% loss of activity in reactions with up to 150 µM SCH 66712 and in incubations for 60 minutes) (data not shown).
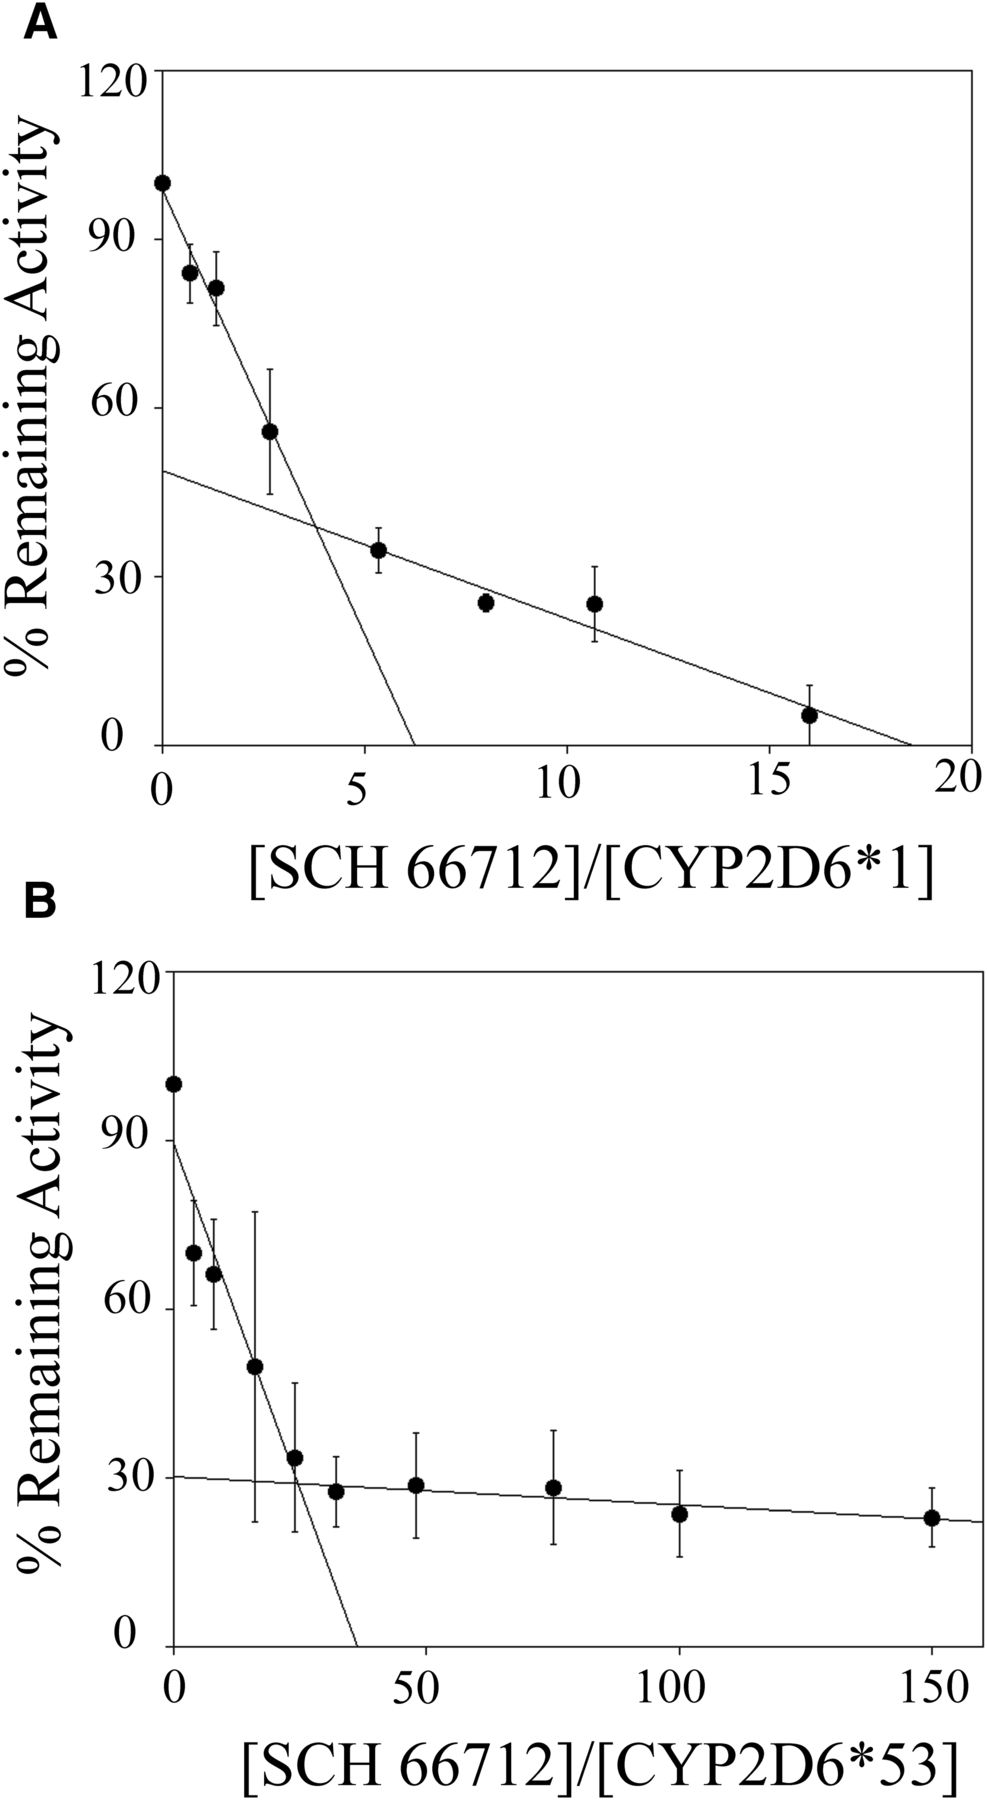
Partition ratio for SCH 66712 inactivation of purified CYP2D6 enzymes *1 and *53. Each enzyme was incubated with varying concentrations of SCH 66712 for 30 minutes to allow for complete inactivation. (A) With *1, the turnover number was ∼4 and the partition ratio was estimated to be ∼3 as previously reported in Supersomes (Nagy et al., 2011). (B) With *53, the turnover number was ∼25, and the partition ratio was estimated to be ∼24.
Metabolites of SCH 66712.
We previously reported the metabolites of SCH 66712 formed by P450s 2D6, 2C9, 2C19, and 3A4 (Nagy et al., 2011). In similar metabolism experiments with CYP2D6 allelic variants in this study, mono-oxygenation of SCH 66712 at two different positions was apparent by the presence of four distinct m/z 355 ions in the mass spectral analysis (M + 1) as seen previously with other P450s (Supplemental Fig. 9). The *53 variant and the Thr309Ala mutant produced more of the first eluting peak, which corresponds to the SCH 66712 metabolite with mono-oxygenation on the phenyl ring [Supplemental Fig. 9, peak a, and (Nagy et al., 2011; Bolles et al., 2014)]. No other metabolites, such as dehydrogenation or dealkylation, were observed. When CuOOH was used as oxygen surrogate, only the *53 variant and the Thr309Ala mutant retained formation of the first mono-oxygenation product (mono-oxygenation on the phenyl ring of SCH 66712, labeled a) (Supplemental Fig. 9).
Digestion and Mass Spectral Analysis of Adducted CYP2D6 *1.
In whole-protein mass analysis of *53 and the Thr309Ala mutant after incubation with SCH 66712 and NADPH, evidence for adducted whole protein was not observed (data not shown). We have previously observed in mass spectral analysis whole-protein adduction of CYP3A4 and CYP2D6 by SCH 66712 (Bolles et al., 2014), and we have postulated that Thr309 of CYP2D6 might be the site of inactivation by SCH 66712.
To investigate the role of Thr309 in inactivation of *1 by SCH 66712, inactivated *1 was purified by gel, digested with chymotrypsin and/or trypsin, and resulting peptides analyzed by mass spectrometry (n = 5). Protein sequence coverage in all analyses varied from 50% to 90%. Although there was some supporting evidence for adduction in the peptide fragment 304SAGMVTTSTTLAW316 that contains Thr309, the results were not conclusive (data not shown).
Discussion
The activity of CYP2D6 (*34, *17-2, *17-3, and *53), as well as reference CYP2D6 (*1) and an active site mutant of *1 (Thr309Ala), were characterized by Michaelis-Menten analysis (Fig. 2; Table 2). As in previous in vitro studies (Oscarson et al., 1997; Marcucci et al., 2002; Yu et al., 2002; Shen et al., 2007; Sridar et al., 2011; Kim et al., 2013), the *34, *17-2, and *17-3 all displayed decreased enzyme efficiency in comparison with *1. The Km values determined by Michaelis-Menten analysis were much higher for dextromethorphan than for bufuralol with all the enzymes; it has been suggested that the rigidity of dextromethorphan contributes to this effect when Phe120 is mutated (Flanagan et al., 2004). Indeed, in substrate depletion analysis the Km with dextromethorphan as substrate remains high for *53 that lacks Phe120 but lower for *1 and the Thr309Ala mutant metabolism of dextromethorphan.
The *53 variant had a higher enzyme efficiency compared with *1 with both dextromethorphan (154% of *1) and bufuralol (778% of *1) as substrate. Other groups have observed similar kinetic effects with *53 (Sakuyama et al., 2008; Muroi et al., 2014) and with Phe120Ala mutants (Flanagan et al., 2004; Keizers et al., 2004). The percent enzyme efficiency of dextromethorphan metabolism by *53 was much lower than that of bufuralol, partially owing to the fact that the analysis accounted only for dextrorphan product formation, although *53 produces additional hydroxylated metabolites (Fig. 4). Estimation of Km for *53 metabolism of dextromethorphan by substrate depletion methods yielded a Km value similar to that determined by traditional methods and higher than Km for *1 and the Thr309Ala mutant (Supplemental Fig. 2; Table 2). These findings demonstrate the importance of Phe120 for determining substrate orientation and product regioselectivity. In docking experiments with dextromethorphan and *1 and *53 models, Phe120 provides pi-pi stacking interactions with the aromatic ring of dextromethorphan in an orientation consistent with O-demethylation in *1; however, that favorable interaction is missing in *53 (Supplemental Fig. 10).
Although *53 produced much greater amounts of product over time than *1, *53 had approximately the same coupling of NADPH consumption to product formation as *1 (Tables 2 and 3). The amino acid changes in *53 are along substrate access/egress channel 2c [nomenclature of (Cojocaru et al., 2007)]. The smaller size of isoleucine compared with phenylalanine at position 120 and the greater polarity of serine compared with alanine at position 122 may facilitate metabolite egress and contribute to more rapid turnovers of the *53 enzyme. Previous molecular dynamics simulations by our group showed that *53 had more open egress and access channels in time evolution studies; it may be that faster egress and access supports higher metabolic rates and greater degrees of freedom for substrate interaction with the heme (de Waal et al., 2014).
The Thr309Ala active site mutant displayed similar kinetic values as *1 with bufuralol as a substrate. With dextromethorphan as substrate, greater differences in Km and vmax were noted using traditional Michaelis-Menten analysis, in part owing to additional metabolites formed by the mutant. By substrate depletion methods, the Km values for metabolism of dextromethorphan by *1 and the mutant were similar (Supplemental Fig. 2). NADPH coupling studies revealed that whereas the Thr309Ala mutant had rates of product formation similar to *1, it consumed ∼four times as much NADPH in the process (Table 3). Thr309, or the conserved equivalent in other P450s, has been shown to be involved in dioxygen activation to form the oxyenoid species (compound I) by proton relay (Keizers et al., 2004, 2005b; Zhang et al., 2011). Our results support previous findings that Thr309 is important for product regio-selectivity and oxygenation mechanisms.
All three lower activity variants (*34, *17-2, and *17-3) have the Arg296Cys amino acid change. Arg296 is located on the N-terminal end of helix I and points outward to the surface of CYP2D6 along channel 2c. Arg296 is mutated to cysteine in more than 30 allelic variants of CYP2D6, usually in combination with other mutations. To our knowledge, there are no identified roles of Arg296 in the mechanism of CYP2D6. It is possible that Arg296 may be involved with binding reductase and coupling product formation to NADPH consumption. *34, *17-2, and *17-3 all displayed lower NADPH coupling than *1, which might explain, in part, the decreased activity of theses variants, especially for *34. *17-2 and *17-3, unlike *34, both displayed increased P420 and a lack of stability during purification that likely contributed more significantly to their reduced activity.
Given the differences in metabolite formation and enzyme kinetics with bufuralol and dextromethorphan, we analyzed the interaction of the variants with the known potent inactivator, SCH 66712 (Nagy et al., 2011). Results of spectral binding suggest that SCH 66712’s ability to act as a substrate was not impacted by any particular amino acid changes in the allelic variants (Table 4). We also observed that all the CYP2D6 variants in this study produced the same mono-oxygenated metabolites of SCH 66712 as shown previously with *1 and with CYP3A4 (Nagy et al., 2011; Bolles et al., 2014).
Because of the increased activity of *53, we initially thought the *53 variant would be more susceptible to mechanism-based inactivation by SCH 66712; however, this was not the case (Figs. 5 and 6). It is possible that *53 could be adducted in reactions with SCH 66712 but that replacement of Phe120 by Ile allows substrates to still access and egress from the active site even with SCH 66712 bound; however, no protein adduct was observed in whole protein mass spectrometry with *53. Alternatively, the reactive metabolite may be able to move out of the active site without adducting the enzyme. Since the Phe120 has been shown to control orientation of aromatic rings in substrates (Keizers et al., 2004), it is also possible that in *53 the SCH 66712 can no longer readily take the orientation that allows for the production or reaction of the reactive electrophile.
Inactivation constants for *34 were similar to those for *1 (Table 5), and the values for inactivation constants were similar to those reported previously for CYP2D6 in human liver microsomes and Supersomes with dextromethorphan as reporter substrate (Palamanda et al., 2001). Both *53 and the Thr309Ala mutants displayed reduced rates of inactivation, although the Thr309Ala mutant had overall inactivation (kinact/KI) similar to that of *1 (Fig. 5; Supplemental Fig. 8; Table 5). The observed inactivation with the Thr309Ala mutant may be the result of excessive production of H2O2 by the mutant owing to lowered coupling of NADPH consumption to product formation. Similar effects have been reported in the literature for analogous threonine mutants (e.g., Thr252 of P450cam and others) (Martinis et al., 1989; Yeom et al., 1995). Also, CYP2D6 (and other P450s) have been shown to be sensitive to H2O2-mediated oxidation and inactivation (Vaz et al., 1996; Albertolle et al., 2018). Our group has also observed that CYP2D6 is sensitive to inactivation by CuOOH. In fact, we had hoped to determine whether CuOOH could modulate SCH 66712 inactivation and possible formation of reactive electrophiles, but inactivation by CuOOH in the absence of SCH 66712 was too great to allow for meaningful analysis (unpublished observations). To address inactivation further, both whole-protein mass spectrometry and proteomic analysis with the Thr309Ala mutant and the *53 variant were attempted; however, interpretation was complicated because after the reaction of enzyme with NADPH, ionization of CYP2D6 decreased and spectral noise increased, consistent with protein adduction (data not shown).
We previously suggested that the reactive electrophile for inactivation of CYP2D6 by SCH 66712 could be a quinone resulting from mono-oxygenation of SCH 66712 (+354 amu) (Nagy et al., 2011). A quinone would be a soft electrophile, whereas a secondary alcohol such as on Thr309 would be a hard nucleophile, making this combination less likely; however, we have also observed in our MSn data of metabolites the formation of a carbinolamine (hydroxylation on one of the carbons of the piperazine ring, peak d in Supplemental Fig. 9) that could allow for ring opening to an aldehyde that could serve as a reactive electrophile or reduce to an alcohol (with the ring open). The aldehyde would be a hard electrophile and therefore might be more likely to interact with the secondary alcohol of Thr309.
Findings in the present study further support the idea that substrate interactions with the enzyme, not just the ability of the enzyme to make/break chemical bonds, influence metabolite formation and inactivation, as proposed by others (Vandenbrink et al., 2012), and that allelic variants can alter access channels and active site architecture (Maekawa et al., 2017). In conclusion, the examination of naturally occurring allelic variants of CYP2D6 allows for analysis of the structure and function of CYP2D6 and understanding mechanism and drug metabolism profiles.
Acknowledgments
We thank Dr. F. P. Guengerich, Dr. P. Hollenberg, Dr. H. Zhang, Dr. I. Denisov, Dr. S. Sligar, and Dr. A. Venter for helpful comments; Greg Cavey, Dr. Samuel Mackintosh, and Dr. Alan Tackett for proteomic analysis of CYP2D6; and Dr. Mark Hail of Novatia for assistance with ProMass software.
Authorship Contributions
Participated in research design: Glass, Hicks, Osorio-Vasquez, Fujiwara, Furge.
Conducted experiments: Glass, Osorio-Vasquez, Cho, Oswalt, Mills, Hicks, Fujiwara, Glista, Martell, Kamath, Furge.
Performed data analysis: Glass, Osorio-Vasquez, Cho, Hicks, Oswalt, Fujiwara, Glista, Martell, Kamath, Furge.
Wrote or contributed to the writing of the manuscript: Glass, Osorio-Vasquez, Cho, Oswalt, Martell, Furge.
Footnotes
- Received December 15, 2017.
- Accepted May 9, 2018.
This work was supported by the National Institutes of Health (L.L.F.) [Grant 1R15GM086767-02, -03 and -02S1]; a grant to Kalamazoo College from the Howard Hughes Medical Institute [52006304] through the Precollege and Undergraduate Science Education Program; and the Cook, Kaufmann, Hutchcroft, and Varney Funds of Kalamazoo College.
This work was presented in part at the American Society for Biochemistry and Molecular Biology annual meeting, 2016, San Diego, CA, and 2017, Chicago, IL, and at the Great Lakes Drug Metabolism and Disposition Meeting, 2017, Kalamazoo, MI.
↵
 This article has supplemental material available at dmd.aspetjournals.org.

Abbreviations
- CID
- collision-induced dissociation
- CuOOH
- cumene hydroperoxide
- ESI
- electrospray ionization
- GSH
- glutathione
- HPLC
- high-performance liquid chromatography
- LC
- liquid chromatography
- MBI
- mechanism-based inactivator
- MS
- mass spectrometry
- m/z
- mass to charge ratio
- NAC
- N-acetyl cysteine
- P450
- cytochrome P450 enzyme
- SCH 66712
- 5-fluoro-2-[4-[(2-phenyl-1H-imidazol-5-yl)methyl]-1-piperazinyl]pyrimidine
- XIC
- extracted ion chromatogram
- Copyright © 2018 by The American Society for Pharmacology and Experimental Therapeutics


