


Abstract
For successful in vitro-to-in vivo extrapolation of hepatic drug uptake and drug-drug interactions (DDI), it is important to characterize the kinetic properties of the individual transporters involved, their fraction (ft) contribution to hepatic uptake, and their selective inhibitors. Here, we characterized the in vitro transport kinetics of two model drugs, rosuvastatin (RSV) and olmesartan acid (OLM), by rat hepatic organic anion transporting polypeptides (Oatp1a1, 1a4, and 1b2) and identified selective inhibitors of these transporters. [3H]-RSV was transported by Oatp1a1, 1a4, and 1b2, and their Michaelis-Menten constant (Km) values were estimated to be 9.61, 67.2, and 28.1 µM, respectively. In contrast, [3H]-OLM was transported by only Oatp1b2 (Km: 72.8 µM). Digoxin (IC50: 0.107 µM) and rifamycin SV (IC50: 0.140 and 0.088 µM for RSV and OLM, respectively) were potent and selective inhibitors of Oatp1a4 and 1b2, respectively, and glyburide (100 µM) completely inhibited all three rat hepatic Oatps. These inhibitors can therefore be used alone and in combination to determine the contribution of each Oatp to hepatic influx. In addition, the magnitude of in vivo inhibition of sinusoidal uptake clearance of RSV by rifampin was well predicted using rifampin IC50 profiles for each Oatps and RSV ft by each Oatp. This is the first report to 1) detail the transport kinetics of RSV and OLM by rat hepatic Oatps, 2) identify selective inhibitor concentrations of rat Oatps, and 3) demonstrate successful prediction of the magnitude of transporter-mediated in vivo DDI from IC50 profiles of an inhibitor and ft of a drug by each transporter.
Introduction
The rat is commonly used as a preclinical species in drug development and pharmacokinetics and toxicity studies. In addition, the rat is often used when conducting proof of concept or mechanistic pharmacokinetic studies. For example, we have recently shown that the in vivo hepatobiliary clearances and hepatic concentrations of rosuvastatin (RSV) in rats can be predicted using transporter-expressing cells and sandwich-cultured rat hepatocytes (Ishida et al., 2018). However, to correctly interpret and extrapolate the hepatic clearance obtained from in vitro systems to in vivo, it is important to have detailed characterization of transport kinetics (e.g., the Michaelis-Menten constant, Km) of rat hepatic organic anion transporting polypeptides (Oatp1a1, 1a4, and 1b2) and their relative contribution to hepatic drug uptake using methods employing selective inhibition or in vitro-to-in vivo scaling of transporter-mediated clearance using quantitative proteomics.
Although this approach is well established when determining the cytochrome P450–mediated fraction metabolized, due to the lack of selective inhibitors of transporters this approach has had limited success in determining the fraction transported (ft) by hepatic transporters. To this end, we characterized rat hepatic Oatp transport kinetics of two model drugs—RSV and olmesartan acid (OLM)—and identified selective inhibitors of rat Oatps that can be used to quantify the contribution of each rat hepatic Oatp toward overall Oatp-mediated hepatic uptake. In addition, we assessed whether the in vivo inhibition of RSV hepatic uptake clearance by rifampin (a known inhibitor of rat Oatp), determined in our positron emission tomography (PET) imaging study (He et al., 2014), could be predicted from in vitro Oatp inhibition profiles—the half-maximal inhibitory concentrations (IC50) profiles—of rifampin and the ft of RSV by the various Oatps estimated using quantitative proteomics.
Materials and Methods
Materials.
RSV was purchased from Cayman Chemicals (Ann Arbor, MI). OLM was kindly provided from Daiichi-Sankyo (Tokyo, Japan). [3H]-RSV sodium salt (20 mCi/mmol, radiochemical purity 99%), [3H]-OLM (10 mCi/mmol, radiochemical purity 99%), [3H]-estradiol 17β-d-glucuronide (E17βG) (50 mCi/mmol, radiochemical purity 99%), and [3H]-taurocholic acid (TCA) (10 mCi/mmol, radiochemical purity 99%) were purchased from American Radiolabeled Chemicals (St. Louis, MO). Rifampin, rifamycin SV sodium salt, ibuprofen, indomethacin, sulfobromophthalein (BSP) disodium salt, quinidine hydrochloride monohydrate, quinine hydrochloride dihydrate, glycyrrhizic acid, enalapril, and fexofenadine hydrochloride were purchased from Sigma-Aldrich (St. Louis, MO). Celiprolol hydrochloride and cyclosporin A were purchased from Toronto Research Chemicals (Toronto, ON, Canada). Digoxin was purchased from Tokyo Kasei America (Portland, OR). Glyburide was purchased from Calbiochem (La Jolla, CA). All other chemicals were of reagent or analytic grade and were purchased from other commercial suppliers.
RSV and OLM Uptake into Ntcp- and Oatp-Expressing Cells.
Chinese hamster ovary-Na+-taurocholate cotransporting polypeptide (CHO-Ntcp), CHO-Oatp1a1, human embryonic kidney 293 (HEK293)-Oatp1a4, HEK293-Oatp1b2, and their corresponding mock-transfected cells were a gift from SOLVO Biotechnology (Budaörs, Hungary). CHO-Ntcp, CHO-Oatp1a1, and CHO-mock cells, grown in 75 cm2 flasks, were harvested using trypsin and were plated at a density of 0.5 × 10⁶ cells/well in 24-well plates. These cells were incubated with 5 mM sodium butyrate for approximately 24 hours before conducting the transport experiments. HEK293-Oatp1a4, HEK293-Oatp1b2, and HEK293-mock cells, grown in 75 cm2 flask with 3 µg/ml puromycin, were harvested using trypsin and plated at a density of 0.5 × 10⁶ cells/well in 24-well poly-d-lysine coated plates. These cells were also incubated with 3 µg/ml of puromycin for 24 hours before conducting the transport experiments.
The cells were washed 3 times with prewarmed Krebs-Henseleit (KH) buffer then preincubated (at 37°C for 10 minutes) with the KH buffer in the absence or presence of the chosen inhibitor. After preincubation, the cells were incubated (at 37°C for 5–120 seconds) with 500 µl of 0.01–1000 µM RSV (containing 0.2 µCi/well [3H]-RSV) or OLM (containing 0.2 µCi/well [3H]-OLM) with or without the chosen inhibitor. The KH buffer containing the drug was aspirated, and the cells were washed 3 times with ice-cold KH buffer, and then 1 ml of 2% SDS was added to lyse the cells.
The total radioactivity in the samples was measured using a liquid scintillation counter (Perkin Elmer, Waltham, MA). The total protein concentration of cell lysate was measured with the Pierce BCA Protein Assay Kit (Pierce Biotechnology, Rockford, IL), according to the manufacturer’s instructions. As a positive control, the uptake of TCA (for Ntcp, 0.5 µM TCA containing 0.2 µCi/well [3H]-TCA) in the presence and absence of the extracellular Na+ or the uptake of E17βG (for Oatp, 0.5 µM E17βG containing 0.2 µCi/well [3H]-E17βG) in the absence and presence of 100 µM rifamycin SV was also determined.
Estimation of Km and Vmax of RSV and OLM.
The Km, the maximum velocity (Vmax), and the diffusion rate constant (Kd) were estimated using the nonlinear regression package Phoenix (Certara, Princeton, NJ). The following equations were simultaneously fitted to the data (Malo and Berteloot, 1991; Chenu and Berteloot, 1993; Endres et al., 2009): (1)
(1) (2)where vOatp and vmock are the uptake rate of the drug into Oatp-expressing cells and mock-transfected cells, respectively. Scold and T are the concentration of unlabeled and labeled drug, respectively. H is the Hill coefficient.
Estimation of IC50 of Inhibitors.
The IC50 of several drugs toward RSV or OLM uptake was estimated using the nonlinear regression package Phoenix (Certara). The following equations were simultaneously fitted to the data: (3)
(3) (4)where Max and Min are the maximum (fixed at 100%, i.e., uptake in the absence of the inhibitor) and minimum uptake (uptake in mock cells or when the inhibitor concentration greatly exceeds IC50, expressed as % of Max) of the drug, respectively. [I] and H are the inhibitor concentration and Hill coefficient, respectively.
Prediction of the Inhibitory Effect of Rifampin on In Vivo Sinusoidal Uptake Clearance of RSV in the Rat Liver.
The in vivo sinusoidal uptake clearance (CL) of RSV in the presence of rifampin ( ) at the steady-state plasma rifampin concentration observed in our PET imaging study (9.4 µM) was estimated as follows:
 (5)where
  is the in vivo predicted sinusoidal uptake clearance of RSV in the rat liver by each Oatp. That is, the predicted in vivo uptake clearance was obtained by the summation of the intrinsic in vitro uptake clearance of RSV (by Oatp1a1, 1a4, and 1b2) scaled up to in vivo value using the abundance of each Oatp in the Oatp-expressing cell line and in vivo (in the rat liver) (data obtained from Wang et al., 2015; Ishida et al., 2018).
  is the passive diffusion clearance of RSV estimated from HEK293-mock cells (the mean Kd value in the present study). The “% Remaining activity” of each Oatp in the presence of 9.4 µM rifampin was calculated from the IC50 profiles (see Fig. 4) and the following equation:
 (6)where
  is the RSV uptake into the Oatp-expressing cells in the absence of rifampin and was fixed as 100%. The Uptakemock is the RSV uptake (% of max) into the mock-transfected cells, and
  is the RSV uptake (% of max) into the Oatp-expressing cells in the presence of 9.4 µM rifampin.
Statistical Analysis.
The experimental data are shown as the mean ± S.D. The parameters estimated from Phoenix are shown as the mean ± S.E. Statistically significant differences between the various groups were determined by the Welch’s t test (corrected for multiple comparisons).
Results
Time-Dependent Uptake of RSV or OLM into Ntcp- or Oatp-Expressing Cells.
We first evaluated TCA or E17βG uptake into Oatp- or Ntcp-expressing cells and confirmed that these cell lines are functional (Supplemental Fig. 1). Consistent with previous reports (Ho et al., 2006; Ishida et al., 2018), RSV was transported by Oatp1a1, 1a4, and 1b2, but not by Ntcp (Fig. 1). RSV uptake by Oatp1a1 approached a plateau by 15 seconds, whereas that by Oatp1a4 and 1b2 was linear for at least 15 seconds. In contrast, OLM was transported by only Oatp1b2, and this uptake was linear up to at least 30 seconds (Fig. 1). Therefore, in subsequent experiments we evaluated the 5-second (Oatp1a1) and 15-second (Oatp1a4 and 1b2) uptake of RSV or OLM (Oatp1b2 only).
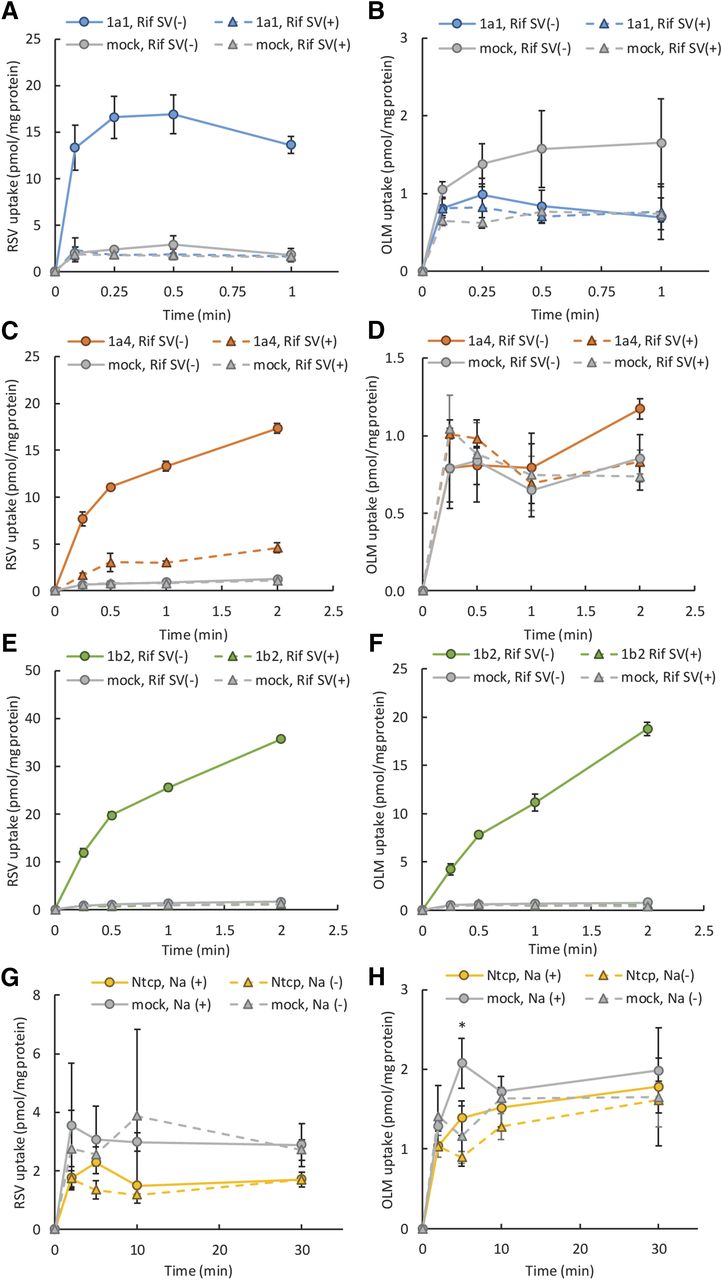
Time course of RSV or OLM uptake into Oatp- or Ntcp-expressing cell lines. The uptake of drugs into Oatp-expressing cells (A–F) was determined in the presence and absence of 100 µM rifamycin SV (Rif SV). The uptake of RSV (G) or OLM (H) into CHO-Ntcp cell lines was evaluated in the presence and absence of extracellular Na+. RSV was transported by Oatp1a1 (A), 1a4 (C), and 1b2 (E) but not by Ntcp (G). In contrast, OLM was transported by only Oatp1b2 (F) but not by Oatp1a1 (B), 1a4 (D) or Ntcp (H). Note the different y-axis scale in each panel. The data represent the mean ± S.D. of triplicates.
Estimation of Kinetics of Uptake of RSV or OLM by CHO-Oatp1a1, HEK293-Oatp1a4, HEK293-Oatp1b2 Cells.
As expected, the uptake of [3H]-RSV and [3H]-OLM was decreased with increasing unlabeled RSV and OLM concentration (representative experiments are shown in Fig. 2). Oatp1a1 transported RSV with higher affinity than Oapt1a4 (Table 1). In addition, Oatp1b2 transported RSV with higher affinity than OLM (Table 1). The Km values obtained informed the RSV and OLM concentrations used in the inhibition experiments described herein. Also, the RSV Km and Vmax values were used to predict the in vivo inhibition of the sinusoidal uptake clearance of the drug by rifampin.

Estimation of kinetics of uptake of RSV (A–C) or OLM (D) by CHO-Oatp1a1, HEK293-Oatp1a4, HEK293-Oatp1b2 or the corresponding mock-transfected cells. Oatp1a1 transported RSV with higher affinity than Oatp1b2 or Oapt1a4 (Table 1). In addition, Oatp1b2 transported RSV with higher affinity than OLM (Table 1). Uptake was conducted in duplicate at all drug concentrations. The predicted lines were obtained by fitting a single binding site Michaelis-Menten model to the uptake data using Phoenix.
Kinetics of uptake of rosuvastatin (RSV) or olmesartan acid (OLM) by the rat hepatic organic anion transporting polypeptides
Each experiment was conducted in duplicate, and parameters were estimated using Phoenix. The values are mean ± S.D. of three independent experiments.
Identification of Selective Inhibitors of RSV, E17βG, or OLM Uptake into Oatp-Expressing Cells.
In an initial screen conducted at a low (10 µM) and high (100 µM) inhibitor concentrations, ibuprofen (100 µM) and OLM (100 µM) appeared to be selective inhibitors of Oatp1b2-mediated RSV uptake (Fig. 3A). On the other hand, digoxin (10 µM) and quinine (10 µM) appeared to be selective inhibitors of Oatp1a4-mediated RSV uptake. Rifampin (10 µM) inhibited Oatp1a4 and 1b2 only whereas rifamycin SV (10 µM) inhibited only Oatp1a1- and 1b2-mediated RSV uptake. Glyburide inhibited all three rat hepatic Oatps (Fig. 3A). BSP also inhibited all three rat hepatic Oatps, but 100 µM BSP did not completely inhibit all rat hepatic Oatps (Fig. 3A). A similar trend was observed of inhibition of Oatp1a1- and 1a4-mediated E17βG uptake (Fig. 3B) or of Oatp1b2-mediated OLM uptake (Fig. 3C), except the E17βG, but not RSV, uptake by Oatp1a1 was inhibited by 10 µM quinine (Fig. 3, A and B).

Effect of various inhibitors (10 or 100 µM) on Oatp-mediated uptake of RSV (A), E17βG (B), or OLM (C). Ibuprofen (100 µM) and olmesartan acid (100 µM) appeared to be selective inhibitors of Oatp1b2. On the other hand, digoxin (10 µM) and quinine (10 µM) appeared to be selective inhibitors of Oatp1a4. Rifampin (10 µM) inhibited only Oatp1a4 and 1b2, whereas rifamycin SV (10 µM) inhibited only Oatp1a1 and 1b2. BSP and glyburide inhibited all three rat hepatic Oatps. The data are mean ± S.D. of triplicates. †P < 0.05; significantly different from the corresponding control (i.e., without the inhibitor). *P < 0.05; significant difference between Oatp1a1 and Oatp1a4. #P < 0.05; significant difference between Oatp1a1 and Oatp1b2. ‡P < 0.05; significant difference between Oatp1a4 and Oatp1b2.
Determination of IC50 of Inhibitors of Rat Hepatic Oatp.
Based on the previous data and to confirm that these compounds were selective inhibitors of the indicated Oatp, we determined their IC50 values using RSV and OLM as substrates. (Fig. 4; Supplemental Fig. 2). While 100 µM rifampin completely inhibited Oatp1a4 and 1b2, at this concentration it also significantly inhibited Oatp1a1 (by about 50%) (Fig. 4, A–D). Rifamycin SV (1 µM) completely inhibited Oatp1b2 but did not inhibit Oatp1a1 or 1a4 (Fig. 4, E–H). Digoxin (100 µM) completely inhibited Oatp1a4 but not Oatp1a1 or 1b2 (Fig. 4, I–L). Ibuprofen (1000 µM) did not inhibit Oatp1a4 but inhibited Oatp1a1 and Oatp1b2 (Supplemental Fig. 2, A–D). Quinine inhibited all Oatps when the concentration of the drug was greater than 20 µM (Supplemental Fig. 2, E–H). Although OLM is a selective substrate of Oatp1b2 (Fig. 1), at 1000 µM it completely inhibited Oatp1b2 and partially inhibited Oatp1a1 but not Oatp1a4 (Supplemental Fig. 2, I–K). BSP inhibited Oatp1a4 less potently than Oatp1a1 or1b2, but inhibited all Oatps at >300 µM (Supplemental Fig. 2, L–O).
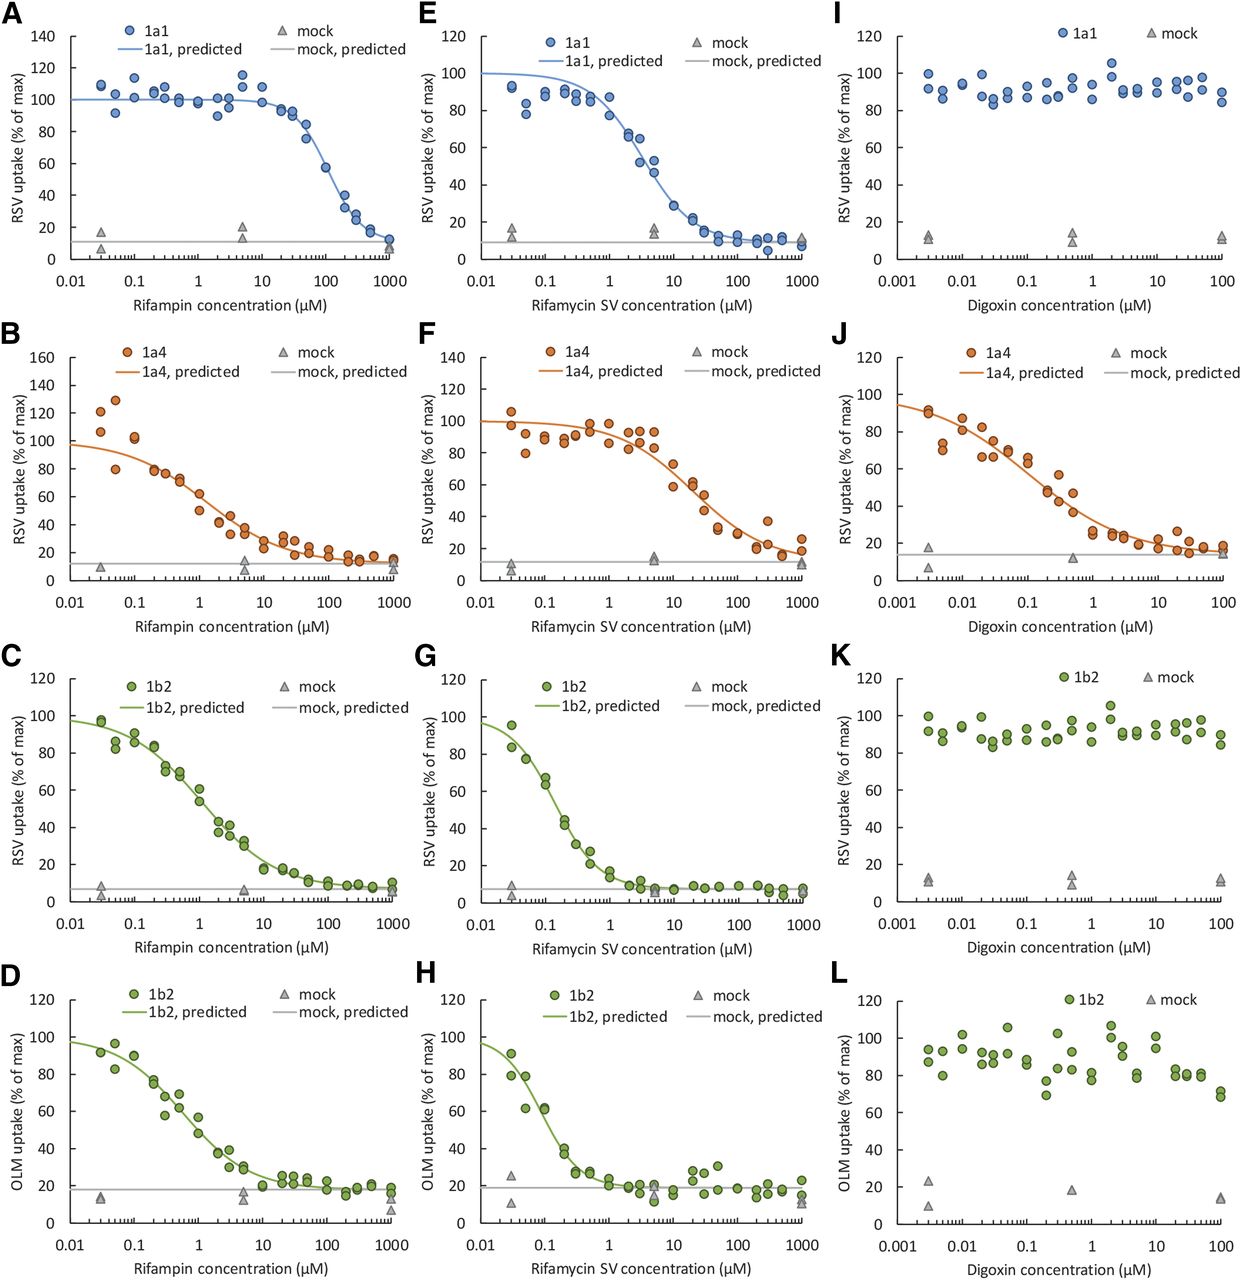
Concentration-dependent inhibition of RSV or OLM uptake into Oatp-expressing cell lines by rifampin (A–D), rifamycin SV (E–H), or digoxin (I–L). Rifampin inhibited only Oatp1a4 and 1b2. In contrast, rifamycin SV and digoxin were potent inhibitors of Oatp1b2 and Oatp1a4, respectively. The lines are the model predicted values (Phoenix).
Prediction and Verification of the Magnitude of Inhibition of In Vivo Sinusoidal Uptake Clearance of RSV in the Presence of 9.4 µM Rifampin.
We predicted the in vivo inhibition of the sinusoidal uptake clearance of RSV in rats using the intrinsic clearance (Vmax/Km) and Kd (Table 2) and the abundance of Oatp protein in the rat liver and transfected cells (Wang et al., 2015; Ishida et al., 2018). Then we compared the predicted inhibition to our previous in vivo PET imaging study (He et al., 2014). The magnitude of inhibition of sinusoidal uptake clearance of RSV by rifampin was well predicted (Table 3).
IC50 and Hill coefficient of inhibitors of organic anion transporting polypeptide (Oatp)–mediated uptake of rosuvastatin (RSV) or olmesartan acid (OLM)
These parameters were estimated using the data in Fig. 4 and Supplemental Fig. 3. The data represent the mean ± S.E. estimated by Phoenix.
Excellent agreement between the observed and predicted magnitude of inhibition by rifampin of the in vivo rosuvastatin sinusoidal uptake clearance in the rat as measured by PET imaging
Discussion
Three Oatps, Oatp1a1, 1a4, and 1b2, are expressed in the rat liver, and their protein expression, as determined by quantitative targeted proteomics, is similar (Wang et al., 2015). Therefore, any pharmacokinetic studies or hepatic efficacy/toxicity of Oatp substrate drugs in the rat must include consideration of these transporters. Here, we estimated for the first time the transport kinetic parameters of RSV and OLM by three rat hepatic Oatps.
Because several OATPs/Oatps have been shown to have multiple binding sites (Westholm et al., 2009; Shirasaka et al., 2014), we first determined whether this was the case for the uptake of RSV or OLM by the three rat Oatps. To enhance our ability to discern multiple binding sites, our experimental design was deliberately rich in data points: 18–21 concentrations, in duplicate, densely scattered over a wide concentration range. Although we incorporated a second binding site (i.e., Km and Vmax) into our model, the 95% confidence interval of these additional parameters contained zero, so we deemed them not to be reliable (data not shown). Hence, our final kinetic model included one binding site for transport (to estimate the Km, Vmax, and Hill coefficient) as well as passive diffusion (to estimate the Kd) (eqs. 1 and 2).
To determine the contribution of each OATP/Oatp in the uptake of drugs into hepatocytes or in vivo, it is important to conduct inhibition studies with selective transporters of each Oatp. However, to date such selective inhibitors have not been available as most drugs appear to be nonselective inhibitors of all Oatps. Here we found that rifamycin SV (1 µM) and digoxin (20 µM) were selective and potent inhibitors of Oatp1b2 (IC50 0.14 µM) and Oatp1a4 (IC50 0.1 µM), respectively (Fig. 4). For the remaining inhibitors, although they were found to be potent inhibitors of some Oatps (e.g., 10 µM quinine), when they were tested at concentrations that completely inhibited those transporters, they partially inhibited other Oatps (Fig. 3). Thus, they were not considered selective. BSP (>300 µM) and glyburide (100 µM) nonselectively inhibited all the Oatps and were considered pan-Oatp inhibitors.
Although the IC50 value of an inhibitor is important, the ability of that inhibitor to inhibit the in vivo clearance of a victim drug mediated by an Oatp(s) depends on the plasma concentration of the inhibitor achieved relative to its IC50. Thus, although some of the inhibitors studied, at first sight, may not appear to be potent inhibitors of Oatps, if the unbound portal vein plasma concentrations of the inhibitor (at the doses used) exceeds its IC50 value for an Oatp, the inhibitor will inhibit that hepatic Oatp in vivo. In addition, with the inhibitors tested, substrate-dependent inhibition of RSV, OLM, and E17βG was not observed (Figs. 3 and 4; Supplemental Fig. 2; Table 2).
Previous Oatp inhibition studies have focused on only one or two rat hepatic Oatps (Fattinger et al., 2000; Shitara et al., 2002; Ismair et al., 2003). Our findings are generally consistent with these previous reports (Fattinger et al., 2000; Shitara et al., 2002) but expand on these reports by including studies on Oatp1b2. However, we did observe some differences between the present study and a previous report by Shitara et al. (2002). Shitara et al. (2002) evaluated the inhibitory effect of many compounds on Oatp1a1- and Oatp1a4-mediated uptake of E17βG and digoxin, respectively. Consistent with our data, Oatp1a1- and 1a4 were not inhibited by 10 µM indomethacin; however, they found that Oatp1a1, but not Oatp1a4, was inhibited when the indomethacin concentration was increased to 100 µM. In the present study, we found that 100 µM indomethacin inhibited all three rat hepatic Oatps (Fig. 3). Unlike us, they found that quinidine (100 µM) inhibited Oatp1a1 but not Oatp1a4 activity, but their IC50 profiles of inhibition by quinidine showed that IC50 values of quinidine for Oatp1a1 and 1a4 are similar. (Shitara et al., 2002). We found that quinidine (100 µM) slightly inhibited both Oatp1a1 and 1a4 activity but not Oatp1b2 activity (Fig. 3). In all cases, we observed inhibitory effect of these drugs at lower concentrations than previously reported. One reason for this difference may be that we preincubated the cells with the inhibitors, and the previous investigators did not.
In the present study, we were successful in identifying selective inhibitors of Oatp1b2 and 1a4 but not Oatp1a1. Therefore, we propose the following experimental design to distinguish Ntcp-, Oatp-, and passive diffusion-mediated uptake of the drug into rat hepatocytes (in vitro and potentially in vivo) (Fig. 5). As usual, the contribution of Ntcp-dependent uptake can be estimated by the difference in the drug uptake in the presence and absence of extracellular Na+. Because 1 µM rifamycin SV and 20 µM digoxin selectively and completely inhibited Oatp1b2 and Oatp1a4, respectively (Fig. 4), the contribution of Oatp1b2 and 1a4 can be estimated by using the selective inhibitor 1 µM rifamycin SV and 20 µM digoxin, respectively, under the extracellular Na+-free condition (Figs. 4 and 5; Table 2). Glyburide (or BSP) is a pan inhibitor of rat hepatic Oatps (Fig. 3); therefore, the passive diffusion-mediated uptake of the drug can be estimated in the presence of 100 µM glyburide (or 300 µM BSP) under the Na+-free condition.
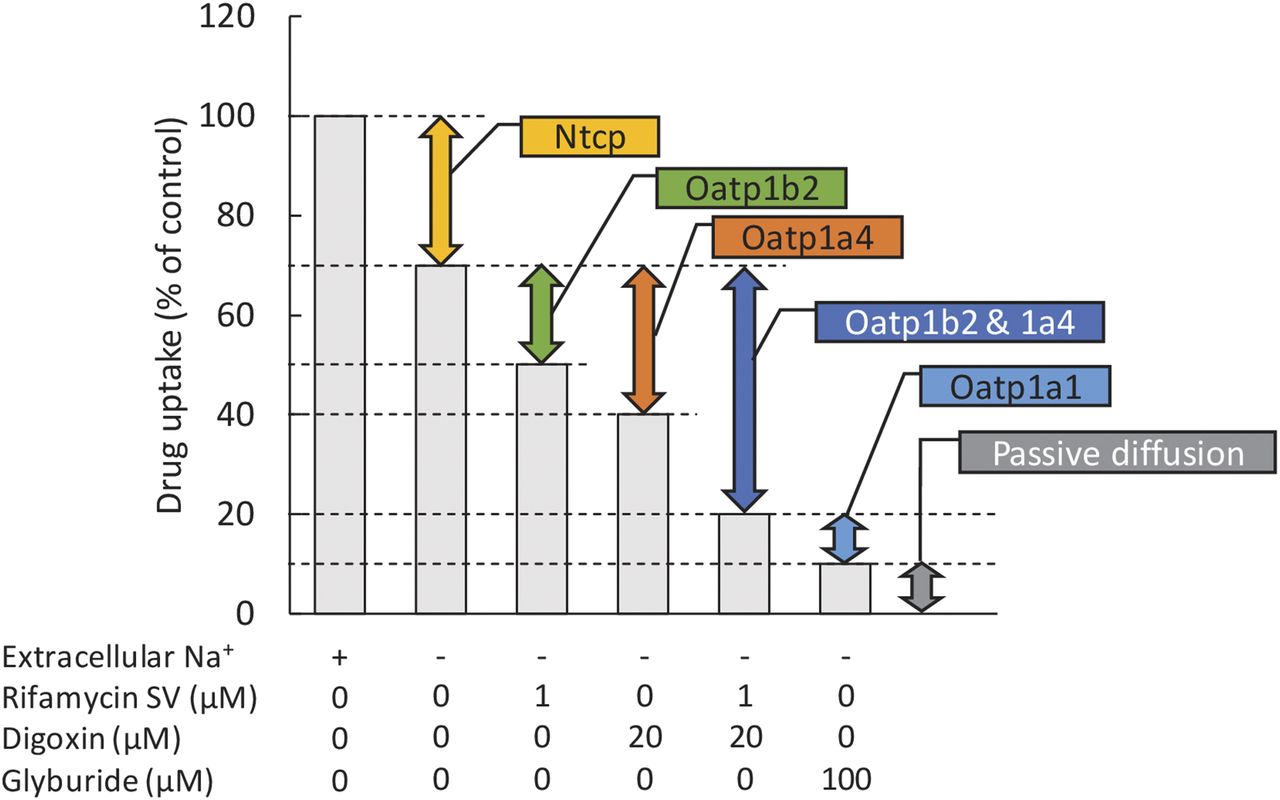
Proposed experimental design to distinguish Ntcp-, Oatp-, and passive diffusion-mediated uptake of drugs by rat hepatic Oatps.
Although, we did not identify a selective inhibitor of Oatp1a1, its contribution can be obtained by taking the difference in drug uptake in the presence of digoxin (20 µM) plus rifamycin SV (1 µM) and glyburide (100 µM). This strategy assumes that these inhibitors will not inhibit other transporters/metabolizing enzymes that may also transport/metabolize the drug of interest.
To predict the magnitude of the transporter-mediated drug-drug interactions (DDI), the ft by a particular transporter needs to be estimated (Li et al., 2014; Hsiao and Unadkat, 2014; Prasad and Unadkat, 2015). In our previously published rat [11C]-RSV PET imaging study, the in vivo sinusoidal uptake clearance of RSV was decreased ∼50% by rifampin (plasma concentration 9.4 µM) (Table 3) (He et al., 2014). The magnitude of this in vivo RSV–rifampin DDI was well predicted (Table 3) by our in vitro studies using the Oatp IC50 profiles of rifampin and the in vivo RSV ft predicted using the in vitro intrinsic clearance (Vmax/Km) by each Oatp (Table 1) and the abundance of the respective Oatp protein in the rat liver and Oatp-expressing cells previously reported (Wang et al., 2015; Ishida et al., 2018). This approach can be used to predict transporter-based DDI at any tissue/blood barrier where transporters are important in the distribution or elimination of a drug (Hsiao and Unadkat, 2012, 2014).
In conclusion, this is the first report to estimate the transport kinetic parameters of RSV and OLM by rat hepatic Oatps and to identify selective inhibitors of rat Oatp1b2 and Oatp1a4. We also provide a strategy to determine the contribution of Oatp1a1, 1a4, and 1b2 in the hepatic uptake of drugs. In addition, we show for the first time the magnitude of in vivo DDI with Oatp substrates can be predicted from in vivo studies by determining the ft of the victim drugs, quantitative proteomics, and inhibitory (IC50) profile(s) of the inhibitor.
Authorship Contributions
Participated in research design: Ishida, Ullah, Unadkat.
Conducted experiments: Ishida.
Contributed new reagents or analytic tools: Tóth, Juhasz.
Performed data analysis: Ishida.
Wrote or contributed to the writing of the manuscript: Ishida, Ullah, Tóth, Juhasz, Unadkat.
Footnotes
- Received January 31, 2018.
- Accepted June 7, 2018.
This work was supported by a Postdoctoral Fellowship from F. Hoffmann-La Roche Ltd. (to K.I.).
↵
 This article has supplemental material available at dmd.aspetjournals.org.

Abbreviations
- BSP
- sulfobromophthalein
- CHO
- Chinese hamster ovary cells
- CL
- clearance
- DDI
- drug-drug interactions
- E17βG
- estradiol 17β-d-glucuronide
- ft
- fraction of drug transported
- HEK293
- human embryonic kidney 293 cells
- Kd
- diffusion rate constant
- KH
- Krebs-Henseleit
- Km
- Michaelis-Menten constant
- Ntcp
- Na+-taurocholate cotransporting polypeptide
- OATP/Oatp
- organic anion transporting polypeptide
- PET
- positron emission tomography
- RSV
- rosuvastatin
- TCA
- taurocholic acid
- Vmax
- maximum velocity of the uptake
- Copyright © 2018 by The American Society for Pharmacology and Experimental Therapeutics


