


Visual Overview

Abstract
Rivaroxaban is indicated for stroke prevention in nonvalvular atrial fibrillation (AF). Its elimination is mediated by both hepatic metabolism and renal excretion. Consequently, its clearance is susceptible to both intrinsic (pathophysiological) and extrinsic (concomitant drugs) variabilities that in turn implicate bleeding risks. Upon systematic model verification, physiologically based pharmacokinetic (PBPK) models are qualified for the quantitative rationalization of complex drug-drug-disease interactions (DDDIs). Hence, this study aimed to develop and verify a PBPK model of rivaroxaban systematically. Key parameters required to define rivaroxaban’s disposition were either obtained from in vivo data or generated via in vitro metabolism and transport kinetic assays. Our developed PBPK model successfully predicted rivaroxaban’s clinical pharmacokinetic parameters within predefined success metrics. Consideration of basolateral organic anion transporter 3 (OAT3)–mediated proximal tubular uptake in tandem with apical P-glycoprotein (P-gp)–mediated efflux facilitated mechanistic characterization of the renal elimination of rivaroxaban in both healthy and renal impaired patients. Retrospective drug-drug interaction (DDI) simulations, incorporating in vitro metabolic inhibitory parameters, accurately recapitulated clinically observed attenuation of rivaroxaban’s hepatic clearance due to enzyme-mediated DDIs with CYP3A4/2J2 inhibitors (verapamil and ketoconazole). Notably, transporter-mediated DDI simulations between rivaroxaban and the P-gp inhibitor ketoconazole yielded minimal increases in rivaroxaban’s systemic exposure when P-gp–mediated efflux was solely inhibited, but were successfully characterized when concomitant basolateral uptake inhibition was incorporated in the simulation. In conclusion, our developed PBPK model of rivaroxaban is systematically verified for prospective interrogation and management of untested yet clinically relevant DDDIs pertinent to AF management using rivaroxaban.
SIGNIFICANCE STATEMENT Rivaroxaban is susceptible to DDDIs comprising renal impairment and P-gp and CYP3A4/2J2 inhibition. Here, systematic construction and verification of a PBPK model of rivaroxaban, with the inclusion of a mechanistic kidney component, provided insight into the previously arcane role of OAT3-mediated basolateral uptake in influencing both clinically observed renal elimination of rivaroxaban and differential extents of transporter-mediated DDIs. The verified model holds potential for investigating clinically relevant DDDIs involving rivaroxaban and designing dosing adjustments to optimize its pharmacotherapy in atrial fibrillation.
Introduction
Atrial fibrillation (AF) is the most common and clinically significant cardiovascular rhythm disorder. The Global Burden of Diseases, Injuries, and Risk Factors 2010 study indicated that the previous two decades have witnessed a progressive increase in the worldwide prevalence and incidence of AF with significant effects on associated morbidity and mortality (Chugh et al., 2014). Therapeutic mainstays of AF management can be chiefly divided into symptomatic treatment of arrhythmia by rate or rhythm control and prevention of thromboembolic complications by anticoagulation (January et al., 2014).
In recent years, direct oral anticoagulants have emerged as preferred alternatives to warfarin, particularly due to predictable dose-response relationships that eliminate the need for routine laboratory monitoring (Scaglione, 2013). Rivaroxaban, a non-vitamin K antagonist oral anticoagulant approved by the US Food and Drug Administration in 2010, is indicated for stroke prevention in nonvalvular AF. Rivaroxaban possesses a unique dual mode of elimination: where two-thirds of the systematically absorbed dose undergo CYP3A4/2J2-mediated metabolism while the remaining one-third is excreted unchanged in the urine, primarily via P-glycoprotein (P-gp)–mediated efflux (Mueck et al., 2013). This inevitably increases rivaroxaban’s susceptibility to drug-drug-disease interactions (DDDIs) attributed to simultaneous impairment of its multiple clearance pathways (Grillo et al., 2012).
The likelihood of drug-drug interactions (DDIs) is markedly increased when we consider that many rhythm and rate control agents (e.g., amiodarone, carvedilol, and diltiazem) likely to be coadministered with rivaroxaban in AF are known CYP3A4/2J2 and/or P-gp inhibitors (Wessler et al., 2013; US Food and Drug Administration, 2017). Furthermore, given that the prevalence of AF burgeons in the elderly population (Chugh et al., 2014), assessing the implications of age-related physiologic decline on the extent of these clinically relevant DDIs also becomes essential to guide pharmacotherapy. Nevertheless, practical constraints often restrict the number of dedicated trials that can be conducted to evaluate all clinically plausible permutations. Consequently, physiologically based pharmacokinetic (PBPK) modeling has emerged as a valuable tool in the quantitative rationalization of pharmacokinetic (PK) variabilities due to complex DDDIs.
By coupling the defining properties of rivaroxaban and the biologic system with trial design, the minimal PBPK models developed by Grillo et al. (2012) and Ismail et al. (2018) have prospectively established clinically significant DDDIs between rivaroxaban and erythromycin or verapamil in renal-impaired patients. The findings were instrumental in substantiating cautionary language discouraging concomitant administration of rivaroxaban with moderate CYP3A4/P-gp inhibitors in patients with renal dysfunction (US Food and Drug Administration, 2011b). Nevertheless, subsequent model verification using clinical DDI data uncovered a key limitation of the current minimal PBPK models where major physiologic compartments (except the liver) are combined with the plasma compartment. While these PBPK models incorporated interactions comprising both CYP3A4 and P-gp pathways, clinical urinary excretion data revealed negligible decreases in the renal clearance of rivaroxaban when it was coadministered with either erythromycin or verapamil in healthy patients (Moore et al., 2014; Greenblatt et al., 2018). This invalidated the initial assumption of a transporter-mediated component mediating the observed DDDI. Hence, to justify PBPK-guided extrapolation beyond the clinical trial population in the investigation of potential DDDIs involving rivaroxaban, mechanistic delineation of passive and active processes governing the renal clearance of rivaroxaban becomes essential.
Consequently, this study aims to develop and verify a full PBPK model for rivaroxaban via incorporation of both in vivo clinical PK data as well as in vitro experimental measurements, which can be used to inform drug-specific parameters through in vitro to in vivo extrapolation (IVIVE). Upon successful recapitulation of observed rivaroxaban PK and urinary excretion profiles in both healthy and renal-impaired patients, in vitro inhibitory parameters utilizing rivaroxaban as the probe substrate would be quantified and employed in retrospective DDI simulations linking rivaroxaban with prototypical CYP3A4/2J2 and P-gp inhibitors (ketoconazole and verapamil, which yield different quantitative effects on the renal clearance of rivaroxaban). We envision that this systematic approach to PBPK model verification would eventually instill confidence in acting on model-generated insights to support the rational dose selection of rivaroxaban in previously untested, albeit realistically complex clinical scenarios. The long-term aim is to minimize inadvertent increases in the systemic exposure of rivaroxaban while preserving its anticoagulant efficacy.
Materials and Methods
The workflow schematic adopted for PBPK model development, verification, and iterative refinement is illustrated in Fig. 1. Mechanistic modeling of permeability and transport kinetics was implemented with the Simcyp In Vitro Analysis Toolkit (version 3). All PK simulations presented herein were conducted using a population-based absorption, distribution, metabolism, and excretion simulator (version 17; Simcyp, Sheffield, UK).

PBPK modeling framework detailing the iterative processes of model development and verification that were performed in this study. Successful model verification must precede application of the PBPK model of rivaroxaban for prospective predictions of DDDIs.
Model Development
PBPK Model of Rivaroxaban.
Key drug-dependent parameters necessary for simulation of the kinetics of rivaroxaban are delineated in Table 1. Oral absorption of rivaroxaban was predicted with the advanced dissolution, absorption, and metabolism model implemented in Simcyp. The effective permeability of rivaroxaban in human was derived from in vitro apparent permeability measured in Caco-2 cell monolayers (Gnoth et al., 2011) using the apparent permeability/effective permeability correlation model within the simulator. Upon defining its intrinsic solubility (Takács-Novák et al., 2013), the dissolution rate of rivaroxaban was estimated with the diffusion layer model developed by Wang and Flanagan (1999). The effects of bile on the in vivo solubility estimated in each segment of the gastrointestinal tract were quantified via the bile micelle:water partition coefficient, calculated from the predefined log P via a quantitative structure-activity relationship model developed by Glomme et al. (2007). Simulated solubility outputs were compared with experimental biorelevant solubility measurements (Takács-Novák et al., 2013) and the bile micelle:water partition coefficient was manually adjusted to achieve concordance. Subsequently, a whole body PBPK model was applied to describe the distribution of rivaroxaban, where the tissue-to-plasma distribution equilibrium ratios were calculated via mechanistic tissue composition equations developed by Rodgers and Rowland (2006). The volume of distribution at steady state was predicted to be 0.2 l/kg, which is lower than the observed in vivo volume of distribution at steady state of approximately 0.62 l/kg (Mueck et al., 2014). Hence, a tissue:plasma partition coefficient scalar (applied equally to all tissues) of 2.2 was applied to optimize the volume of distribution at steady state.
Key input parameters for the PBPK model of rivaroxaban
Hepatic Metabolism.
The oral apparent clearance (CL/F) and renal clearance (CLR) data were collated from primary literature sources following administration of rivaroxaban to healthy adult subjects (Supplemental Table 1). Overall weighted mean clearances were calculated using the following equation: (1)where
  is the weighted mean; nj is the number of subjects in the jth study; and xj is the mean of the jth study. Here, a study is defined as the data associated with a group of subjects being administered a specific dose and dosing regimen of rivaroxaban on a particular occasion with n number of subjects. Based on a fractional metabolism in the liver of 0.37 for CYP3A4 and 0.29 for CYP2J2, as reported by Grillo et al. (2012), the unbound intrinsic clearance (CLu,int) values of rivaroxaban mediated by CYP3A4 and CYP2J2 were derived from the weighted mean of CL/F after accounting for the contribution of CLR via retrograde application of the well-stirred model.
Mechanistic Kidney Model Development.
The differential contribution of the primary processes governing the renal disposition of rivaroxaban (i.e., glomerular filtration, tubular secretion, and tubular reabsorption) was quantified via by the mechanistic kidney model within the simulator. In vitro transport assays investigating the P-gp–mediated efflux kinetics of rivaroxaban were first performed in Madin-Darby canine kidney (MDCK) subclone I cells transfected with multidrug resistance-1 (MDR1) protein. To account for the bidirectional passive permeability of rivaroxaban across the apical and basolateral membranes in addition to apical P-gp–mediated efflux driven by unbound intracellular rivaroxaban concentrations, time-dependent (60–420 minutes) and concentration-dependent (3–100 µM donor rivaroxaban) data, measured in the absorptive (apical-to-basolateral) direction, were fitted to a mechanistic model that dynamically simulates flux in rivaroxaban concentrations within the apical, basolateral, and intracellular compartments of the Transwell apparatus. Derived in vitro estimates of the maximum rate of active transport (Jmax), Michaelis constant (Km), and passive permeability (Ppass) were subsequently subjected to quantitative IVIVE scaling as highlighted in eqs. 2 and 3 to simulate the intrinsic clearance attributed to in vivo P-gp–mediated tubular secretion (CLu,int,T per kidney) and passive diffusion clearances (CLPD,kidney) that contribute to tubular reabsorption, respectively. (2)
(2) (3)
(3)
In eq. 2, the Jmax value (picomoles per minute) generated was first normalized to the protein concentration in each Transwell insert, quantified using bicinchoninic acid protein assay. The Jmax value was subsequently converted from picomoles per minute per milligram of protein to picomoles per minute per 106 of cells based on 1 million MDCK cells containing 0.08 mg of total protein (Scotcher et al., 2017). Differential P-gp mRNA expression data in the kidney, intestine, and MDCK cells was used to inform the relative expression factor of the proximal tubular cells (i.e., REFPTC in eq. 2) (Scotcher et al., 2017). In eq. 3, the total nephron surface area (291 cm2), kidney weight (341.5 g), and number of proximal tubular cells per gram of kidney, [(PTCPGK), 60 million in a healthy population] were used as IVIVE scaling factors to convert the in vitro apparent permeability to CLPD (Emami Riedmaier et al., 2016).
Further details on the chemicals, culture techniques, modeling, and fitting procedures used are highlighted in the Supplemental Material.
PBPK Models of Inhibitors (Ketoconazole and Verapamil).
Ketoconazole, verapamil, and its primary metabolite, norverapamil, are prototypical CYP3A4/2J2 as well as P-gp inhibitors that have been implicated in clinical DDIs with rivaroxaban (Mueck et al., 2013; Greenblatt et al., 2018). In the construction of PBPK-DDI models, the verified compound file of ketoconazole provided in Simcyp (version 17) was used. In the case of verapamil, although the compound file provided in Simcyp (version 17) allowed adequate modeling of the PK profile of an immediate-release formulation, coadministration of rivaroxaban and sustained-release verapamil capsules in the trial by Greenblatt et al. (2018) necessitated further refinement of verapamil’s absorption kinetics. As described in Supplemental Fig. 1, a sequential one-stage convolution procedure was implemented that models the relationship between the in vitro dissolution profile and the observed plasma concentration-time profile of verapamil. Final model parameters for ketoconazole and verapamil are summarized in Supplemental Tables 2.1–2.3.
Model Verification: PK Simulations
Verification of Basal PBPK Model of Rivaroxaban and Verapamil.
The PK profiles following single or multiple administrations of clinically relevant doses to healthy subjects using the default healthy NEurCaucasian population available within Simcyp were first simulated to verify the performance of the PBPK models of rivaroxaban and verapamil. During the model verification process, the population, number of participants, dose, and regimen selected for the simulations were matched to the corresponding clinical study designs (Supplemental Table 3). A total of 10 trials were simulated to assess variability across groups. The predictive accuracies of the PBPK models were evaluated via visual predictive checks against average plasma concentration-time data digitized using WebPlotDigitizer (version 4.0, https://automeris.io/WebPlotDigitizer). Additionally, a metric approach detailed by Abduljalil et al. (2014) that considers both the intrinsic variability of observed PK parameters [i.e., area under the curve (AUC) and peak plasma concentration, (Cmax)] as well as the clinical sample size was also applied to assess simulated values.
Simulation of Rivaroxaban’s CLR Using the Mechanistic Kidney Model in a Healthy Population and in Patients with Mild Renal Impairment.
Simulations of rivaroxaban’s plasma concentration-time and urinary excretion profiles in a healthy population using the final mechanistic model were first compared with the PBPK model of rivaroxaban, where the weighted mean CLR collated from seven independent studies was defined as a single input parameter (Supplemental Table 1). Upon verification of the predictive capabilities of the mechanistic kidney model in healthy subjects, system-dependent parameters within the model were further modified to reflect potential physiologic changes synonymous with renal impairment. Based on the intact nephron hypothesis (INH) by Bricker (1969), damaged nephrons stop working completely while undamaged nephrons function normally; consequently, proportional reductions in tubular secretion and glomerular filtration would likely be observed in chronic kidney disease (CKD). In this study, a decline in PTCPGK was used to represent the loss of tubular cells, and hence active secretion that is consistent with the INH concept. Consequently, the default value of 60 million PTCPGK corresponding to the representative glomerular filtration rate (GFR) of a healthy population (136.4 ml/min) was scaled down proportionally to 28.6 million according to the median GFR that occurs in mild renal impairment (GFR = 65 ml/min in a range of 50–79 ml/min) (Scotcher et al., 2017; Hsueh et al., 2018) (Supplemental Table 4). This newly defined population was subsequently used to predict the observed attenuations in rivaroxaban’s CLR in mild renal impairment (Supplemental Material).
Model Verification: Retrospective DDI Simulations
Upon accurate recapitulation of rivaroxaban’s PK, performance verification in both the uninhibited and inhibited states is essential to ascertain that rivaroxaban has been adequately characterized as a DDI victim (Shebley et al., 2018). Hence, PBPK-DDI models were constructed via the incorporation of in vitro inhibitory parameters describing the inhibitory potential of verapamil, norverapamil, and ketoconazole against the CYP3A4/2J2-mediated metabolism as well as P-gp–mediated secretion of rivaroxaban (Supplemental Material). For DDI simulations, statistical analyses were performed using SPSS version 22 (IBM Corp., Armonk, NY). The AUC, Cmax, and clearance (CL) values of rivaroxaban were analyzed assuming log normally distributed data. Student’s t test was used to analyze the difference in these parameters in the absence and presence of concomitant inhibitors. Point estimates and exploratory 90% confidence intervals for the ratios were calculated by retransformation of the logarithmic results. Based on these analyses, a refined predictive measure proposed by Guest et al. (2011) incorporating PK variability coupled with variable prediction boundaries dependent on the extent of interaction was applied in defining the success of the DDI simulations.
Model Refinement
Incorporation of Organic Anion Transporter 3–Mediated Basolateral Uptake of Rivaroxaban.
Consideration of glomerular filtration, tubular reabsorption via passive permeability clearances, and apical P-gp–mediated secretion resulted in an underestimation of rivaroxaban’s CLR, alluding to potential undefined mechanisms governing rivaroxaban’s renal disposition. Tsuruya et al. (2017) reported the specific uptake of rivaroxaban in mouse organic anion transporter (OAT) 3–expressing cells, with Jmax and Km values in mouse OAT3-transfected cells determined to be 72.9 ± 46.8 pmol/min per mg of protein and 1.01 ± 0.70 µM, respectively. In the absence of transporter abundance or expression to facilitate allometric scaling, rivaroxaban uptake was independently investigated in this study using human OAT3-transfected human embryonic kidney cell lines obtained from Dr. Kathleen Giacomini (University of California, San Francisco, CA). Details on the culture techniques, uptake assay protocol, two-compartmental modeling, and fitting procedures are highlighted in the Supplemental Material. The derived in vitro active uptake clearance was similarly subjected to IVIVE using eq. 3 correcting for measured protein (0.15 mg) per million of human embryonic kidney cells. An alternative top-down approach was further used to estimate the CLu,int value governing OAT3-mediated uptake. Using sensitivity analysis optimization, the CLu,int value was determined to be the value producing a simulated CLR value that converged with the weighted mean CLR value of 3.1 l/h when serum creatinine was fixed at 80 µmol/l (corresponding to GFR = 120 ml/min in healthy volunteers) (Scotcher et al., 2017).
Results
Development and Verification of the PBPK Models of Rivaroxaban and Verapamil
Basal PBPK Model of Rivaroxaban Recapitulated Clinically Observed PK Profiles.
The weighted mean CL/F and CLR values of rivaroxaban collated from seven independent studies in healthy volunteers were 8.6 and 3.1 l/h, respectively (Supplemental Table 1). Using the retrograde model, the CLu,int values attributed to CYP2J2 and CYP3A4 were calculated to be 5.69 and 0.064 µl/min per picomole of isoform, with additional liver clearance defined to be 8.00 µl/min per milligram of liver microsomal protein Table 1. The effect of food in enhancing rivaroxaban’s bioavailability at the 20 mg dose strength was recapitulated by considering the differential influences of fasted versus fed conditions on the extent of bile micelle-mediated solubilization (Fig. 2A; Tables 2, 3, and 4). As highlighted in Table 2, the simulated geometric mean AUC was 1512 µg⋅h/l in the fasted state compared with 2127 µg⋅h/l in the fed state. This predicted 1.41-fold increase in the presence of food was aligned with the 1.39-fold change observed in a phase I confirmatory food-effect trial (Stampfuss et al., 2013). Model predictive performance was further assessed using external verification data sets from independent clinical trials not used in model development. Plasma concentration-time profiles of 10 mg (Fig. 2B) and 20 mg (Fig. 2C) doses of rivaroxaban (Supplemental Material) compared well with the referenced published studies by Mueck et al. (2013) and Greenblatt et al. (2018), respectively, with the observed PK parameters (AUC, Cmax, and CL) falling within the prespecified PK prediction criteria (Tables 2–4).
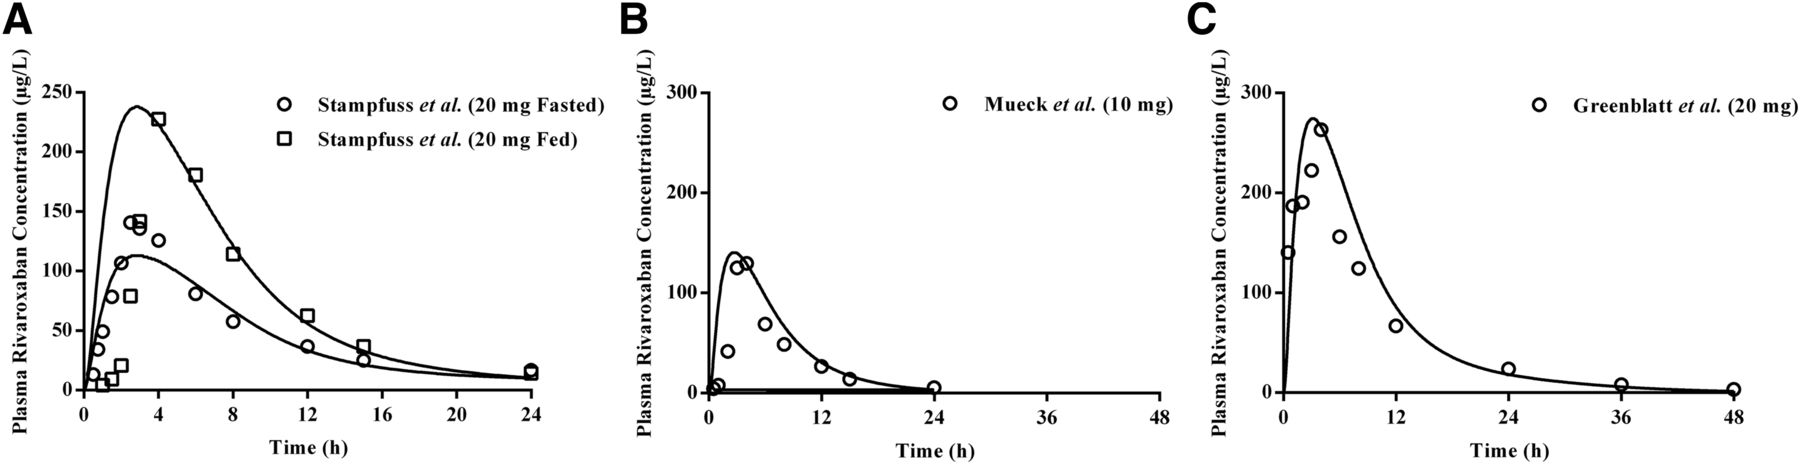
Simulated pharmacokinetic profiles of rivaroxaban after single dose administration. Simulated mean (solid line) plasma drug concentration-time profiles of single dose rivaroxaban demonstrated (A) the effect of food in increasing bioavailability at the 20 mg dose and accurately recapitulated clinically observed profiles at 10 mg (B) and 20 mg (C) doses. Open symbols represent clinical data.
Comparison of PK parameters between simulated and observed data for model verification of rivaroxaban (20 mg fasted and fed single doses) in healthy subjects
Comparison of PK parameters between simulated and observed data for model verification of rivaroxaban (10 mg single dose) in healthy subjects
Comparison of PK parameters between simulated and observed data for model verification of rivaroxaban (20 mg single dose) in healthy subjects
Three-Compartmental Analysis Enabled Accurate Determination of Kinetic Constants Governing the In Vitro P-gp–Mediated Efflux of Rivaroxaban.
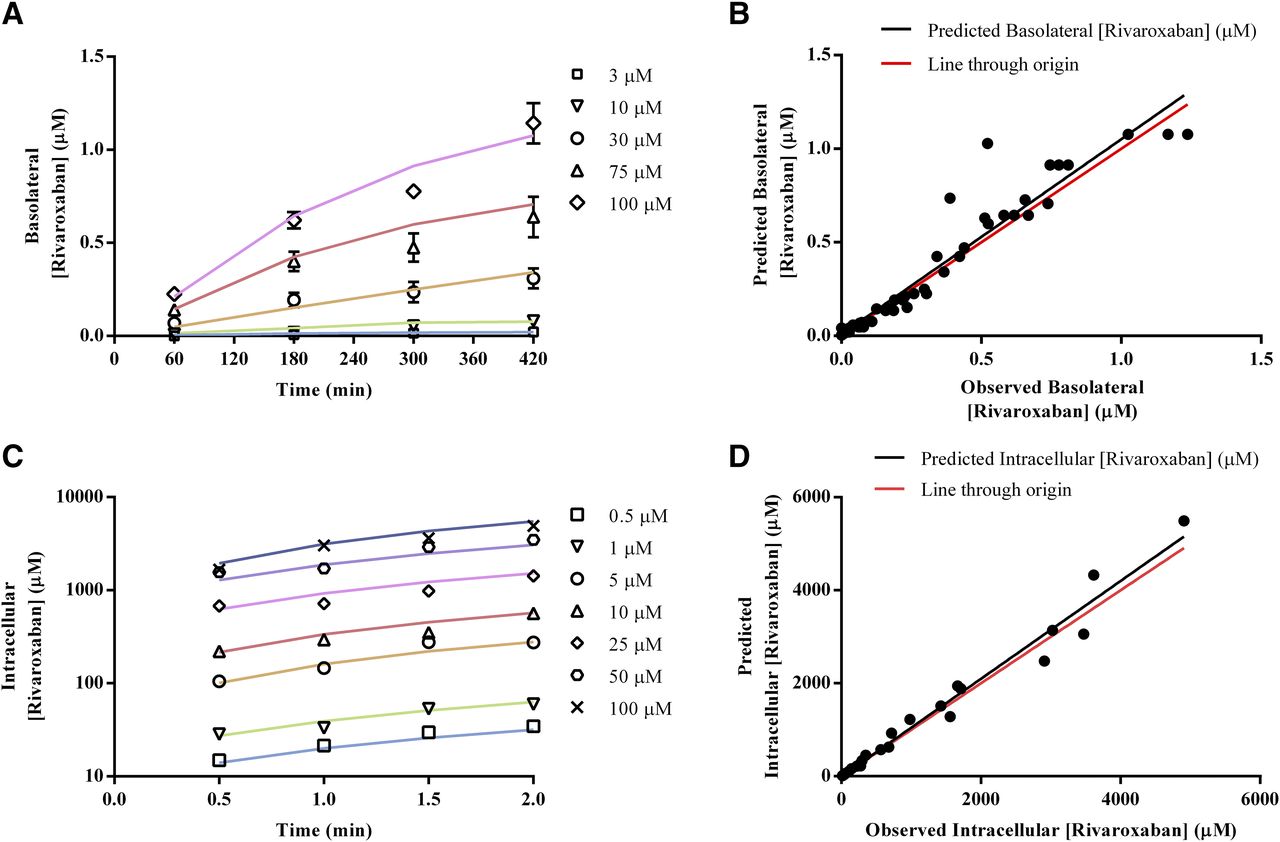
Approximately one-third (36%) of the absorbed dose of rivaroxaban is excreted unchanged in the kidney, with active tubular secretion accounting for 30% (Mueck et al., 2013). As a result, accurate estimation of kinetic parameters governing the P-gp–mediated efflux of rivaroxaban based on in vitro data is critical for successful IVIVE of its renal disposition. Preliminary analyses of bidirectional MDCK-MDR1 transport assays via the conventional Michaelis-Menten approach established time-linear conditions for both absorptive (Supplemental Fig. 2A) and basolateral rivaroxaban transport (Supplemental Fig. 2B) as well as the superior sensitivity of absorptive flux (Supplemental Fig. 2C) compared with basolateral flux (Supplemental Fig. 2D) in response to apical P-gp efflux activity. However, as seen in Supplemental Fig. 2C, solubility limitations prevented saturation of rivaroxaban transport in the absorptive direction. Hence, to account for the interaction of P-gp with unbound intracellular concentrations of rivaroxaban, mechanistic three-compartmental modeling was subsequently applied to analyze both time- and concentration-dependent data describing rivaroxaban’s absorptive transport. Unbound rivaroxaban concentrations in the extracellular and intracellular compartments, determined via ultrafiltration experiments to be 1 and 0.023, respectively, were incorporated as fixed drug-dependent parameters (Supplemental Table 5). The apparent Jmax and apparent Km values (97.98 pmol/min and 836.8 µM, respectively) determined using the conventional Michaelis-Menten approach were also used as a priori information for naive pooled fitting via both hybrid and local (Nelder-Mead) optimization procedures. As highlighted in Table 5, the convergence of Jmax and Km estimates from two different optimization methods attested to the robustness of the three-compartmental approach and established that fitting outcomes were minimally influenced by the initial Jmax and Km values. Visual predictive checks also demonstrated consistency between experimental measurements and simulated rivaroxaban concentration-time profiles in the basolateral compartment (Fig. 3, A and B). Given that the Nelder-Mead optimization resulted in lower corrected Akaike information criterion values, estimates of Jmax = 37.83 pmol/min, Km = 9.42 µM, and Ppass = 12.88 × 106 cm/s were subjected to quantitative IVIVE via eqs. 2 and 3 to generate CLu,int,T per kidney (Jmax = 80.921 pmol/min per 106 of cells and Km,u = 9.42 µM) and CLPD,kidney (1.09 × 10⁻⁵ µl/min per 106 of cells) for parameterization of the mechanistic kidney model (Table 1).
Jmax and Km values of P-gp–mediated efflux activity and passive permeability of rivaroxaban in MDCK-MDR1 cell monolayers derived from three-compartmental analysis of absorptive transport
Confidence intervals (95%) are described in brackets. The dashes indicate that values are not applicable for the efined column.

In vitro investigation of the P-gp–mediated and OAT3-mediated transport kinetics of rivaroxaban. For efflux kinetics, time- and concentration-dependent data in the absorptive direction were analyzed via mechanistic three-compartmental modeling. Goodness of fit between experimentally measured (symbols) and simulated (solid lines) basolateral rivaroxaban concentrations is presented in (A and B). For uptake kinetics, time- and concentration-dependent rivaroxaban uptake into OAT3-transfected human embryonic kidney cells was analyzed via mechanistic two-compartmental modeling. Goodness of fit between experimentally measured (symbols) and simulated (solid lines) intracellular rivaroxaban concentrations is presented in (C and D).
IVIVE of Rivaroxaban’s Renal Clearance Revealed the Pivotal Role of Basolateral Uptake.
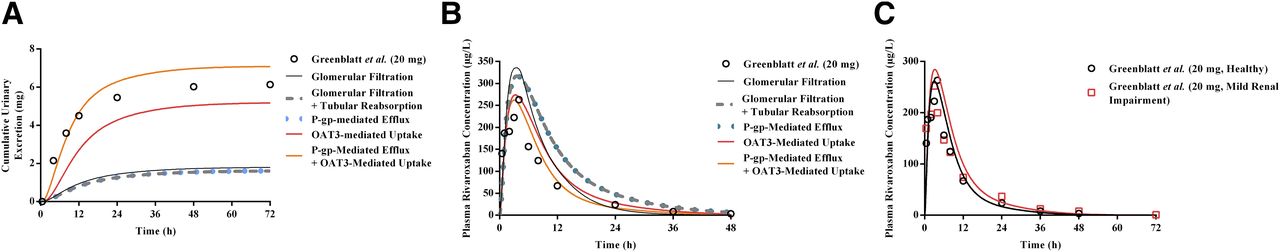
Using the mechanistic kidney model, the relative contribution of various processes (i.e., glomerular filtration, tubular reabsorption, and active secretion) involved in rivaroxaban’s renal excretion clearance was assessed in a stepwise manner. Expectedly, consideration of either glomerular filtration in isolation or both glomerular filtration and passive tubular reabsorption resulted in substantial underprediction of rivaroxaban’s CLR (predicted CLR values of 0.41 and 0.36 l/h, respectively) (Fig. 4A) and a corresponding overestimation of its systemic exposure (Fig. 4B), underscoring the significance of active renal secretion in mediating rivaroxaban’s renal disposition. However, sole incorporation of P-gp–mediated apical efflux demonstrated marginal effects on both CLR and systemic exposure (Fig. 4, A and B). As highlighted in Table 7, without OAT3-mediated basolateral uptake, the CLR value was underpredicted by 85% and the predicted AUC was 1.51-fold higher than that reported by Greenblatt et al. (2018), falling outside the prespecified success criteria. Hence, this provided the impetus for mechanistic investigation of OAT3-mediated rivaroxaban uptake.

Development of the mechanistic kidney model (MechKiM) for simulation of rivaroxaban PK in healthy and renal-impaired patients. Simulated cumulative urinary excretion of rivaroxaban (A) and its corresponding plasma concentration-time profile (B) using MechKiM following a single 20 mg dose. Accounting for glomerular filtration (black solid line), glomerular filtration, and reabsorption (gray dashed line); glomerular filtration, reabsorption, and apical P-gp–mediated active efflux (blue dotted line); as well as glomerular filtration, reabsorption, and basolateral OAT3-mediated uptake (red line) were unsuccessful in recapitulating observed clinical profiles (open circles). Recapitulation of observed clinical plasma rivaroxaban concentrations and urinary excretion data required the consideration of basolateral uptake in tandem with apical efflux (orange line). Upon verification of the drug-dependent parameters within the MechKiM model, adjustment of system parameters (glomerular filtration and PTCPGK) allowed accurate prediction of the increase in rivaroxaban’s systemic exposure in mild renal impairment (C). Open symbols represent clinical data.
Kinetic Constants Governing In Vitro OAT3-Mediated Uptake of Rivaroxaban Were Comparable to Top-Down Estimates of OAT3-Mediated Intrinsic Clearance.
Upon establishing the functionality of the OAT3/OAT1-transfected systems (Supplemental Fig. 3, A and B), preliminary investigation of potential rivaroxaban uptake was performed. The uptake of rivaroxaban by human OAT3-expressing cells was higher than that by the empty vector transfected cells at 5 minutes and was further inhibited by a prototypical OAT inhibitor, probenecid (50 µM) (Supplemental Fig. 3C). In contrast, the uptake of rivaroxaban by human OAT1-expressing cells was comparable to that of the empty vector transfected cells at 5 minutes (Supplemental Fig. 3D). Taken together, rivaroxaban is a substrate of human OAT3 but not human OAT1. Time-dependent rivaroxaban uptake was subsequently evaluated, and linearity was preserved up to 2 minutes (Supplemental Fig. 3E). Consequently, concentration-dependent transport of rivaroxaban (0.5–100 µM) was investigated under time-linear conditions in both wild-type and OAT3-transfected cells (Supplemental Fig. 3G). Total rivaroxaban uptake (Supplemental Fig. 3H, solid black line) was fitted via the conventional two-step approach (Supplemental Material). Accounting for passive diffusion (Supplemental Fig. 3F), calculated to be 22.65 µl/min per 106 of cells, saturable active uptake was observed with transporter-mediated intrinsic clearance estimated to be 33.91 µl/min per 106 of cells (Supplemental Fig. 3H, gray solid line). Given that data from 2-minute incubations have been shown to produce large S.E. values in the estimation of CLPD (Ménochet et al., 2012), CLPD,kidney (1.09 × 10⁻⁵ µl/min per 106 of cells obtained previously via IVIVE scaling) and transporter-mediated intrinsic clearance derived from the two-step approach were eventually used as initial estimates for naive pooled fitting of measured time- and concentration-dependent data via two-compartmental modeling. Visual predictive checks demonstrated consistency between experimental measurements and simulated intracellular rivaroxaban concentration-time profiles (Fig. 3, C and D). The OAT3 CLu,int,T value was determined to be 41.33 µl/min per 106 of cells (Table 6) and compared well with estimates obtained via a sensitivity analysis–based approach that simulated variations in rivaroxaban’s CLR as a function of OAT3 CLu,int,T and serum creatinine input parameter values. The optimal CLu,int,T for uptake governed by OAT3 (43 µl/min per 106 of cells) was taken at the intersection of the simulated rivaroxaban CLR with the observed weighted CLR of 3.1 l/h at a serum creatinine level of 80 µmol/l (which corresponds to the simulated GFR value of ∼120 ml/min in healthy volunteers) (Supplemental Fig. 4, green plane).
Intrinsic OAT3-mediated uptake clearance of rivaroxaban in OAT3-transfected HEK cells derived from two-compartmental analysis of uptake transport. The dashes indicate that values are not applicable for the defined column.
Confidence intervals (95%) are described in brackets.
Concurrent Basolateral Uptake and Apical Efflux Were Necessary to Recapitulate Rivaroxaban’s Renal Clearance.
The optimized CLu,int,T value of OAT3-mediated uptake was incorporated into the mechanistic kidney model. In a hypothetical scenario where basolateral OAT3 uptake was present but apical P-gp efflux was disregarded, although simulations managed to recapitulate the observed plasma concentration-time profile of rivaroxaban (Fig. 4B), the amount excreted unchanged in urine remained underestimated (Fig. 4A; Table 7). Hence, our simulations demonstrate that accounting for basolateral uptake in conjunction with apical efflux was crucial in ensuring that simulated plasma concentration-time (Fig. 4B) and urinary excretion rate profiles (Fig. 4A) matched the observed clinical data, with the PK parameters (AUC, Cmax, and CLR) satisfying the prespecified success criteria (Supplemental Material; Table 7 and 8).
Comparison of PK parameters between simulated and observed data for model verification of the mechanistic kidney model of rivaroxaban after a 20 mg single dose in healthy subjects
Healthy controls are defined as having creatinine clearance > 80 ml/min.
Comparison of PK parameters between simulated and observed data for model verification of the mechanistic kidney model of rivaroxaban after a 10 mg single dose in healthy subjects
Healthy controls are defined as having creatinine clearance > 80 ml/min
Simulations Using the Mild Renal Impairment Population Adequately Predicted Increases in the Systemic Exposure of Rivaroxaban.
Upon successful verification of the mechanistic kidney model in healthy subjects, which affirmed the accuracy of the drug-dependent parameters defined for rivaroxaban, the ability of the PBPK model to predict the altered PK of rivaroxaban in mild renal impairment was subsequently investigated. With the application of INH, assuming proportional reductions in GFR and tubular secretion, the simulated geometric mean rivaroxaban AUC and CLR fold changes were 1.20- and 0.54-fold, respectively (Table 9). These point estimates fell within the range of clinical success determined based on the clinically observed AUC and CLR fold changes of 1.11 and 0.93, respectively (Supplemental Material; Table 9). The modeled plasma-concentration time profiles also reasonably characterized the increase in rivaroxaban’s systemic exposure with concomitant mild renal impairment (Fig. 4C).
Comparison of PK parameters between simulated and observed data for model verification of the mechanistic kidney model of rivaroxaban after a 20 mg single dose in renal impaired patients
Healthy controls are defined as having creatinine clearance > 80 ml/min; mild renal impairment is defined as having creatinine clearance of 50–79 ml/min.
PBPK Models of Immediate-Release Verapamil and Norverapamil Recapitulated Clinically Observed PK Profiles.
In the first step of the two-stage in vivo to in vitro correlation framework (Supplemental Fig. 1), using the verified verapamil and norverapamil compound files provided within the Simcyp simulator, simulated PK profiles following a single 80 mg immediate-release dose of verapamil were aligned with the referenced published study by Haeri et al. (2014) (Fig. 5A). Additionally, the model effectively predicted the observed AUC data within the calculated prediction criteria (Supplemental Table 6). This affirms that the in vivo disposition parameters were accurately defined before proceeding with the in vitro to in vivo correlation.

Simulated pharmacokinetic profiles of verapamil and its major metabolite norverapamil. (A) Simulated plasma concentration-time profiles of 80 mg immediate-release verapamil and norverapamil in healthy volunteers verified the basal PBPK model of verapamil provided within Simcyp. (B) In vivo to in vitro correlation convolution using the reported in vitro dissolution profile of a controlled-release capsule was unable to recapitulate clinically observed plasma concentration-time profiles following a single 120 mg dose. Iterative refinement of the dissolution parameters yielded an in vivo dissolution profile (B) that adequately described absorption kinetics after single (C) and multiple (D) dosing based on the administration schedule delineated by Greenblatt et al. (2018). Open symbols represent clinical data while solid lines depict simulations.
PBPK Models of Verapamil and Norverapamil Described Absorption Kinetics following Administration of a Sustained-Release Formulation.
In vitro to in vivo correlation convolution was subsequently applied to predict the PK following administration of a single 120 mg dose of controlled-release verapamil based on an initial in vitro dissolution input (Fig. 5B) (Wise, 2000). Simulated and observed plasma concentrations reported by Frishman and Lazar (1992) were compared and the discrepancies prompted iterative refinement of the dissolution parameters to produce an in vivo dissolution profile (Fig. 5B) that adequately described the absorption kinetics following single dose administration of a sustained-release verapamil capsule (Fig. 5C). Accumulation of verapamil following multiple dosing (i.e., 120 mg on day 1, 240 mg on day 2, and 360 mg from day 3 to 10) was also in line with the clinical data (Fig. 5D) (Greenblatt et al., 2018).
Retrospective Simulations of Enzyme- and Transporter-Mediated DDIs between Rivaroxaban and Verapamil/Ketoconazole
Although preliminary PK simulations verified the predictive potential of the basal compound model of rivaroxaban, given that the PBPK model of rivaroxaban is intended to be applied for the characterization of complex DDIs involving potential enzyme-transporter interplay, it becomes essential to further evaluate its predictive performance against observed DDIs with CYP3A4/2J2 and/or P-gp inhibitors (Shebley et al., 2018).
DDDIs between Rivaroxaban and Verapamil Were Successfully Modeled.
The capability of verapamil and its major metabolite norverapamil to elicit both mechanism-based inactivation (MBI) as well as reversible inhibition of CYP3A4 has been established previously (Orr et al., 2012). Nevertheless, in our study, the in vitro inhibitory parameters (i.e., kinact: the theoretical maximum inactivation rate constant at infinite inactivator concentration; KI: the inactivator concentration yielding an inactivation rate at one-half of kinact; and Ki: the equilibrium dissociation constant for the enzyme inhibitor complex) were quantified using rivaroxaban as the probe substrate.
Collectively, the in vitro inhibition studies affirmed the MBI (Supplemental Fig. 5, A–D) and reversible inhibition (Supplemental Fig. 6, A–D) of CYP3A4-mediated metabolism of rivaroxaban by verapamil and norverapamil. A summary of the in vitro inhibition parameters derived is presented in Table 10. Conversely, our preliminary studies suggest the absence of MBI of CYP2J2 by verapamil and norverapamil (Supplemental Fig. 5, E and F). Similarly, reversible inhibition by verapamil and norverapamil against CYP2J2 yielded large Ki values of 12.2 and 161.8 µM, respectively (Supplemental Fig. 6, E–H). The R1 ratios (Table 10) were both less than the threshold of 1.02 recommended by the Food and Drug Administration, hence eliminating the need for further assessment of DDI potential.
Summary of CYP450,P-gp and OAT3 inhibition parameters with rivaroxaban as the probe substrate. The dashes indicate that values are not applicable for the defined column.
Notably, despite a previous in vitro study demonstrating an inhibitory effect of verapamil against the P-gp–mediated efflux of rivaroxaban (Table 10) (Gnoth et al., 2011), the in vivo data revealed that the amount of rivaroxaban excreted unchanged in urine was elevated in the presence of verapamil (Greenblatt et al., 2018). This in vitro to in vivo disconnect alluded to the negligible role of transporters in perpetrating the eventual DDI between rivaroxaban and verapamil. Subsequent assimilation of the derived CYP3A4 inhibitory parameters into the PBPK-DDI model accurately recapitulated the observed DDI magnitude (Fig. 6A) and the increase in CLR (Fig. 6B). The simulated geometric mean (90% confidence interval) AUC and CL ratios of 1.46 (1.33, 1.61) and 0.68 (0.62, 0.75) were within the range of acceptable performance calculated based on the clinically observed AUC and CL fold changes of rivaroxaban in the presence of verapamil (Table 11). In patients with underlying mild renal impairment, verapamil coadministration resulted in simulated geometric mean AUC and CL fold changes of 1.70 and 0.59, respectively, meeting the success criteria defined in Table 12, hence attesting to the ability of the PBPK-DDI model to accurately recapitulate an enzymatic DDDI scenario (Fig. 6C).

Predicted DDIs between rivaroxaban and verapamil or ketoconazole in healthy and renal-impaired patients. Simulated mean plasma concentration-time profiles of (A) 20 mg rivaroxaban in the absence and presence of CYP3A4 inhibitor verapamil demonstrated accurate estimation of DDI magnitude, including (B) an increase in the cumulative urinary excretion of rivaroxaban with verapamil coadministration. (C) Mild renal impairment potentiated the extent of DDI between rivaroxaban and verapamil. (D) Consideration of the inhibitory potential of ketoconazole on CYP3A4/2J2-mediated metabolism and P-gp–mediated efflux of rivaroxaban underestimated the observed DDI magnitude (blue solid line). Optimization of the Ki value of ketoconazole against OAT3-mediated rivaroxaban uptake was required to accurately recapitulate the clinically observed DDI (blue dashed line). Open symbols represent clinical data.
Simulated change in rivaroxaban PK parameters in the presence of drug-drug interactions with verapamil
Simulated change in rivaroxaban PK parameters in the presence of drug-drug-disease interactions with verapamil
Mild renal impairment is defined as having creatinine clearance of 50–79 ml/min.
Extent of DDIs between Rivaroxaban and Ketoconazole Was Underestimated Despite Consideration of CYP3A4, CYP2J2, and P-gp Inhibition.
In vitro investigations verified the inhibition of CYP3A4 and CYP2J2-mediated metabolism as well as P-gp–mediated efflux of rivaroxaban with coadministration of ketoconazole (Supplemental Fig. 7, A–F). The simulated fold reduction in hepatic CL met the success criteria delineated in Table 13, reliably supporting conclusions that the extent of enzyme-mediated DDI was accurately reproduced. Nevertheless, as illustrated in Fig. 6D (blue solid line), the modeled plasma concentration-time profile in the presence of ketoconazole evidently demonstrated an underestimation of DDI magnitude. Moreover, the PK parameters (AUC, Cmax, and CLR) fell outside the prespecified acceptance criteria (Table 13), suggesting that the nature and potency of transporter-mediated interactions between rivaroxaban and ketoconazole have not been adequately elucidated. The results of a subsequent sensitivity analysis (Supplemental Fig. 8A) corroborated this postulation and demonstrated that the sole inhibition of P-gp–mediated efflux is unlikely to substantially affect rivaroxaban’s systemic exposure. In contrast, the AUC fold change was highly sensitive to inhibition of OAT3-mediated basolateral uptake. In vitro inhibition experiments further established inhibition of OAT3-mediated uptake by ketoconazole (IC50 = 15.77 µM) (Supplemental Fig. 7G). Nevertheless, direct incorporation of the measured in vitro Ki was unable to recapitulate the clinically observed DDI magnitude (data not shown) and further optimization of the Ki value of ketoconazole to 0.01 µM was eventually required (Fig. 6D, blue dashed line; Supplemental Material; Table 14).
Simulated change in rivaroxaban PK parameters in the presence of drug-drug interactions with ketoconazole incorporating apical efflux inhibition
Simulated change in rivaroxaban PK parameters in the presence of drug-drug interactions with ketoconazole incorporating both basolateral uptake and apical efflux inhibition
Discussion
In the United States, 30%–50% of adverse drug reactions are due to dosing errors (Neely, 2017), largely implicating vulnerable populations that incidentally constitute the exclusion criteria of pivotal clinical trials (Darwich et al., 2017). PBPK modeling has proven to be a panacea for the perennial challenge of suboptimal therapeutic outcomes in such complex and untested, albeit clinically relevant scenarios. Its unique ability to quantitatively integrate the multitude of drug- and system-dependent parameters that can influence an individual’s dose response has guided refined dosing in multiple clinical applications, particularly involving DDIs and special populations (Sager et al., 2015; Jamei, 2016).
Using PBPK modeling, Grillo et al. (2012) predicted clinically significant increases in rivaroxaban exposure due to renal impairment and moderate CYP3A4/P-gp inhibition by erythromycin. The findings informed current product labeling where concomitant use of rivaroxaban with a combined weak to moderate inhibitor of CYP3A4 and an inhibitor of P-gp and/or breast cancer resistance protein should be avoided under any degree of renal impairment. Given that such cautionary language hampers the utility of relevant drug combinations in AF management, Ismail et al. (2018) proposed dosing modifications in renal impairment and concomitant verapamil administration via correlating PBPK-predicted increases in rivaroxaban exposure with bleeding risk outcomes. Finally, Xu et al. (2018) interrogated the exacerbation of rivaroxaban DDIs by hepatic dysfunction.
Prior to application, a PBPK model must be qualified as fit for purpose (Shebley et al., 2018) (Fig. 1). The four principal aspects essential for robust model qualification are, namely, 1) evaluating model relevance to research context; 2) assessing sources of uncertainty and implications; 3) capturing known variabilities in clinical outcomes; and 4) ensuring that model results are qualitatively and quantitatively consistent with test data (Friedrich, 2016). Fulfilling the third and fourth criteria of the aforementioned aspects, our developed models demonstrated qualitative and quantitative reproduction of rivaroxaban’s essential clinical PK characteristics, such as rapid and near complete oral absorption, dose proportional increases in rivaroxaban exposure under fed conditions (Fig. 2, B and C), lack of accumulation upon multiple dosing (Kubitza et al., 2005a,b; Zhao et al., 2009), and true representation of interindividual variability (Jamei et al., 2009; US Food and Drug Administration, 2011a). Nevertheless, the intended application of the PBPK model of rivaroxaban to the interrogation of DDIs importantly entails that the first and second criteria are also adequately satisfied. Ensuring that the model scope is sufficiently mechanistic in delineating 1) the renal disposition of rivaroxaban and 2) inhibition of the metabolic/transport pathways of rivaroxaban elimination is required to facilitate rigorous identification and assessment of biologic uncertainties that may result in incongruities between predictions and actual outcomes.
Our PBPK model is novel and mechanistically detailed in parameterizing the renal disposition of rivaroxaban. Previously, its CLR value was defined as a function of glomerular filtration and net secretion (calculated as the difference between absolute secretion and absolute reabsorption) (Grillo et al., 2012; Ismail et al., 2018; Xu et al., 2018). Conflating these distinct processes precludes mechanistic characterization of their differential contributions to the CLR value of rivaroxaban. Additionally, by ascribing renal elimination of rivaroxaban to the apparent plasma compartment (i.e., minimal PBPK model), both Grillo et al. (2012) and Ismail et al. (2018) were unable to predict urinary excretion data for direct assessment of model-predicted CLR. The significance of such mechanistic detail is further underscored with in vitro evidence demonstrating how consideration of P-gp–mediated efflux and passive permeability produced adequate fits for high-permeability compounds (e.g., amprenavir and quinidine) but not for low-permeability substrates (e.g., loperamide and digoxin) (Acharya et al., 2008). For loperamide and digoxin, the observed efflux kinetics were substantially greater than could be fitted by passive permeability alone and improvement in fitting outcomes was contingent on the addition of a basolateral uptake transporter (Acharya et al., 2008). Consistently, evaluating the extent of passive permeability becomes diagnostic for the kinetic necessity of basolateral uptake (Lumen et al., 2013; Huang and Isoherranen, 2018). In this study, incorporating passive permeability (Ppass = 12.88 × 10⁻⁶ cm/s) (Table 5) estimates from three-compartment modeling yielded a CLPD value of 1.09 × 10⁻⁵ µl/min per 106 of cells when scaled using the tubular surface area. When considered in tandem with P-gp efflux kinetics (Table 5), the clinically observed CLR value of rivaroxaban remained underestimated by our simulation (Fig. 4A). Nevertheless, without independent verification of specific model assumptions governing passive diffusion clearance in the kidneys, it is inevitable that certainty in the quantitative contribution of active transport to renal clearance remains low and is interdependent on the error in predicted diffusion clearance (Huang and Isoherranen, 2018). Hence, using a 35-compartment mechanistic kidney model developed by Huang and Isoherranen (2018), where in vitro to in vivo predictions of renal clearance using plasma unbound fraction and permeability data have been systematically verified for a set of 46 compounds, we demonstrate that renal clearance predicted via the mechanistic kidney model in the Simcyp simulator was within 2-fold of that simulated using the 35-compartment model when a Ppass value of 12.88 × 10⁻⁶ cm/s was incorporated (Supplemental Table 8), verifying the passive diffusion component of the mechanistic kidney model constructed for rivaroxaban in this study.
With a verified passive diffusion process, the inability to recapitulate the CLR value of rivaroxaban can be thus confidently attributed to the presence of knowledge gaps in transporter-mediated clearance that impose constraints on the exclusive utilization of bottom-up approaches. In such scenarios, the utility of a middle-out approach has received increasing recognition (Rostami-Hodjegan, 2018). Using reverse translational modeling, clinical data of rivaroxaban obtained with coadministration of ketoconazole revealed surprising fold reductions in Vd/F (0.53) in addition to CL/F (0.39), such that the half-life was minimally affected (US Food and Drug Administration, 2011a). Coupled with experimental demonstration of rivaroxaban uptake in human OAT3-expressing cells, the convergence of evidences reinforces the plausibility of our postulated renal basolateral uptake process. Sensitivity analyses in this study further underscored the relative insensitivity of the observed CLR to the P-gp relative expression factor (Supplemental Fig. 8B) and confirmed that the sole inhibition of P-gp–mediated efflux is unlikely to produce significant increases in rivaroxaban’s systemic exposure (Fig. 6D; Supplemental Fig. 8A). Hence, it becomes apparent that reliable quantitative extrapolation of in vitro–derived OAT3-mediated values of Jmax and Km is essential to accurately define the renal excretion of rivaroxaban. With the emergence of quantitative transporter abundance data in kidney samples (reported OAT3 abundance of 3.5 ± 1.6 pmol/mg of total membrane protein) (Prasad et al., 2016), IVIVE scaling factors can be accurately determined, removing the need for top-down optimization (Supplemental Fig. 4), where estimates of OAT3 CLu,int may be biased based on the mean CLR and serum creatinine parameters defined.
Acknowledging the pivotal role of basolateral uptake in mediating the renal disposition of rivaroxaban enables informed analysis of the likelihood of observing transporter-mediated DDIs with rivaroxaban. A case in point would be verapamil, a known P-gp inhibitor that demonstrated in vitro inhibition of rivaroxaban’s efflux in L-MDR1 cells (Gnoth et al., 2011; US Food and Drug Administration, 2017). However, concomitant verapamil administration did not result in a significant decrease in rivaroxaban’s renal clearance, as highlighted in the DDI study by Greenblatt et al. (2018). This observation is substantiated by verapamil having a high mouse OAT3 Ki value of 31 µM (Ahn et al., 2009). Consistently, our in vitro experiments also demonstrated negligible inhibition of OAT3-mediated uptake of rivaroxaban by verapamil up to 100 µM (Supplemental Fig. 7H). Furthermore, examining the drugs that have been shown to produce significant transporter-mediated DDIs with rivaroxaban (i.e., ketoconazole and ritonavir) (Mueck et al., 2013) revealed in vitro evidence of OAT3 inhibition. Both ketoconazole and ritonavir inhibit estrone sulfate transport in transfected human embryonic kidney/OAT3 cell lines (IC50 = 0.86 and 8.1 µM for ketoconazole and ritonavir, respectively) (Vermeer et al., 2016; Shebley et al., 2017). When rivaroxaban was used as the probe substrate in this study, uptake inhibition by ketoconazole was also observed (Supplemental Fig. 7G). Nevertheless, further optimization of the Ki value of ketoconazole was required to recapitulate the clinically observed DDI magnitude (Fig. 6D; Tables 11–14). Our observed underprediction in transporter Ki remains aligned with previous attempts to recapitulate transporter-mediated DDIs for solute carriers (Hsu et al., 2014; Burt et al., 2016). Such incongruity may reflect the incorrect assumption of a competitive mode of inhibition. Additionally, although the assumed concentration for inhibition (that added to the incubation media) should be largely consistent with that at the transporter binding site, the lipophilic nature of ketoconazole could have resulted in nonspecific binding processes both in vitro and in vivo, further confounding interpretation of the inhibition data. Given that drugs likely to be coadministered with rivaroxaban have been reported to be P-gp inhibitors with unknown effects on OAT3-mediated uptake (e.g., amiodarone), elucidating the dynamic interplay between apical P-gp efflux and basolateral OAT3 uptake using alternative approaches such as double-transfected cell lines with rivaroxaban as the probe substrate becomes imperative.
Our second novelty lies in our adoption of rivaroxaban as the probe substrate when quantifying inhibition of metabolic and/or transport processes by verapamil and ketoconazole. In the previous PBPK-DDI model developed by Grillo et al. (2012), a Ki value of 11 µM derived from an in vitro study using digoxin as the substrate was used to describe the inhibitory potential of erythromycin on the P-gp–mediated efflux of rivaroxaban. However, Gnoth et al. (2011) reported that the directed efflux of rivaroxaban across P-gp–overexpressing L-MDR1 cells was unaffected by erythromycin. A clinical DDI study by Moore et al. (2014) further demonstrated negligible inhibition of the active renal secretion of rivaroxaban by erythromycin, underscoring how the nature and potency of DDIs are often unique to each substrate-inhibitor pair. This probe substrate specificity was similarly reflected in our in vitro experiments. For instance, verapamil has been reported to exhibit reversible inhibition against CYP2J2 when index substrates were used (Lee et al., 2012; Ren et al., 2013), but yielded minimal inhibition against CYP2J2-mediated metabolism of rivaroxaban (Supplemental Fig. 6, E–H; Table 10). Additionally, the in vitro MBI potencies of verapamil and norverapamil against CYP3A4 using index substrates were less potent (kinact/KI ratio of 0.9 and 1.74 h−1/µM−1, respectively) than our experimentally derived parameters when rivaroxaban was used as the probe substrate (kinact/KI ratio of 2.37 and 8.59 h−1/µM−1, respectively) (Supplemental Table 7). Finally, the in vitro reversible inhibition potency of ketoconazole against CYP3A4 using the index substrate was more potent (Ki value of 0.015 µM) than our experimentally measured potency using rivaroxaban as the substrate (Ki value of 0.094 µM) (Supplemental Table 7). Hence, it is evident that accurate recapitulation of enzyme- and transporter-mediated DDIs involving rivaroxaban is contingent on generating reliable in vitro inhibitory estimates for parameterization of the PBPK-DDI model.
The future intended application of the current PBPK model of rivaroxaban is in extrapolation to untested scenarios implicating both enzyme- and transporter-mediated DDDIs. Assuming the INH and investigating the effect of mild renal impairment alone, our simulated AUC and CLR fold changes of rivaroxaban fell within predefined success criteria (Fig, 4C; Table 9). Additionally, as presented in Supplemental Fig. 8C, alterations in either PTCPGK or transporter abundance (Supplemental Table 9), two independent pathophysiological mechanisms that have been proposed to account for the reduction in tubular secretion (Naud et al., 2011; Hsu et al., 2014), yielded comparable effects on the renal clearance of rivaroxaban. Hence, it is conceptually reasonable to predict transporter-mediated DDDIs in mild-to-moderate CKD by empirically applying a scaling factor to account for the linear reduction in tubular secretion in accordance with the GFR (either via PTCPGK or adjustment of transporter abundance) while accounting for inhibition against OAT3/P-gp–mediated transport. However, it is important to note that reductions in GFR and tubular secretion become disproportional in severe CKD, with the activity of OATs directly inhibited by uremic solutes at clinically relevant concentrations (Hsueh et al., 2016, 2018), Although rivaroxaban is currently contraindicated in severe CKD (creatinine clearance <30 ml/min), the possibility of expanding rivaroxaban use to such patients has been raised (Dias et al., 2016). Therefore, improved understanding of underlying mechanisms behind changes in tubular secretion in severe CKD is crucial.
In conclusion, the iteratively verified PBPK model of rivaroxaban is applicable to the investigation of enzyme and transporter-mediated DDDIs involving clinically relevant inhibitors and mild-to-moderate CKD, except in severe CKD where additional understanding of the effects of the pathophysiology on transporter-mediated processes is required.
Acknowledgments
The authors thank Dr. Kathleen Giacomini (University of California, San Francisco, CA) for the kind donation of the human OAT1- and human OAT3-transfected human embryonic kidney cell lines.
Authorship Contributions
Participated in research design: Cheong, Teo, Chua, Chan.
Conducted experiments: Cheong, Teo, Chua.
Performed data analysis: Cheong, Teo, Chua, Chan.
Wrote or contributed to the writing of the manuscript: Cheong, Teo, Chua, Chan.
Footnotes
- Received February 17, 2019.
- Accepted August 28, 2019.
↵1 E.J.Y.C., D.W.X.T., and D.X.Y.C. contributed equally to this work.
This work was supported by the Singapore Ministry of Education Tier 1 Academic Research Funding [Grant R-148-000-193-112] (to E.C.Y.C.); National University of Singapore (NUS) President’s Graduate Fellowship (to E.J.Y.C.); and NUS, Department of Pharmacy, Final Year Project Funding [Grant C-148-000-003-001] (to D.W.X.T. and D.X.Y.C.).
↵
 This article has supplemental material available at dmd.aspetjournals.org.

Abbreviations
- AF
- atrial fibrillation
- AUC
- area under the curve
- CKD
- chronic kidney disease
- CL
- clearance
- CL/F
- apparent clearance
- CLPD
- passive diffusion clearance
- CLR
- renal clearance
- CLu,int
- unbound intrinsic clearance
- CLu,int,T
- unbound intrinsic clearance of P-gp–mediated tubular secretion
- DDDI
- drug-drug-disease interaction
- DDI
- drug-drug interaction
- GFR
- glomerular filtration rate
- INH
- intact nephron hypothesis
- IVIVE
- in vitro to in vivo extrapolation
- Jmax
- maximum rate of active transport
- Km
- Michaelis constant
- MDCK
- Madin-Darby canine kidney
- MDR1
- multidrug resistance-1
- OAT
- organic anion transporter
- PBPK
- physiologically based pharmacokinetic
- P-gp
- P-glycoprotein
- PK
- pharmacokinetic
- Ppass
- passive permeability
- PTCPGK
- proximal tubular cells per gram of kidney
- Copyright © 2019 by The American Society for Pharmacology and Experimental Therapeutics


