


Abstract
Albumin has been suggested to enhance the hepatic uptake of organic anion-transporting polypeptide (Oatp) substrates in various in vitro as well as liver perfusion models. However, it is not known whether the interplay between albumin and Oatp substrates is an experimental artifact or if this interaction occurs in vivo. The objective of this work was to investigate the hepatic uptake of warfarin and pitavastatin, which are both extensively bound to albumin but only pitavastatin being an Oatp substrate. Experiments were conducted in Nagase analbuminemic rats (NAR) which exhibit reduced albumin levels compared with F344 (wild type, WT). The fraction unbound (fu) was 140- and 10-fold greater in NAR plasma for warfarin and pitavastatin, respectively, whereas no meaningful differences were observed with tissue binding. In vitro, pitavastatin uptake into hepatocytes reconstituted in WT plasma was 17- and 3-fold greater than when reconstituted in buffer or NAR plasma, respectively. In vivo, the free tissue-to-free plasma ratios (Kp,u,u) from brain and liver in intact WT and NAR were not significantly different for warfarin. Contrarily, liver Kp,u,u of pitavastatin was 6-fold higher in WT animals, which corresponded to a 2.3-fold reduction in free plasma and 2.6-fold increase in free liver exposure. These results suggest that the enhanced hepatic uptake by albumin is not necessarily an experimental artifact but is also a relevant phenomenon in vivo. This work raises the possibility that other plasma proteins may also effect the function of additional drug transporters, and that modulating plasma protein binding may exhibit meaningful clinical relevance in the disposition of drugs.
SIGNIFICANCE STATEMENT The interplay between albumin and Oatp substrates has been reported in hepatocytes and in liver perfusion studies, but the in vivo relevance of this interaction has yet to be elucidated. Using NAR and its corresponding WT animal, this study demonstrates that albumin may indeed enhance the hepatic uptake of pitavastatin in intact animals. In vivo demonstration of this interplay not only provides further justification for continued investigation into this particular mechanism but also raises the possibility that other plasma proteins may affect additional drug transporters and that modulating plasma protein binding may exhibit meaningful clinical relevance in the disposition of drugs.
Introduction
The fraction unbound in plasma (fu) is one of the key variables that is measured during drug discovery. There are several ways that fu values may be integrated into the characterization of compounds. For example, fu can be used to scale in vitro intrinsic clearance (CLint) to in vivo clearance (CL) (Obach, 1999; Jones et al., 2017). In addition, fu can be used to bridge in vitro biochemical potency to in vivo efficacious concentrations. Furthermore, species differences in fu can be incorporated to adjust preclinical efficacious concentration to determine a clinical efficacious target or to relate certain preclinical safety exposures to clinical exposure.
Molecules can bind to a variety of elements in plasma, with albumin being the most abundant plasma protein. Albumin is a water soluble anionic protein synthesized in the liver and is excreted out into the plasma in nonglycosylated form. In addition to serving as a carrier protein by binding to endogenous and exogenous molecules, the physiological role of albumin also has been reported, such as regulation of colloid osmotic pressure (Bjorneboe, 1945), sequestration of toxic molecules such as bilirubin (Schmid et al., 1965; Brodersen, 1979), and its function as an antioxidant (Brown et al., 1989; Deigner et al., 1992).
The Nagase analbuminemic rat (NAR) model has been described to be deficient in its levels of albumin (Nagase et al., 1979). When compared with its corresponding wild type (WT) strain Fischer 344 (F344), the serum albumin levels in the NAR model are less than 5%–10% of WT as determined with Western blot analysis (S. Gupta from Albert Einstein College of Medicine, personal communication) and are less than 2000-fold of WT when quantifying rat albumin with ELISA (Supplemental Fig. 3). Instead, cholesterol and triglyceride concentrations in the NAR models are elevated, and as a result, NAR animals develop hyperlipidemia. Additionally, in tissues such as the liver and kidneys, albumin is not detected (Sugiyama et al., 1980).
Therefore, NAR is an intriguing model to investigate the role of albumin in various physiological and pharmacological processes. For instance, studies with mycophenolic acid showed that while the total exposure was 29-fold higher in the WT animals compared with NAR, the free exposures were comparable. Accordingly, the inhibition of inosine-5ʹ-monophosphate dehydrogenase by mycophenolic acid was not significantly changed between the WT and NAR animals, underscoring that the target engagement is driven by the free drug (Yoshimura et al., 2015).
The free drug hypothesis assumes that only free drug is able to interact with the pharmacological target (Mendel, 1989), serving as the rationale for incorporating fu in profiling the properties of drugs. Plasma protein binding is used to determine free drug concentrations. CLint is a measure of the ability for a particular system to eliminate compounds without limitations of blood flow or of binding to cells or proteins in blood. However, several studies have implied that albumin may alter the disposition of compounds, particularly for compounds that are substrates for uptake transporters such as organic anion-transporting polypeptide (Oatp) substrates.
For example, in the bile-ducted cannulated model, biliary secretion of bilirubin was markedly higher in WT compared with NAR animals after administration of a high concentration of bilirubin (Inoue et al., 1985). In addition, in the rat liver perfusion model, the hepatic uptake of fatty acids and bile acids such as oleic acid and taurocholic acid was higher in the presence of albumin (Forker and Luxon, 1981; Weisiger et al., 1981). In vitro, when compared with incubations conducted in buffer, statins that are highly bound to plasma proteins such as atorvastatin and pitavastatin demonstrated greater uptake into hepatocytes in the presence of plasma or albumin (Miyauchi et al., 2018; Bowman et al., 2019; Kim et al., 2019).
Many reports regarding the potential effect of albumin on hepatic uptake have been studied in surgically modified animal models or with in vitro systems. Our current work evaluated the impact of albumin on the hepatic uptake of warfarin and pitavastatin in intact WT and NAR animals. Warfarin and pitavastatin were chosen because both drugs are extensively bound to plasma proteins, particularly to albumin, but pitavastatin is highly dependent on Oatp transporters for elimination from the body.
Materials and Methods
Materials.
Warfarin sodium was purchased from Sigma-Aldrich (St. Louis, MO), and pitavastatin calcium was purchased from Cayman Chemical (Ann Arbor, MI). Propranolol was purchased from Sigma-Aldrich. All other chemicals and reagents were of analytic grade and were purchased from Sigma-Aldrich, unless specified otherwise.
Plasma Protein Binding and Tissue Binding.
Plasma, brain, and liver harvested from F344 (WT) and NAR animals were used to determine the binding of warfarin and pitavastatin. Experiments were conducted using a single-use RED plate with inserts (Thermo Fisher Scientific, Rockford, IL) with the following setup as described elsewhere (Chen et al., 2019), which enabled robust and reliable determination of fu for highly bound compounds. The positive control used in the current work was tolbutamide (internal historic coefficient of variation of 13%).
In brief, 300 μl of plasma or tissue homogenate was spiked with drug on the donor chamber and 500 μl PBS containing 133 mM potassium phosphate and 150 mM NaCl on the receiver chamber. Plasma protein-binding and tissue-binding experiments were performed at a final concentration of 5 and 1 μM, respectively, in a shaking incubator at 37°C with 5% CO2 at 450 rpm (VWR Symphony, Avantor, Radnor, PA). Experiments were conducted in triplicate using 100% plasma or 20% tissue homogenate in PBS buffer, and binding values for tissue homogenates were then extrapolated to 100% using the following equation: where fu,tissueʹ is fraction unbound determined with 20% tissue homogenate, and fu,tissue is the fraction unbound when extrapolated to 100%. After 6 hours of incubation, an aliquot was sampled from the RED device and equalized with equal amount of either plasma/tissue homogenate or PBS buffer (buffer was added to donor side and plasma/tissue homogenate was added to receiver side). The samples were then quenched in 1:3 (sample:acetonitrile) ratio with ice-cold high-pressure liquid chromatography (HPLC)–grade acetonitrile (EMD Millipore, Billerica, MA) with propranolol as the internal standard. The resulting mixture was shaken for 15 minutes at 500 rpm (Compact Digital MicroPlate Shaker; Thermo Scientific), and the supernatant was collected by centrifuging for 15 minutes at 3750 rpm (Allegra × 12R; Beckman Coulter).
Subsequently, the supernatant was diluted further 1:1 with HPLC grade water (J.T. Baker, Center Valley, PA) for liquid chromatography with tandem mass spectrometry (LC-MS/MS) analysis. The fu was calculated by dividing the peak area from the receiver chamber by the peak area from the donor chamber.
Hepatocyte Uptake.
Pooled male F344 rat hepatocytes (Lot: OAE; BioIVT, Westbury, NY), at a density of 2 million cells/ml, were reconstituted in protein-free Krebs-Henseleit buffer (pH 7.4), or in plasma collected from WT and NAR animals. Rat hepatocytes in the various suspensions were preincubated at 37°C for 10 minutes.
To initiate the reaction, an equal volume of pitavastatin solution (2 µM) prepared in buffer, NAR plasma, or WT plasma was added to the hepatocyte suspension. The final incubation volume was 500 µl, constituting of 1 million rat hepatocytes/ml and a nominal drug concentration of 1 µM. At 20, 45, 90, and 120 seconds, 100 µl aliquots were sampled and centrifuged at 12,000 rpm for 10 seconds. The supernatant and hepatocyte pellets were quenched in acetonitrile containing propranolol as an internal standard. The samples were analyzed by LC-MS/MS.
In Vivo Free Tissue to Free Plasma Ratio (Kp,u,u).
All in vivo studies performed were approved by the Institutional Animal Care and Use Committee at Genentech, Inc. (South San Francisco, CA). The free liver to plasma ratio (Kp,u,u) was determined as described elsewhere with minor modifications (Chang et al., 2019). Briefly, 12 male rats of each strain of F344 (background strain of NAR; Charles River Laboratories, Wilmington, MA) or NAR (Albert Einstein College of Medicine of Yeshiva University, Bronx, NY) were used for each compound to determine the tissue and plasma concentrations and the tissue-to-plasma ratios. The F344 rats weighed between 197 and 235 g, and NAR weighed between 197 and 261 g.
Warfarin prepared in 10% DMSO/50% polyethylene glycol 400/40% PBS was administered as a single intravenous bolus dose of 1 mg/kg with a dose volume of 2 ml/kg. Pitavastatin prepared in 10% DMSO/50% polyethylene glycol 400/40% water was administered as a single intravenous bolus dose of 0.5 mg/kg with a dose volume of 2 ml/kg. The animals were not fasted before dosing. Three animals/time point were euthanized by exsanguination under isoflurane anesthesia at 0.25, 0.5, 2, and 8 hours after the dose to collect blood, brain, and liver tissues.
The blood was centrifuged at 1500–2000g at 2–8°C to harvest plasma within 1 hour of collection. The tissue samples were diluted 1:4 weight (g) by volume (ml) with water and homogenized using the BeadBeater (BioSpec Products, Bartlesville, OK).
LC-MS/MS Analysis.
Warfarin and pitavastatin concentrations were quantitated in blood, brain, and liver tissues via LC-MS/MS, which included a Shimadzu CBM-20A controller with SIL-30AD pumps, a Shimadzu Nexera ×2 autosampler with a CTO-20AC column oven (Shimadzu, Columbia, MD), and a Sciex QTrap 6500+ mass (Framingham, MA). Chromatographic separation for all samples was achieved with a Phenomenex kinetex XB-C18 column (30 × 2 mm, 100 Å, 2.6 μm particle size) at a flow rate of 1 ml/min with gradient elution using mobile phases of water with 0.1% formic acid (A) and acetonitrile with 0.1% formic acid (B). The HPLC gradient was 3% B for the first 0.1 minutes and was ramped up to 95% B from 0.10 to 0.35 minutes. The gradient was maintained at 95% B for 0.50 minutes before returning to initial composition of 3% B within 0.65 minutes. The total runtime was 2 minutes.
The concentrations of warfarin and pitavastatin were determined using multiple reaction monitoring in the positive ion mode. The following multiple reaction monitoring transitions were monitored: m/z 422.1→290.1 for pitavastatin, m/z 309.1→163.2 for warfarin, and m/z 260.1→116.1 for propranolol, which was the internal standard. The lower limit of quantitation for warfarin was 0.00989 µM, 0.00331 nmol/g, and 0.0296 nmol/g in plasma, brain, and liver, respectively; pitavastatin was 0.00242 µM, 0.0121 nmol/g, and 0.0121 nmol/g, respectively.
Data Analysis.
The mean concentrations measured in plasma and tissue homogenates were used to construct a semilogarithmic plasma concentration–time curve. The significance of difference was determined with unpaired t test using GraphPad Prism 7 (GraphPad Software, La Jolla, CA). Mean (±S.D.) was reported, and P < 0.05 was considered statistically significant.
The free plasma and free tissue concentrations from individual animals were used to construct a composite area under the free concentration–time curve from 0 to 8 hours (AUC0–8 hour). AUC0–8 hours was determined by noncompartmental methods using Phoenix WinNonlin, version 6.4 (Pharsight Corporation, Mountain View, CA). Because the AUC0–8 hours was calculated with a composite profile, standard deviation of the AUC0–8 hours values could not be generated. The free tissue to free plasma partitioning ratio (Kp,u,u) was determined by dividing the free tissue AUC0–8 hours by free plasma AUC0–8 hours, or by dividing the free tissue concentration by free plasma concentration.
CLint was determined from the concentration of pitavastatin measured in the hepatocyte uptake assay by calculating the percent of pitavastatin depleted in the incubation medium between 0 and 120 seconds. Unbound CLint was calculated by dividing CLint by fu determined from NAR and WT plasma. The fu for buffer was assumed to be 1.0. Mean (+S.D.) was reported, and P < 0.0005 calculated from one-way ANOVA followed by Tukey’s post hoc test using GraphPad Prism 7 was considered statistically significant.
Results
Binding of Warfarin and Pitavastatin in Plasma, and in Brain and Liver Homogenates.
We determined the binding of warfarin and pitavastatin to plasma as well as to homogenates prepared from brain and liver harvested from WT and NAR animals. Table 1 summarizes that in the WT animals warfarin and pitavastatin were highly bound to plasma, with the fraction unbound in plasma (fu,plasma) at 0.0031 and 0.0079, respectively. In NAR animals, fu,plasma for warfarin increased 140-fold to yield 0.43, whereas fu,plasma for pitavastatin increased 10-fold to yield 0.078.
Summary of fraction unbound (fu) values of warfarin and pitavastatin in plasma, brain, and liver of F344 (wild type) and Nagase analbuminemic rats (NAR)
In the brain homogenates prepared from WT animals, the fraction unbound (fu,brain) was 0.24 and 0.022 for warfarin and pitavastatin, respectively. Unlike with plasma, the fu,brain of warfarin and pitavastatin was not markedly different between the WT and NAR animals.
The fraction unbound measured in liver homogenates (fu,liver) prepared from WT animals for warfarin and pitavastatin was 0.078 and 0.023, respectively, which was not meaningfully different from the fu,brain. In addition, as observed with the fu,brain, the values for fu,liver between WT and NAR animals were comparable.
In Vitro Uptake of Pitavastatin into Hepatocytes Suspended in Buffer, and in Plasma from WT and NAR Animals.
The uptake experiments were conducted in hepatocytes reconstituted in buffer or in plasma from WT and NAR animals. Because the initial experiments indicated that the total uptake of warfarin into hepatocytes was rapid and reached steady-state before the first technical feasible time point of 15 seconds, no further experiments were conducted due to the inability to accurately measure CLint. This inability to measure earlier time points is a limitation of the current in vitro assay.
Figure 1 shows that the unbound CLint of pitavastatin uptake into hepatocytes reconstituted in buffer was 160 ± 40 µl/min per million cells, which was not statistically significant from hepatocytes reconstituted in NAR plasma at 510 ± 130 µl/min per million cells. However, the pitavastatin uptake into hepatocytes reconstituted in WT plasma was greater than when the hepatocytes were resuspended in buffer or NAR plasma at 2800 ± 1100 µl/min per million cells, indicating that albumin was enhancing pitavastatin uptake into hepatocytes. The 17-fold increase in unbound CLint between WT and buffer for pitavastatin is comparable to what has been shown with plasma and albumin (Miyauchi et al., 2018; Bowman et al., 2019).

CLint of pitavastatin uptake into F344 rat hepatocytes suspended in buffer, WT plasma, or NAR plasma (N = 4). Yellow bar represents hepatocytes reconstituted in buffer, purple bar represents hepatocytes reconstituted in WT plasma, and orange bar represents hepatocytes reconstituted in NAR plasma. Data are presented as mean ± S.D. *P < 0.0005, statistical difference based on one-way ANOVA; n.s., not statistically significant.
Brain and Liver Partitioning of Warfarin and Pitavastatin in Intact WT and NAR Animals.
After intravenous administration of warfarin and pitavastatin to WT and NAR animals, the plasma concentration and the compounds’ distribution into brain and liver were measured at multiple time points between 0.25 and 8 hours. Total concentrations were converted to free concentrations by incorporating the appropriate fu accordingly to the corresponding biological matrix.
Figure 2 describes the free concentration–time profile of warfarin in WT and NAR animals, and the total concentration–time profiles are shown in Supplemental Fig. 1. In both strains, the free concentration–time profiles were similar among plasma, brain, and liver. In WT, Fig. 2A indicates that the elimination of warfarin was slow; the free concentration remained relatively unchanged up to 8 hours. By contrast, Fig. 2B shows that the free concentration of warfarin in plasma, brain, and liver declined over time, with a half-life between 2 and 4 hours.

Free concentration–time profile of warfarin after 1 mg/kg intravenous administration in (A) WT animals and (B) NAR animals (N = 3). Circle with solid green line represents plasma, square with solid maroon line represents brain, and triangle with broken blue line represents liver. Data are presented as mean ± S.D.
The free concentration–time profiles of pitavastatin in WT and NAR animals are shown in Fig. 3, and the total concentration–time profiles are shown in Supplemental Fig. 2. Similar to warfarin, the shape of the free plasma and free liver concentration–time profiles of pitavastatin was comparable in both strains. The brain levels of pitavastatin were not reported because the concentrations were below the limit of quantitation. In both WT and NAR animals, pitavastatin was quickly eliminated from the plasma and liver, with a half-life between 1 and 2 hours.
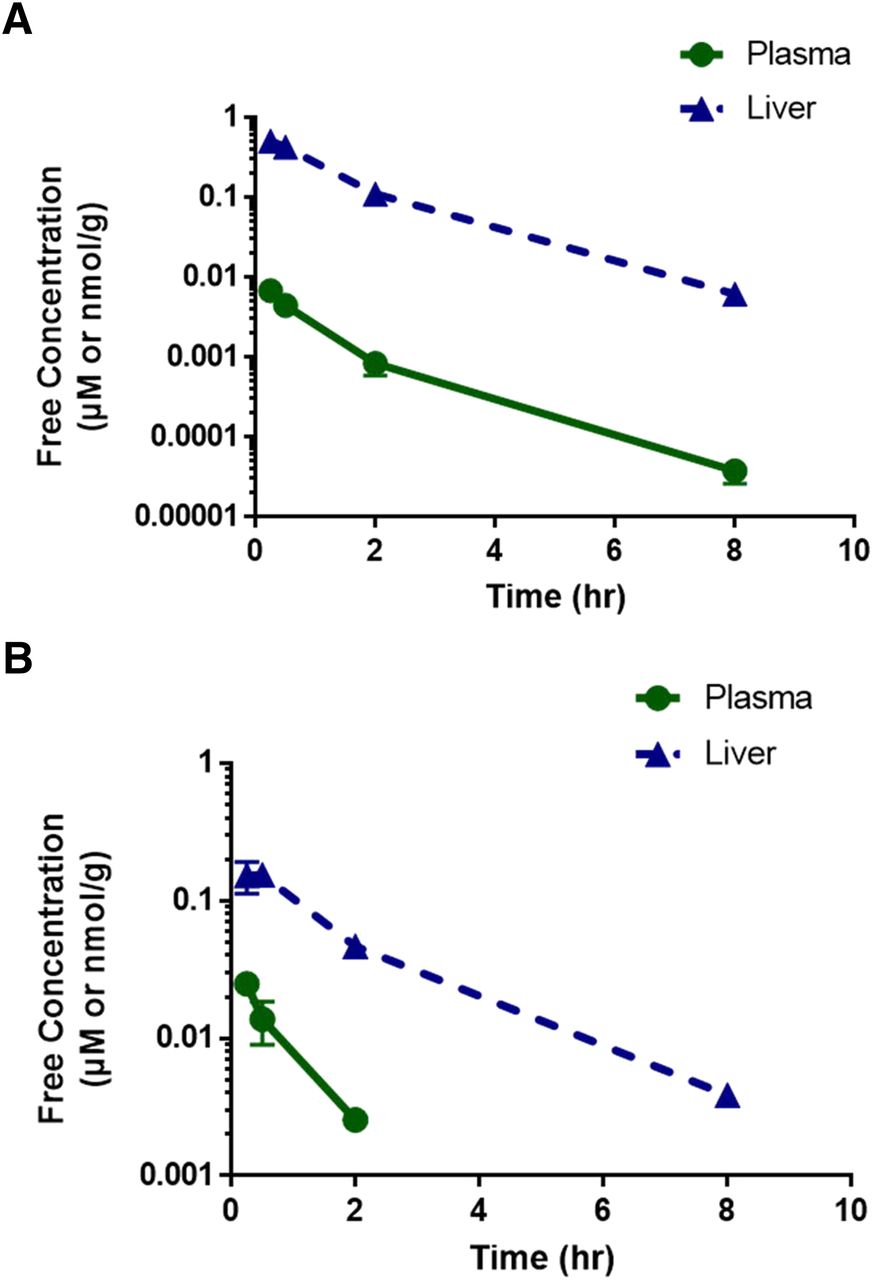
Free concentration–time profile of pitavastatin after 1 mg/kg intravenous administration in (A) WT animals and (B) NAR animals (N = 3). Circle with solid green line represents plasma, and triangle with broken blue line represents liver. Data are presented as mean ± S.D.
We measured the warfarin and pitavastatin concentrations in plasma, brain, and liver from individual animals at multiple time points. Plots of the free tissue-to-free plasma ratio (Kp,u,u) at each time point are shown in Fig. 4. The brain and liver Kp,u,u for warfarin and pitavastatin in WT and NAR animals remained relatively constant over the various time points, which is a reflection of the free concentration–time profile being similar between plasma and tissues. The warfarin Kp,u,u of the brain and liver from WT animals was approximately 0.8–1 and 7–10, respectively. In NAR, the Kp,u,u of the brain and liver was approximately 0.4–1 and 4–10, respectively; thus, no significant differences were observed between WT and NAR for the brain and liver Kp,u,u of warfarin. However, for pitavastatin, the liver Kp,u,u in WT was approximately 75–130, which was significantly higher than what was determined in the NAR at approximately 6–18.

Free tissue-to-free plasma ratio (Kp,u,u) at 0.25, 0.5, 2, and 8 hours for (A) warfarin in brain, (B) warfarin in liver, and (C) pitavastatin in liver. Pitavastatin brain Kp,u,u is not available because the concentrations were below the limit of quantitation. Orange bars represent WT animals, and purple bars represent NAR animals. Data are presented as mean ± S.D. *P < 0.05, statistical difference based on unpaired t test.
Concentrations at the various time points were used to construct a composite concentration–time profile to calculate the area under the curve from 0 to 8 hours (AUC0–8 hours). As summarized in Table 2, the free AUC0–8 hours for warfarin in plasma, brain, and liver from WT animals was 0.82 µM*hour, 0.73 nmol/g*hour, and 6.9 nmol/g*hour, respectively. Exposure of warfarin in NAR animals was less than 2-fold of the WT animals and was not meaningfully different. The free AUC0–8 hours for pitavastatin in plasma and liver from WT animals was 0.0088 µM*hour and 0.93 nmol/g*hour, respectively. In NAR animals, the free plasma AUC0–8 hours was 2.3-fold higher to yield 0.020 µM*hour, whereas the free liver AUC0–8 hours was 2.6-fold lower to yield 0.36 nmol/g*hour.
Summary of total AUC0–8 hours, free AUC0–8 hours, and Kp,u,u of warfarin and pitavastatin in plasma, brain, and liver in F344 (wild type) and NAR animals (N = 3)
The AUC0–8 hours was a composite constructed from three independent measurements. Units for brain and liver AUC0–8 hours is nmol/g*h; units for plasma AUC0–8 hours is µM*h.
Free AUC0–8 hours values were used to calculate the free tissue-to-free plasma ratio (Kp,u,u). The warfarin Kp,u,u in WT animals was 0.89 and 8.4 in brain and liver, respectively, whereas the Kp,u,u was approximately 2-fold lower in the NAR animals at 0.43 and 0.44 in brain and liver, respectively. The pitavastatin Kp,u,u in WT liver was 110. However, the Kp,u,u decreased 6-fold in NAR liver to 18.
Discussion
Plasma protein binding is measured to determine the free drug levels that are available to engage pharmacological target(s), which is based on the premise of the free drug hypothesis. CLint is the inherent ability of a particular system to eliminate compounds without being limited by blood flow or binding to cells or proteins in blood. However, various studies have insinuated that albumin, the most abundant plasma protein, may modulate CLint. For example, there have been several reports of albumin augmenting the CLint of drug-metabolizing enzymes such as the cytochrome P450 enzymes CYP2C9 (Tang et al., 2002), CYP2C8 (Wattanachai et al., 2011), CYP1A2 (Wattanachai et al., 2012), and UDP-glucuronosyltransferases (Rowland et al., 2007; Kilford et al., 2009).
Further investigations have indicated that long-chain unsaturated fatty acids released from the in vitro membrane during incubation attenuated metabolic activity, and that albumin was sequestering these inhibitory fatty acids to boost metabolism. This interaction between albumin and fatty acids to affect CLint is an in vitro artifact that is not relevant in vivo. As such, the practice of supplementing albumin to in vitro metabolism incubations has been employed to improve the in vitro to in vivo correlation (IVIVC) of clearance.
In addition to drug-metabolizing enzymes, there has been growing evidence to suggest that albumin may facilitate in vitro uptake into hepatocytes, mediated by Oatp transporters. Our work investigated whether the increased uptake into hepatocytes in the presence of albumin is also an experimental artifact or this phenomenon occurs in vivo as well. Warfarin and pitavastatin were chosen as probe substrates because both compounds are extensively bound to albumin but pitavastatin is a strong substrate for Oatp. Hepatic uptake was monitored in NAR and in F344, its corresponding WT animals.
To evaluate whether NAR animals would be an appropriate model to investigate the effect of albumin on hepatic uptake, the binding of warfarin and pitavastatin were compared between NAR and WT animals. Table 1 shows that warfarin and pitavastatin are highly bound to WT plasma, but the extent of binding in NAR plasma was reduced by 140- and 10-fold, respectively, which corroborates the lower expression of albumin in NAR animals. By contrast, there was no meaningful difference in their binding to tissues, which is consistent with studies showing that, unlike binding to plasma, binding to tissues is species-independent (Summerfield et al., 2008; Liu et al., 2018; Riccardi et al., 2018).
The likely reason for the disparity in binding pattern between plasma and tissues is that binding to tissues is driven by nonspecific binding whereas binding to albumin is mediated by specific binding sites (Sudlow et al., 1975). Consequently, the distinct modalities of binding suggest that binding to tissues is not necessarily equivalent to binding to plasma proteins and is dependent on the properties of the compound.
Indeed, in our current work with warfarin and pitavastatin, the ratio of fu,plasma to fu,liver in WT animals was 7.5-fold higher for pitavastatin than for warfarin at 0.3 and 0.04, respectively. However, in the absence of albumin in the NAR animals, the fu,plasma to fu,liver ratio of pitavastatin and warfarin converged at 4.3 and 4.4, respectively. Similarly in the brain, the ratio of fu,plasma to fu,brain in WT animals was 40-fold higher for pitavastatin than for warfarin but became more comparable in the NAR animals. This analysis also implies that rather than total ratios, Kp,u,u is the more appropriate parameter to estimate free tissue availability, as has been suggested previously (Yabe et al., 2011; Yoshikado et al., 2017).
In addition, the unbound CLint of pitavastatin uptake into hepatocytes (shown in Fig. 1) was significantly greater in the presence of WT plasma than in buffer or NAR plasma. Thus, the differences in binding between WT and NAR plasma and the increased uptake of pitavastatin in hepatocytes suspended in WT plasma demonstrated the utility of the NAR model to evaluate the potential impact of albumin on hepatic uptake.
Figure 4, A and B, shows that the Kp,u,u of warfarin for the brain and liver was not significantly altered between WT and NAR animals. Nevertheless, it is worth noting that while not statistically significant, the warfarin uptake was approximately 2-fold greater in WT. It has been reported that warfarin is a substrate for human OAT2 (Bi et al., 2018); accordingly, we found that the hepatic Kp,u,u was greater than unity. It is not known whether the unexceptional impact of albumin on warfarin hepatic uptake is because the interplay between albumin and OAT2 is inconsequential or because OAT2 is not the rate-limiting step in warfarin elimination due to the rapid uptake of warfarin, as observed in the in vitro experiment. Further investigations are needed to understand the role of OAT2 on the overall disposition of warfarin.
Albumin significantly increased the hepatic uptake of pitavastatin across all time points. When considering the composite AUC0–8 hour, we found that the Kp,u,u was approximately 6-fold higher in WT than in NAR animals, as more free pitavastatin in the plasma was accompanied by less free pitavastatin in the liver of NAR animals by 2.3- and 2.6-fold, respectively.
Besides their albumin levels, there are several other dissimilarities between WT and NAR animals. For example, the reduced albumin is partly compensated for by higher cholesterol and triglyceride concentrations, which leads to hyperlipidemia in NAR animals (Nagase et al., 1979). It has also been shown that Cyp1a protein expression is greater in NAR animals (Kim et al., 2003), which may partly explain why the half-life of warfarin, whose metabolism is partially contingent on Cyp1a, is longer in the WT animals. No changes in the expression of efflux transporters such as P-glycoprotein and multidrug resistance-associated protein 2 have been reported (Abe et al., 2008), although additional work is needed to examine the expression of Oatp transporters in these models. Furthermore, although no striking differences have been noted with physiological parameters such as hematocrit and mean arterial/venous blood pressure (Renkin et al., 1993), the NAR animals are associated with increases in liver weight by 10% (Kim et al., 2003) and plasma volume by 22% (Renkin et al., 1993).
These differences suggest that the central volume is dissimilar between the two models, which may partly explain the significantly higher concentration observed with warfarin in WT animals at the first sampling time point. However, despite these differences, we found the overall effect on warfarin Kp,u,u was inconsequential. Taken together, these data provide further evidence to strengthen the claim that albumin may enhance the hepatic uptake of pitavastatin (Miyauchi et al., 2018; Bowman et al., 2019; Kim et al., 2019); and importantly, this is the first in vivo evidence demonstrating the impact of albumin on the hepatic uptake of pitavastatin in intact animals.
Interplay between albumin and hepatic uptake has been previously described in liver perfusion models such as with taurocholate (Forker and Luxon, 1981). However, while liver perfusion is a powerful method to study liver disposition, the albumin effect has been typically evaluated by adding exogenous albumin, which may deviate the system from physiological conditions and obfuscate the experiment. For example, the albumin effect with warfarin was only evident when exogenous albumin was added to the system: the uptake CLint,u of warfarin increased by 9- and 11-fold in the presence of 1.6 g/dl of bovine serum albumin (Tsao et al., 1986).
Meanwhile, one benefit of the current experimental design is that the role of albumin was evaluated in an in vivo system where the physiological system was intact and without perturbation to the model. Another merit of this work with intact animals is that, unlike with drug-metabolizing enzymes, it shows that the albumin effect is not an in vitro artifact. Therefore, a modification to supplement albumin is not to overcome challenges of the in vitro system to enhance CLint to improve IVIVC, but to optimize the in vitro system to better mirror in vivo conditions.
Moreover, if the albumin effect is indeed a relevant in vivo phenomenon, these data raise the possibility that altering plasma protein binding may have meaningful clinical relevance to alter drug disposition for drugs such as pitavastatin. For example, albumin levels have been shown to be lower in patients with severe liver disease or renal impairment. Similar to our observations in our current study, pitavastatin exposures were higher in patients with Child-Pugh grade B cirrhosis (Hui et al., 2005) compared with healthy volunteers. Pitavastatin exposures were also higher in severe renal impairment patients (Morgan et al., 2012); however, because uremic toxins have been shown to inhibit OATP transporters (Sato et al., 2014), additional studies are needed to distinguish whether the changes are due to an “albumin effect” or to a direct inhibition of OATP transporters.
In summary, this work in WT and NAR models with distinct albumin expression was employed to illustrate the interplay between albumin and hepatic uptake of pitavastatin. Hepatic uptake of pitavastatin was reduced in NAR animals, which exhibit lower expression of albumin; this indicated that the albumin effect on hepatic uptake was not an experimental artifact but a pertinent mechanistic process in vivo. This finding provides further rationale to continue studying the potential mechanism of the interplay between albumin and Oatp transporters.
There are already several hypotheses that have been proposed to describe the interplay between albumin and Oatp transporters. Our work is not able to provide additional insight into the various proposals, but data showing that both albumin and glutathione can augment the hepatic uptake of bilirubin (Inoue et al., 1985) suggest that the observed interaction may not be restricted to albumin and Oatp. It is conceivable that there are other plasma proteins such as α-acid glycoprotein that can enhance the activity of additional transporters facing the blood compartment.
In addition, the impact of albumin-facilitated uptake of Oatp substrates may be less pronounced for compounds that are not as extensively bound to plasma protein, as exemplified with compounds such as with pravastatin (Bowman et al., 2019). As such, experiments are ongoing in our laboratory to investigate some of these potential interactions with an expanded set of compounds across various compartments, including the blood–brain barrier and the kidneys, and to study whether modulation of plasma protein binding can in fact exhibit meaningful clinical relevance in the disposition of drugs.
Acknowledgments
The authors wish to thank Drs. Matthew Wright, Matthew Durk, and Fabio Broccatelli for the insightful discussions and careful review of the manuscript. The authors also would like to thank Dr. Sanjeev Gupta at the Albert Einstein College of Medicine for his helpful information regarding the NAR animals.
Authorship Contributions
Participated in research design: Chang, Chen, Cheong, Pang.
Conducted experiments: Chen, Cheong, Jones, Pang.
Performed data analysis: Chang, Chen, Cheong, Jones, Pang.
Wrote or contributed to the writing of the manuscript: Chang, Chen, Cheong, Jones, Pang.
Footnotes
- Received June 11, 2019.
- Accepted September 3, 2019.
↵
 This article has supplemental material available at dmd.aspetjournals.org.

Abbreviations
- AUC0–8 hours
- area under the curve from 0 to 8 hours
- CL
- in vivo clearance
- CLint
- intrinsic clearance
- CLint,u
- unbound intrinsic clearance
- CYP
- cytochrome P450 enzyme
- fu
- fraction unbound
- HPLC
- high-pressure liquid chromatography
- IVIVC
- in vitro to in vivo correlation
- Kp,u,u
- free tissue-to-free plasma partition ratio
- LC-MS/MS
- liquid chromatography with tandem mass spectrometry
- NAR
- Nagase analbuminemic rat
- Oatp
- organic anion-transporting polypeptide
- WT
- wild type
- Copyright © 2019 by The American Society for Pharmacology and Experimental Therapeutics


