


Abstract
Understanding the quantitative implications of P-glycoprotein and breast cancer resistance protein efflux is a key hurdle in the design of effective, centrally acting or centrally restricted therapeutics. Previously, a comprehensive physiologically based pharmacokinetic model was developed to describe the in vivo unbound brain-to-plasma concentration ratio as a function of efflux activity measured in vitro. In the present work, the predictive utility of this framework was examined through application to in vitro and in vivo data generated on 133 unique compounds across three preclinical species. Two approaches were examined for the scaling of efflux activity to in vivo, namely relative expression as determined by independent proteomics measurements and relative activity as determined via fitting the in vivo neuropharmacokinetic data. The results with both approaches indicate that in vitro efflux data can be used to accurately predict the degree of brain penetration across species within the context of the proposed physiologically based pharmacokinetic framework.
Introduction
Access of xenobiotics to the central nervous system (CNS) is limited largely by the blood–brain barrier (BBB) in microvessels of the brain (Abbott et al., 2010). The endothelial cells in these vessels are connected by tight junctions limiting paracellular penetration. They have reduced pinocytosis, making passive permeability the major transcellular route of movement of lipophilic drugs into the brain. However, the brain microvascular endothelium is also enriched with polarized transporters. Efflux transporters such as P-glycoprotein (P-gp; also commonly referred to as multi-drug resistance protein 1, MDR1) and breast cancer resistance protein (BCRP) efflux a diversity of passively permeable drug molecules back into the blood, and solute carrier proteins are thought to primarily bring polar nutrients into the brain.
Understanding these complex active and passive processes of movement into and out of the brain is critical to determining the rate and extent of drug penetration into the CNS and to designing effective, centrally acting or safe centrally restricted therapeutics. Given its importance in the discovery and development of therapeutics intended to be active in the brain, the topic has been well reviewed (Mensch et al., 2009; Bicker et al., 2014; Stanimirovic et al., 2015). The concept of using efflux transporters to restrict access to the CNS and avoid toxicity has also been reviewed (Bagal and Bungay, 2014). To date, most drug discovery optimization paradigms have relied heavily on in vitro transporter assays and rodent neuropharmacokinetic evaluation, which provide a qualitative assessment of human brain penetration (Di et al., 2013). A quantitative prediction of clinical CNS drug penetration that integrates efflux from multiple transporters would be an enhancement to decision making.
Physiologically based pharmacokinetic (PBPK) models simplify complex systems to describe them quantitatively. The resulting equations contain two types of parameters: those that characterize the biologic system and those that capture aspects of the compound generally. The former inputs can be altered to enable translation across species, and the latter can describe a wide range of chemical matter. The ultimate utility of PBPK approaches, however, rests on one’s ability to capture the physiology and parameterize the models accurately.
Parameterization can be accomplished by either relying on physiologic scaling or fitting a large data set to extract the requisite scaling factors to support in vitro–in vivo extrapolation (IVIVE). Each method has its merits and pitfalls. Direct physiologic scaling assumes that the model structure is perfect and that the data used to inform the model are both accurate and representative. These assumptions do not hold generally. For example, the permeability–surface area product at the BBB might be estimated by multiplying in vitro permeability by the surface area of the vasculature. In vitro permeability can be limited by diffusion through an unstirred water layer to the surface of the cells. In contrast, the unstirred water layer is vanishingly small in vivo, owing to the convection of blood through relatively narrow microvasculature. Thus, the in vitro data may not be reflective generally.
When coupled with uncertainty around the precise surface area of the BBB, this disconnect can lead to poor model performance. The second method can compensate for these shortcomings through estimating scaling factors, such as by fitting a brain-uptake–index data set directly. The main caveats of such scaling center around how representative the underlying data are, and whether scaling is convolving together various sources of uncertainty (such as physiology, input parameter, and model structure). The fits are somewhat empirical rather than mechanistic, which can lead to inaccuracy when extrapolating to species lacking data. Moreover, the scaling factors may lead to poor predictions for chemical matter that differ meaningfully from the training set.
The present work compares both approaches to scaling transporter activity at the BBB for BCRP and P-gp, two promiscuous active transporters that impact many current drugs and drug-like chemical space. The caveats for each parameterization strategy are made explicit. In the end, both methods yield similar results lending confidence to the overall utility and robustness of the model.
Materials and Methods
Materials
Sprague-Dawley rat tissue (brain and plasma) were used in these binding studies and were obtained from Pel-Freez Biologicals (Rogers, AR). The MDR1-MDCK (multidrug resistance protein 1/Madin-Darby canine kidney) cells were obtained from the National Institutes of Health (Baltimore, MD). The murine mBCRP-MDCK cells were obtained from XenoPort (Santa Clara, CA). Test compounds used in these experiments were obtained from Pfizer global compound management or purchased from Sigma-Aldrich (St. Louis, MO). The labware used for both permeability and equilibrium dialysis studies was the same as in previous reports (Feng et al., 2008; Di et al., 2011a).
Methods
General well-established methods for permeability and binding assays were used consistently for all data presented in this work. A description of the general assay methods are described elsewhere (Feng et al., 2008; Di et al., 2011b). Where appropriate, specific conditions are noted.
Cell Culture for Permeability Assays.
Permeability studies were conducted with murine BCRP-transfected MDCK cells (mBCRP-MDCK) and with MDR1-transfected MDCK cells (MDR-MDCK). Both cell lines were plated at 9.375E-5 cells/ml, and cultured for at least 4 but no longer than 5 days before their use in experiments. The mBCRP-MDCK cells use a tetracycline-inducible promoter, so doxycycline was added to cell culture medium during seeding.
Permeability Assay Methods.
In vitro assays were conducted using well-established platform approaches for MDCK-based permeability assays (Feng et al., 2008; Di et al., 2011b). All experiments were performed with 2 μM test compound in transport buffer added to donor wells and measuring appearance in receiver wells after a 1.5-hour incubation at 37°C. For absorptive transport, the donor is the apical (A) compartment, and the receiver is the basolateral (B) compartment. For secretory transport, the donor is the B compartment, and the receiver is the A compartment.
Equilibrium Dialysis Methods.
Experiments to determine free and bound test compound were performed with rat brain homogenate and rat plasma as described elsewhere (Kalvass and Maurer, 2002; Feng et al., 2008; Di et al., 2011a). Correlation studies have demonstrated a single species (e.g., Wistar Han rat) can be used as a predictor for brain tissue binding of any preclinical species or strain. For the sample analysis methods, samples from permeability and binding experiments were analyzed using high-throughput format liquid chromatography with tandem mass spectrometry (LC-MS) using methods described by Kapinos et al. (2017).
Data Analysis
Permeability Experiment Data Analysis.
Determination of apparent permeability (Papp) and efflux ratio (ER) for all experiments used the following equations. The Papp was calculated using eq. 1: (1)where Area is the surface area of the cell monolayer (0.0625 cm2), CD(0) is the initial concentration of the test compound applied to the donor chamber, t is the time (in seconds), Mr is the mass of compound appearing in the receiver compartment as a function of time, and dMr/dt is the flux of the compound across the cell monolayer. The ER was determined using eq. 2:
 (2)where AB and BA denote absorptive and secretory transport direction, respectively.
Binding Experiment Data Analysis.
The fraction unbound (fu) was calculated using equations previously described elsewhere (Kalvass and Maurer, 2002; Feng et al., 2008; Di et al., 2011a), where the brain homogenates were diluted 5-fold and were corrected accordingly. Note that the brain free fraction was assumed to be equal across all species, a correlation previously demonstrated by Di et al., 2011a).
Proteomics.
Targeted proteomics were used to measure MDR1 and BCRP in the cell lines used to generate the efflux ratios. Cell processing followed closely the methodology outlined by Uchida et al. (2011). Protein content was determined via stable isotope dilution multiple reaction monitoring mass spectrometry (SID MRM) using a method adapted from Palandra et al. (2013).
Briefly, cells were lysed in 8 M urea and protein concentrations determined by BCA assay. Cell lysates were then reduced with dithiothreitol (10 mM 37°C for 30 minutes), alkylated with iodoacetamide (20 mM 37°C for 30 minutes in the dark), and then enzymatically digested with trypsin. Quantification was enabled by spiking in SID peptides corresponding to MDR1 (LANDAAQVK, NTTGALTTR) and BCRP1 (SSLLDVLAAR, VIQELGLDK) proteotypic peptides. SID peptides were labeled with C13N15 arginine or lysine C termini. Peptides were analyzed by LC-MS; specifically, they were loaded onto a C18 Pepmap trap and then subsequently separated by nanoflow on a C18 column over a 30-minute gradient directly ionizing into an ABSciex 4000 QTRAP (AB Sciex, Framingham, MA). The triple quadrupole instrument was set to MRM acquisition, monitoring the masses corresponding to target peptide precursors and the resulting 5 highest response productions. The resulting spectra were analyzed in Skyline software (University of Washington, Seattle, WA), and quantification was achieved by ratio of spiked “heavy” (20 fmol) with unknown endogenous “light.”
Neuropharmacokinetic Studies
In vivo experiments were performed in accordance with the Guide for the Care and Use of Laboratory Animals (NRC, 1996) using protocols reviewed and approved by the WRD Institutional Animal Care and Use Committee (Groton, CT). As the neuropharmacokinetic data were derived from across multiple discovery projects with varied study designs, a general description of the methods is provided here.
The animals were dosed orally, subcutaneously, or intraperitoneally to attain near pharmacologically relevant exposures. Whole-blood samples were collected at time points appropriate to the pharmacokinetics in the species. The collection of whole blood from animals was achieved while under CO2 (rats and mice), isoflurane (rats, nonhuman primates [NHP]), or after ketamine anesthesia (NHP). Whole-blood samples were drawn either from the jugular vein (rats) or by direct cardiac puncture (mice, rats, NHP) and were stored on wet ice before centrifugation for harvest of serum sera or plasma. Brain tissue samples from mice and rats (whole brain) and NHP (∼1 g sections) were rinsed in saline and immediately frozen on dry ice. All samples were stored at −20° or −80°C while pending bioanalytical analysis.
Standard study and bioanalytical (LC-MS/MS) protocols have been previously published (Doran et al., 2012). Steady-state ratios of brain to plasma were calculated using the area under the plasma curve method as described elsewhere (Doran et al., 2012).
Modeling
Equation 3 estimates the steady-state unbound-brain/unbound-plasma (Cb,u/Cp,u) ratio from in vitro ER using corresponding scaling factors (SF) to account for expression and/or activity of P-gp and BCRP between in vitro and in vivo systems. The derivation of this equation is discussed elsewhere (Trapa et al., 2016), and it arises from a mechanistic model of brain penetration when several assumptions are made. The major assumptions are that the drug penetration is at steady state, active transport is governed only by two efflux transporters (whose flux is measured in vitro as ER1 and ER2), drug flux from bulk flow is minimal in vivo, and paracellular diffusion is absent in vitro.
In this work, in vitro-to-in vivo scaling factors (SF1 and SF2) for P-gp and BCRP were estimated by two independent approaches. In the first approach, a relative expression factor (REF) was estimated via proteomics measurements in each system. In the second, a relative activity factor was estimated by fitting the observed unbound brain-to-unbound plasma data (Supplemental Table 1) using eq. 3 (NONMEM V, ICON). In the latter, the relationship of REF values between species was set with abundance data (Ito et al., 2011; Uchida et al., 2011; Hoshi et al., 2013) (Table 1). As such, only one set of relative activity factor (RAF) values was estimated to support rather than determining the SF independently for each species. (3)As originally described, the determination of the Cb,u/Cp,u ratio requires the estimation of total concentrations in plasma and brain via in vivo neuropharmacokinetic studies and the independent estimation of fu,b and fu,p via equilibrium dialysis (Kalvass and Maurer, 2002).
Protein expression of MDR1 (P-glycoprotein) and BCRP across species
The estimation of fu,b requires the use of homogenized brain tissue and a calculation to account for the dilution of tissue required in the homogenization process. One limitation to this approach is that the fu,b measures obtained from tissue homogenate fail to capture the drug accumulation that occurs in vivo via pH partitioning. Of particular concern is the potential for basic compounds to significantly partition into acidic lysosomal subcompartments, a phenomenon that has been mathematically addressed elsewhere (Fridén et al., 2011).
Equations 4 and 5 can be used together to correct for potential lysosomal accumulation. Equation 4 explicitly assumes that the experimental in vitro homogenate binding value (fu,b) would apply in all subcellular compartments, but it also accounts for pH partitioning to lysosomes to get an effective unbound fraction in vivo (fu,b,cor). For example, if the lysosomal accumulation (Acclys) increases the overall cell concentration by 100% (i.e., Acclys = 1), the effective in vivo fu,b (fu,b,cor) would be 2-fold lower than that estimated via equilibrium dialysis (fu,b). To calculate Acclys, one needs to account for the anticipated pH partitioning and the fractional lysosomal volume of the cell.
Equation 5 assumes that the Henderson-Hasselbalch equation holds; the compounds are treated as monoprotic bases or neutrals. Vlys represents the volume lysosomal fraction, set at 1% for this analysis. Here, pKa, pH,lys, and pH,ECF are the basic compound pKa, lysosomal pH, and extracellular pH, respectively. The latter two values are assumed to be 5.0 and 7.4, respectively. The pKa values for each compound were generated via the in silico MoKa approach (Milletti et al., 2007).
 (4)
(4) (5)
(5)Results
Supplemental Table 1 lists the attributes of the compounds. Overall, the set contains 64, 68, and 15 steady-state brain and plasma-concentration measurements for mice, rats, and NHP, respectively. The distribution of ERs and ratios of free brain to free plasma concentrations with and without brain-homogenate binding corrections are illustrated in Figs. 1 and 2.

Distribution of the ER values of the compounds in Supplemental Table 1.

Cumulative distribution of ratios of free-brain and free-plasma concentrations with or without pH-partitioning correction to the homogenate-derived brain binding values.
The results span a wide range of brain restriction and ERs, but basic and neutral compounds dominate the list. Our choice of the mBCRP cell line in these studies was based on a number of factors. First, we have found that these cells show much better interexperimental reproducibility and dynamic range versus the human BCRP line (in which endogenous dog MDR1 must be inhibited), which provides comparable data across multiple experiments. Second, internal assessment of a large set of diverse, drug-like molecules demonstrated a strong correlation between efflux in mBCRP and human BCRP cells (R2 = 0.86; data not shown, manuscript in preparation).
Proteomics analysis of MDR1 and BCRP cells lines determined protein contents of 36 and 60 fmol/μg respectively. SFs for the ERs from both methods with and without lysosomal accumulation are captured in Table 2. Figures 3 and 4 illustrate the corresponding observed and predicted Cb,u/Cp,u for the RAF and REF approach to IVIVE, respectively. Table 3 contains the corresponding percentages of Cb,u/Cp,u fold error for predictions made with parameters estimated without the brain-binding correction. The cumulative distribution of fold error for each species (using RAF values) is depicted in Fig. 5. Figure 6 projects human brain penetration as a function of efflux using RAF values.
Proteomic relative expression (REF) and parameter estimate relative activity (RAF) factor estimations

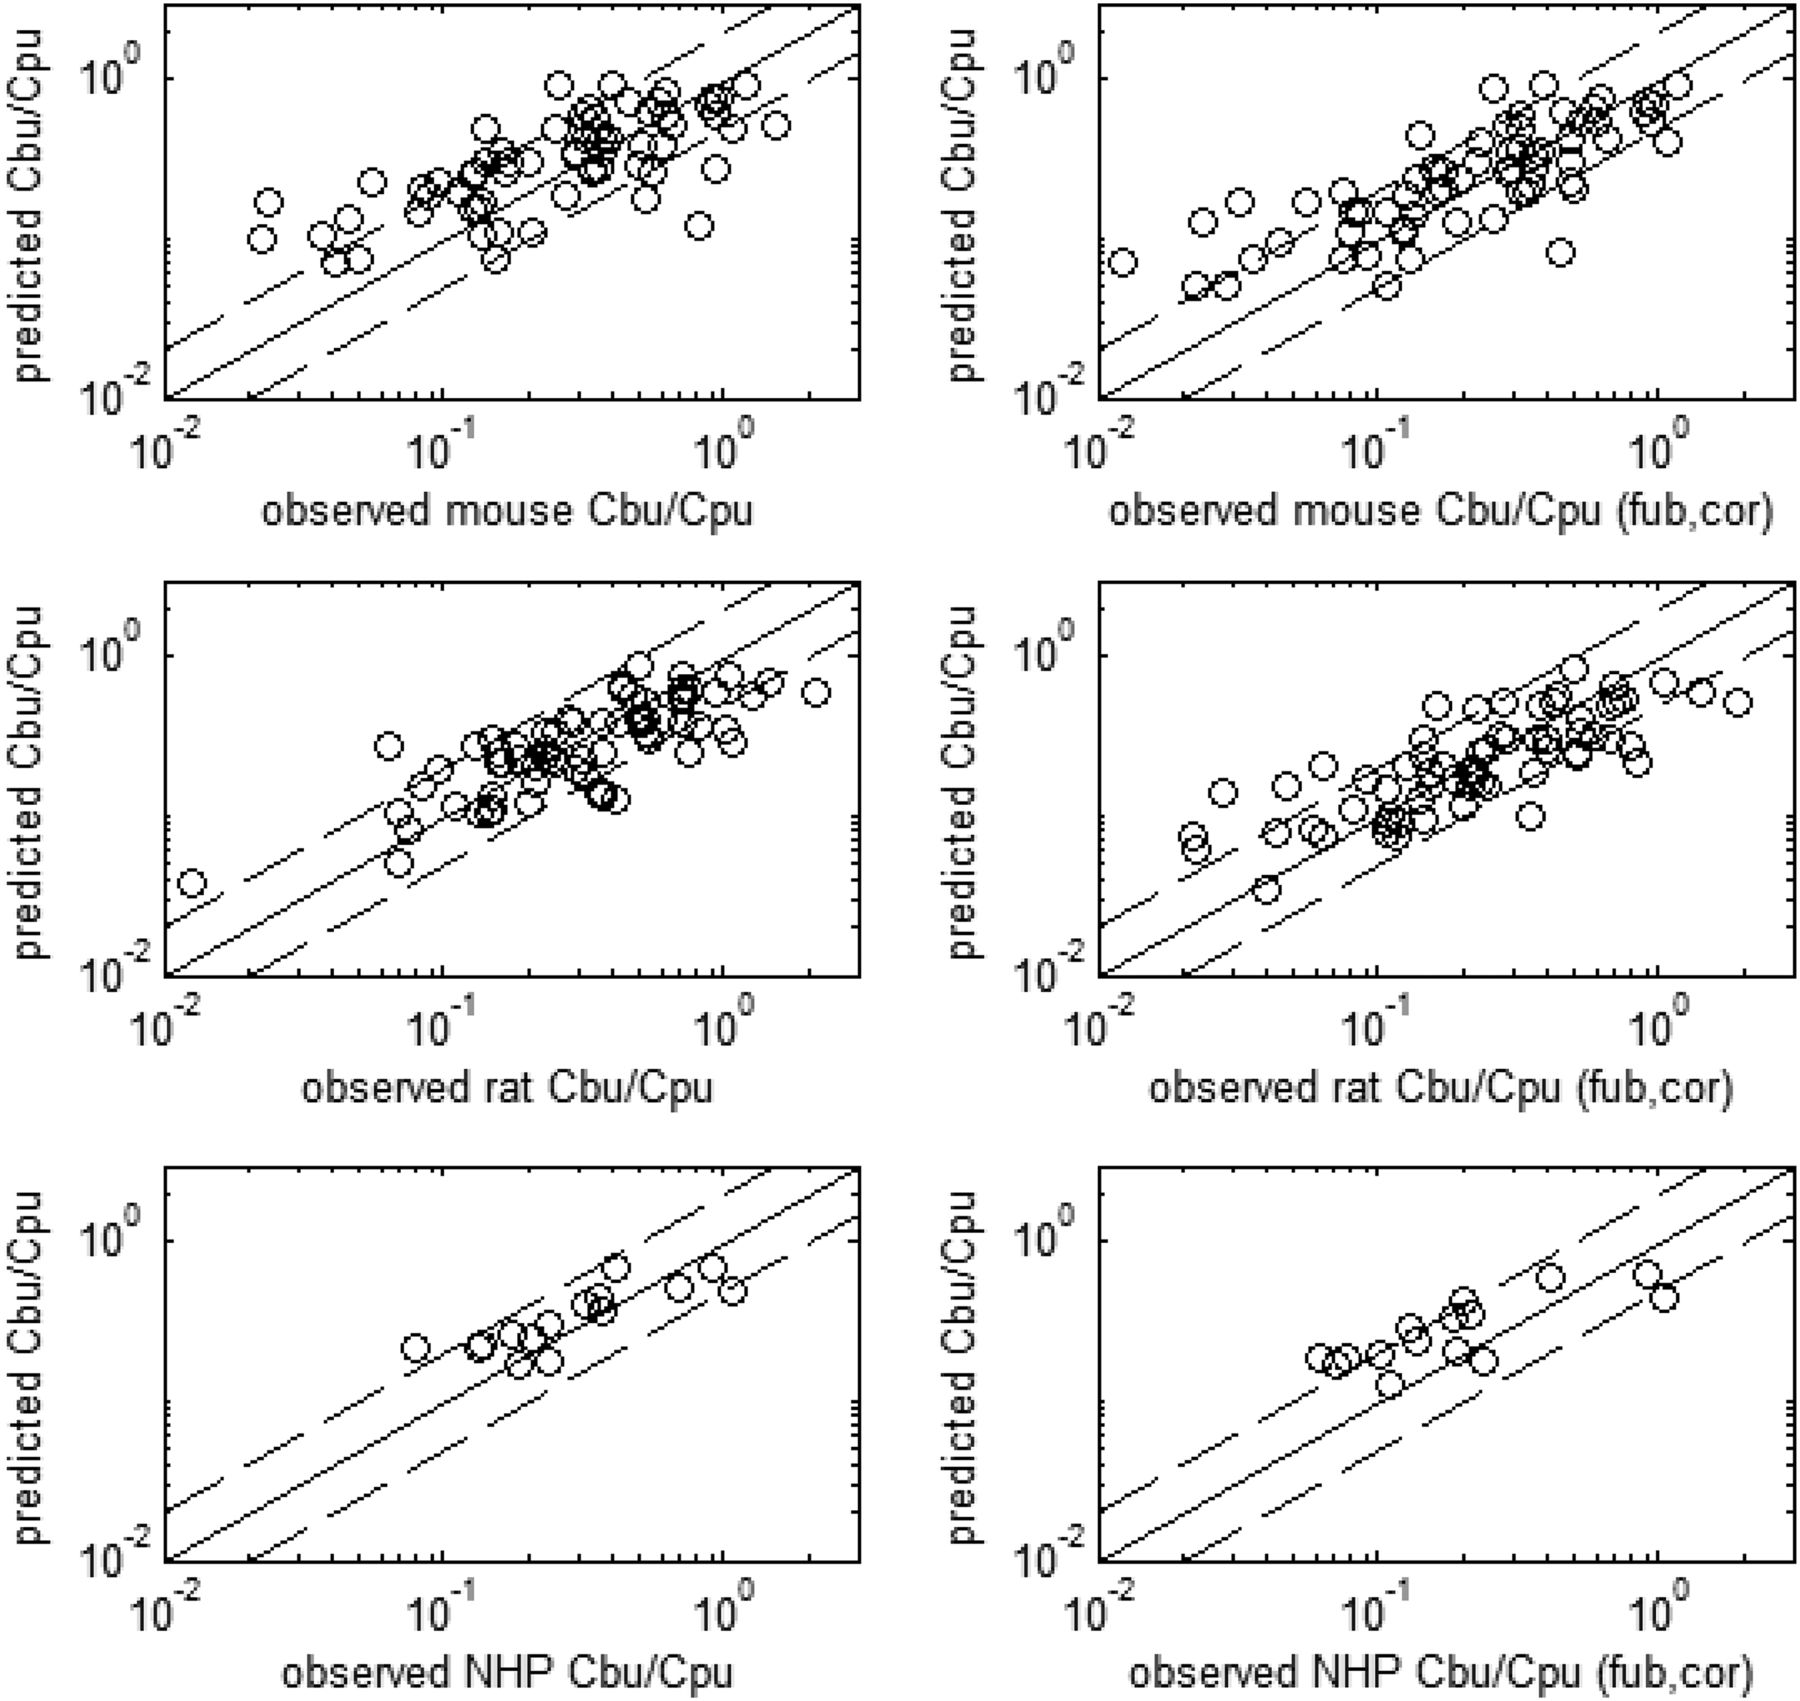
Observed and predicted ratios of free-brain and free-plasma concentrations with or without pH-partitioning correction to the homogenate-derived brain binding values using RAF values obtained from parameter estimation. The solid and dashed lines represent unity and 2-fold error, respectively.

Observed and predicted ratios of free-brain and free-plasma concentrations with or without pH-partitioning correction to the homogenate-derived brain binding values using REF values obtained using the ratios of protein expression from the cell lines to the tissues. The solid and dashed lines represent unity and 2-fold error, respectively.
Percentage of predictions within 2-fold of observed for each of the scaling factor (proteomic REF and parameter estimate RAF) sets, with and without fu,b correction

Cumulative distribution of fold error for each species using RAF values derived from parameter estimation without brain-binding correction.
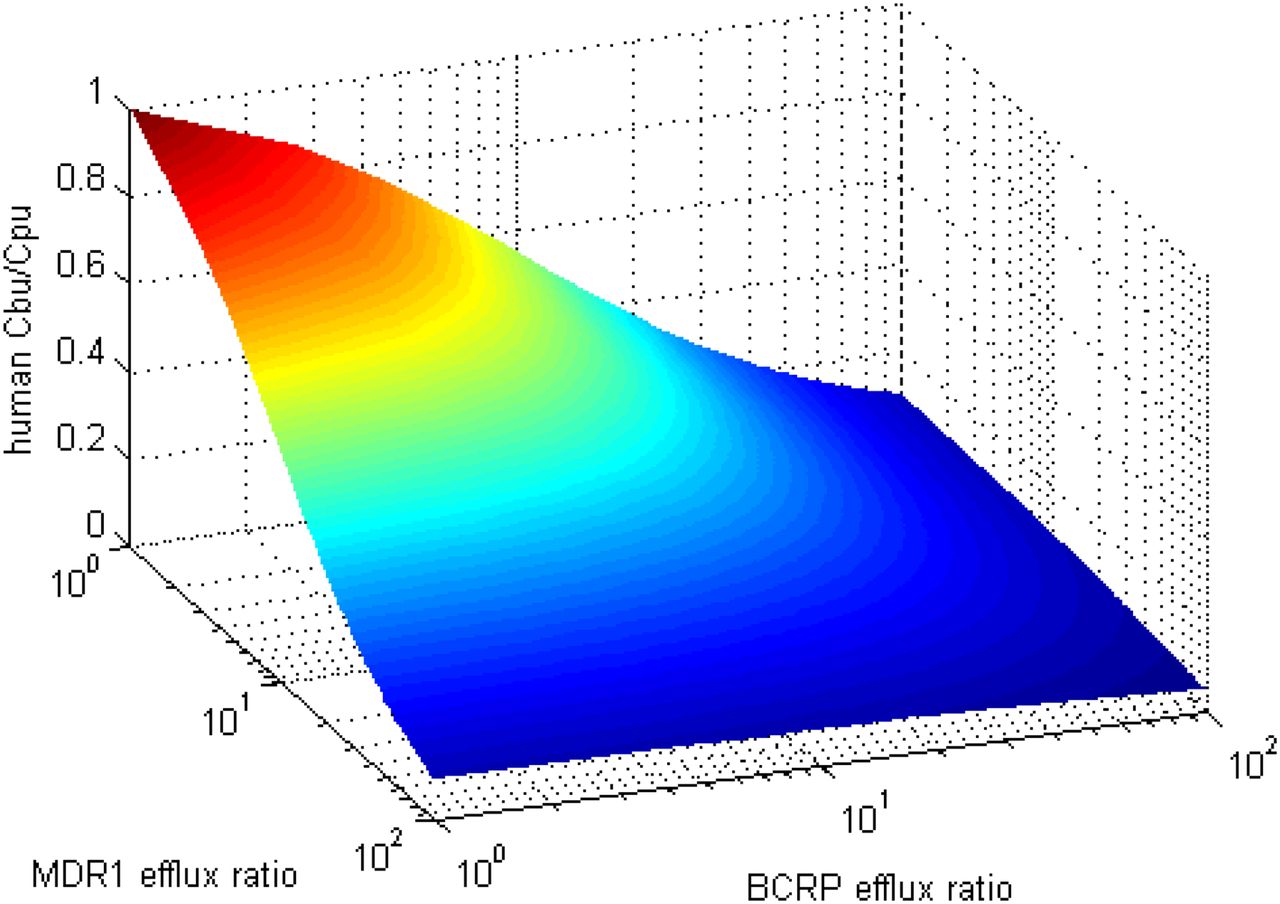
Forward estimation of the ratio of free-brain and free-plasma concentration in humans using the RAF values derived from parameter estimation without brain-binding correction.
Discussion
Using the REF approach (Table 1), we observed a good concordance between predicted and observed Cb,u/Cp,u across species (Fig. 4). This concordance implies that the assumption that activity scales with abundance holds. This may stand in contrast to other work suggesting there exists the potential for differences in activity between species orthologs (particularly in Km) (Katoh et al., 2006), but this translational result is consistent with the notion that inherent transport activity differences across species is negligible for this set of 133 compounds across the three species examined. The expression data therefore suggest that P-gp (MDR1) substrates will show an improvement in brain penetration in primates over rodents commensurate with this difference. Given this result, it is perhaps not surprising that model-based estimation of RAF values also provided a good characterization of the data (Fig. 3) and yielded trends across species that were consistent with the relative expression data (Table 2).
Both approaches to IVIVE produce models capable of rank-ordering compounds effectively, but the REF (proteomics-based) approach without lysosomal-accumulation correction led to a systematic under prediction of the in vivo brain penetration (Fig. 4, Cb,u/Cp,u plots). Notably, the ratio of the MDR1 and BCRP scaling factors was still similar between the forward and fit methods without lysosomal correction (Table 2). However, the magnitudes differed.
One of the challenges of the REF approach is normalizing the measured protein concentrations appropriately across various samples and tissues. In the case of proteomics analysis, disparities in the extraction of the proteins in vitro and in vivo might explain part of the discrepancy in SFs. However, when accounting for pH-partitioning in brain binding, the RAF estimates fall into very close agreement (Table 2). Likewise, the REF method provided an improved prediction of in vivo brain penetration after accounting for pH partitioning (Fig. 4, Cb,u/Cp,u,(fu,b,cor) plots).
Though mechanistically accurate, correcting brain-binding measurements for lysosomal accumulation does not yield improvement in fit quality for the RAF approach (Table 3); however, the use of fu,b,cor does reduce the number of compounds with observed Cb,u/Cp,u >1 (Fig. 2). This is an important finding in that it lends support for the REF-based approach, which might otherwise be considered inadequate. In addition, for the compounds with Cb,u/Cp,u >1, it provides a straightforward explanation for what might otherwise be interpreted as the presence of an active uptake process.
These findings are entirely consistent with previous work and provide further support for systematic accounting of lysosomal partitioning in such analyses (Fridén et al., 2011). The method requires an accurate pKa determination; thus, fu,b,cor could change as measured pKa values are substituted for model predictions. The correction also renders comparison with historical data challenging.
Pragmatically, efficacy is also estimated via the in vivo free-brain concentrations, so inaccuracy in free concentrations as a result of fu,b measures would be compensated by the pharmacokinetic-pharmacodynamic parameters obtained preclinically. In light of these practical considerations, we implemented the fitted scaling factors without binding correction to support internal decision making. Using this parameterization, the implications of in vitro ER ratios for in vivo Cb,u/Cp,u can be readily determined (Fig. 6).
Figure 7 illustrates the overall comprehensive strategy for brain-penetration prediction. Machine-learning computational models are capable of producing high-quality predictions of ERs for virtual compounds, thereby affording the opportunity to enrich libraries before synthesis. In vitro, all assays are well characterized statistically. Real-time statistical tools allow for quality control as well as for optimization of replication strategies to meet the data-quality and cycle-time needs of specific project teams. Predictions are made via ERs, but additional in vivo data continue to be generated opportunistically. Comparison between the prospective prediction and in vivo results serves as a check of the IVIVE. Finally, all data are captured, allowing for continuous refinement of the models that include machine learning as well as the scaling described here.

Schematic of the overall implementation strategy for brain-penetration prediction. Continuous data capture allows for refinement of both RAF values and machine-learning models for in vitro data.
The approach has proved effective over several years for guiding the optimization and selection of CNS clinical candidates, but several key caveats remain:
The analysis only holds for permeable bases and neutrals. The model structure incorporates only BCRP and MDR1 (P-gp). Although the literature is limited, acids are purportedly restricted via other transporters (Mori et al., 2003; Leggas et al., 2004) Moreover, in this model, flux into the brain is assumed to dominate over bulk flow. As such, this method may be misleading when applied to poorly permeable molecules and those that are anionic or zwitterionic in nature.
Generally, scaling with proteomics alone must be normalized appropriately across tissues and cell lines, particularly when extraction may vary. Activity is explicitly assumed to scale with abundance, which may not be the case for all transporters.
Suitable parameter estimation requires a large and diverse data set. For example, rodent data alone would not lead to high confidence in the RAF values. Compounds are either dual substrates or P-gp–specific substrates (Fig. 1; Supplemental Table 1), and P-gp expression is much greater than BCRP in rodents (Table 1), making detection of the BCRP component difficult. Even relatively sparse NHP data help constrain the solution space allowing for unique parameter estimation.
The accuracy depends greatly on the quality of input parameters and data. Predictions using eq. 3 require ER values for each efflux transporter, both containing two individual experiments and attendant variability associated with these studies. The observed Cb,u/Cp,u contains four measures as well: fu,p, fu,b along with total brain and plasma concentrations. Any of these eight experimental values can lead to discordance in the IVIVE.
The framework is assay dependent. ER values for control compounds are listed in Table 4 so that researchers might calibrate assay results to gain value from the model.
View this table:TABLE 4Efflux ratio values for select control compounds
Given these caveats, the present model does not completely obviate the need for in vivo experiments to understand brain penetration. These data can be generated opportunistically as part of a pharmacology study in lower-order species or as an end point in toxicology studies for higher-order species. In vivo data afford a means to confirm Cb,u/Cp,u and provide valuable information regarding in vitro–in vivo correlation. Deviations between the observed and predicted values may be due to variability or may serve as an alert that the model structure is insufficient (i.e., excludes aspects such as uptake or additional efflux transporters).
Future directions could include expanding the transporters to include those responsible for efflux beyond P-gp and BCRP or uptake. With regard to efflux transporters, it is likely that BCRP and P-gp account for majority of transporter-mediated restriction at the BBB. However, there are reports of additional transporters impacting brain efflux and uptake (Kanamitsu et al., 2017; Sano et al., 2018). Efforts to characterize mechanistically the relationship between cerebrospinal fluid and free-brain concentrations would also be useful. Such a relationship would provide a second measure in terminal studies to account for variability in input parameters, a nonterminal method to estimate brain penetration in higher order species, and confidence in using cerebrospinal fluid data in humans to project brain concentrations.
Authorship Contributions
Participated in research design: Trapa, Liras, Troutman, Feng, Wager, Maurer.
Conducted experiments: Lau, Umland, West.
Contributed new reagents or analytic tools: Feng, Carlo.
Performed data analysis: Trapa, Lau, Patel.
Wrote or contributed to the writing of the manuscript: Trapa, Liras, Lau, Troutman, Maurer.
Footnotes
- Received June 22, 2018.
- Accepted January 7, 2019.
↵
 This article has supplemental material available at dmd.aspetjournals.org.

Abbreviations
- A
- apical
- Acclys
- lysosomal accumulation
- B
- basolateral
- BBB
- blood-brain barrier
- BCRP
- breast cancer resistance protein
- Cb,u
- unbound brain concentration
- CNS
- central nervous system
- Cp,u
- unbound plasma concentration Cb,u/Cp,u, steady-state unbound-brain to unbound-plasma concentration ratio
- CSF
- cerebrospinal fluid
- ER
- efflux ratio
- fu
- fraction unbound
- fu,b
- fraction; unbound in brain
- fu,b,cor
- corrected fraction unbound in brain
- IVIVE
- in vitro–in vivo extrapolation
- LC-MS
- liquid chromatography with tandem mass spectrometry
- mBCRP
- murine BCRP
- MDCK
- Madin-Darby Canine Kidney
- MDR1
- multidrug resistance protein 1
- MRM
- multiple reaction monitoring
- NHP
- nonhuman primate
- Papp
- apparent permeability
- PBPK
- physiologically based pharmacokinetic
- P-gp
- P-glycoprotein
- pH,ECF
- extracellular pH
- pH,lys
- lysosomal pH
- pKa
- negative log of the acid dissociation constant
- RAF
- relative activity factor
- REF
- relative expression factor
- SF
- scaling factor
- SID
- stable isotope dilution
- Vlys
- volume of lysosomal fraction
- Copyright © 2019 by The American Society for Pharmacology and Experimental Therapeutics


