


Abstract
In this phase 1 study, the absolute bioavailability and absorption, metabolism, and excretion (AME) of apalutamide, a competitive inhibitor of the androgen receptor, were evaluated in 12 healthy men. Subjects received 240 mg of apalutamide orally plus a 15-minute intravenous infusion of 100 µg of apalutamide containing 9.25 kBq (250 nCi) of 14C-apalutamide (2 hours postdose) for absolute bioavailability assessment or plus one 400-µg capsule containing 37 kBq (1000 nCi) of 14C-apalutamide for AME assessment. Content of 14C and metabolite profiling for whole blood, plasma, urine, feces, and expired air samples were analyzed using accelerator mass spectrometry. Apalutamide absolute oral bioavailability was ≈100%. After oral administration, apalutamide, its N-desmethyl metabolite (M3), and an inactive carboxylic acid metabolite (M4) accounted for most 14C in plasma (45%, 44%, and 3%, respectively). Apalutamide elimination was slow, with a mean plasma half-life of 151–178 hours. The mean cumulative recovery of total 14C over 70 days postdose was 64.6% in urine and 24.3% in feces. The urinary excretion of apalutamide, M3, and M4 was 1.2%, 2.7%, and 31.1% of dose, respectively. Fecal excretion of apalutamide, M3, and M4 was 1.5%, 2.0%, and 2.4% of dose, respectively. Seventeen apalutamide metabolites and six main metabolic clearance pathways were identified. In vitro studies confirmed CYP2C8 and CYP3A4 roles in apalutamide metabolism.
Introduction
Apalutamide is a potent, specific, orally administered competitive inhibitor of the androgen receptor. Apalutamide has been studied in the treatment of men with nonmetastatic castration-resistant prostate cancer (CRPC) who are at high risk for the development of metastatic disease (Smith et al., 2005; Lin et al., 2017). Its mechanism of action involves the blockade of androgen receptor nuclear translocation, DNA binding to androgen response elements, and transcription of androgen target genes (Clegg et al., 2012). On the basis of the phase 3 SPARTAN trial, which demonstrated that metastasis-free survival was more than 2 years longer with apalutamide 240 mg/day compared with placebo in men with nonmetastatic CRPC (Smith et al., 2018), apalutamide received US Food and Drug Administration approval (ERLEADA, 2018).
In a phase 1 study conducted in men with CRPC, apalutamide was safe and well tolerated across the dose range of 30–480 mg (Rathkopf et al., 2013). The Cmax of apalutamide and the area under the plasma concentration-time curve (AUC) increased proportionally after repeated once-daily dosing of 30–480 mg. Apalutamide steady state was achieved after 4 weeks, and the mean accumulation ratio was approximately 5-fold. Apalutamide declined slowly in plasma, and the mean effective half-life was about 3–4 days at steady state. An increase in apparent clearance was observed with repeat dosing of apalutamide, likely due to metabolic autoinduction (ERLEADA, 2018). The major active metabolite of apalutamide, N-desmethyl apalutamide (M3), which exhibited one-third the activity of apalutamide in an in vitro transcriptional reporter assay, was detected in plasma as early as 1 hour after ingestion of the first apalutamide dose, with concentrations increasing steadily during the first 24 hours after single-dose administration. M3 plasma levels approached steady state after 6–8 weeks and were comparable to its parent with minimal fluctuation. A minor, inactive carboxylic acid metabolite of apalutamide (M4) was also detected in plasma, with systemic exposure below 10% of the parent compound apalutamide plus metabolites (M3 and M4) combined at steady state. The recommended phase 2 dose of apalutamide, 240 mg/day, showed robust activity based on durable prostate-specific antigen responses and disease control in a phase 2 study of patients with nonmetastatic CRPC (Smith et al., 2016), findings that have since been confirmed in the phase 3 SPARTAN trial (Smith et al., 2018).
Though previous studies that supported the clinical development of apalutamide have evaluated the efficacy and pharmacodynamic profile of this agent, the absolute bioavailability, absorption, metabolism, and excretion (AME) profile of apalutamide in humans has not been completely characterized. The present study was therefore conducted with the primary objective of determining the absolute bioavailability, and absorption, metabolic pathways, and excretion routes of apalutamide in healthy men after the administration of a single oral dose of apalutamide. Because of the very low intrinsic clearance of apalutamide, a 14C microtracer approach was used to limit the radioactivity burden to study participants (Lappin, 2016; Guerini et al., 2017; Helmer et al., 2017; Morcos et al., 2017). Based on AME results, in vitro phenotyping of apalutamide was conducted using cryopreserved human hepatocytes to definitively identify the key enzymes involved in its biotransformation.
Materials and Methods
Clinical AME Study in Healthy Subjects
Study Design.
This was an open-label, phase 1, single-dose, microtracer study to evaluate the AME of 14C-labeled apalutamide in healthy men. The study was conducted in two parallel parts, each involving six subjects. Part A was used to determine the absolute oral bioavailability of apalutamide within a single dosing period; part B determined the AME of apalutamide and its metabolites. An independent ethics committee reviewed and approved the study protocol. The study was conducted in accordance with Good Clinical Practice guidelines. All subjects provided their written informed consent.
Study Population.
Subjects eligible for inclusion in the study were healthy men 50–80 years of age with a body mass index of 18.5–30.0 kg/m2. Subjects with clinically relevant pathology; irregular bowel habit; or hematology, blood, or urine chemistry results outside the normal range were excluded.
Study Medication.
In part A, on study day 1, subjects received an oral dose of 240 mg apalutamide in softgel capsules containing a lipid-based solution of apalutamide. This was followed approximately 2 hours postdose by a 15-minute intravenous infusion of 100 µg of apalutamide containing 9.25 kBq (250 nCi) of 14C-apalutamide. The position of the 14C label was at the carbonyl group of the diazaspiro octyl ring of apalutamide. The 2-hour dosing interval between oral and intravenous dosing was based on the average time to Cmax (Tmax) and chosen to overcome any time-dependent differences in pharmacokinetics. In part B, on study day 1, subjects received 240 mg of apalutamide together with one 400-µg capsule containing 37 kBq (1000 nCi) of 14C-apalutamide in the same lipid vehicle. The maximum allowable radioactivity dose for a microtracer study was chosen. In both parts, the radiation burden to which subjects were exposed was below 0.1 mSv and, as such, no radiation exposure needed to be calculated at the doses of apalutamide used for the study. Oral study medication was administered in the morning after an overnight fast of at least 10 hours, with fasting continuing for 4 hours postdose.
Pharmacokinetic Evaluations.
Pharmacokinetic evaluations were undertaken for 14C-apalutamide, apalutamide, M3, M4, and total 14C; radioactivity and metabolic profiling were conducted at various time points.
In part A, after dosing, the subjects remained in the clinic for 144 hours and returned to the clinic for six ambulatory visits on days 10, 14, 21, 28, 42, and 56. Blood samples were collected for the determination of plasma pharmacokinetic parameters predose, and 0.5, 1, 1.5, 2, 3, 4, 6, 8, 10, 14, 24, 48, 72, 96, 120, 144, 216, 312, 480, 648, 984, and 1320 hours postdose. Blood sampling for the assessment of plasma pharmacokinetics of 14C-apalutamide were taken predose, at 5, 15, 20, and 30 minutes, and at 1, 2, 4, 6, 8, 12, 22, 46, 70, 94, 118, 142, 214, 310, 478, 646, 982, and 1318 hours postinfusion.
In part B, after dosing, the subjects remained in the clinic for 240 hours and returned to the clinic for six 24-hour clinic periods for the collection of urine, feces, and blood samples on days 14, 21, 28, 42, 56, and 70. Blood samples for total 14C and metabolic profiling in plasma were taken predose, and 0.5, 1, 1.5, 2, 3, 4, 6, 8, 12, 24, 48, 72, 120, 168, 240, 336, 504, 672, 1008, 1344, and 1680 hours postdose. Pharmacokinetic assessments and breath tests for total 14C in whole blood and expired air, respectively, were additionally determined from samples taken predose, and 1, 4, 8, 12, 24, 48, 72, 120, and 168 hours postdose. Samples for pharmacokinetic assessments of total 14C and metabolic profiling in urine and feces were taken predose, and at 24-hour intervals on days 1–10, and on days 14–15, 21–22, 28–29, 42–43, 56–57, 70, and 71 (of which day 71 coincided with follow-up).
Sample Preparation for Determination of 14C Content.
Whole blood collected at defined intervals was centrifuged to obtain the plasma fraction. Urine and fecal samples were pooled across time intervals. Fecal samples were homogenized, and subsamples of each homogenate were freeze dried. All samples were shipped in dry ice (or, in the case of expired air trapping solution samples, on ice packs) to Xceleron (Germantown, MD) for 14C analysis by accelerator mass spectrometry (AMS). Freeze-dried feces samples were stored at room temperature. Expired air samples were stored at 4°C, and all other samples were stored at −80°C until required for analysis. Selected samples of plasma, whole blood, and expired air trapping solution underwent liquid scintillation counting to confirm that samples did not require dilution prior to AMS analysis. In the case of urine, for which the relatively high urea content can affect the graphitization process and the 14C/12C ratio in the graphite produced, samples were first diluted 10-fold with acetonitrile. The carbon content of feces and expired air trapping solution samples was determined using a PerkinElmer (Waltham, MA) 2400 Series 2 C,H,N analyzer; for those samples containing minimal amounts of carbon, sodium benzoate was added as carrier to achieve approximately 2 mg of carbon for graphitization. Plasma, whole blood, urine, expired air trapping solution, and freeze-dried feces samples and controls were placed in glass tubes containing prebaked copper oxide powder and dried under vacuum before analysis.
Metabolite Profiling and Identification in Urine and Feces.
Individual samples were pooled across subjects and collection intervals in proportion to the total volume or weight of the excreta collected. Two time-point regions, 0–240 and 240–1680 hours, were profiled; after preparation, samples were fractionated by high-performance liquid chromatography (HPLC), and the resulting fractions were subsequently analyzed by AMS for 14C content at Xceleron. The HPLC column was an XBridge Phenyl 3.5-µm, 150 × 3.0 mm i.d. (Waters, Milford, MA) kept at 30°C. Mobile phase A consisted of 0.025 M ammonium acetate (adjusted to pH 4 with acetic acid), and mobile phase B consisted of methanol/acetonitrile 20/80 (v/v). Gradient elution was applied at a mobile phase flow rate of 1 ml/min, and 100-µl aliquots of processed urine or feces extract sample were injected. The two time-point regions that had been fractionated by Xceleron for AMS, as well as a selection of HPLC fractions obtained by Xceleron, were also analyzed by ultraperformance liquid chromatography (UPLC)-high-resolution mass spectrometry to identify the metabolites in the fractions and to ensure the correct link between identity and radioactive signal as obtained by AMS. The UPLC system consisted of an Acquity Binary Solvent Manager (Waters) and an Acquity injector (Waters); the UPLC column was an XBridge Phenyl 2.5-µm column with 150 × 1.0 mm i.d. kept at 30°C and run using the same mobile phase solvents as for the HPLC method applied by Xceleron. Gradient elution was applied at a mobile phase flow rate of 90 µl/min. The mass spectrometer (Synapt G2-S; Waters, Wilmslow, UK) was equipped with a dual electrospray ionization probe and calibrated with a sodium formate solution delivered through the sample spray. The data [obtained by mass spectrometry (MS) and tandem MS (MS/MS)] were acquired in centroid mode with scan times between 0.2 and 0.5 seconds. In MS/MS mode, collision energies of 15, 20, 25, and 35 V in the transfer cell were used. All data were processed using the Masslynx MS software (Waters).
Sample Preparation for Metabolite Identification in Urine and Feces.
Urine was thawed at room temperature and centrifuged. After centrifugation, samples were transferred to HPLC vials and analyzed by LC-MS. Pooled feces homogenates (feces/water ratio, 1:1) were extracted using acetonitrile as extraction solvent. Three milliliters of acetonitrile was added to 1 g of feces homogenate and vortex mixed. Samples were then centrifuged for 20 minutes at 4°C and 2500 rpm, whereupon the supernatant was transferred to a new tube. This procedure was repeated twice, so in total 3 × 3 ml of acetonitrile was used. The combined supernatants were evaporated to dryness under a nitrogen stream at 40°C and then stored at −20°C in a freezer until further analysis. The dried extract was reconstituted in 300 μl of DMSO, vortex mixed, and sonicated, whereupon 700 μl of water was added. Then, the sample was centrifuged, transferred to a liquid chromatography (LC) vial and analyzed by LC-MS. Feces and urine HPLC fractions received from Xceleron were obtained in separate tubes in a 96-well deep-well plate and covered with a self-adhesive seal. The plates were stored frozen until analysis, when the self-adhesive seal was removed and the individual tubes were closed using rubber vial caps. A selection of the tubes was made for subsequent LC-MS analysis, for the purpose of confirming the identity of metabolites in the fractions. The selection of tubes was transferred to a new 96-well plate after thawing and vortex mixing of the tubes, and analyzed by LC-MS.
Targeted Quantification of 14C-Apalutamide, Apalutamide, M3, and M4 in Plasma Samples.
For targeted quantification of 14C-apalutamide, individual plasma samples were fractionated using HPLC after sample preparation. The fraction containing 14C-apalutamide was collected and subsequently analyzed by AMS for 14C content at Xceleron. For targeted quantification of apalutamide, M3, and M4, individual plasma samples were analyzed after sample preparation using HPLC-MS/MS. The HPLC column was an XBridge C18 3.5-µm column, with 50 × 2.1 mm i.d. and kept at 40°C. Mobile phase A consisted of 0.1% formic acid, and mobile phase B consisted of acetonitrile. Gradient elution was applied at a mobile phase flow rate of 0.5 ml/min, and 15 µl aliquots of processed plasma were injected. The mass spectrometer (API-4000; AB Sciex, Framingham, MA) was equipped with an ionspray source and operated in the negative ion multiple reaction monitoring mode. Mass transitions monitored were 476.0 → 419.1 for apalutamide, 464.0 → 323.1 for M3, and 463.0 → 377.2 for M4. Mass transitions for three internal standards (one for each analyte) were also included.
Sample Preparation for Analysis of Apalutamide, M3, and M4 in Plasma.
To each 50-µl plasma sample, 20 µl of internal standard mixture and 100 µl of 2% formic acid in water were added and vortex mixed. Next, 750 µl of ert-butyl-methyl ether was added and vortex mixed for 2 minutes, and subsequently was centrifuged. Next, 250 µl of the organic layer was transferred to a new container, and 100 µl of 10% propane diol solution was added then evaporated to dryness at 40°C under a nitrogen stream. The residue was redissolved in 250 µl of methanol/0.1% formic acid 30/70 (v/v). A 15-µl aliquot was injected and analyzed by LC-MS/MS using an API-4000 Triple Quadrupole Mass Spectrometer (AB Sciex) operated in the multiple reaction monitoring mode, and concentrations of apalutamide, M3, and M4 in the samples were determined.
Safety Evaluations.
Safety and tolerability were evaluated based on assessments of adverse events (AEs), vital signs, 12-lead electrocardiogram, clinical laboratory, and physical examination.
Statistical Methods.
No prospective calculations of statistical power have been made for this study. The sample size of six subjects in each study part was deemed adequate to provide information regarding safety, tolerability, and pharmacokinetics after single doses of apalutamide. Data were summarized using descriptive statistics for the arithmetic mean, S.D., CV, geometric mean, percentage of CV, and minimum and maximum values.
In Vitro Phenotyping in Human Hepatocytes
Incubation Procedure for Human Hepatocyte Relay Incubations.
Hepatocyte incubations were performed using the relay method described by Di et al. (2012), with minor modifications, as follows. Pooled cryopreserved human hepatocytes from 20 human donors (Celsis IVT, Baltimore, MD) were thawed and subsequently resuspended in Williams’ Medium E (Sigma W1878; Millipore Sigma, St. Louis, MO) supplemented with l-glutamine and HEPES. Hepatocytes were added to 24-well plates at a concentration of 0.5 × 10⁶ cells/ml in a final volume of 750 µl. Next, test compound was spiked at a final concentration of 1 or 5 µM in both the presence and absence of diagnostic inhibitors. Substrates and inhibitors were dissolved in methanol (final concentration, 0.1%). Plates were covered with Breathe-Easy gas-permeable membranes (MilliporeSigma) and incubated at 37°C in a 5% CO2 incubator, at 75% relative humidity for 4 hours under continuous agitation on a rotary shaker at 150 rpm. At times 0 and 4 hours, 100 µl of hepatocyte suspension was removed from the incubation and stored at −20°C for subsequent use in measuring compound concentrations prior to centrifugation. The remainder of the hepatocyte suspension was centrifuged at 2700g for 10 minutes at 4°C, and 550 µl of supernatant was transferred to a new 24-well plate and stored at −20°C for subsequent assessment of postcentrifugation compound concentrations and for use in the next relay experiment. For the second relay experiment, supernatant plates were thawed and prewarmed to 37°C for 20 minutes. Freshly thawed hepatocytes were added to the samples to give a final cell density of 0.5 × 10⁶ cells/ml in a final volume of 750 µl. Plates were incubated at 37°C for 4 hours, then sampled and processed as described for the original incubation.
Four relay experiments were conducted, resulting in a combined total incubation time of 16 hours. Samples from the fourth relay were analyzed, revealing the presence of only M3 and M4 as apalutamide metabolites. Subsequently, the involvement of cytochrome P450 and esterases on the formation of M3 and M4 from apalutamide and on the formation of M4 from M3 was evaluated. Each relay included apalutamide together with the following diagnostic inhibitors of hepatic drug metabolism (Parkinson et al., 2010; Hatfield and Potter, 2011; Sevrioukova and Poulos, 2013; Backman et al., 2016): 1 µM itraconazole (CYP3A4); 100 µM troleandomycin (CYP3A4); 30 µM gemfibrozil plus 10.5 µM gemfibrozil glucuronide (CYP2C8); the carboxylesterase inhibitor bis-nitrophenol phosphate (BNPP) at 25 µM; the pan-CYP inhibitor aminobenzotriazole (ABT) at 1000 µM; and 25 µM BNPP plus 1000 µM ABT.
Data Analysis.
Data were analyzed in Excel (Microsoft, Redmond, WA) using the method described by Di et al. (2012), with a correction applied for drug lost because of hepatic uptake, nonspecific binding, and dilution according to the following equation:

Results
Clinical AME Study in Healthy Subjects
Study Participants.
Twelve of the 28 men screened for this study were included and received study medication (six subjects in each part of the study). All subjects completed the study and were included in the pharmacokinetic and safety analyses. In part A, the median age was 59 years (age range, 53–64 years), median weight at baseline was 80.5 kg (range, 71.0–98.2), and median body mass index was 26.3 kg/m2 (body mass index range, 22.9–29.0 kg/m2). In part B, the median age was 57 years (age range, 52–70 years), median weight at baseline was 81.3 kg (range, 68.8–89.9 kg), and median body mass index was 23.6 kg/m2 (body mass index range, 22.5–29.4 kg/m2).
Pharmacokinetic Results in Plasma.
In part A, plasma concentrations of apalutamide and 14C-apalutamide were detected soon after administration, with Cmax reached at approximately 1.0 and 0.25 hours after oral dosing and at the end of intravenous infusion, respectively, followed by a rapid initial decline and a more gradual terminal elimination phase (Fig. 1A). The apalutamide metabolites M3 and M4 were present in quantifiable concentrations from 1 hour after the oral dose, with the concentration of M3 increasing more slowly, reaching Cmax at approximately 216 hours postdose compared with 3 hours for M4 (Fig. 1B).
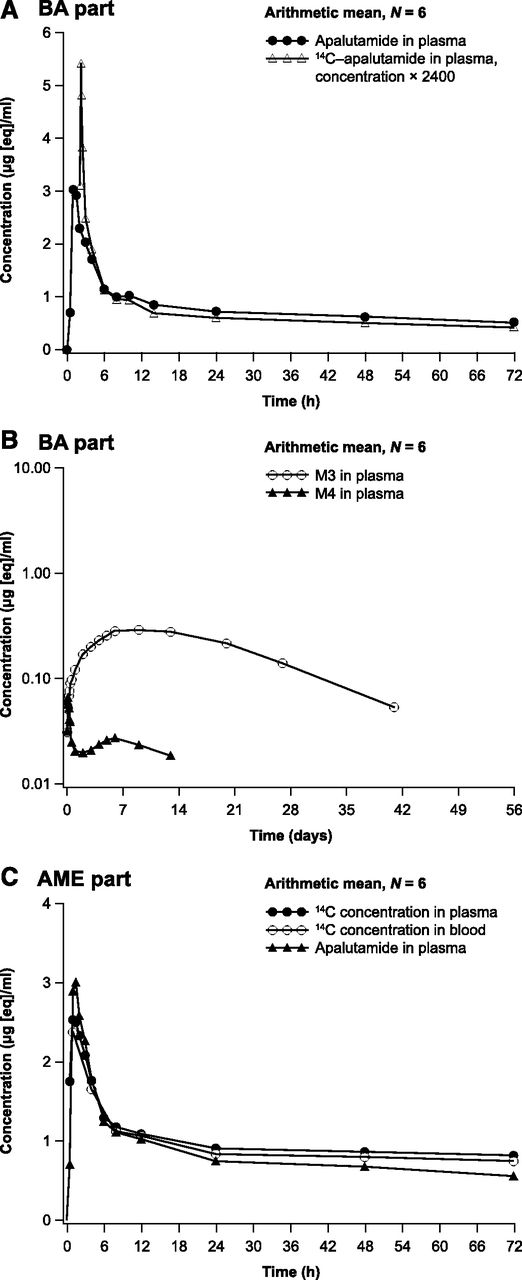
Arithmetic mean plasma concentration-time profiles: apalutamide and dose-normalized 14C-apalutamide in plasma [linear; part A bioavailability (BA) study] (A); apalutamide metabolites M3 and M4 in plasma (logarithmic-linear; BA study) (B); apalutamide in plasma, and 14C-apalutamide in plasma and whole blood (linear; part B AME study) (C).
Pharmacokinetic parameters after oral dosing with 240 mg of apalutamide and intravenous dosing with 14C-apalutamide from part A are summarized in Table 1. Exposure as assessed using AUC from time zero to the last time point with a measurable concentration (AUC0–t) was approximately 21-fold higher for apalutamide (185 h/µg per milliliter) and M3 (183 h/µg per milliliter) compared with M4 (8.83 h/µg per milliliter). The geometric mean AUC from time zero to infinity (AUC0–inf) was 200 h/µg per milliliter after 240 mg oral apalutamide administration and 0.0719 h/µg per milliliter after intravenous administration of 100 µg 14C-apalutamide, indicating high absolute bioavailability of apalutamide. The geometric mean AUC0–inf was 173 h/µg per milliliter for the intravenous dose when dose normalized to 240 mg.
Summary statistics of pharmacokinetic parameters for apalutamide, M3, M4, and 14C-apalutamide in plasma and blood. Geometric mean (% CV) data are presented, except for Tmax for which median (minimum–maximum) data are presented
Pharmacokinetic parameters after a single oral dose of 240 mg of apalutamide administered together with 37 kBq (1000 nCi) 14C-apalutamide from part B are summarized in Table 1. The plasma concentration-time profiles of apalutamide, M3, and M4 were comparable between parts A and B. As for part B, exposure to apalutamide and M3 in terms of AUC0–t was at least 15-fold higher than to M4. The systemic exposure for total 14C was the sum of those of apalutamide, M3, and M4. Exposure to apalutamide, M3, and M4 expressed as a ratio relative to total 14C accounted for 42%, 41%, and 2.7% of total 14C, respectively, based on AUC0–t. Arithmetic mean concentration-time profiles for apalutamide in plasma and 14C-apalutamide in plasma and whole blood were similar (Fig. 1C). Because most of the 14C signal in plasma could be explained by apalutamide, M3, and M4, no plasma samples were included for AMS/UPLC analysis. For plasma metabolites, targeted quantification of apalutamide, M3, and M4 was considered sufficient.
Total 14C in Urine, Feces, and Expired Air.
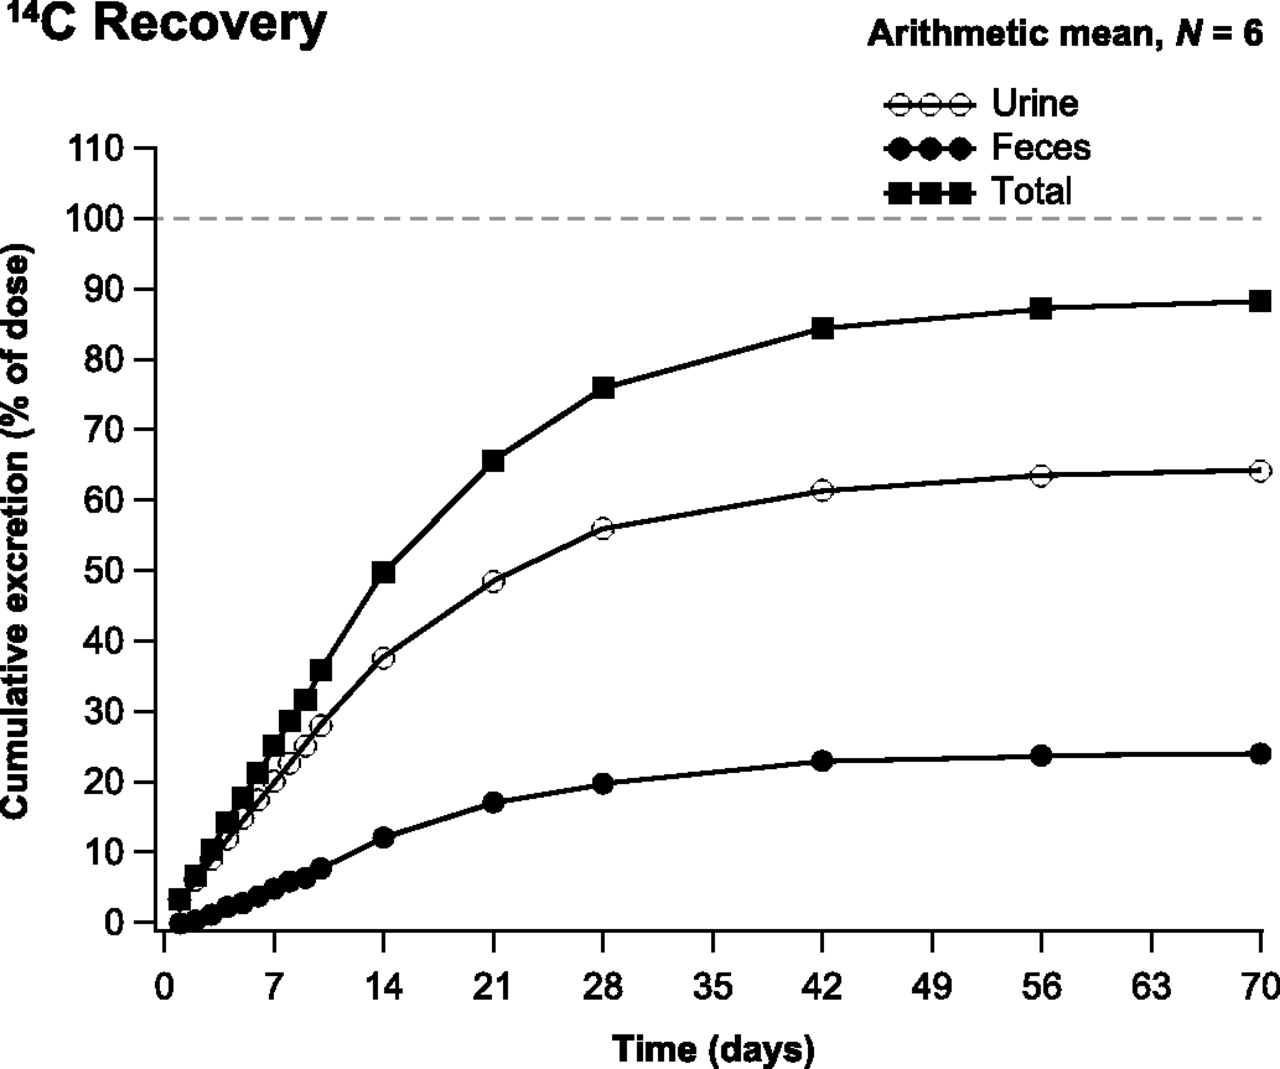
The arithmetic mean cumulative recovery of total 14C in urine, feces, and expired air was 88.9% (range, 83.8%–92.7%) of the administered 14C-apalutamide dose by day 71 postdose, from which most of the total 14C (>80%) was recovered up to day 42 postdose. Most of the dose was excreted in urine (64.6%; range, 59.5%–71.2%) followed by feces (24.3%; range, 18.1%–32.0%) (Fig. 2). The amount excreted in urine for apalutamide (i.e., unchanged drug), M3, and M4 was 1.20%, 2.73%, and 31.12% of the dose, respectively. Apalutamide was identified as a minor entity, whereas M4 was the major entity excreted in urine. The amounts excreted in feces for apalutamide, M3, and M4 were 1.54%, 1.97%, and 2.38% of the dose, respectively. Apalutamide was identified as a minor entity in feces. Expired air accounted for <0.06% of total 14C. However, excretion was slow, with just 9.6% and 0.5% of the 14C excreted in urine and feces, respectively, within 48 hours of dosing.

Cumulative recovery of 14C in urine, feces, and total excretion.
Metabolite Identification in Urine and Feces.
After a single oral dose of 240 mg of apalutamide, radiochromatograms of urine showed a high concentration of metabolites M4, M19, and M20 throughout the dosing interval (Fig. 3, A and B). In feces, M9, M13, and M14 were the dominant metabolites during the first 240 hours postdose (Fig. 3C), with M13 and M14 also dominant from 240 to 1680 hours postdose (Fig. 3D). The mass balance of unchanged 14C-apalutamide and its metabolites in urine and feces after oral administration of 240 mg apalutamide is summarized in Table 2.
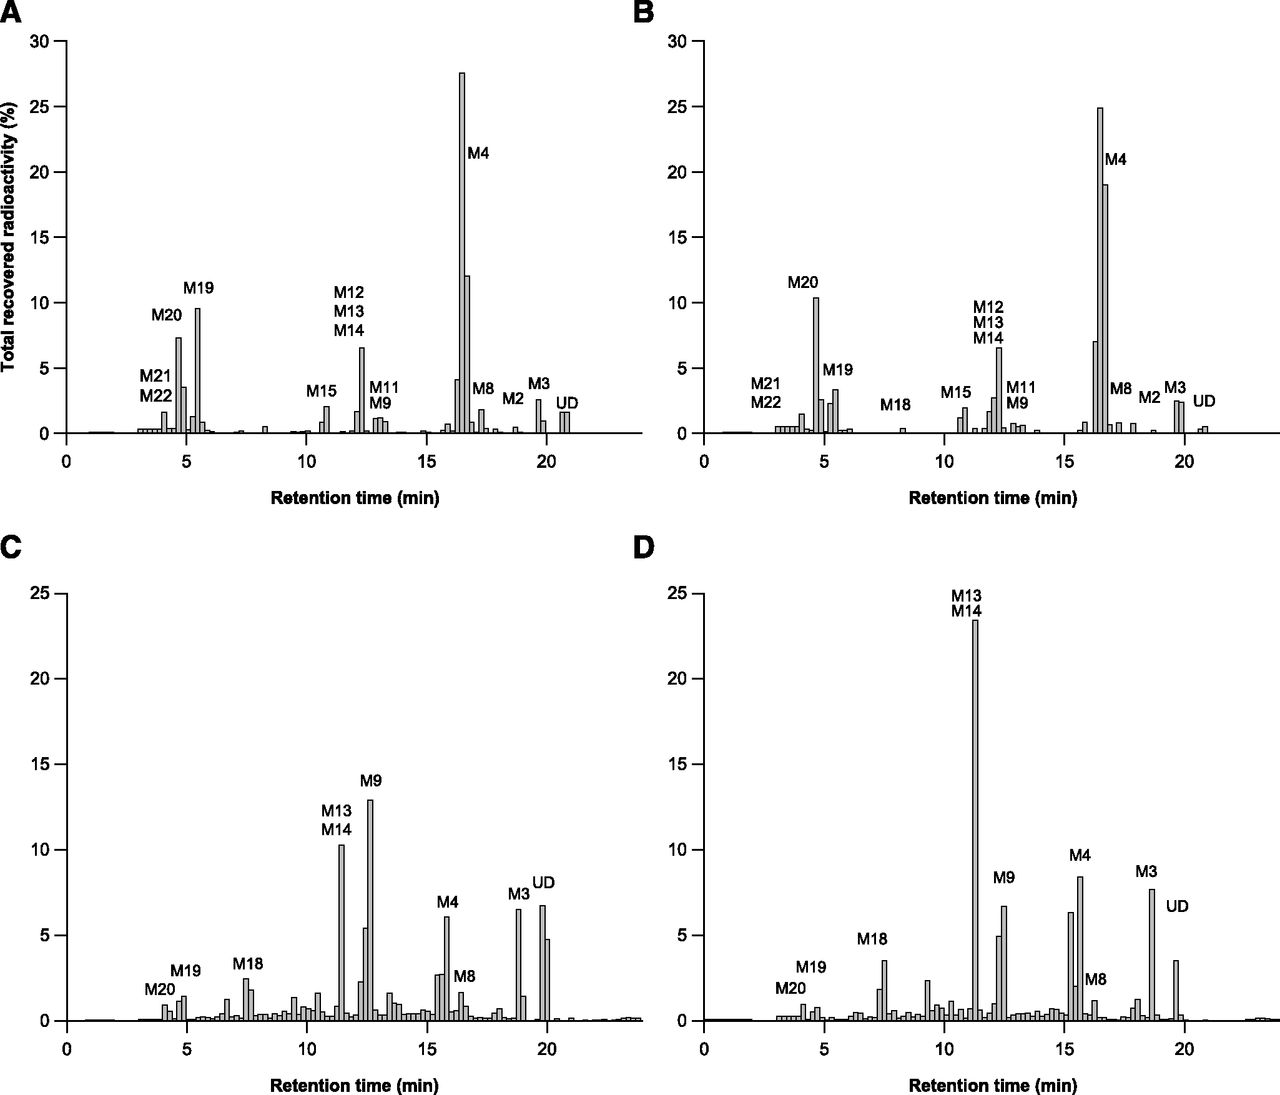
Radiochromatograms for human urine [0–240 hours (A); 240–1680 hours (B)] and human feces ([0–240 hours (C); 240–1680 hours (D)] after a single oral dose of 240 mg of apalutamide.
Mass balance of unchanged 14C-apalutamide and its metabolites expressed as a percentage of the administered dose and found in urine and feces after oral administration of 240 mg of apalutamide
Metabolite formation pathways and their retention times are summarized in Table 3. Six main metabolic clearance pathways for apalutamide were identified based on the nature of the observed metabolites. These clearance pathways are described as follows in order of importance (Fig. 4): 1) N-demethylation of the N-methylbenzamide moiety to M3, followed by amide hydrolysis to M4; 2) direct amide hydrolysis of the N-methylbenzamide moiety to M4 (pathways 1 and 2 taken together are the most important metabolic clearance pathways); 3) ring opening of the diazaspiro octanyl moiety followed by loss of the N-(6-cyano-5-(trifluoromethyl) pyridin-3-yl) methanethioamide group (M19), with subsequent N-demethylation (M20) and glucuronidation (M21 and M22); 4) nitrile hydrolysis of the cyano-pyridinyl moiety (M13), followed by N-demethylation (M15) and amide hydrolysis (M18); 5) cysteine condensation with the cyano-pyridinyl moiety (M9) (Berteotti et al., 2014) followed by N-demethylation (M14) and amide hydrolysis (M17); and 6) oxidation of the diazaspiro octanyl moiety (M8) followed by O-glucuronidation (M11). In contrast, the condensation of cysteine-glycine with the cyano-pyridinyl moiety (M10, M12) and oxidative desulfuration to metabolite (M2) were minor excretion pathways. The cysteinyl glycine adducts M10 and M12 are presumed to be formed via the Pinner reaction (Kalgutkar, 2017). This reaction involves reversible addition of apalutamide to the cysteine of glutathione followed by rearrangement to the more stable cyclic form by enzymatic removal of the glutamyl residue, as described in the literature for odanacatib (Kassahun et al., 2014). The cysteine adducts M9, M14, and M17 can be formed by the reaction of apalutamide to cysteine via the same mechanism or can be formed as downstream metabolites of the cysteine-glycine adducts. Metabolites M9, M10, M12, M14, and M17 are indicative of some intrinsic reactivity of the nitrile function of apalutamide. The reaction scheme for the Pinner reaction is provided in Supplemental Fig. 1. Unchanged drug was mainly excreted in urine, but also was present as a minor entity in feces. M4 was the main metabolite identified in both urine and feces, with M3, M9, M13, M14, M15, M17 (trace), M19, and M20 also common to both routes of elimination.
Identification of in vivo metabolites of apalutamide after a single oral dose of 240 mg in healthy men
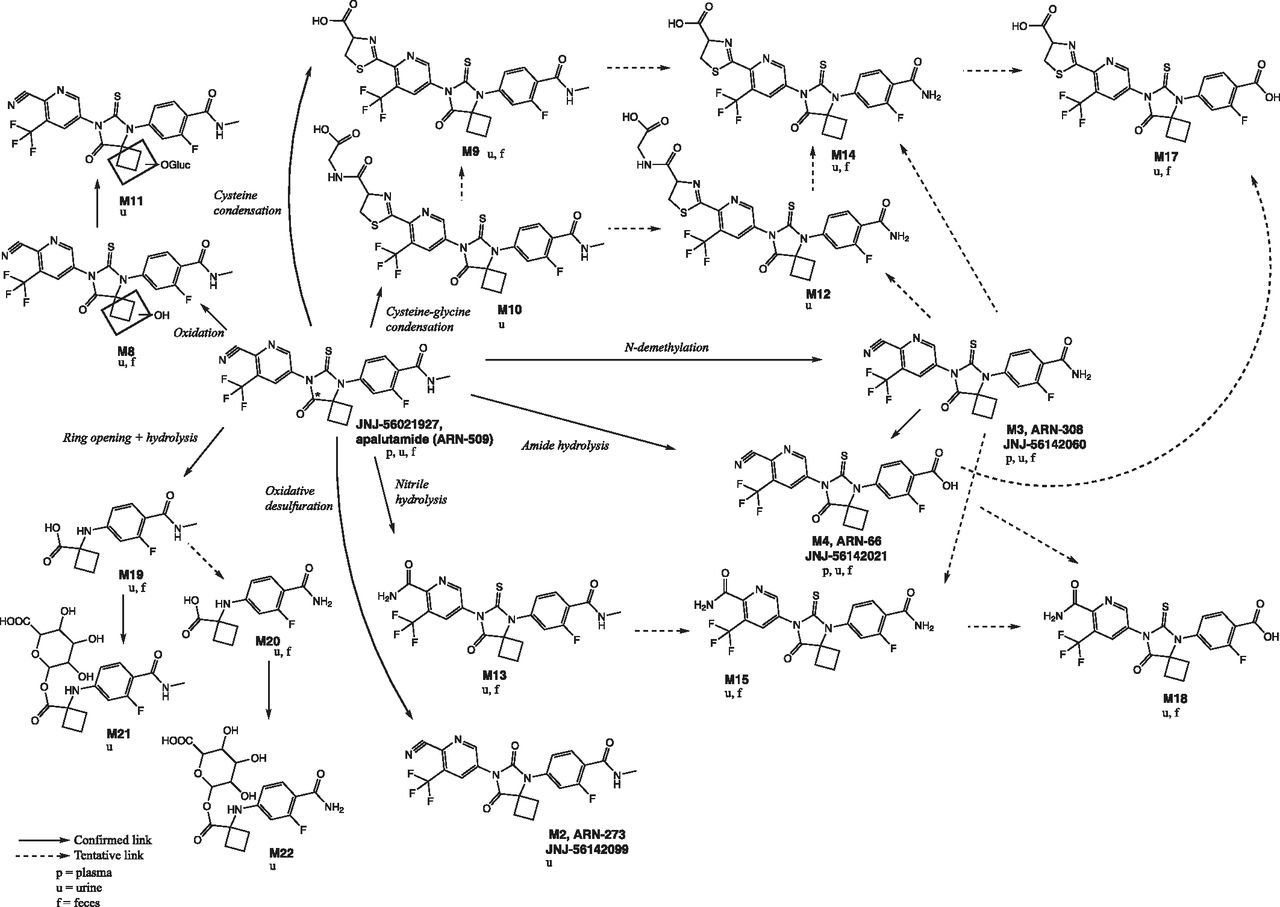
Proposed scheme of apalutamide metabolism in human plasma, urine, and feces. The 14C label, marked with an *, is at the 8 position of the 8-oxo-6-thiooxo-5,7-diazaspiro[3,4]octan-5-yl ring.
Safety.
The safety profile of apalutamide in parts A and B of this study was similar to that in previous reports, with no serious AEs or discontinuations due to AEs.
In Vitro Phenotyping in Human Hepatocytes
The turnover of apalutamide in human hepatocytes using an in vitro relay method over 16 hours of incubation was low, with the dynamic range of its intrinsic clearance too low to phenotype the metabolic enzymes involved. Therefore, the involvement of cytochrome P450 and esterases in the metabolism of apalutamide was determined based on the formation of M3 and M4 in the presence of inhibitors. After four relays, gemfibrozil, itraconazole, and troleandomycin inhibited the formation of M3 by 55%, 17%, and 23%, respectively (Fig. 5A). BNPP resulted in a 42% reduction in M3, whereas BNPP plus ABT completely inhibited the metabolism of apalutamide to M3 (Fig. 5A). Gemfibrozil, itraconazole, and troleandomycin had no significant inhibition effects on the formation of M4 (Fig. 5B). No metabolite formation was observed for BNPP or BNPP plus ABT (Fig. 5B). The conversion of M3 to M4 was mediated almost exclusively by esterases, since the formation of M4, after four relays involving the incubation of M3, was completely inhibited by BNPP alone, and only inhibited to a minor extent by ABT.

Effect of specific esterase and cytochrome P450 inhibitors on the formation of M3 (A) or M4 (B) from apalutamide in human hepatocytes. GEM, gemfibrozil + gemfibrozil glucuronide; ITRA, itraconazole; TOA, troleandomycin.
Metabolite Structure Elucidation by LC-MS/MS
The identified metabolites, diagnostic product ions, and theoretical exact m/z are presented in Table 3. The identity of metabolites M3, M2, and M4 were additionally confirmed by chromatography with a reference standard. The identity of M9 was confirmed by two-dimensional nuclear magnetic resonance (NMR) spectroscopy analysis. Details of the structural elucidation of apalutamide and its metabolites by multiple-stage MS analyses are described in the following sections; the proposed structures of detected metabolites were used to postulate the in vivo metabolic pathways for apalutamide in humans (Fig. 4). Mass spectra of unchanged drug and major human plasma metabolites are shown in Figs. 6 and 7. Further supporting information for the proposed structures and diagnostic product ions of M19 (Supplemental Fig. 2) and M10 (Supplemental Fig. 3) are included in the Supplemental Material.

Accurate mass full scan (A) and product ion mass spectra (B) of apalutamide.

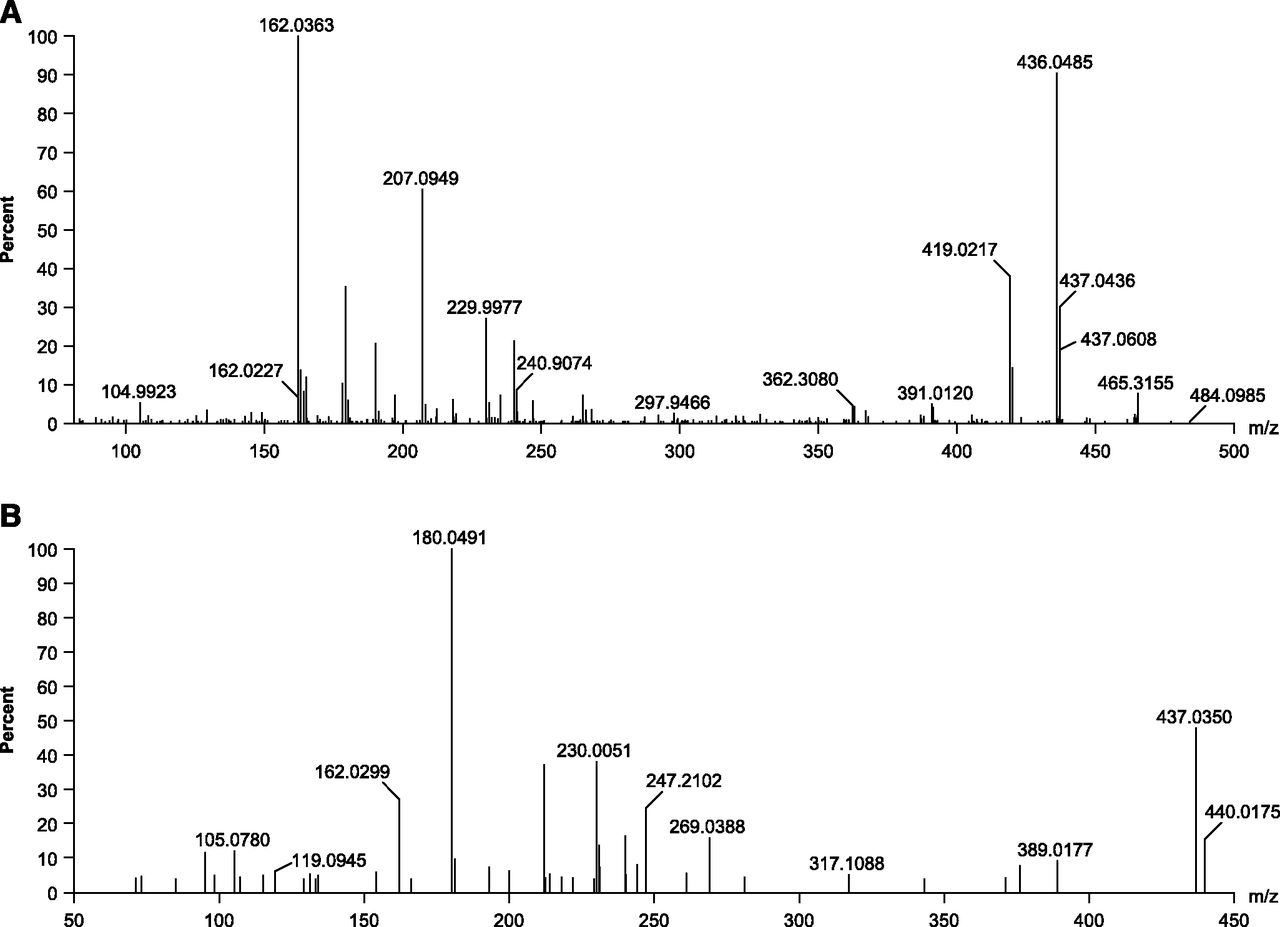
Product ion mass spectra of M3 (A) and M4 (B).
Apalutamide
The accurate full scan and product ion mass spectra of apalutamide are shown in Fig. 6. Full-scan mass analysis gave an [M+H]+ at m/z 478.0946 (C21H16N5O2F4S; 14.5 rings plus double bonds; −3.1 ppm). A proposed structure of the main apalutamide product ions is shown in Supplemental Fig. 4.
M2
The [M+H]+ of M2 at m/z 462 was 16 Da lower than that of apalutamide. The calculated elemental composition obtained by exact mass measurement corresponds to oxidative desulfuration of the parent drug. The shifted accurate mass product ions at m/z 434 (450 − 16), 403 (419 − 16), and 214 (230 − 16), and unchanged ions at m/z 193 and 162 were consistent with this structure assignment.
M3
The [M+H]+ of M3 at m/z 464 was 14 Da lower than that of apalutamide. The calculated elemental composition obtained by exact mass measurement corresponds to the loss of 1 C and 2 H from the parent drug, pointing to demethylation of the N-methylbenzamide moiety. Diagnostic accurate mass product ions at m/z 436 (450 − 14), 207 (221 − 14), and 179 (193 − 14) as well as unchanged ions at m/z 447, 419, 190, and 162 were consistent with this structure.
M4
The [M+H]+ of M4 at m/z 465 was 13 Da lower than that of apalutamide. The calculated elemental composition obtained by exact mass measurement corresponds to the loss of 1 C, 3 H, and 1 N, and the gain of 1 O relative to the parent drug. The unchanged ions at m/z 230 and 162 indicate that the site of metabolism is at the N-methylbenzamide part of the molecule. Based on the elemental composition change and the site of metabolism, the N-methylbenzamide moiety is metabolized to a carboxylic acid. The accurate mass product ions at m/z 437 (450 − 13), 208 (221 − 13), and 180 (193 − 13) are consistent with this structure assignment.
M8
The [M+H]+ of M8 at m/z 494 was 16 Da higher than that of apalutamide. The calculated elemental composition obtained by exact mass measurement corresponds to oxidation (+1 O) of the parent drug. The shifted accurate mass product ions at m/z 219 (221 + 16 H2O) and 206 (190 + 16) and the unchanged ions at m/z 450, 419, 381, 230, 211, 193, and 162 indicate that the oxidation should be located at the diazaspirooctanyl moiety.
M9
The [M+H]+ of M9 at m/z 582 was 104 Da higher than that of apalutamide. The calculated elemental composition obtained by exact mass measurement corresponds to the addition of C3H4O2S to the parent drug. The unchanged ion at m/z 249 and the shifted ion at m/z 334 (230 + 104) proves that metabolism took place at the N-(6-cyano-5-(trifluoromethyl)pyridin-3-yl)) part of the molecule. This, in combination with the elemental composition change and the presence of a cysteinyl-glycine condensation product (metabolite M10; +57 U [glycine] relative to M9) in the same sample point to a condensation of cysteine with the cyano-pyridinyl moiety of the parent drug (Maltsev et al., 2013; Berteotti et al., 2014). The complementary ions at m/z 478 and 105.0007 [mercaptopropanoic acid (C3H5O2S); 0.2 mDa error] are in agreement with this structure assignment. The structure as shown in Fig. 4 was assigned. M9 was synthesized following Maltsev et al. (2013), by reacting 1 Eq of apalutamide with 1.5 Eq cysteine, 1.5 Eq NaHCO3, and a catalytic amount of 1 M NaOH in methanol/water for 24 hours at room temperature under continuous stirring. The sample was neutralized with 1 M HCl prior to isolation using preparative HPLC. The structure was confirmed by one-dimensional 1H and 13C NMR analysis as well as two-dimensional correlation spectroscopy, heteronuclear single-quantum coherence spectroscopy, and heteronuclear multiple-bond connectivity NMR analysis of the synthesized M9 (data on file).
M10
The [M+H]+ of M10 at m/z 639 was 161 Da higher than that of apalutamide. The calculated elemental composition obtained by exact mass measurement corresponds to the addition of C5H7NO3S to the parent drug. The unchanged ion at m/z 249 and the shifted ion at m/z 391 (230 + 161) proves that metabolism took place at the N-(6-cyano-5-(trifluoromethyl)pyridin-3-yl)) part of the molecule. This, in combination with the elemental composition change and the complementary ions at m/z 478 and 162 (162.022, not to be confused with 162.035 from apalutamide fragmentation; see Supplemental Fig. 3) point to a condensation of cysteine-glycine with the cyano-pyridinyl moiety of the parent drug (Maltsev et al., 2013). Also, the fragment ions at m/z 536, 508, and 116 (see Supplemental Fig. 3) are in agreement with this structure.
M11
The [M+H]+ of M11 at m/z 670 was 176 Da higher than that of M8. The calculated elemental composition points to glucuronidation of M8. A fragment at m/z 494 is formed via in-source fragmentation. When MS2 is performed on either m/z 670 or on the in-source fragmentation product at m/z 494, then the resulting MS2 spectrum shows high similarity with the MS2 spectrum of M8, with diagnostic accurate mass product ions at m/z 450, 419, 381, 219 (221 + 16-H2O), 193, and 162.
M12
The [M+H]+ of M12 at m/z 625 is 14 Da lower than that of M10. The calculated elemental composition as well as the −14-U shift of the ion at m/z 235 (249 − 14) point to the demethylation at the N-methylbenzamide moiety. The ions at m/z 162 and 116 are unchanged compared with the M10 fragmentation and confirm the cysteinyl-glycine condensation. The structure as shown in Fig. 4 was assigned.
M13
The [M+H]+ of M13 at m/z 496 was 18 Da higher than that of apalutamide. The calculated elemental composition obtained by exact mass measurement corresponds to the addition of H2O relative to the parent drug. The unchanged ion at m/z 249 and the shifted ion at m/z 248 (230 + 18) demonstrate that the addition of H2O took place at the N-(6-cyano-5-(trifluoromethyl)pyridin-3-yl)) part of the molecule. The neutral loss of ammonia from the parent ion and from the ion at m/z 248, resulting in the base peak at m/z 479 and the fragment at m/z 231, respectively, is characteristic for the presence of a primary amine or amide in the structure. Therefore, M13 should be the carboxamide metabolite formed by hydrolysis of the nitrile function.
M14
The [M+H]+ of M14 at m/z 568 was 14 Da lower than that of M9, pointing to the demethylation of M9. The calculated elemental composition and the −14-U shift of the ion at m/z 235 (249 − 14) confirm the demethylation at the N-methylbenzamide moiety. The ions at m/z 334 and 105 are unchanged compared with the M9 fragmentation and confirm the cysteine addition.
M15
The [M+H]+ of M15 at m/z 482 was 14 Da lower than that of M13. The calculated elemental composition and the −14-U shift of the ion at m/z 235 (249 − 14) point to an additional demethylation of the N-methylbenzamide moiety. M15 is likely to be a downstream demethylated metabolite from M13, as was also confirmed by the same ions at m/z 248 (230 + 18) and a neutral loss of ammonia from the latter giving rise to the fragment at m/z 231.
M17
The [M+H]+ of M17 at m/z 569 was 13 Da lower than that of M9. The calculated elemental composition obtained by exact mass measurement corresponds to the loss of 1 C, 3 H, and 1 N and addition of 1 O relative to M9. The mercaptopropanoic acid ion at m/z 105 and the shift of the ion at m/z 334 (230 + 104) are consistent with the cysteine condensation reaction at the N-(6-cyano-5-(trifluoromethyl)pyridin-3-yl)) part of the molecule. The −13-U shifts of the ions at m/z 208 (221 − 13) and 236 (249 − 13) are consistent with oxidative deamidation at the N-methylbenzamide.
M18
The [M+H]+ of M18 at m/z 483 was 13 Da lower than that of M13. The calculated elemental composition obtained by exact mass measurement corresponds to the addition of 2 O and the loss of 1 C, 1 H, and 1 N relative to the parent drug. The −13-U shift of the ion at m/z 236 (249 − 13) points to oxidative deamidation of the N-methylbenzamide to a carboxylic acid (−CH3N + O). The remaining elemental composition change indicates an H2O addition to the other side of the molecule. The neutral loss of ammonia from the parent ion, giving rise to the base peak ion at m/z 466, points to the presence of a primary amine or amide. The neutral loss of CO2 in the negative ion mode MS2 spectrum, giving rise to the ion at m/z 437, is characteristic for an aromatic carboxylic acid. Therefore, a metabolite structure resulting from nitrile hydrolysis to a carboxamide and deamidation of the N-methylbenzamide to a carboxylic acid was assigned.
M19
The [M+H]+ of M19 at m/z 267 was 211 Da lower than that of apalutamide. The calculated elemental composition obtained by exact mass measurement corresponds to the addition of 1 O and loss of C8F3N3S, which can metabolically be explained by ring opening of the diazaspirooctanyl moiety followed by loss of the N-(6-cyano-5-(trifluoromethyl)pyridin-3-yl)) methanethioamide group. A proposed structure of the main M19 product ions is shown in Supplemental Fig. 2.
M20
The [M+H]+ of M20 at m/z 253 was 14 Da lower than that of M19. The calculated elemental composition points to a demethylation of metabolite M19. The MS2 spectrum of M20 shows high similarity with that of M19 with accurate mass product ions at m/z 225 (239 − 14) and 179 (193 − 14) that have shifted because of the demethylation, whereas the ions at m/z 236, 208, 190, 162, and 138 are unchanged relative to M19.
M21
The [M+H]+ of M21 at m/z 443 was 176 Da higher than that of M19. The calculated elemental composition points to glucuronidation of M19. Diagnostic accurate mass product ions at m/z 267, 239, 236, 208, and 162 (Supplemental Fig. 4) and at m/z 221 (Supplemental Fig. 2) are consistent with this structure assignment. The aglycone ion at m/z 267 is also formed via in-source fragmentation and showed the M19 product ions at m/z 236, 208, and 162 upon MS2 fragmentation.
M22
The [M+H]+ of M22 at m/z 429 was 176 Da higher than that of M20, pointing to glucuronidation of M20. This was confirmed by the elemental composition assignment and fragmentation providing the M20 MS2 product ions at m/z 236, 225, 208, and 162. The aglycone ion at m/z 253 is also formed via in-source fragmentation and showed the diagnostic accurate mass product ions at m/z 236, 225, 208, and 162 upon MS2 selection.
Discussion
This open-label, phase 1 pharmacokinetic study was designed to assess the absorption, metabolic pathways, and route of excretion of orally administered apalutamide, with additional in vitro studies undertaken to assess the metabolism and phenotyping of apalutamide and M3 in human hepatocytes. Part A of this phase 1 study specifically determined the absolute bioavailability of apalutamide administered orally and via intravenous infusion using a microtracer approach for which microdose quantities of 14C-radiolabeled apalutamide were delivered. Administration of apalutamide was associated with a high absolute oral bioavailability of approximately 1.0 and low systemic clearance, consistent with that observed in single-dose in vivo pharmacokinetic studies in mouse and dog, which showed high oral bioavailability of approximately 93% (mouse) and 149% (dog) with a suspension or solution formulation, and low clearance of below 0.1 l/h per kg with a long plasma half-life of approximately 18 and 90 hours, respectively (Clegg et al., 2012).
Based on in vitro studies with Caco-2 cells, apalutamide was predicted to have high permeability in the human intestine; the apical-to-basolateral permeability was 42.3 × 10⁻⁶ cm/s (data on file). The high permeability and absolute oral bioavailability are further supported by the results from part B of the mass-balance study, where 88.9% of the orally administered apalutamide dose was recovered in urine (64.6%) or in feces (24.3%). The amount excreted in feces as unchanged apalutamide represents 1.54% of the administered dose, suggesting that the majority of the dose was absorbed after oral dosing. The AME profile of orally administered apalutamide was characterized by rapid initial absorption, as shown by a Tmax of 1.0–1.5 hours followed by slow elimination over a period of several weeks, predominantly via urine in the form of metabolites, but also in feces to a smaller extent. Consistent with elimination kinetics, the metabolism of apalutamide to form its major metabolite M3 proceeded with a prolonged Tmax and elimination half-life of more than 1 week. M4, in contrast, had a Tmax of 3.0 hours, and 15-fold to 21-fold lower exposure compared with either apalutamide or M3. Based on systemic exposure, relative potency, and pharmacokinetic properties, M3 likely contributed to approximately 28%–32% of the clinical activity of apalutamide.
Six main metabolic clearance pathways for apalutamide could be distinguished based on the nature of the identified metabolites after a single dose of 14C-apalutamide. Of these, N-demethylation of the N-methylbenzamide moiety to M3 then benzamide hydrolysis to M4, together with direct benzamide hydrolysis to M4, are the most relevant clearance pathways. The relative importance of the two pathways on the formation of M4 is unknown. M4 is an inactive minor metabolite and is therefore of minor clinical relevance, but the formation of M4 is nevertheless important from a drug clearance perspective. Clearance of the parent drug as M3 without subsequent benzamide hydrolysis is minor, with only 4.5% of the dose excreted as M3. Metabolites of all pathways were common to both urinary and fecal elimination routes, with the exception of metabolites of the oxidation pathway, which were principally identified in urine alone.
There were no deaths or other serious AEs reported, and no discontinuations due to AEs. AEs that were considered possibly related to treatment were consistent with the tolerability profile reported for apalutamide in clinical studies (Rathkopf et al., 2013; Smith et al., 2016, 2018). Overall, single-dose treatment with 240 mg of apalutamide plus a microdose 14C-labeled apalutamide was well tolerated in healthy men.
Because of the very low turnover of apalutamide and M3 in human liver S9 fractions and human liver microsomes, the effect of cytochrome P450 and esterase inhibitors was measured in human hepatocytes using itraconazole, gemfibrozil, and BNPP as specific inhibitors of CYP3A4, CYP2C8, and esterases, respectively. An in vitro relay method (Di et al., 2012) was used to investigate the metabolic pathways of hepatic clearance of apalutamide and the potential contribution of cytochrome P450 isoforms and esterases to the formation of M3 and M4. The addition of relay steps to prolong exposure time ensures that a drug such as apalutamide with a low intrinsic clearance can be continuously metabolized in vitro beyond the 4-hour limit of conventional human hepatocyte suspension incubations by regularly replacing cells with freshly thawed hepatocytes. Diagnostic inhibitors of cytochrome P450 and esterase enzymes were used to demonstrate that the metabolism of apalutamide to M3 was predominantly mediated by CYP2C8 and, to a lesser extent, by CYP3A4. Various other drugs have been described in the literature that are dual substrates of CYP2C8 and CYP3A4 for N-demethylation reactions. This is, for instance, the case for imatinib, tozasertib, and zopiclone (Backman et al., 2016). Although the inhibition of M3 formation was observed after incubation with the esterase inhibitor BNPP, this was possibly linked to the nonspecific inhibition of CYP2C8 and CYP3A4 by BNPP (Supplemental Table 1). BNPP completely inhibited the conversion of M3 to M4, whereas the effect of ABT on the formation of M4 was minimal, indicating that the observed inhibition with BNPP was not the result of nonspecific cytochrome P450 inhibition but rather was mediated predominantly by esterases, presumably carboxylesterases. Hydrolysis of a benzamide group, as for the biotransformation from M3 to M4, is a common biotransformation, and has been described for various other drugs, including ochratoxin A (Wu et al., 2011), dabigatran (Blech et al., 2008), GW695634 N-((4-(2-(4-chloro-2-(3-chloro-5-cyanobenzoyl)phenoxy)acetamido)-3-methylphenyl)sulfonyl)propanamide) (de Serres et al., 2010), and GSK1018921 (2-methoxy-N-(2-methyl-1-phenyl-2-(pyrrolidin-1-yl)propyl)-4,6-bis(trifluoromethyl)benzamide) (Griffini et al., 2010).
This study had several limitations. The absolute bioavailability of apalutamide in part A was 111%. This finding potentially reflects the variability of the two analytical methods applied (i.e., LC-MS/MS for the quantification of apalutamide and HPLC fractionation followed by AMS for quantification of 14C-apalutamide), with both methods having an accepted precision and accuracy within 15%. There was no evidence of any relevant adsorption of the intravenous dose to the syringes or infusion lines, which could also explain the observed high absolute oral bioavailability of apalutamide. In part B, metabolism of apalutamide was evaluated after single-dose administration only. A previous pharmacokinetic study showed that apalutamide clearance increases over time as a result of autoinduction (ERLEADA, 2018), indicating that metabolism should ideally be evaluated at steady state after repeat dosing. Nonetheless, the metabolite profile based on the M3/apalutamide AUC ratio was comparable to that achieved with repeat dosing in the earlier study. However, the differential role of CYP2C8 and CYP3A4 in the metabolism of apalutamide is expected to change at steady state when CYP3A4 is fully induced.
In conclusion, this study showed that a single dose of apalutamide was completely absorbed with an absolute bioavailability of approximately 100% after oral administration. The long plasma half-life and low clearance of apalutamide, together with its observed pharmacokinetics, support once-daily oral administration. Apalutamide was extensively metabolized with little unchanged drug detected in the urine or feces, and with metabolic profiling confirming M3 as the major active metabolite. The low recovery of apalutamide and M3 in urine, with less than 4% of the dose excreted in urine as the parent compound and M3 combined, indicates that hepatic metabolism plays a major role in the overall elimination of apalutamide. In vitro findings confirmed the role of CYP2C8 and CYP3A4 in the metabolism of apalutamide, which was predominantly mediated by CYP2C8 and, to a lesser extent, by CYP3A4. The conversion of M3 to the inactive carboxylic acid metabolite M4 is mediated exclusively by esterases, likely carboxyesterases.
Acknowledgments
Editorial assistance was provided by William Turner, and Ira Mills, of PAREXEL, with funding from Janssen Global Services, LLC.
Authorship Contributions
Participated in research design: Snoeys and Chien.
Conducted experiments: de Vries and Jacobs.
Performed data analysis: de Vries, Jacobs, Snoeys, Cuyckens, and Chien.
Wrote or contributed to the writing of the manuscript: de Vries, Jacobs, Mannens, Snoeys, Cuyckens, Chien, and Ward.
Footnotes
- Received October 2, 2018.
- Accepted February 4, 2019.
This study was funded by Janssen Research & Development.
↵
 This article has supplemental material available at dmd.aspetjournals.org.

Abbreviations
- ABT
- aminobenzotriazole
- AE
- adverse event
- AME
- absorption, metabolism, and excretion
- AMS
- accelerator mass spectrometry
- AUC
- area under the plasma concentration-time curve
- AUC0–inf
- area under the plasma concentration-time curve from time zero to infinity
- AUC0–t
- area under the plasma concentration-time curve from time zero to the last time point with a measurable concentration
- BNPP
- bis-nitrophenol phosphate
- CRPC
- castration-resistant prostate cancer
- HPLC
- high-performance liquid chromatography
- LC
- liquid chromatography
- M
- metabolite
- M3
- N-desmethyl metabolite
- M4
- carboxylic acid metabolite of apalutamide
- MS
- mass spectrometry
- MS/MS
- tandem mass spectrometry
- m/z
- mass/charge ratio
- NMR
- nuclear magnetic resonance
- Tmax
- time to Cmax
- Copyright © 2019 by The American Society for Pharmacology and Experimental Therapeutics


