


Article Figures & Data
Figures
- Fig. 1.
Representative kinetic profiles of (A) THC depletion, (B) 11-OH-THC formation, (C) 11-OH-THC depletion by UGT and P450 enzymes, and (D) COOH-THC formation in pooled HLMs from one (of three to four) independent experiment, each with duplicate determinations. Depletion rate constant (kdep) and formation rate (V) were obtained from cannabinoid concentration–time profiles (see Supplemental Fig. 1 for representative profiles). Substrate depletion (eq. 5) and metabolite formation (eq. 7) were used to determine kinetic parameters (Vmax and Km). A substrate inhibition model (eq. 8) was used to model COOH-THC formation kinetics. Kinetic parameters estimated from these data were used as initial estimates for the subsequent modeling of cannabinoid depletion and formation kinetics using the P450 and UGT kinetics models shown in Fig. 3.
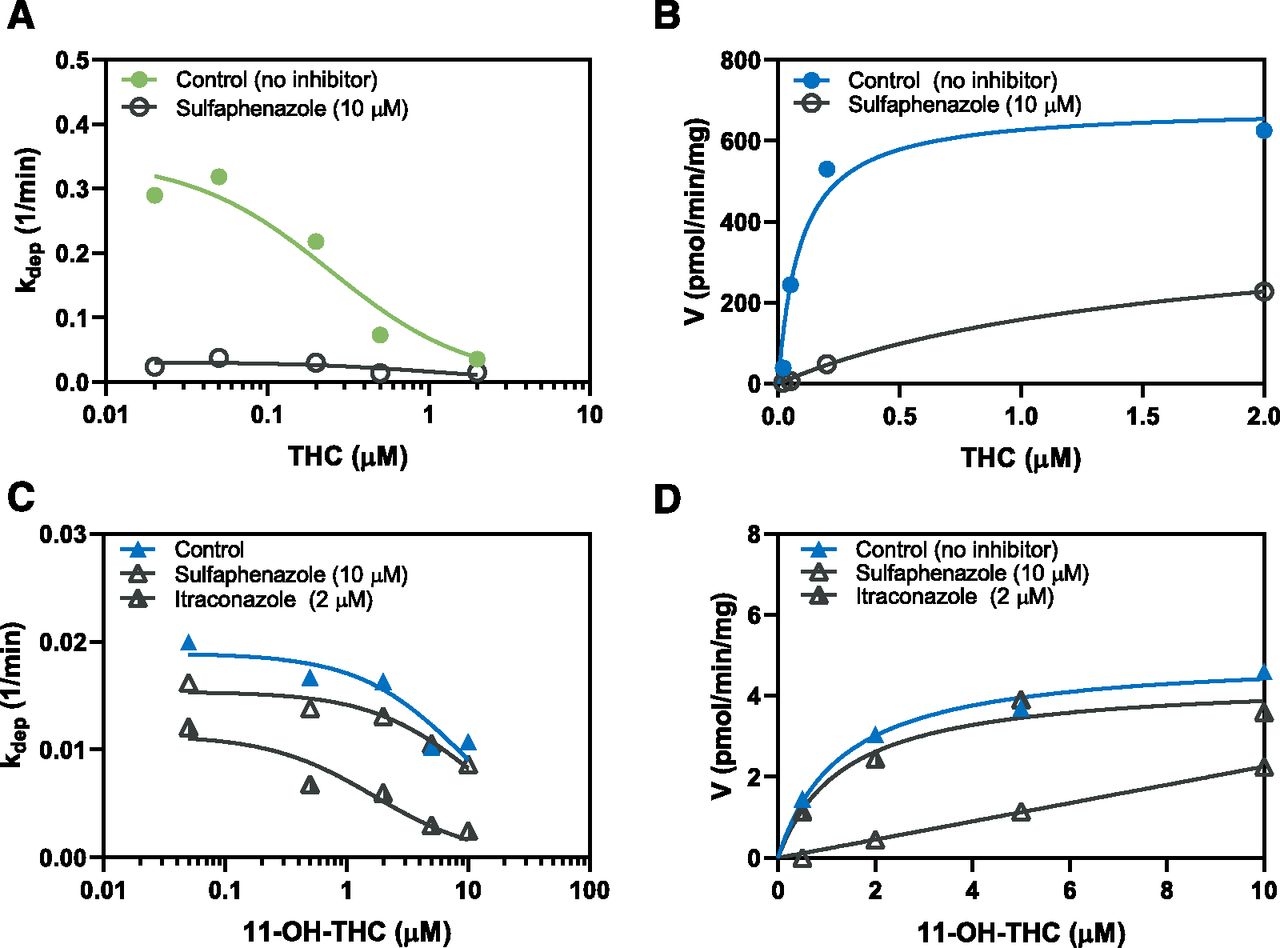
- Fig. 2.
Representative kinetic profiles of (A) THC depletion, (B) 11-OH-THC formation, (C) 11-OH-THC depletion by P450 enzymes, and (D) COOH-THC formation in the presence and absence of sulfaphenazole (CYP2C9 inhibitor) and itraconazole (CYP3A inhibitor) from one (of three) independent experiment, each with duplicate determinations. Inhibition studies were performed over a range of cannabinoid concentrations that spanned the nonlinear kinetic range (see Fig. 1). Substrate depletion (eq. 5) and metabolite formation (eq. 7) were used to determine kinetic parameters (Vmax and Km). Representative concentration–time curves are shown in Supplemental Fig. 2.
- Fig. 3.
The (A) P450 kinetic model was developed to account for individual P450 pathways using previous data that identified the enzymes and their respective fm values that are relevant to THC and 11-OH-THC disposition in pooled HLMs (Patilea-Vrana et al., 2019). (B) The UGT kinetic model was not split up to account for individual UGT pathways due to lack of selective UGT inhibitors (Patilea-Vrana et al., 2019). The P450 and UGT kinetic models were fitted to the concentration–time profiles of THC, 11-OH-THC, and COOH-THC after incubation with either THC (green arrow) or 11-OH-THC (blue arrow) in the absence or presence of sulfaphenazole (SLF, CYP2C9 inhibitor) and itraconazole (ITZ, CYP3A inhibitor). Kinetic models were fit to data from three to four independent experiments. Kinetic parameters from Table 2 were used as initial estimates. Description of the governing ordinary differential equations can be found in the Supplemental Material.
- Fig. 4.
Observed (markers) and model prediction (lines) of THC concentration–time profiles in the (A) absence and (B) presence of sulfaphenazole, 11-OH-THC formation in the (C) absence, and (D) presence of sulfaphenazole, 11-OH-THC depletion by P450 enzymes in the (E) absence and presence of (F) sulfaphenazole and (G) itraconazole, (H) 11-OH-THC depletion by UGT enzymes, and (I) COOH-THC formation in the absence of inhibitors. Additional goodness-of-fit graphs are shown in Supplemental Fig. 3.
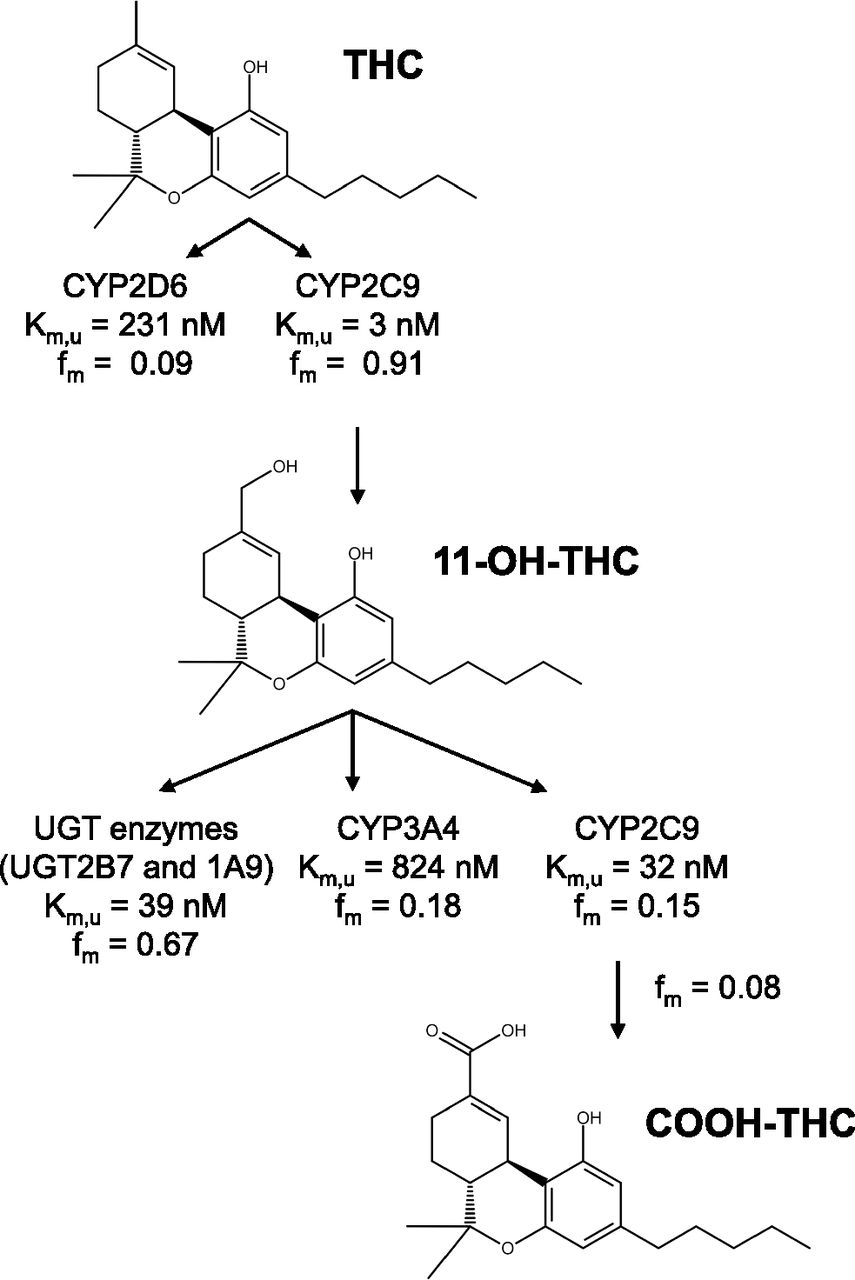
- Fig. 5.
Enzymatic pathways and kinetics of THC, 11-OH-THC, and COOH-THC in HLMs.


Tables
- TABLE 1
Nonspecific, HLM incubation, and plasma protein binding of THC and 11-OH-THC
Data shown are mean ± S.D. of three independent experiments with four to six replicates per experiment.
Cannabinoid fadsorbeda fuincb fupc THC 0.927 ± 0.041 0.040 ± 0.015 0.011 ± 0.001 11-OH-THC 0.864 ± 0.049 0.061 ± 0.025 0.012 ± 0.002 ↵a The fraction of THC or 11-OH-THC nonspecifically bound to the LB tube surface in buffer was calculated using R; the LB surface partition ratio (eq. 1) as fadsorbed = 1 − R/(R + 1).
↵b Tube adsorption method was used to measure fraction unbound in incubations (fuinc) of THC (500 nM) and 11-OH-THC (50 nM) in the presence of 0.2% BSA and 0.02 or 0.1 mg/ml HLM for THC and 11-OH-THC, respectively.
↵c Ultracentrifugation with diluted plasma was used to measure plasma protein binding (fup) of THC (500 nM) and 11-OH-THC (50 nM).
- TABLE 2
Kinetic parameters quantified using the substrate depletion and metabolite formation approach in pooled HLMs
Data shown are mean ± S.D. of three to four independent experiments with duplicate determinations per experiment. Error propagation was applied to the S.D. of Km,u and CLint using
 where ± and ± represents the mean ± S.D. of fuinc and Km or CLint,u, respectively. The values shown here were used as initial estimates for the P450 and UGT kinetic model (Fig. 3).
Pathway Inhibitor Vmax Kma Km,ub CLint pmol/min per milligram μM nM ml/min per milligram THC depletion None 3150 ± 1310 0.18 ± 0.10 7 ± 5 435.3 ± 217.0 Sulfaphenazole (10 μM) 1064 ± 580 0.57 ± 0.47 24 ± 21 50.9 ± 21.3 11-OH-THC formation None 803 ± 162 0.18 ± 0.05 8 ± 3 111.1 ± 48.8 Sulfaphenazole (10 μM) 515 ± 136 1.42 ± 0.13 60 ± 21 8.7 ± 2.9 11-OH-THC depletion (P450s) None 2550 ± 107 11.0 ± 0.6 669 ± 296 3.8 ± 1.7 Sulfaphenazole (10 μM) 1701 ± 96.0 10.5 ± 1.1 679 ± 242 2.5 ± 0.9 Itraconazole (2 μM) 194 ± 111 1.7 ± 1.1 112 ± 78 1.8 ± 0.6 COOH-THC formation None 8 ± 1 1.5 ± 0.3c 92 ± 45 0.09 ± 0.04 Sulfaphenazole (10 μM) n.d. n.d. n.d. 0.01 ± 0.00d Itraconazole (2 μM) 5 ± 1 0.98 ± 0.55 63 ± 42 0.09 ± 0.07 11-OH-THC depletion (UGTs) None 910 ± 99 1.87 ± 0.24 114 ± 52 8.1 ± 3.9 n.d., not determined.
Inhibition by sulfaphenazole did not lead to saturation of COOH-THC formation, and, as such, Vmax and Km could not be determined.
↵a Not adjusted for incubation binding (fuinc).
↵b Adjusted for incubation binding (fuinc).
↵c COOH-THC formation was fitted using a substrate inhibition model (eq. 8); Ki was 52.1 ± 14.3 μM.
↵d CLint was determined from the linear slope of [11-OH-THC] vs. velocity of COOH-THC formation.
- TABLE 3
Kinetic parameters estimate and CV% using the P450 and UGT kinetic models
The P450 and UGT kinetic models were fitted to data from three to four independent experiments (see Materials and Methods and Fig. 3). Kinetic parameters shown in Table 2 were used as initial estimates. Data shown are parameter estimate and the confidence in these estimates (CV%). Km,u and CLint parameter estimates and CV% were corrected for incubation binding using fuinc.
Pathway Enzyme(s) Vmax Km Km,u CLint pmol/min per milligram μM nM ml/min per milligram THC depletiona P450s — — — 235.6 (48%) 11-OH-THC formation CYP2C9 624 (2%) 0.07 (4%) 3 (36%) 214.4 (34%) Unknown THC metabolite formationb CYP2D6 4905 (17%) 5.48 (20%) 231 (44%) 21.3 (34%) 11-OH-THC depletiona P450s/UGTs — — — 12.3 (26%) COOH-THC formation CYP2C9 5 (2%) 0.50 (4%) 32 (44%) 0.15 (34%) Unknown 11-OH-THC metabolite formationb CYP2C9 54 (6%) 0.50 (4%) 32 (44%) 1.7 (34%) Unknown 11-OH-THC metabolite formationb CYP3A 1826 (6%) 12.8 (8%) 824 (59%) 2.2 (34%) Unknown 11-OH-THC metabolite formationb UGT2B7/1A9 343 (4%) 0.64 (4%) 39 (44%) 8.8 (44%) - TABLE 4
Fractional metabolism (fm) estimated using the P450 and UGT kinetic models
The fm values were calculated using CLint values (see Table 3). Data shown are parameter estimates and CV% of the estimates.
Enzyme THC 11-OH-THC 11-OH-THC Depletion Formation Depletion CYP2C9 0.91 (0.4%) 1.00 (fixed) 0.15 (3.6%) CYP3A 0.00 (fixed) 0.00 (fixed) 0.18 (3.0%) CYP2D6 0.09 (4.4%) 0.00 (fixed) 0.00 (fixed) UGTs 0.00 (fixed) 0.00 (fixed) 0.67 (12%)


Data Supplement
- Supplemental Data -
Supplemental methods and 4 figures.
- Supplemental Data -


