


Article Figures & Data
Figures
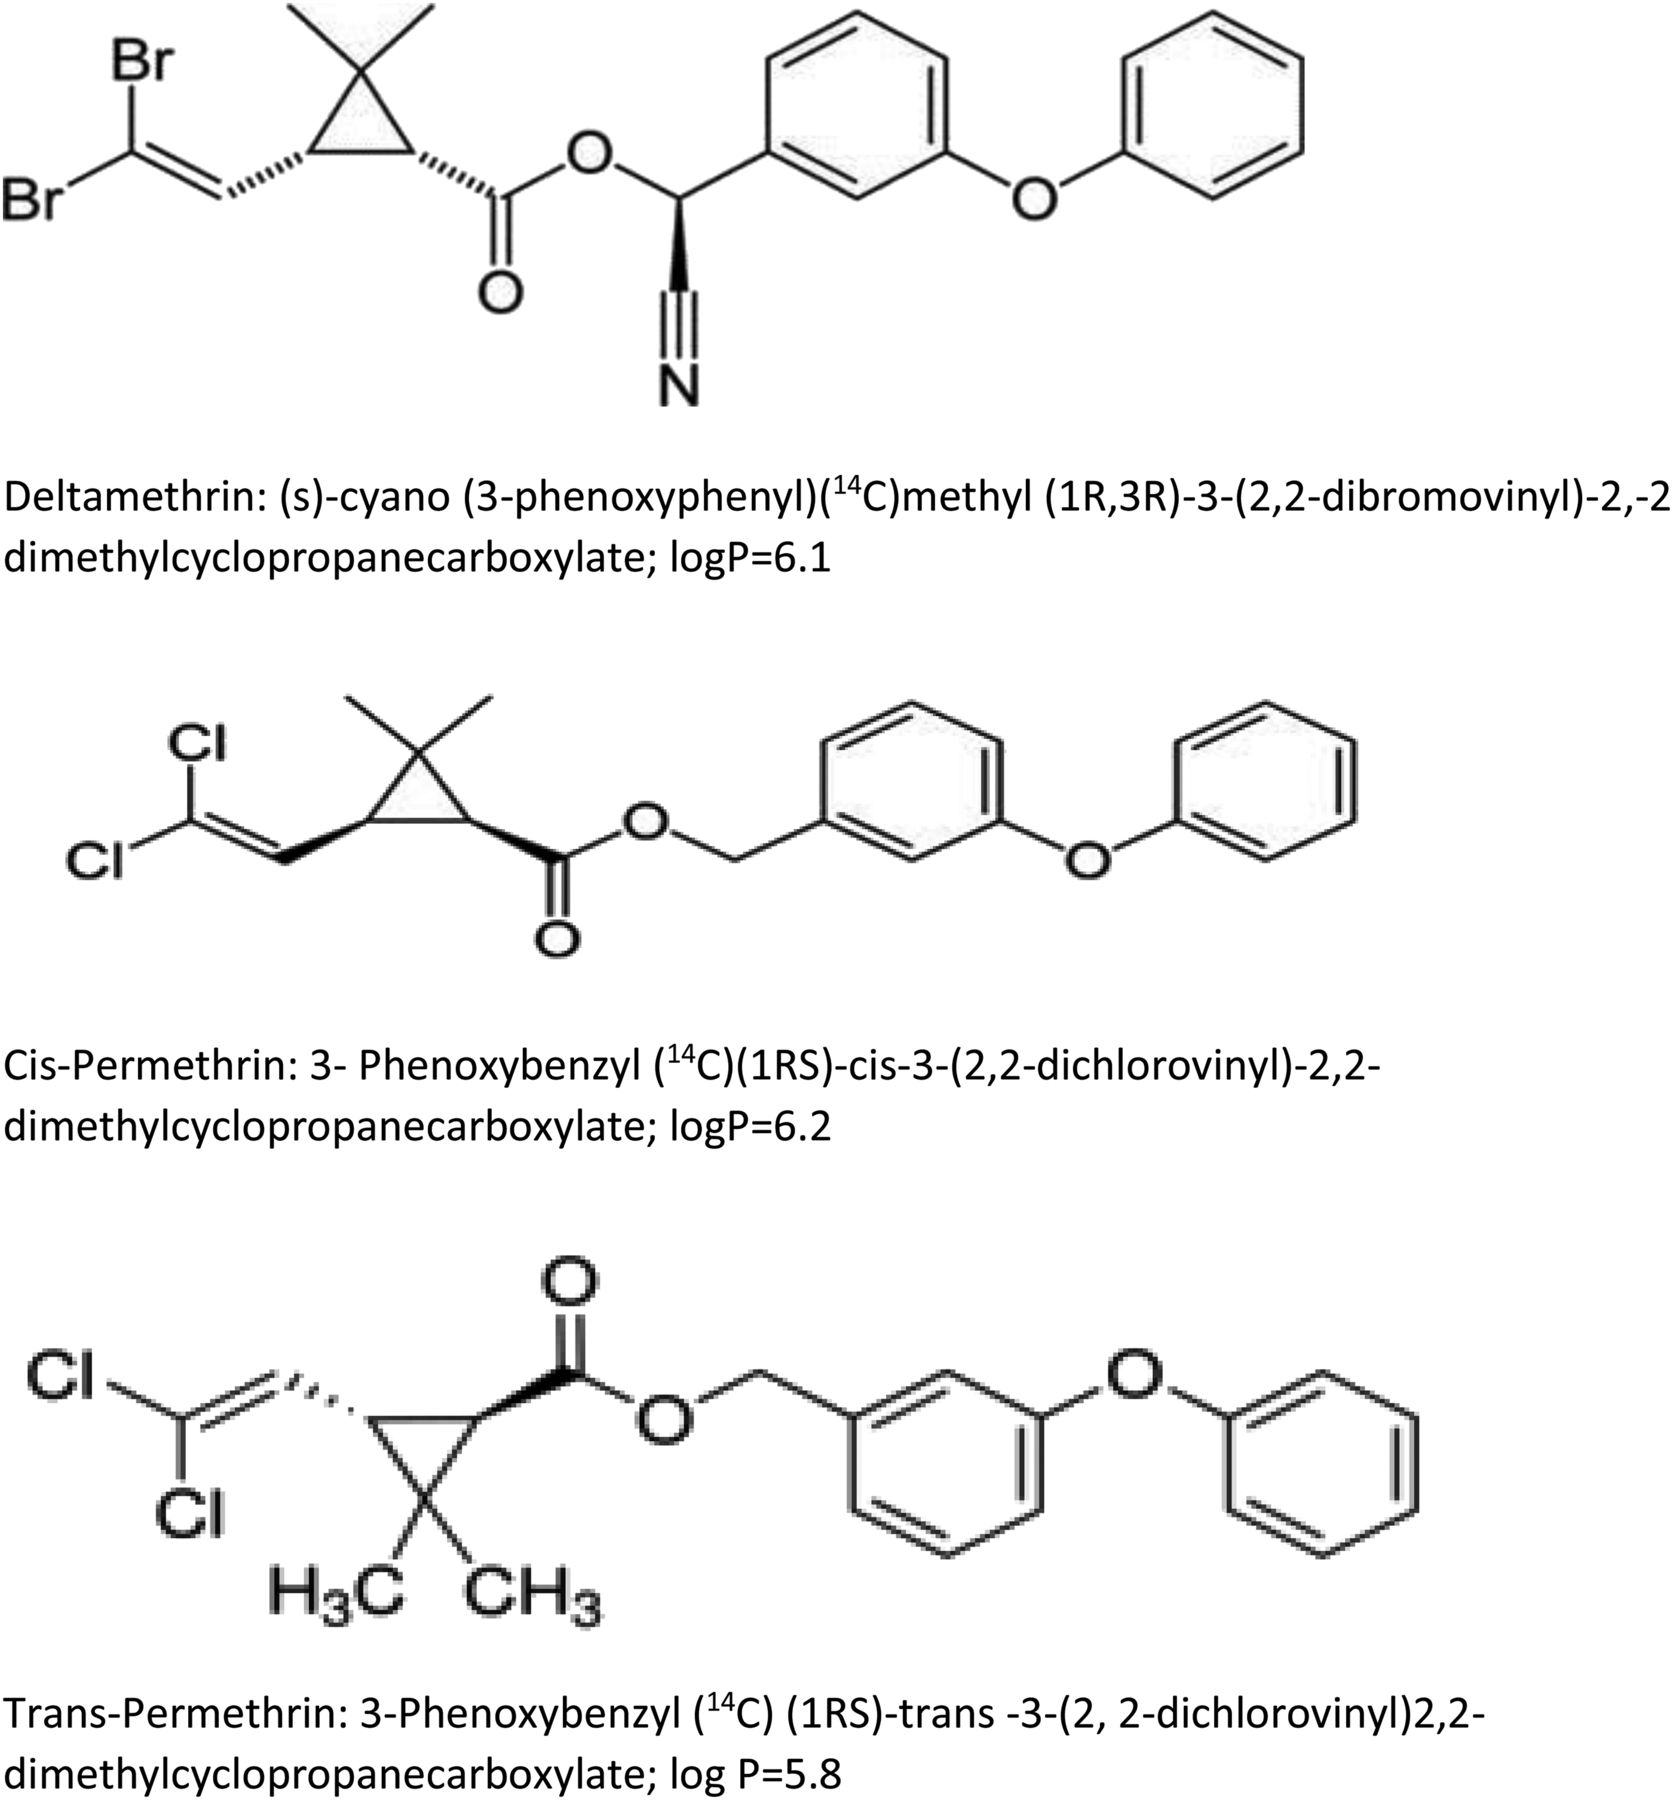
- Fig. 1.
Chemical structures and nomenclature for DLM, CIS, and TRANS. Asterisk designates the position of [14C] incorporation.
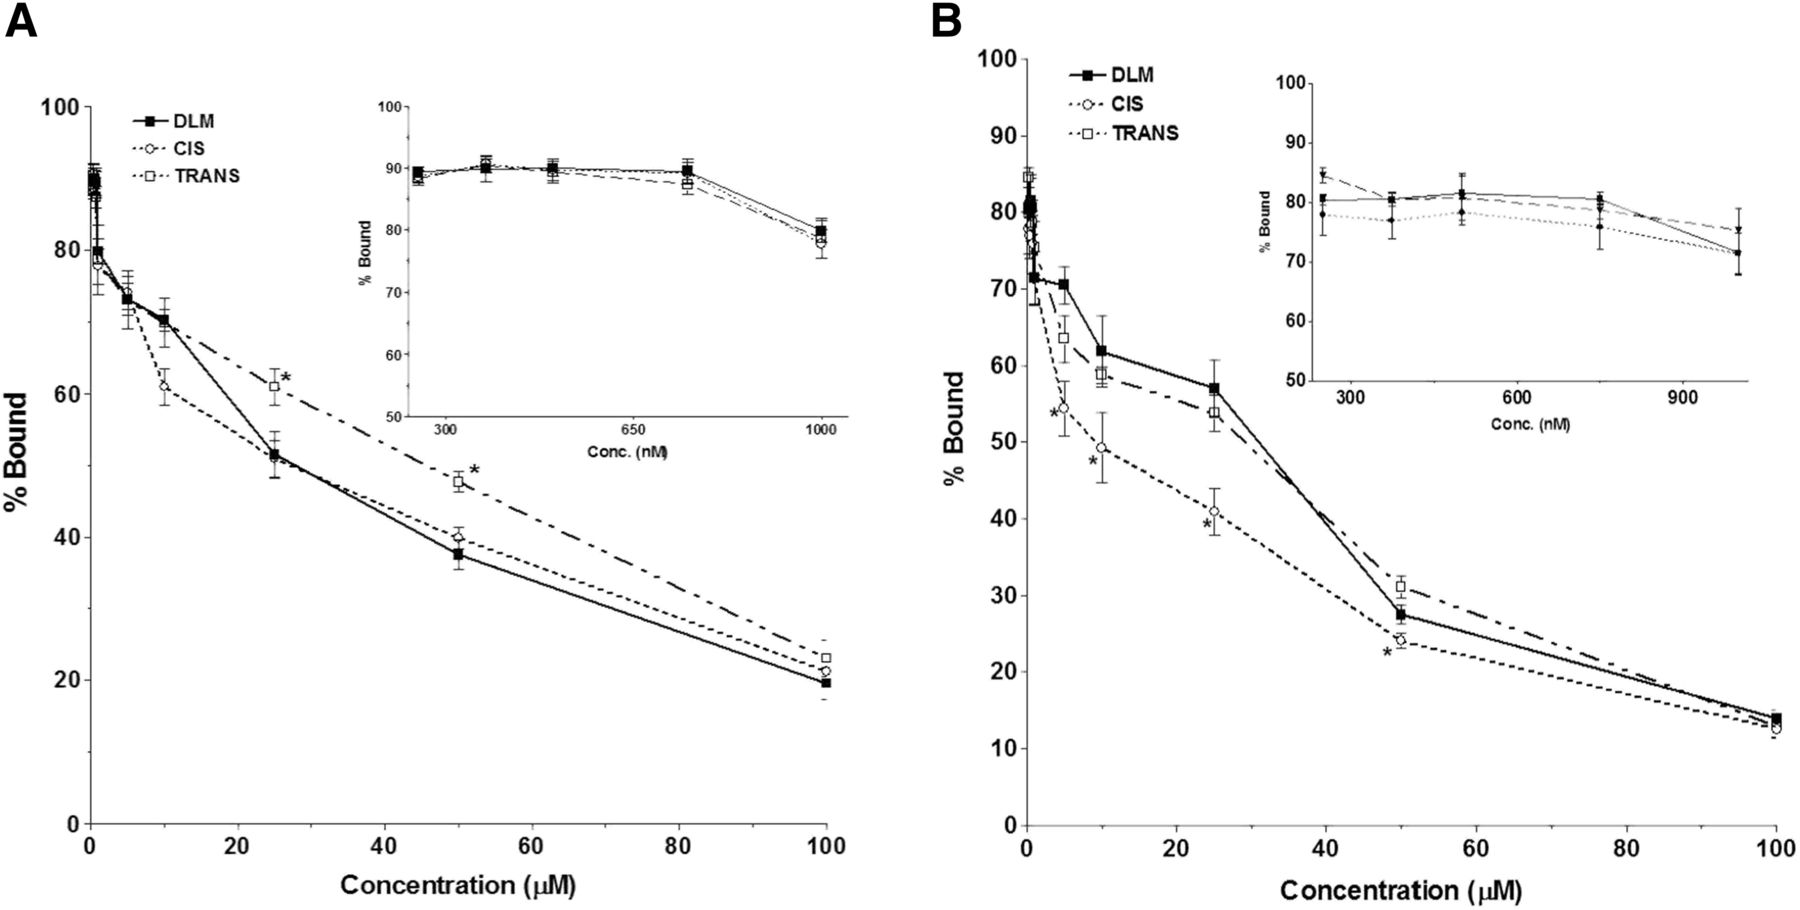
- Fig. 2.
Concentration-dependent total binding of DLM, CIS, and TRANS to human (A) and rat (B) plasma. The lower, toxicologically relevant range is expanded in the insets. Symbols represent the mean ± S.D. for four replicates. Values for each pyrethroid are connected point to point. Astericks indicate statistically significant difference from other pyrethroid values at the same concentration.
- Fig. 3.
Saturation binding curves for DLM, CIS, and TRANS for human (A) and rat (B) albumin. Symbols represent the mean ± S.D. for four replicates. Solid lines are fitted curves.
- Fig. 4.
Concentration-dependent total binding, protein binding and lipoprotein binding of DLM in human (A) and rat (B) plasma. The insets show the change and relative distribution of DLM over a 400-fold range of concentrations. Statistically significant differences between concentrations are indicated by different superscript letters.
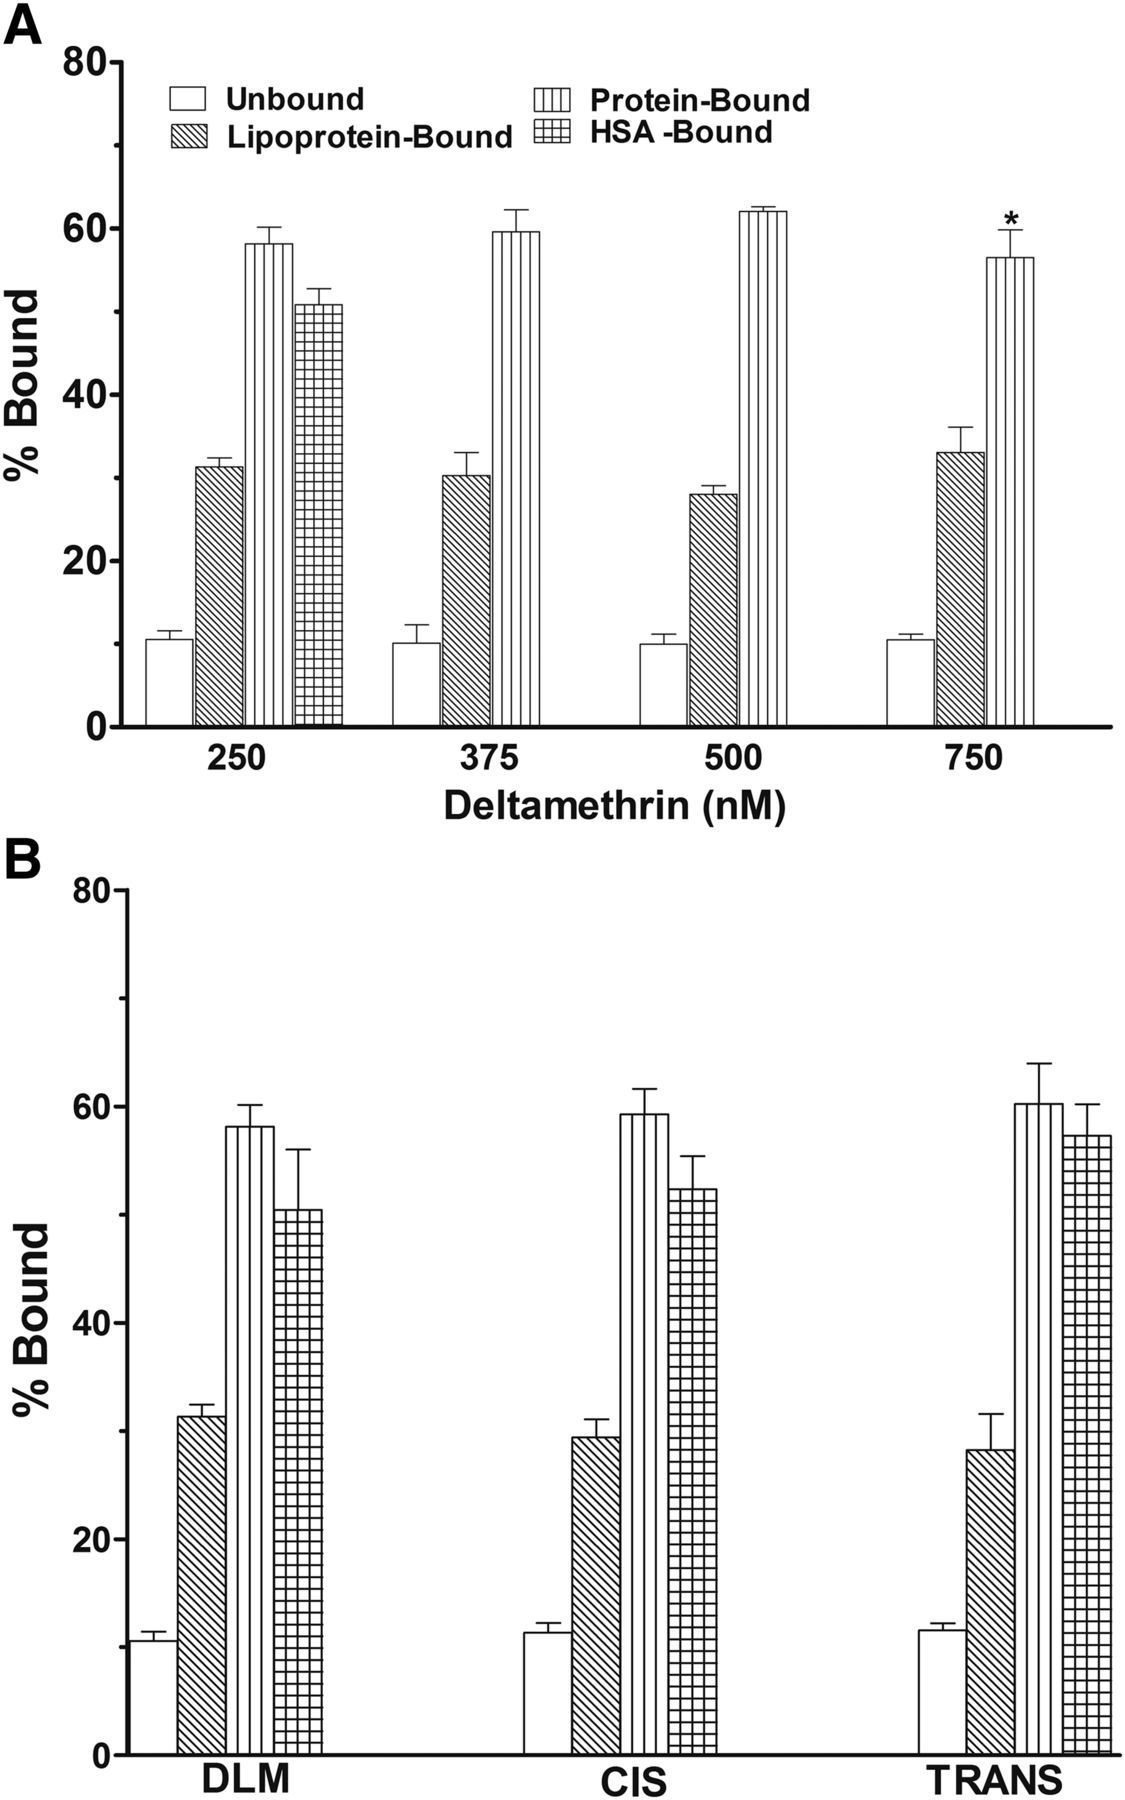
- Fig. 5.
(A) Binding of DLM to HSA and to plasma protein and lipoprotein within the linear range of total plasma binding. The asterisk indicates statistically significant difference from binding at 500 nM. The percentages unbound and bound to lipoprotein did not vary significantly with DLM concentration. (B) Relative binding of 250 nM DLM, CIS, and TRANS to human plasma protein, plasma lipoprotein, and purified HSA. Bar heights represent the mean ± S.D. for four replicates.
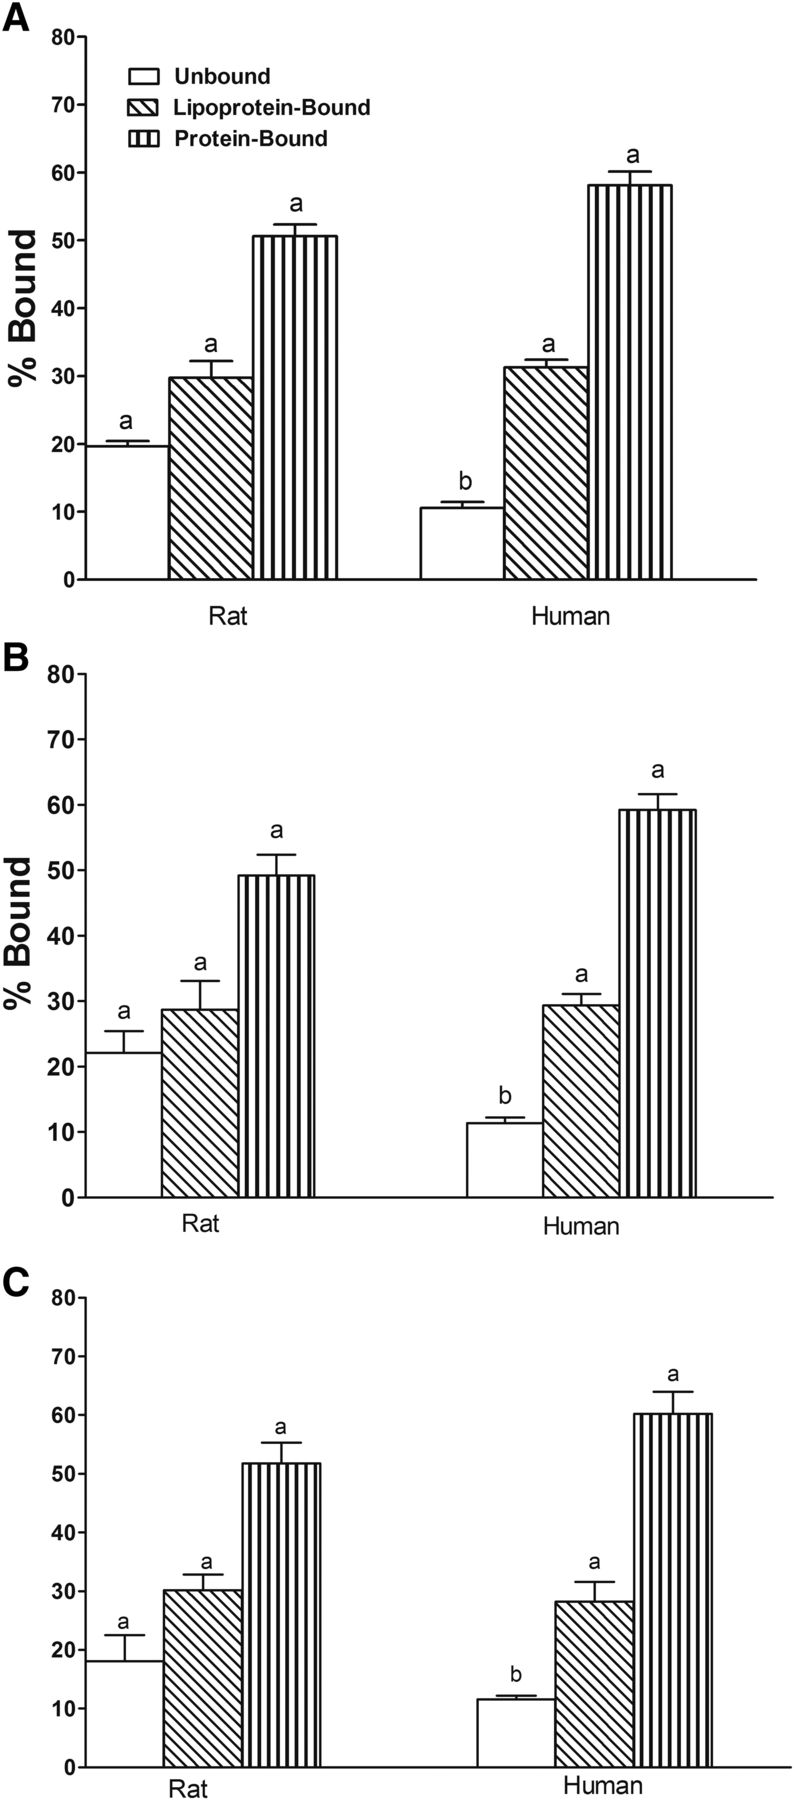
- Fig. 6.
Species-dependent binding of 250 nM DLM (A), CIS (B), and TRANS (C) to plasma protein and lipoprotein fractions. Bar heights represent the mean ± S.D. for four replicates. Statistically significant species differences are indicated by different superscript letters for corresponding parameters.


Tables
- TABLE 1
Albumin and total protein binding in rats and humans
Binding capacity (Bmax) is expressed as nanomoles per milligram albumin or total protein. Disassociation constant (Kd) is expressed as micromolars. Significant differences between pyrethroids are indicated by different subscript letters. Data are mean ± S.D.; P < 0.05.
Compound Albumin Total Protein Rat Human Rat Human Bmax Kd Bmax Kd Bmax Kd Bmax Kd nmol/mg µM nmol/mg µM nmol/mg µM nmol/mg µM DLM 2.6 ± 0.1a,* 3.8 ± 0.3a 4.0 ± 0.1a,* 4.6 ± 0.3a 3.4 ± 0.4a,* 6.4 ± 0.5a 4.1 ± 0.1a 6.7 ± 0.7a CIS 3.2 ± 0.7 a,b,* 10.3 ± 4.2b 4.5 ± 0.2b 7.7 ± 1.4b 3.7 ± 0.4a,* 12.4 ± 2.6b 4.7 ± 0.2b 10.4 ± 1.5b,c TRANS 4.1 ± 0.7b,c,* 8.1 ± 2.8b 4.9 ± 0.1c 6.4 ± 0.6b 4.5 ± 0.1b,* 11.3 ± 0.3b,* 5.2 ± 0.3b 7.3 ± 1.3a,c ↵* Denotes significant difference from corresponding human value.
Data Supplement
- Supplemental Figures -
Figure I. Concentration-dependent total binding, protein binding and lipoprotein binding of CIS in human (A) and rat (B) plasma. Insert shows change and relative distribution of DLM over a 400-fold range of concentrations. Statistically significant differences between concentrations are indicated by different superscript letters.
Figure II. Concentration-dependent total binding, protein binding and lipoprotein binding of TRANS in human (A) and rat (B) plasma. Insert shows change and relative distribution of DLM over a 400-fold range of concentrations. Statistically significant differences between concentrations are indicated by different superscript letters.
- Supplemental Figures -


