


Abstract
Centella asiatica (CA) shows considerable promise for development as a botanical drug for cognitive decline. Its primary bioactive components include triterpene glycosides asiaticoside and madecassoside and their corresponding aglycones asiatic acid and madecassic acid. Exploration of the bioactivity of CA’s caffeoylquinic acids is ongoing. In this study, an aqueous extract of CA (CAW-R61J) was evaluated for drug interaction potential through inhibition or induction of P450 enzymes, as required by the US Food and Drug Administration. CAW-R61J was assessed for induction potential of CYP1A2, CYP2B6, and CYP3A4 using transporter-certified cryopreserved human hepatocytes in sandwich culture. Gene expression of these target P450s was quantified, and enzyme activities were determined to confirm gene expression results. No induction was observed up to 16.7 µg/ml CAW-R61J (equivalent to 1.1 µM asiaticoside, 0.8 µM madecassoside, 0.09 µM asiatic acid, and 0.12 µM madecassic acid). Reversible and time-dependent inhibitory effects of CAW-R61J on CYP1A2, CYP2B6, CYP2C8, CYP2C9, CYP2C19, CYP2D6, and CYP3A4/5 were evaluated using human liver microsomes. CAW-R61J showed weak reversible inhibition of most of the P450 forms tested, with the strongest being CYP2C9 (IC50 of 330 µg/ml). CAW-R61J (≤1000 µg/ml) was not a time-dependent inhibitor of any of these P450 enzymes. In summary, CAW-R61J had no, or only a weak impact, on P450 induction and inhibition in vitro. The clinical relevance of these results will depend on the in vivo concentration of CAW-R61J components achieved in humans. Plasma triterpene concentrations measured in our recent clinical studies suggest minimal risk of P450-mediated drug interactions by these components.
SIGNIFICANCE STATEMENT A preparation of Centella asiatica is currently under clinical development for the prevention or treatment of cognitive decline. The US Food and Drug Administration required an evaluation of its potential for drug interactions mediated through drug-metabolizing enzymes. This in vitro study revealed minimal induction or inhibition of a range of P450 enzymes, including CYP3A4, by the C. asiatica extract, suggesting a low potential for drug interactions modulated by P450 metabolism.
Introduction
Over 80% of the world’s population uses botanical medicines (herbal medicines) (Ekor, 2014). Many view these medicines as benign because they are of natural origin; however, because their constituents may be metabolized through the same enzymatic pathways as pharmaceutical agents, there is a potential for herb-drug interactions. Reported outcomes of such interactions include low drug efficacy, serious toxic reactions to the drug component, and death (Ekor, 2014; Feltrin and Oliveira Simões, 2019; Liu et al., 2019; Maadarani et al., 2019; Suroowan and Mahomoodally, 2019). The most important class of enzymes involved in human drug metabolism is cytochrome P450 (P450), which occurs as a superfamily of related monooxygenase forms responsible for oxidative metabolism of xenobiotics and endogenous compounds (Nebert et al., 2013). The major forms are CYP1A2, CYP2B6, CYP2C8, CYP2C9, CYP2C19, CYP2D6, and CYP3A4/5. Metabolic drug interactions normally occur between two or more drugs such that the addition of the perpetrator drug alters the systemic levels of the victim drug (Lin and Lu, 1998; Bohnert et al., 2016). For example, induction of P450 forms by herbal components could increase the clearance of the victim drug, thus causing decreased therapeutic efficacy (Shi and Klotz, 2012). Conversely, P450 inhibition by phytochemicals could cause circulating levels of the victim drug to rise to toxic levels (Shi and Klotz, 2012). Investigation of herb-drug interactions is undoubtedly a public health priority to ensure the safe use of herbal interventions (Borse et al., 2019).
The US Food and Drug Administration (FDA) has issued guidance for studying metabolic drug interactions in vitro using specific tools and methods (U.S. Food and Drug Administration, 2020). As the use of herbal healthcare products increases worldwide, it is important to apply the techniques traditionally used for small molecules to determine whether these products have the potential to induce or inhibit P450 forms in humans.
Centella asiatica (L.) Urban (Apiaceae) (CA), commonly known as gotu kola, is a botanical reputed in Ayurvedic medicine to increase intelligence and memory (Kapoor, 1990). Triterpene glycosides asiaticoside and madecassoside and their corresponding aglycones, asiatic acid and madecassic acid, collectively known as centelloids, are regarded as the predominant bioactive compounds of CA (Brinkhaus et al., 2000), although recent studies by our group suggest a therapeutic role for its caffeoylquinic acid constituents (Gray et al., 2014, 2017b). In preclinical studies, C. asiatica aqueous extract (CAW) demonstrates biologic effects of relevance to memory, learning, aging, mood, and potentially disease progression in Alzheimer disease (Lokanathan et al., 2016; Gray et al., 2018a). These include modulation of antioxidant pathways and improved mitochondrial function (Gray et al., 2016, 2018c; Matthews et al., 2019). In addition, similar extracts have been shown to modify brain structure by increasing dendritic arborization of hippocampal neurons (Gray et al., 2017b, 2018b), potentially contributing to the observed cognitive changes.
CA extracts and compounds have been reported to be weak inhibitors of some phase I drug-metabolizing P450 enzymes in vitro (Pan et al., 2010, 2011; Seeka et al., 2012; Savai et al., 2015a,b; Kar et al., 2017). In rats, administration of a CA product (composition not provided) increased plasma maximum concentration (14.34%), area under the curve (23%), and elimination half-life (13.81%) of amitriptyline (Khurshid et al., 2018), a substrate of CYP2C19 and CYP2D6 in humans (Mifsud Buhagiar et al., 2019). These studies suggest that CA components may cause drug interactions resulting from altered phase I metabolism of coadministered drugs.
None of the aforementioned studies investigated the effects on drug-metabolizing enzymes of the type of extract (CAW) used in our preclinical studies and in our current phase I (NCT03929250, NCT03937908) and proposed phase II clinical trials investigating CAW as a botanical drug for cognitive decline. During our application for Investigational New Drug status for CAW, the FDA asked us to investigate potential interactions with P450 enzymes. CYP3A4, CYP2D6, and CYP2C19 are of particular interest. The cognitively impaired, elderly target population for CAW may be taking cholinesterase inhibitors donepezil or galantamine, which are substrates for CYP3A4 and CYP2D6 (Noetzli and Eap, 2013; Coin et al., 2016), or drugs for other health conditions, many of which are substrates of CYP3A4 (Zhou et al., 2007).
The composition of plant extracts can vary considerably depending on genetic factors, cultivation conditions, and processing methods (Figueiredo, 2017), and this in turn can affect their biologic properties. The aim of this study was to assess the specific CAW prepared for use in our clinical trials (CAW-R61J) for its potential to induce or inhibit human forms of P450.
In the present study, in vitro P450 induction potential of CYP1A2, CYP2B6, and CYP3A4 by CAW-R61J was studied using human hepatocytes in sandwich culture (LeCluyse et al., 2000; LeCluyse, 2001). Hepatocytes cultured in this format are responsive to nuclear receptor agonists and maintain important transporter function necessary for proper drug disposition (Yang et al., 2016). Reversible and time-dependent inhibition of P450 forms by CAW-R61J was investigated using standard methods with pooled human liver microsomes (Stresser et al., 2014; Bohnert et al., 2016).
Materials and Methods
Materials.
Acetaminophen-d4, azamulin, bupropion hydrocholoride, flumazenil, furafylline, hydroxybupropion-d6, 4′-hydroxy mephenytoin-d3, ketoconazole, (S)-mephenytoin, N-desethylamodiaquine-d5, paroxetine hydrochloride, phenacetin, sertraline hydrochloride, N,N′,N′′-triethylenethiophosphoramide, ticlopidine hydrochloride, and tienilic acid were from Toronto Research Chemicals (North York, ON, Canada). (+)-N-3-Benzylnirvanol, 1′-hydroxymidazolam-d4, 6β-hydroxytestosterone-d3, amodiaquin dihydrochloride dihydrate, dextromethorphan hydrobromide monohydrate, dextrorphan-d3, diclofenac sodium salt, dimethylsulfoxide, glucose-6-phosphate, glucose-6-phosphate dehydrogenase from baker’s yeast (Saccharomyces cerevisiae), Hank’s balanced salt solution, magnesium chloride, montelukast sodium, omeprazole, phenelzine sulfate salt, phenobarbital, potassium phosphate monobasic, potassium phosphate dibasic, quinidine, rifampicin, sulfaphenazole, tamoxifen, testosterone, tranylcypromine hydrochloride, and trypan blue were from Sigma-Aldrich (St. Louis, MO). α-Naphthoflavone and NADP+ were obtained from Cayman Chemicals (Ann Arbor, MI). LC-MS–grade acetonitrile, LC-MS–grade methanol, and formic acid American Chemical Society reagent were purchased from Fisher Scientific (Pittsburgh, PA). Imported C. asiatica herb, consisting of dried aerial parts, was purchased from Oregon’s Wild Harvest (lot numbers 180700075 and 180600069; Redmond, OR). The commercial reference phytochemical standards asiatic acid, asiaticoside, madecassic acid, madecassoside, 5-O-caffeoylquinic acid, 4-O-caffeoylquinic acid, 3-O-caffeoylquinic acid, 1,3-dicaffeoylquinic acid, 1,5-dicaffeoylquinic acid, 3,5-dicaffeoylquinic acid, and quinic acid were purchased from Toronto Research Chemicals; 3,4-dicaffeoylquinic acid and 4,5-dicaffeoylquinic acid were purchased from Chromadex (Irvine, CA).
C. asiatica Plant Material and Preparation of CAW-R61J.
Two batches of C. asiatica (lot numbers 180600069 and 180700075; CA1 and CA2, respectively) were purchased from Oregon's Wild Harvest (Redmond, OR) for clinical trial product manufacture. Plant identity was verified by visual inspection, Fourier-transform Infrared spectroscopy, and thin-layer chromatography in comparison with earlier lots of C. asiatica (Soumyanath et al., 2012; Gray et al., 2016), reference standards of characteristic chemical components, and the literature (Bonfill et al., 2006). The material was extracted by Ashland Industries (Kearny, NJ) in two lots. 1) CA1 (45 kg) was boiled under reflux with 562.5 l of water, and 2) 30.5 kg of CA1 and 14.5 kg of CA2 were mixed and boiled under reflux with 562.5 l of water. The extracts were cooled to 150°F and pressed through a Sweco 200 Mesh Screen (Florence, KY) to remove plant debris, filtered through filter paper to remove fine debris, and then cooled. Aliquots of the two filtrates were shipped to Oregon Health & Science University (OHSU, Portland, OR), where they were frozen and lyophilized, yielding 21.4% from dried CA for CAW-R61F (extraction lot 1) and 23.9% from dried CA for CAW-R61H (extraction lot 2). The two small-scale dried CAWs were mixed in the ratio 4.88 g CAW-R61F to 2.11 g CAW-F61H to yield CAW-R61J. This ratio mimicked that used in the clinical trial product manufacture, which was performed using the major part of the water extracts. Since the chemical composition of CA raw material can vary, we used the specific CAW-R61J extract used to make our clinical trial product in this study.
Voucher samples of the original dried plant materials CA1 and CA2 have been deposited at the Oregon State University Herbarium (OSC-V-258630, OSC-V-258631, respectively), and voucher samples of dried plant materials and CAW extracts (CAW-R61F, CAW-R61H, and CAW-R61J) are held at OHSU. All dried extract CAW extracts were stored at −20°C until use.
CAW-R61J Fingerprinting.
The bioactive centelloids and caffeoylquinic acid compounds in CAW-R61J test material were identified and quantified using the area under the curve of the precursor ion (MS1 quantification) using LC-HRMS at Oregon State University (Corvallis, OR) by comparison against co-chromatographed commercial reference standards as previously described (Alcazar-Magana et al., 2020). In addition toMS1- quantification of known compounds, untargeted LC-HRMS analysis of all the materials was performed. Analytical data on accurate mass (high resolution), isotopic pattern, retention time, and relative peak area of all components detected using both negative and positive electrospray ionization mode were recorded as “fingerprints” of the CAW-R61J extract.
Data-dependent acquisition mode was conducted using a Shimadzu Nexera ultra-performance liquid chromatography system (Columbia, MD) connected to an AB SCIEX TripleTOF 5600 mass spectrometer (Framingham, MA) equipped with a TurboSpray electrospray ionization source. Chromatographic separation was achieved using an Inertsil Phenyl-3 column (4.6 mm × 150 mm; GL Sciences, Torrance, CA). The injection volume was 10 µl, and three technical replicates were carried out. A gradient with solvent A (water containing 0.1% v/v formic acid) and B (methanol containing 0.1% v/v formic acid) was used with a flow rate of 0.4 ml/min in a 35-minute chromatographic run. Solvent gradient started at 5% B at 0 to 1 minute and was followed by 5%–30% B from 1 to 10 minutes, then 30%–100% B from 10 to 20 minutes, held at 100% B from 20 to 25 minutes, then returned to 5% B from 25 to 30 minutes, and then the column was equilibrated with 5% B until 35 minutes.
Evaluation of CAW Centelloid and Caffeoylquinic Acid Stability in Cell Culture Medium Alone and in Medium from Hepatocyte Cell Cultures.
An initial evaluation of stability of centelloids and caffeoylquinic acids present in CAW-R61F (a component of CAW-R61J) in medium alone was performed at OHSU. CAW-R61F (500 μg/ml) was dissolved in cell culture medium, and separate aliquots (1 ml) were placed in a cell culture incubator (37°C, 5% CO2) or a freezer (−20°C) in sealed containers for 24 hours. At the end of this period, triplicate samples (50 μl) from the solutions stored at the two temperatures were prepared for HPLC-MS/MS analysis by addition of ascorbic acid solution (1% w/v; 10 μl) and organic solvent (methanol:acetonitrile, 1:3; 200 μl). Samples were filtered (Ultrafree-UFC 30GVNB 0.22-μm spin filter; Fisher Scientific) prior to transfer to high-performance liquid chromatography vials.
HPLC-MS/MS of caffeoylquinic acids was performed on an Applied Biosystems Qtrap5500 LC-MS instrument (Framingham, MA). Chromatographic separation was achieved using a Zorbax Eclipse plus C8 Rapid Resolution column (4.6 mm × 150 mm, 3.5 μm; Agilent, Foster City, CA) fitted with a Zorbax Eclipse plus C8 Rapid Resolution precolumn (4.6 mm × 12.5 mm, 5 μm; Agilent). The injection volume was 5 µl. A gradient with solvent A (water, 0.05% acetic acid) and B (acetonitrile, 0.05% acetic acid) was used with a flow rate of 0.8 ml/min in a 21-minute run. Solvent gradient increased from 10% to 25% B from 0 to 4.5 minutes, to 40% B by 10 minutes, and to 95% B from 10 to 11 minutes. After holding at 95% B from 11 to 16 minutes, composition returned to 10% B by 16.2 minutes and was re-equilibrated at 10% B until 21 minutes. MS/MS was carried out with electrospray ionization in negative ion mode; transitions monitored were monocaffeoylquinic acids (353/191) and dicaffeoylquinic acids (515/191). Analysis of the centelloids was performed on an Applied Biosystems Qtrap 4000 LC-MS instrument. Chromatographic separation was achieved using a Poroshell 120 EC-C18 column (3-mm × 50 mm, 2.7 μm; Agilent) fitted with a Poroshell 120 EC-C18 guard column (3 mm × 5 mm, 2.7 μm; Agilent). The injection volume was 20 µl. A gradient with solvent A (water, 10 mM ammonium acetate, 0.02% ammonium hydroxide) and B (methanol) was used with a flow rate of 0.42 ml/min in a 9-minute run. Solvent gradient increased from 40% B to 60% B from 0 to 2 minutes and then increased to 95% B by 3.5 minutes. After holding at 95% B from 3.5 to 6 minutes, the composition returned to 40% B by 6.1 minutes, and then the column was re-equilibrated with 40% B until 9 minutes. MS/MS was carried out in positive ion mode; transitions monitored were asiatic acid (506/453), madecassic acid (522/451), asiaticoside (976/452), and madecassoside (992/486). Asiatic acid and madecassic acid were monitored as ammonium adducts. For each analyte, the average peak area from triplicate analyses of the solution stored for 24 hours at 37°C was expressed as a percentage of the average peak area from triplicate analyses of the sample stored for 24 hours at −20°C. Caffeoylquinic acid peak area was calculated as total area of all monocaffeoylquinic acids or all dicaffeoylquinic acids, since we have observed the occurrence of isomerization of these compounds.
Stability of centelloids and caffeoylquinic acids in media from hepatocyte cultures was determined at Oregon State University using the LC-HRMS method described earlier for fingerprinting of CAW-R61J. Compounds of interest were quantified by reference to calibration curves.
Hepatocytes.
Human hepatocyte culture transporter-certified human hepatocytes were prepared in-house at BioIVT (Baltimore, MD). Three lots of cryopreserved human hepatocytes (Table 1) were thawed rapidly in a 37°C water bath and transferred to 45 ml of QualGro Thaw Medium (BioIVT, Durham, NC) and pelleted at 100g for 8 minutes at ambient temperature. The hepatocyte pellet was resuspended in BioIVT QualGro Seeding Medium (BioIVT), and the viability was determined using trypan blue exclusion and a hemocytometer (Fisher Scientific). The hepatocytes were diluted to a density of 0.8–1.0 × 10⁶ viable cells/ml and seeded (0.5 ml/well) onto Corning BioCoat Collagen I 24-well plates (Fisher Scientific). The cells were allowed to attach for 18–24 hours and were then overlaid with Hepatocyte Induction Medium supplemented with 0.25 mg/ml Corning Matrigel (Fisher Scientific) for 18–24 hours. After the overlay, the medium was aspirated, and cultures were treated with compounds. All control compounds were made as 1000× stocks in DMSO and diluted 1:1000 in Hepatocyte Induction Medium. The final concentration of the control compounds was 0.1% DMSO, 25 µM flumazenil, 50 µM omeprazole, 1000 µM phenobarbital, or 10 µM rifampicin. A stock solution of CAW-R61J was made in Hepatocyte Induction Medium at 1 mg/ml and was used to make a dosing solution of 50 µg/ml. The 50-µg/ml solution was serially diluted (1:3) in Hepatocyte Induction Medium to yield 0.02, 0.07, 0.2, 0.6, 1.9, 5.6, 16.7, or 50 µg/ml. DMSO was added to the CAW-R61J dosing solutions to 0.1% (v/v) such that all treatment conditions contained 0.1% DMSO. All conditions for each donor were carried out in triplicate with treatment every 24 hours for a total exposure period of 72 hour.
Donor demographics for hepatocytes used in the study
Determination of ATP Content in Hepatocyte Cultures.
Cells from donor XVN were cultured as described above. On days 2–4 of culture, hepatocytes were treated in triplicate with culture medium containing positive control (25 µM tamoxifen), vehicle control (0.1% DMSO), or CAW-R61J (20, 250, or 1000 µg/ml). After exposure, culture plates were harvested for ATP analysis. Cellular content of ATP was determined using the CellTiter-Glo Assay Kit provided by Promega (Madison, WI) per the manufacturer’s instructions. A sample of fresh culture medium was included as a no-cell control, and luminescence of all samples was recorded using a Biotek Synergy 4 microplate reader (Winooski, VT).
Determination of P450 mRNA Levels in Cultured Hepatocytes.
After incubation with the P450 probe substrate cocktail, the cultures were washed 2× with 0.5 ml/well Hank’s balanced salt solution (HBSS). Cultures were lysed for total RNA isolation by adding 0.2 ml/well of 1:1 mix of Buffer RLT (Qiagen, Waltham, MA) and TRIzol Reagent (Thermo Fisher Scientific, Waltham, MA). Plates were sealed and stored frozen at −80°C until isolation of total RNA. Plates were thawed at ambient temperature. Lysates were thawed, and total RNA was isolated from each treatment group using the RNeasy 96 Kit (Qiagen) following the manufacturer’s instructions. RNA was stored at −80°C. Isolated RNA was quantified using Quant-iT RiboGreen RNA Assay Kit (Thermo Fisher Scientific) following the manufacturer’s instructions. Total RNA (500 ng) was converted to cDNA following the manufacturer’s procedure for the High Capacity cDNA Reverse Transcription Kit (Thermo Fisher Scientific) on a MiniAmp Plus thermocycler (Thermo Fisher Scientific). cDNA from human hepatocyte cultures was analyzed from each reverse transcription reaction using the gene-specific TaqMan assays (Thermo Fisher Scientific) for CYP1A2, CYP2B6, and CYP3A4. Glyceraldehyde-3-phosphate dehydrogenase was used as an endogenous control for gene expression analysis. Amplifications were performed on a ViiA 7 Real-Time Polymerase Chain Reaction System (Thermo Fisher Scientific) in relative quantification mode for 45 amplification cycles using standard conditions for TaqMan-based assays. Threshold cycle (Ct) determinations were performed by the ViiA 7 system software for both target and endogenous control genes. Relative-fold mRNA content was determined for each treatment group relative to the endogenous control gene expression and the calibrator (0.1% DMSO vehicle control).
Determination of P450 Activity in Hepatocyte Cultures.
At the end of the treatment period, CYP1A2, CYP2B6, and CYP3A4/5 activity was determined in situ using a method based on Pelletier et al. (2013). The treatment medium was aspirated, and the cultures were washed 2× with 0.5 ml of HBSS and then incubated with 0.3 ml/well HBSS containing a P450 probe substrate cocktail for CYP1A2 (100 µM phenacetin), CYP2B6 (500 µM bupropion), and CYP3A4 (10 µM midazolam). Incubations were performed with shaking on an orbital shaker (150 rpm) at 37°C for 20 minutes. Samples of medium were collected and stored at −80°C until analyzed for probe substrate metabolite using LC-MS/MS.
Sample Preparation for LC-MS/MS Analysis.
Internal standard solution (300 µl containing 200 nM d4-acetaminophen, 200 nM d6-hydroxybupropion, and 200 nM d4-1′-hydroxymidazolam in 100% MeOH) was added to each sample (100 µl) in a 96-well deep-well plate. After shaking for 15 minutes, the samples were transferred to a Whatman 96-well Unifilter 25-µm 0.45-µm melt-blown polypropylene filter plate (7770-0062; Whatman) stacked on a 96-well deep-well plate. Samples were filtered into the deep-well plate by centrifugation. The sample filtrate was evaporated to dryness and reconstituted in 150 µl of sample diluent (30:70 methanol:5 mM ammonium acetate) and mixed for at least 10 minutes on a plate shaker. The reconstituted samples were transferred to a Millipore 0.45-µm filter plate (MSHVN45; Millipore) and filtered into a Costar 3957 plate by centrifugation. Plates were sealed with a silicone cap mat prior to LC-MS/MS analysis.
LC-MS/MS Analysis.
LC-MS/MS was conducted using a Thermo Fisher Scientific Vanquish system (Palo Alto, CA) connected to a Thermo Fisher Scientific TSQ Quantis Triple Quadrupole mass spectrometer equipped with an OptaMax NG ionization source and heated electrospray ionization probe. Chromatographic separation was achieved using a Thermo Scientific Hypersil Gold C18 column (50 mm × 1 mm, 1.9 µm; Bellefont, PA). The injection volume was 2 µl, and three technical replicates were carried out. A gradient with solvent A (95:5 water:acetonitrile containing 0.2% v/v formic acid) and B (95:5 acetonitrile:water containing 0.2% v/v formic acid) was used with a flow rate of 0.05 ml/min in a 3.5-minute chromatographic run. The gradient started at 10% B, increasing to 100% B over 1 minute, holding at 100% B for 1 minute, and then returning to 10% B. Analytes (probe substrate metabolites) and internal standards were detected using electrospray ionization in positive ion mode (Table 2).
Summary of P450 probe substrate metabolite analysis by LC-MS/MS
Determination of Reversible P450 Inhibition in HLM.
Pooled HLMs (n = 150, mixed sex, lot IGF) obtained from BioIVT were used. Reversible inhibition of P450 forms was determined by carrying out incubations with a constant concentration of P450 probe substrate and increasing concentrations of CAW-R61J in triplicate. Control experiments were carried out in parallel with the probe substrate and increasing concentrations of a control reversible P450 inhibitor in duplicate. The highest concentration of CAW-R61J tested was 1000 µg/ml. A 4× stock solution (4 mg/ml) of CAW-R61J in 100 mM potassium phosphate buffer, pH 7.4 (KPi), was made and was diluted to give a series of 4× stock solutions. These stocks were diluted 1:4 in the reactions to give the final concentrations of CAW-R61J (0, 4, 20, 50, 100, 250, 500, and 1000 µg/ml). Reactions contained HLM (0.1 mg/ml), CAW-R61J or P450 control inhibitor, P450 probe substrate, and an NADPH regenerating system (5 mM glucose-6-phosphate, 1 mM NADP, 5 mM MgCl2, and 1 U/ml glucose-6-phosphate dehydrogenase) in KPi. The reaction components and conditions for each P450 are given in Table 3. Reactions were assembled in round-bottom polypropylene 96-well plates (AB-0796; Thermo Fisher Scientific) by adding KPi, HLM, CAW-R61J or control inhibitor, and P450 probe substrate to the wells and equilibrated for 5 minutes at 37°C. The components of the NADPH regenerating system (NRS) were added together in a separate vessel and equilibrated at 37°C for 10 minutes to generate NADPH (∼1 mM) before initiating reactions by addition of the charged NRS. The P450 probe substrates used were 60 µM phenacetin for CYP1A2, 80 µM bupropion for CYP2B6, 2 µM amodiaquine for CYP2C8, 5 µM diclofenac for CYP2C9, 80 µM S-mephenytoin for CYP2C19, 5 µM dextromethorphan for CYP2D6, and either 2 µM midazolam or 50 µM testosterone for CYP3A4/5. Reactions were carried out at 37°C on an orbital shaker (150 rpm) for the times indicated in Table 3. The final organic solvent in all incubations was ≤1% DMSO and ≤0.9% of methanol and/or acetonitrile. A solvent control was carried out for each condition to 100% control activity. All reactions were terminated by the addition of an equal volume of acetonitrile containing stable-labeled internal standard (Table 2). The samples were vortexed and centrifuged for 5 minutes to sediment the precipitated protein. Cleared supernatants were transferred to fresh plates and used for the quantitation of the appropriate P450 probe substrate metabolite (Table 2) by LC-MS/MS as described earlier.
Assay conditions used to measure microsomal P450 enzyme activity and inhibition
Determination of P450 Time-Dependent Inhibition in HLM.
Lot IGF of HLM was used as above. Potential TDI of P450 enzyme activity by CAW-R61J was determined using the shift in IC50 values between 30-minute preincubations in the presence and absence of NADPH. Preincubation reactions were assembled in 96-well plates containing HLM (1 mg/ml), CAW-R61J or control, and KPi (Table 9). The reactions were equilibrated for 5 minutes at 37°C before being initiated by the addition of charged NRS or KPi. After 30 minutes of incubation at 37°C with shaking at 150 rpm, aliquots of the preincubation reactions were taken and diluted 1:10 in KPi containing the appropriate P450 probe substrate and NRS to measure residual P450 activity (conditions as in Table 3). Both the CAW-R61J dose-response reactions and the single concentration TDI control reactions using furafylline (1 μM), N,N′,N′′-triethylenethiophosphoramide (5 μM), phenelzine (100 μM), tienilic acid (1 μM), ticlopidine (10 μM), paroxetine (0.5 μM), and azamulin (0.5 μM) were carried out in triplicate. All reactions were terminated by the addition of an equal volume of acetonitrile containing stable-labeled internal standard (Table 2). The samples were vortexed and centrifuged for 5 minutes to sediment the precipitated protein. Cleared supernatants were transferred to fresh plates and used for the quantitation of the appropriate P450 probe substrate metabolite (Table 2) by LC-MS/MS as described earlier. Unless otherwise specified, all results were expressed as the means ± S.D. of triplicate determinations.
P450 mRNA Induction Data Analysis.
The Ct values (the fractional cycle number at which the fluorescence passes the fixed threshold) were determined as described above. Each target gene sample was normalized (ΔCt) by subtracting the Ct for its corresponding endogenous control (glyceraldehyde-3-phosphate dehydrogenase). In addition, the ΔΔCt was determined for positive control inducers and the test articles by subtracting the ΔCt of its corresponding solvent control. Fold changes in target gene expression were determined by taking 2 to the power of the ΔΔCt (2−ΔΔCt).
For comparison of mRNA responses, the percent of treatment induction response as compared with the positive control induction response was calculated using eq. 1, where CYP mRNA FOCSample is the mRNA fold over control (FOC) value of the CAW-R61J–treated samples, CYP mRNA FOCVehicle is the mRNA FOC value of 0.1% DMSO–treated samples, and CYP mRNA FOCPos Con is the mRNA FOC value of positive control–treated samples. To signify induction, a threshold of 2-fold over the vehicle control response and at least 20% of the relevant positive control response was used, a threshold proposed by the FDA (U.S. Food and Drug Administration, 2020). (1)
(1)
Statistical significance was determined by ordinary one-way ANOVA and the Bonferroni multiple comparisons test with 0.1% as the control. Differences with P values > 0.05 were considered significant. To determine the EC50 and maximal effect (Emax) values, the data from concentration-response (FOC values) curves were fitted to a four-parameter sigmoid (Hill) model, according to eq. 2. (2)
(2)
P450 Activity Induction Data Analysis.
Activity of CYP1A2, CYP2B6, and CYP3A4/5 was determined in picomoles per minute per 106 plated hepatocytes. The fold induction over the control was calculated by dividing the activity in the treated sample by the vehicle control activity and multiplying by 100. To determine the percentage of the positive control, the eq. 3 was used, where CYP Activity FOCSample is the activity FOC values of the CAW-R61J–treated samples, CYP Activity FOCVehicle is the activity FOC values of the 0.1% DMSO–treated samples, and CYP Activity FOCPos Con is the activity FOC value of positive control–treated samples. (3)To signify induction, a threshold of 40% of the positive control response was used, a threshold proposed by Fahmi et al. (2010).
P450 Inhibition Data Analysis.
The peak area ratio (PAR) of probe substrate metabolite to internal standard was determined for all the P450 inhibition samples. The values for the vehicle-treated control samples were taken as 100% P450 activity and compared with the treated samples to determine the percentage of P450 activity. The PAR of the treated samples was divided by the PAR of the control and multiplied by 100 to get the percentage of control activity. To determine the IC50 values, the concentration-response (percentage control value) curves were fitted to a four-parameter sigmoid (Hill) model, according to eq. 2 above (substituting logEC50 for logIC50). The percent TDI is the net time-dependent inhibition and was determined by taking the percent inhibition of the positive TDI control in the presence of NADPH during the 30-minute preincubation and subtracting the percent inhibition of the positive TDI control in the absence of NADPH.
Graph Plotting Software.
All curve fitting was carried out using Prism 8.0.2 (GraphPad Software, San Diego, CA).
Results
Chemical Characterization of CAW-R61J.
The composition of CAW-R61J used in this study with respect to characteristic centelloid and caffeoylquinic acid components was determined using precursor ion quantification by LC-HRMS (Table 4). Detailed untargeted LC-HRMS fingerprint of CAW-R61J, recorded using positive and negative electrospray ionization, is available upon request to the corresponding author.
CAW-R61J composition
Evaluation of Cytotoxicity Prior to P450 Induction Studies.
A pilot study was conducted using SCHH to determine the highest noncytotoxic concentration of CAW-R61J (lot XVN, Table 1). SCHHs were treated with 20, 250, or 1000 µg/ml CAW-R61J for 72 hours, and ATP levels were measured. The positive control, 25 µM tamoxifen, caused significant deterioration of the cultures and a complete loss of ATP from the cultures (Fig. 1). Since there was very little loss of ATP from the cultures with 20 µg/ml of CAW-R61J (10%) after 72 hours of treatment, 50 µg/ml was chosen as the highest CAW-R61J concentration used in the induction study. We have previously used 50 µg/ml of CAW-R61J with no observed cellular stress in studies with neuroblastoma cells and primary neurons (Gray et al., 2014, 2015, 2017a,b). However, there was some cytotoxicity observed with the 50-µg/ml concentration, so the highest concentration shown in the results is 16.7 µg/ml of CAW-R61J.
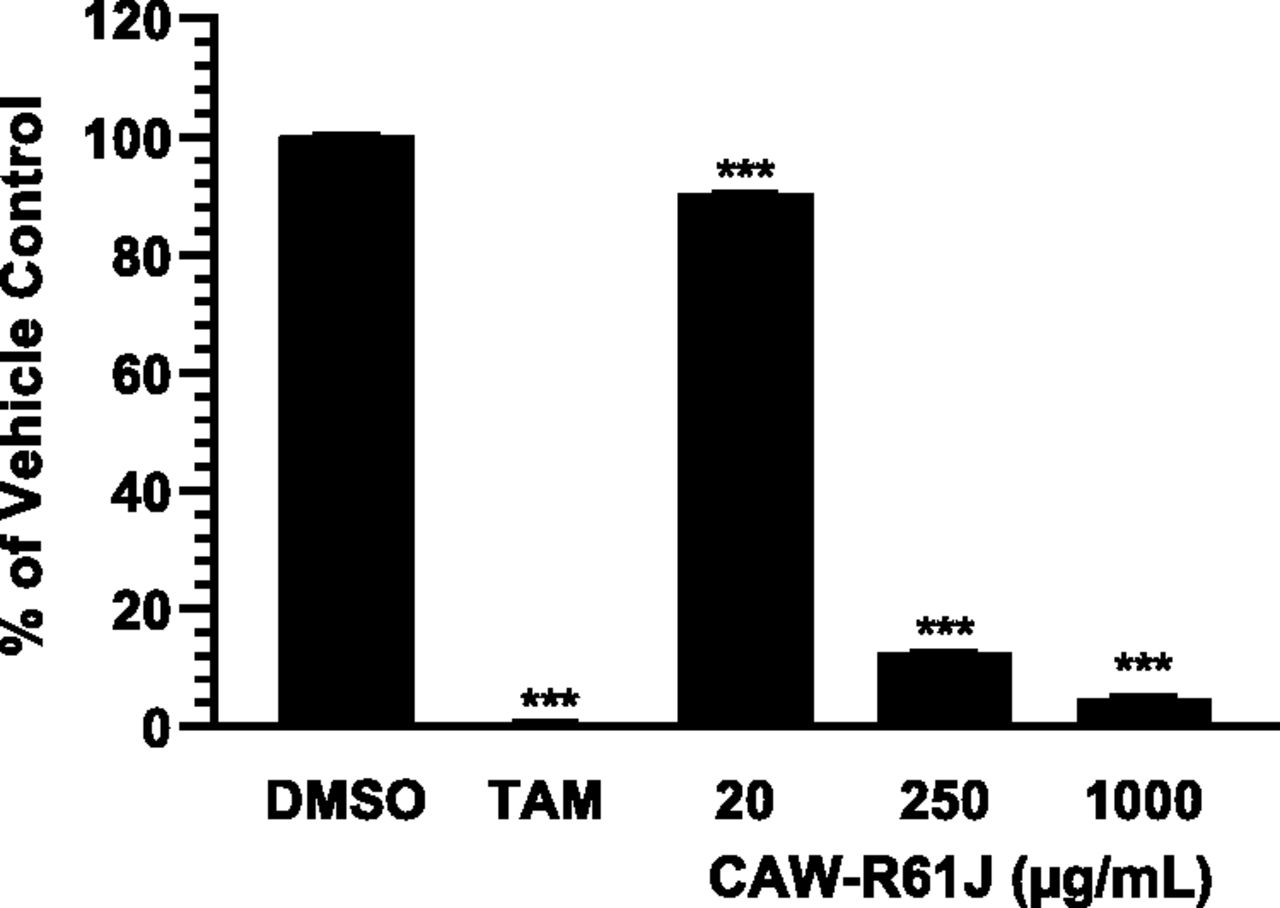
Relative ATP content of SCHH from donor XVN treated with DMSO, tamoxifen, or CAW-R61J. SCHH were treated for 72 hours with 0.1% DMSO, 25 µM tamoxifen (TAM), or the indicated concentrations of CAW-R61J. ATP levels were measured and normalized to the ATP content in the 0.1% DMSO vehicle control. ***P < 0.001; n = 3 per treatment.
Centelloid and Caffeoylquinic Acid Stability in Medium and Hepatocyte Cell Culture.
In a preliminary study, CAW-R61F (a component of CAW-R61J) dissolved in culture medium (without cells) was stored for 24 hours in an incubator at 37°C/5% CO2 or in a freezer at −20°C prior to HPLC-MS/MS analysis of caffeoylquinic acids and centelloids. Caffeoylquinic acids were detected in the −20°C sample, but they were below the limit of detection after 24 hours at 37°C. The centelloids were easily detectable in samples held at both temperatures. The glycosides asiaticoside and madecassoside demonstrated mild decline (<5%) over 24 hours at 37°C, whereas the aglycones asiatic acid and madecassic acid increased (4% and 21%) after 24 hours at 37°C, likely because of the hydrolysis of the glycosides. Differences in the size of the percent change are likely due to their relative abundance in CAW (Table 4).
Samples of the culture media during hepatocyte incubations were taken at 6 and 24 hours after the last addition of CAW-R61J and were compared with the original dosing solutions (CAW-R61J 5.6, 16.7 and 50 µg/ml) for the content of some known components using LC-HRMS (Table 5). The mono- and dicaffeoylquinic acids were below the detection limit in the samples from the two lowest doses of CAW-R61J. All of the caffeoylquinic acids were detected in the 50-µg/ml dose of CAW-R61J, but their levels had reduced considerably (>50%) by 6 hours. Interestingly, quinic acid levels increased over this time period, possibly derived from hydrolysis of the caffeoylquinic acids. Madecassoside, madecassic acid, asiaticoside, and asiatic acid were easily detectable in the samples at all starting concentrations. The centelloid glycosides madecassoside and asiaticoside showed modest increases over 24 hours. By contrast, levels of the aglycones madecassic acid and, particularly, asiatic acid declined over 24 hours.
Metabolic stability of CAW-R61J components during the final 24 h of SCHH treatment
Effect of CAW-R61J on mRNA Expression in SCHH.
Treatment of SCHH with the positive control P450 inducers (10 µM rifampicin, 1000 µM phenobarbital, and 50 µM omeprazole) resulted in significant increases in mRNA levels for the appropriate target gene in every donor (Table 6). The negative control (25 µM flumazenil) did not cause significant induction of any mRNA signal above the vehicle control, indicating a responsive test system (Table 6). Treatment with CAW-R61J (0.02–50 µg/ml) did not result in the induction of CYP1A2, CYP2B6, or CYP3A4 mRNA with any donor (Fig. 2A). For each enzyme, there was a dose-dependent decrease in mRNA signal for all three donors above 0.6 µg/ml of CAW-R61J.
Induction of P450 mRNA in SCHH after treatment of 72 h with DMSO, flumazenil, omeprazole, phenobarbital, or rifampicin
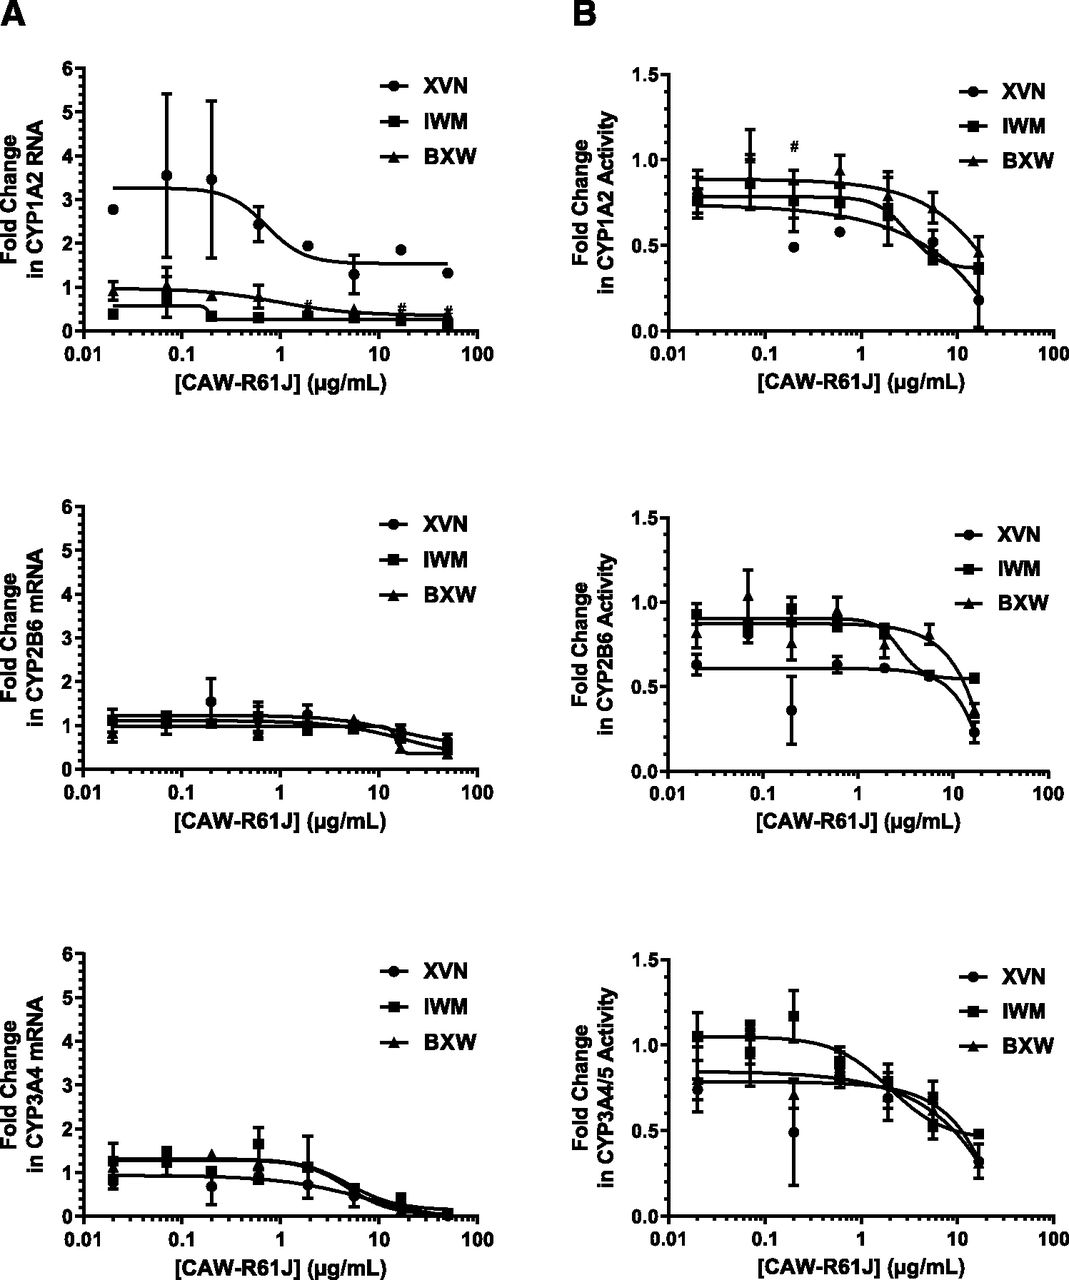
Dose-response of P450 mRNA and activity after treatment with CAW-R61J. Fold change of P450 mRNA (A) or P450 activity (B) is plotted relative to the vehicle control (0.1% DMSO) after treatment with CAW-R61J for 72 hours. Data shown are the means and S.E. of a triplicate determination in three individual hepatocyte donors. ●, donor XVN; ■, donor IWM; ▲, donor BXW; #, n = 2 for donor XVN. Data from the 50-μg/ml condition is not shown due to cytotoxicity being observed at this concentration.
Effect of CAW-R61J on Enzyme Activity.
The effect of CAW-R61J on the enzymatic activity levels of CYP1A2, CYP2B6, and CYP3A4 was examined in parallel with the mRNA levels described above. Both mRNA and activity data were gathered from a single well of SCHH. The positive control P450 inducers (50 µM omeprazole, 1000 µM phenobarbital, and 10 µM rifampicin) resulted in significant increases in activity levels for the appropriate target genes with all three donors (Table 7). The negative control (25 µM flumazenil) did not cause significant induction of enzyme activity above the vehicle control, indicating a responsive test system (Table 7). CAW-R61J treatment did not result in the induction of CYP1A2, CYP2B6, or CYP3A4 activity in hepatocytes from any donor (Fig. 2B). For each enzyme, there was a dose-dependent decrease in activity for all three donors similar to the mRNA results above (Fig. 2A).
Induction of P450 activity in SCHH after treatment of 72 h with DMSO, flumazenil, omeprazole, phenobarbital, or rifampicin
Cytotoxicity of CAW-R61J during SCHH Culture.
In photomicrographs of the cultures from all three donors taken every 24 hours throughout the study, there were no morphologic changes apparent with the 16.7-µg/ml concentration of CAW that would indicate cellular stress (loss of membrane integrity, blebbing, vacuole formation, etc.; data not shown). The concentration of 50 µg/ml did show signs of cytotoxicity at the latest time point; therefore, the data for this concentration are not included in Fig. 2.
Evaluation of Reversible P450 Inhibition.
The positive control reversible inhibitors all reduced their respective P450 enzyme activity (Fig. 3; Table 8) in a manner consistent with the literature (Ring et al., 1996; Suzuki et al., 2002; Emoto et al., 2003; Walsky et al., 2006; VandenBrink et al., 2011; Zhao et al., 2012; Thu et al., 2017). CAW-R61J was found to be a relatively weak reversible inhibitor for most of the P450s tested. The strongest reversible inhibition was against CYP2C9 (IC50 330 µg/ml), and the least inhibition was against CYP1A2 and CYP2B6 (IC50 > 1000 µg/ml). Dose-response curves are shown in Fig. 3 for CYP3A4, CYP2D6, and CYP2C19.

Reversible inhibition of P450 activity by CAW-R61J in HLM. Data are shown for CYP2C19 (●), CYP2D6 (■), CYP3A4 using midazolam (MDZ) as substrate (▲), and CYP3A4 using testosterone (TST) as substrate (♦). Data shown are the means ± S.D. of triplicate determinations.
Reversible inhibition of P450 activity in HLM with CAW-R61J or control reversible P450 inhibitors
Evaluation of Time-Dependent P450 Inhibition.
The positive control time-dependent inhibitors all reduced their respective P450 enzyme activity in an NADPH- and time-dependent manner (Table 9), meeting BioIVT’s predetermined acceptance criteria for demonstrating that the test system is capable of detecting TDI in HLM. CAW-R61J was not found to be a time-dependent inhibitor for any of the P450s tested up to 1000 µg/ml (Table 9). For all P450 forms examined, there was virtually no difference between the dose-response curves with or without NADPH (Fig. 4). A shift of 1.5-fold in the IC50 that is NADPH- and time-dependent is the commonly used threshold to indicate time-dependent inhibition.
TDI of P450 activity in HLM with CAW-R61J or control TDI P450 inhibitors

TDI of CYP2C19 (A), CYP2D6 (B), CYP3A4 using midazolam as substrate (C), and CYP3A4 using testosterone as substrate (D) activity by CAW-R61J in HLM. Potential TDI of P450 enzyme activity by CAW-R61J was determined using the shift in IC50 values between 30-minute preincubations in the presence and absence of NADPH. All reactions were performed in triplicate. Data shown are the means ± S.D. of triplicate determinations.
Discussion
After several studies on the inhibitory potential of CA extracts and compounds, this is the first study investigating the effects of the specific type of CA extract (CAW-R61J; a hot water extract) prepared for use in our preclinical, phase I, and phase II clinical studies on P450 enzymes. Plant extracts are complex, and their composition will vary depending on the source material and extraction method. Although the results of this study are specific to CAW-R61J, a range of doses were tested in an effort to encompass the variable levels of water-extractable compounds that may occur between this specific extract and other similarly prepared aqueous extracts. CAW-R61J was characterized by LC-HRMS to be able to relate its effects on P450 activity to specific concentrations of known active compounds. Of these, the centelloids have a limited distribution in the plant kingdom, whereas the caffeoylquinic acids are common in numerous plants used in food and beverages. This makes consideration of the effects of the centelloids on P450 induction and inhibition of particular importance.
In our preliminary studies, CAW-R61J did cause some cytotoxicity in the hepatocyte cultures at higher concentrations, which was unexpected based on data from previous neuroblastoma and primary neuron cell culture studies in which up to 200 µg/ml of CAW-R61J has been used (Soumyanath et al., 2012; Gray et al., 2015, 2017a,b). Because of this observation, it was decided that for the induction study, 50 µg/ml would be used as the highest concentration. However, because of toxicity observed at this concentration, only the data up to 16.7 μg/ml (the next-highest concentration tested) are considered. CAW-R61J, applied at up to 16.7 µg/ml, was found not to induce CYP1A2, CYP2B6, or CYP3A4 in SCHH. However, higher concentrations of CAW-R61J within this range did show some mild toxicity, which could explain the dose-dependent decrease in mRNA signal for all three of the forms tested in all three of the donors. It is also possible that these concentrations of CAW-R61J were causing some biochemical changes in the hepatocytes, including downregulation of P450 genes that were not apparent visually in the photomicrographs. Nevertheless, no induction of the enzymes was observed at the nontoxic or mildly cytotoxic concentrations of the extract tested.
Metabolic stability of the known CA compounds in media and during the induction experiment was examined. Although the caffeoylquinic acids were not stable throughout the dosing period, the centelloids were easily detectable and were relatively stable. Caffeoylquinic acids degraded in medium alone over 24 hours, showing that their loss in SCHH incubations was not due to cellular metabolism alone. It can be noted (Table 5) that 24-hour recovery values for the triterpene glycosides exceed 100%. This may have been due to their release from breakdown of larger sugar-containing moieties. The aglycones do reduce in concentration over the 24-hour period, potentially because of metabolism, since they do not contain chemically labile functional groups. Because of the stability of the centelloids, the relatively unique and suspected main active constituents of CA, it was decided to not carry out additional dosing during each 24-hour incubation period. At the end of the last dosing period of 16.7 μg/ml, the triterpene glycosides asiaticoside and madecassoside were present at approximately 1.1 and 0.8 µM, respectively, whereas the free aglycones asiatic acid and madecassic acid were present at 0.09 and 0.12 µM, respectively. Since no induction was observed with CAW-R61J, we conclude that these concentrations of the centelloids do not induce CYP1A2, CYP2B6, or CYP3A4 in SCHH. Because of their significant loss by 6 hours (Table 4), we are unable to properly assess the induction capacity of caffeoylquinic acids. However, since they are ubiquitous in dietary plants, their effects on P450 are less significant than those of the centelloids.
CAW-R61J (≤1000 µg/ml) was not a time-dependent inhibitor of any P450 form tested. However, it did exhibit weak, reversible inhibition of most P450 forms tested, with the greatest inhibition being of CYP2C9 (IC50 330 µg/ml) and the least inhibition of CYP1A2 and CYP2B6 (IC50 > 1000 µg/ml). These results are consistent with previous phase I metabolic reaction studies in which a CA methanolic extract weakly inhibited human CYP3A4 (IC50 226 µg/ml), CYP2D6 (IC50 140 µg/ml), CYP2C9 (IC50 185 µg/ml), and CYP1A2 (IC50 289 µg/ml) (Kar et al., 2017). Similar results were observed with a CA methanolic extract in human liver microsomes (IC50 60–109 µg/ml) (Savai et al., 2015b). Separately, CA was sequentially extracted with hexane, dichloromethane, ethanol, and water. In human P450 forms expressed by Escherichia coli, the ethanol and dichloromethane extracts showed a higher inhibitory effect on CYP2C19, CYP2C9, CYP2D6, and CYP3A4 (IC50 17–466 µg/ml) compared with the water (IC50 230–615 µg/ml) or hexane (IC50 113–397 µg/ml) extracts (Pan et al., 2010, 2011). This was also observed in human microsomes using methanolic, ethanolic, and hydromethanolic extracts of CA (IC50 44– >200 µg/ml) (Savai et al., 2015a,b).
The lower IC50 values (more potent inhibition) observed with other (nonaqueous) CA extracts compared with CAW-R61J may be due to species and test system differences, as well as differences in the levels of the P450 inhibitory components. CA ethanolic extracts have higher levels of less-polar compounds (like triterpene aglycones and glycosides) than aqueous extracts, which are richer in polar metabolites (like caffeoylquinic acids) (Gray et al., 2018a). The solvents used may have extracted compounds not found in CAW-R61J. This reinforces the need to investigate the specific botanical extract of interest for its P450 inhibitory and induction potential prior to clinical testing.
Purified centelloids are weak inhibitors in human liver microsomes and human P450 forms expressed by E. coli of CYP2C19, CYP3A4, CYP2D6, and CYP2C9. Madecassic and asiatic acids were found to be more potent (IC50 61- > 495 µM and IC50 68–139 µM, respectively) than asiaticoside (IC50 1116- > 1564 µM) (Pan et al., 2010, 2011; Savai et al., 2015b). This difference in potency has been proposed to be due to varying degrees of lipophilicity and hydrogen bonding between the aglycones and the glycosides (Pan et al., 2010). A standardized CA extract (ECa-223) containing madecassoside (43%) and asiaticoside (39%) inhibited purified CYP3A4, CYP2C19, and CYP2B6 (IC50 211–871 µg/ml; 200–900 µM) but had no effect on CYP1A2, CYP2C9, CYP2D6, and CYP2E1 (Seeka et al., 2012). Standard inhibitors of these P450 forms have considerably lower IC50 values (0.01–5.3 µM; Table 8), indicating just how weak these centelloids are as P450 inhibitors.
The observed lowest IC50 for CAW-R61J in this study (CYP2C9; 330 µg/ml) is equivalent to 16 µM madecassoside, 22.1 µM asiaticoside, 1.9 µM asiatic acid, and 2.3 µM madecassic acid. These concentrations are well below the IC50 values observed when testing the purified centelloids as described above. Thus, other components in CAW-R61J must be responsible for, or contribute to, the inhibitory effects on CYP2C9, or the centelloids may act synergistically to inhibit CYP2C9.
It has been suggested that an IC50 of less than 100 μg/ml (for extracts) or 100 μM (for active constituents) should be classified as potent inhibition that could lead to undesirable herb-drug interactions (Obach, 2000; Pan et al., 2011). By this measure, CAW-R61J is not a potent P450 inhibitor, and it also showed no evidence of P450 induction. The clinical consequences, if any, of the weak inhibition by CAW-R61J noted in our study will be dependent on the concentrations of inhibitory CAW-R61J components attained in the liver and other P450-containing tissues after oral administration. In a clinical study performed by our group, daily administration of Centella asiatica selected triterpenes (CAST), a product containing mixed centelloids (96 mg of asiaticoside, 84 mg of madecassic acid, 60 mg of asiatic acid), for 6 months gave steady-state plasma levels of 0.5 µM asiatic acid and 0.07 µM madecassic acid (Lou et al., 2018), significantly lower than the lowest IC50 values described earlier for the purified compounds (61 and 68 µM) (Pan et al., 2010, 2011; Savai et al., 2015b). Based on the centelloid content of CAW-R61J, we expect similar plasma concentrations for these compounds in our clinical studies using this extract. Again, these levels are lower than the concentrations of these compounds found at the lowest IC50 of CAW-R61J (CYP2C9; 330 µg/ml). Although higher concentrations may be achieved in the liver, the main site of P450 activity or inhibition, this study suggests that the centelloids in CAW-R61J are unlikely to result in clinically significant induction or inhibition of P450 in humans.
Ultimately, the clinical relevance of the weak P450 inhibition seen in this study will depend on the IC50 values of the as yet unknown inhibitory CAW-R61J compounds and their in vivo concentration achieved in humans. In making these comparisons, it will be important to consider the unbound fraction (rather than total concentration) of each compound in vitro and in plasma. However, based on the results of the present study, it is expected that administration of the proposed doses of CAW-R61J (up to 4 g) would not cause clinically significant P450 induction or inhibition resulting in herb-drug interactions in humans.
Future studies could focus on identifying the CA compounds associated with the weak P450 inhibition seen in the present study, evaluating their IC50 values, and comparing these with systemic concentrations achieved in humans. Bioassay (P450 inhibition)-guided fractionation could be performed to isolate and identify these molecules. Once identified, these compounds could be excluded from extracts developed for clinical use of CA if their IC50 values and human plasma levels suggest a clinically relevant inhibitory potential.
It will also be important to examine possible interactions of CA derivatives with phase II drug-metabolizing enzymes. CA extract (ECa-223) administered orally to male and female rats at 10, 100, and 1000 mg/kg per day for 90 days did not alter the activity of hepatic phase II metabolizing enzymes uridine diphosphate glucuronosyltransferase, glutathione S-transferase, and NADPH:quinone oxidoreductase (Seeka et al., 2017). Hepatic sulfotransferase activity was not changed in female rats, whereas a previous study had found a decrease in sulfotransferase activity in male rats treated with ECa-223 (Seeka et al., 2017). However, no studies were found on the effects of CA derivatives on phase II drug metabolism in humans or human-derived test systems.
Authorship Contributions
Participated in research design: Wright, Magana, Laethem, Banks, Maier, Stevens, Quinn, Soumyanath.
Conducted experiments: Wright, Magana, Laethem, Moseley, Banks.
Performed data analysis: Wright, Magana, Laethem, Moseley, Banks, Soumyanath.
Wrote or contributed to the writing of the manuscript: Wright, Laethem, Magana, Banks, Stevens, Soumyanath.
Footnotes
- Received February 6, 2020.
- Accepted June 12, 2020.
This work was supported in part by National Institutes of Health National Center for Complementary and Integrative Health [Grant R61AT009628 (A.S., J.F.Q., K.M.W.), Grant T32AT002688 (K.M.W.), and Grant KL2TR002370-03S1 (K.M.W.)], National Institute on Aging [Grant P30-AG008017 (J.F.Q., K.M.W.)], and National Center for Research Resources [Grant S10RR027878 (J.F.S.)].
Abbreviations
- CA
- Centella asiatica
- CAW
- Centella asiatica aqueous extract
- Ct
- threshold cycle
- FDA
- Food and Drug Administration
- FOC
- fold over control
- HBSS
- Hank’s balanced salt solution
- HLM
- human liver microsome
- HPLC-MS/MS
- high-performance liquid chromatography–tandem mass spectrometry
- LC-HRMS
- liquid chromatography–high-resolution mass spectrometry LC-MS liquid chromatography- mass spectrometry
- NRS
- NADPH regenerating system
- OHSU
- Oregon Health & Science University
- P450
- cytochrome P450
- PAR
- peak area ratio
- SCHH
- sandwich-cultured human hepatocytes
- TDI
- time-dependent inhibition
- U.S. Government work not protected by U.S. copyright


