


Article Figures & Data
Figures
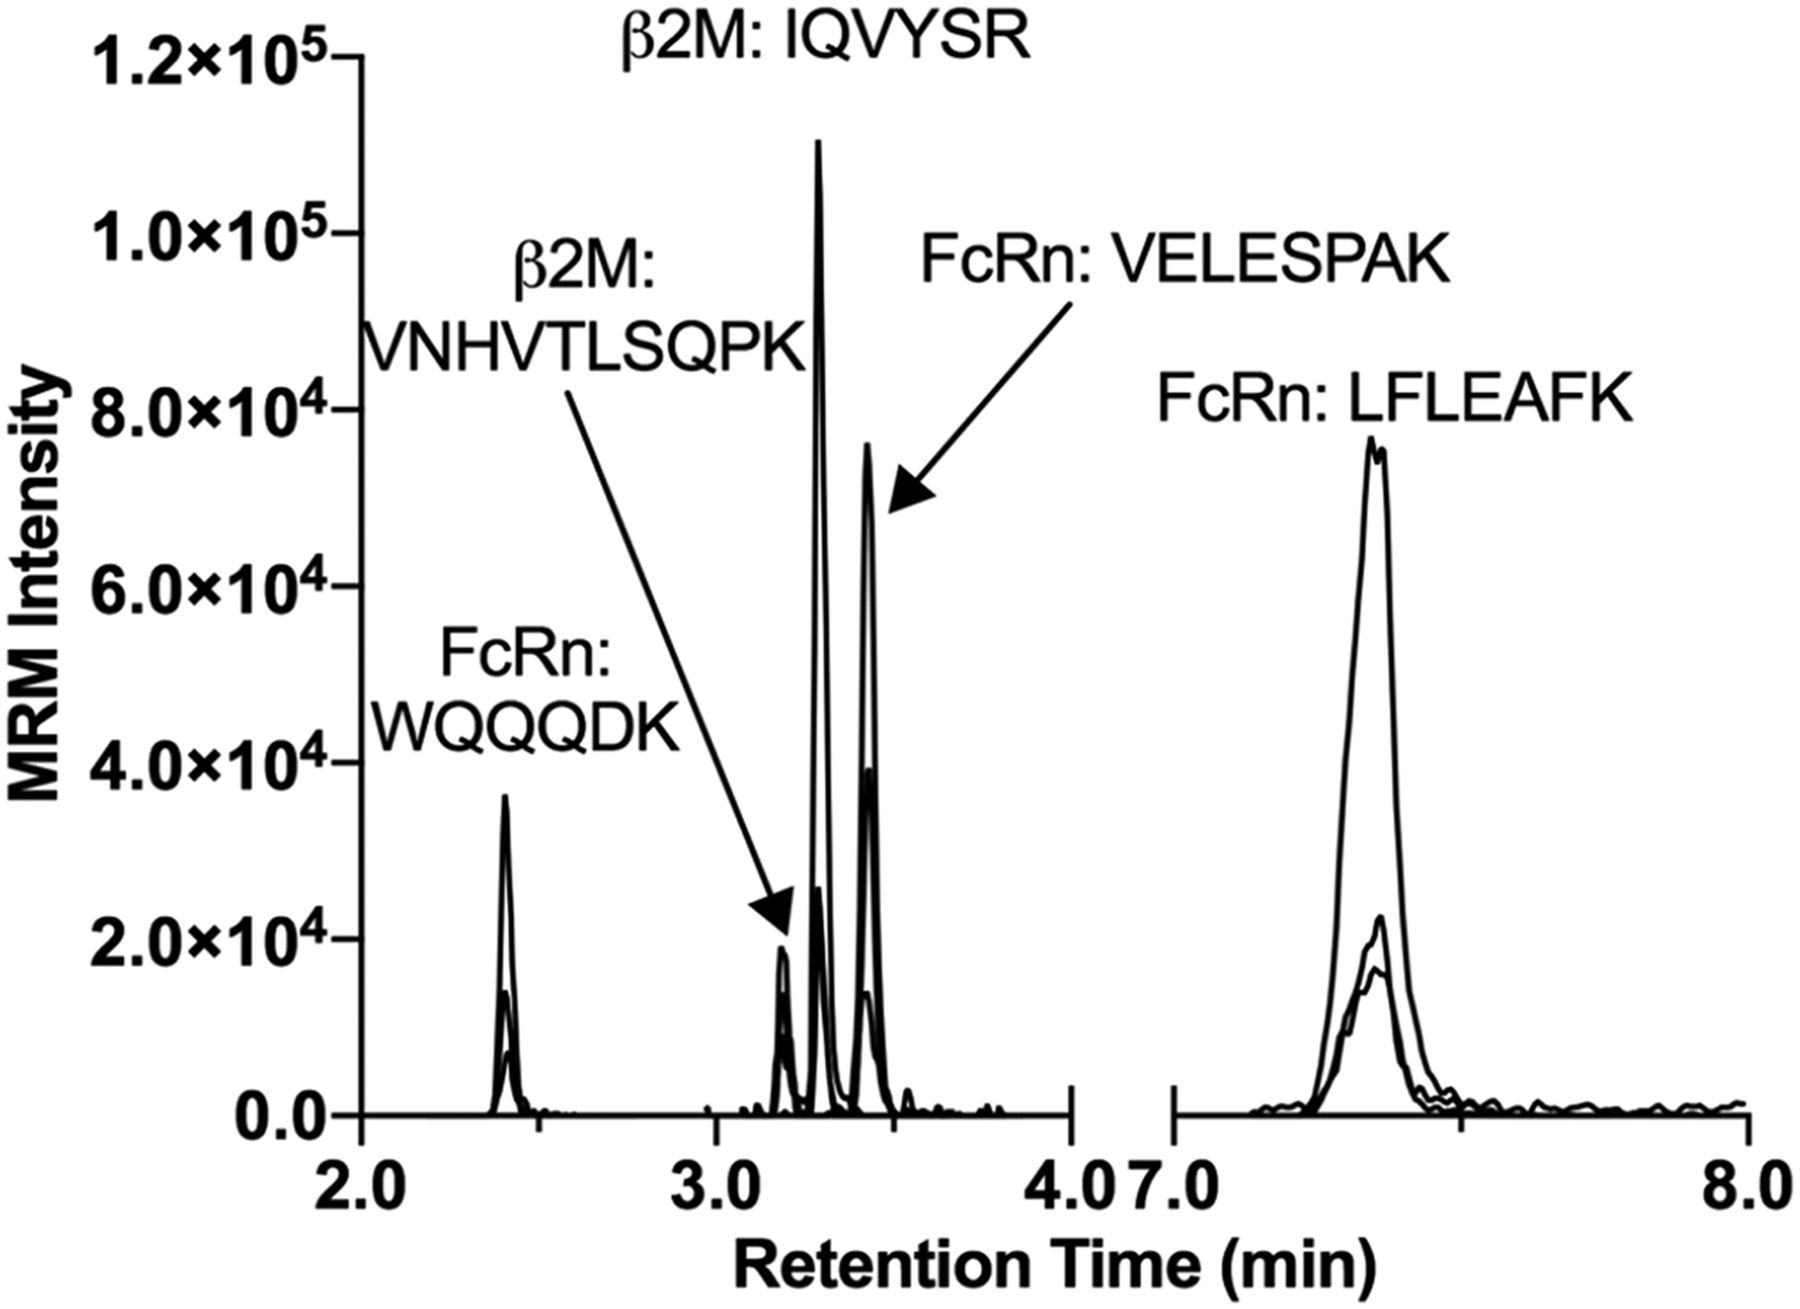
- Fig. 1.
UPLC-MRM chromatograms of FcRn and β2M heavy stable isotope–labeled signature peptides. Three transitions of each peptide were monitored, and the highest MS intensity was used as quantification trace in the analysis.
- Fig. 2.
Influences of trypsin digestion time (A) and trypsin:protein ratio (B) on the UPLC-MRM signals of both signature peptides. The relative MRM peak area was determined by normalizing light peptide area from PNS digest to the spiked-in isotope-labeled signature peptides. Symbols and error bars represent the average and S.D. of triplicate digestions, and the dotted lines in (B) denotes the best-fit lines determined using least-square linear regression analysis.
- Fig. 3.
Recovery of FcRn and β2M in isolated PNS. The normalized relative MRM peak area was determined by normalizing the ratio of light peptide area and the spiked-in heavy peptides area from 10 μg digest to the total amount of protein in isolated PNS. Lines and error bars represent the average and S.D. of triplicate digestions. Symbols represent the normalized relative MRM peak area from each of the triplicate digestion. Unpaired two-tailed t test was used to compare the values from P1, P2, and PNS. Quantitative recovery percentages are listed in Table 2.
- Fig. 4.
Standard curves of FcRn and β2M quantification. The relative MRM peak area was determined by normalizing light peptide area to the spiked-in heavy peptides. Symbols and error bars represent the average and S.D. of triplicate injections of the same standard digest, and the dotted lines denotes the best-fit lines determined using quadratic fitting with 1/x weighting. The insert shows a blow-up of the lower standard concentration region.
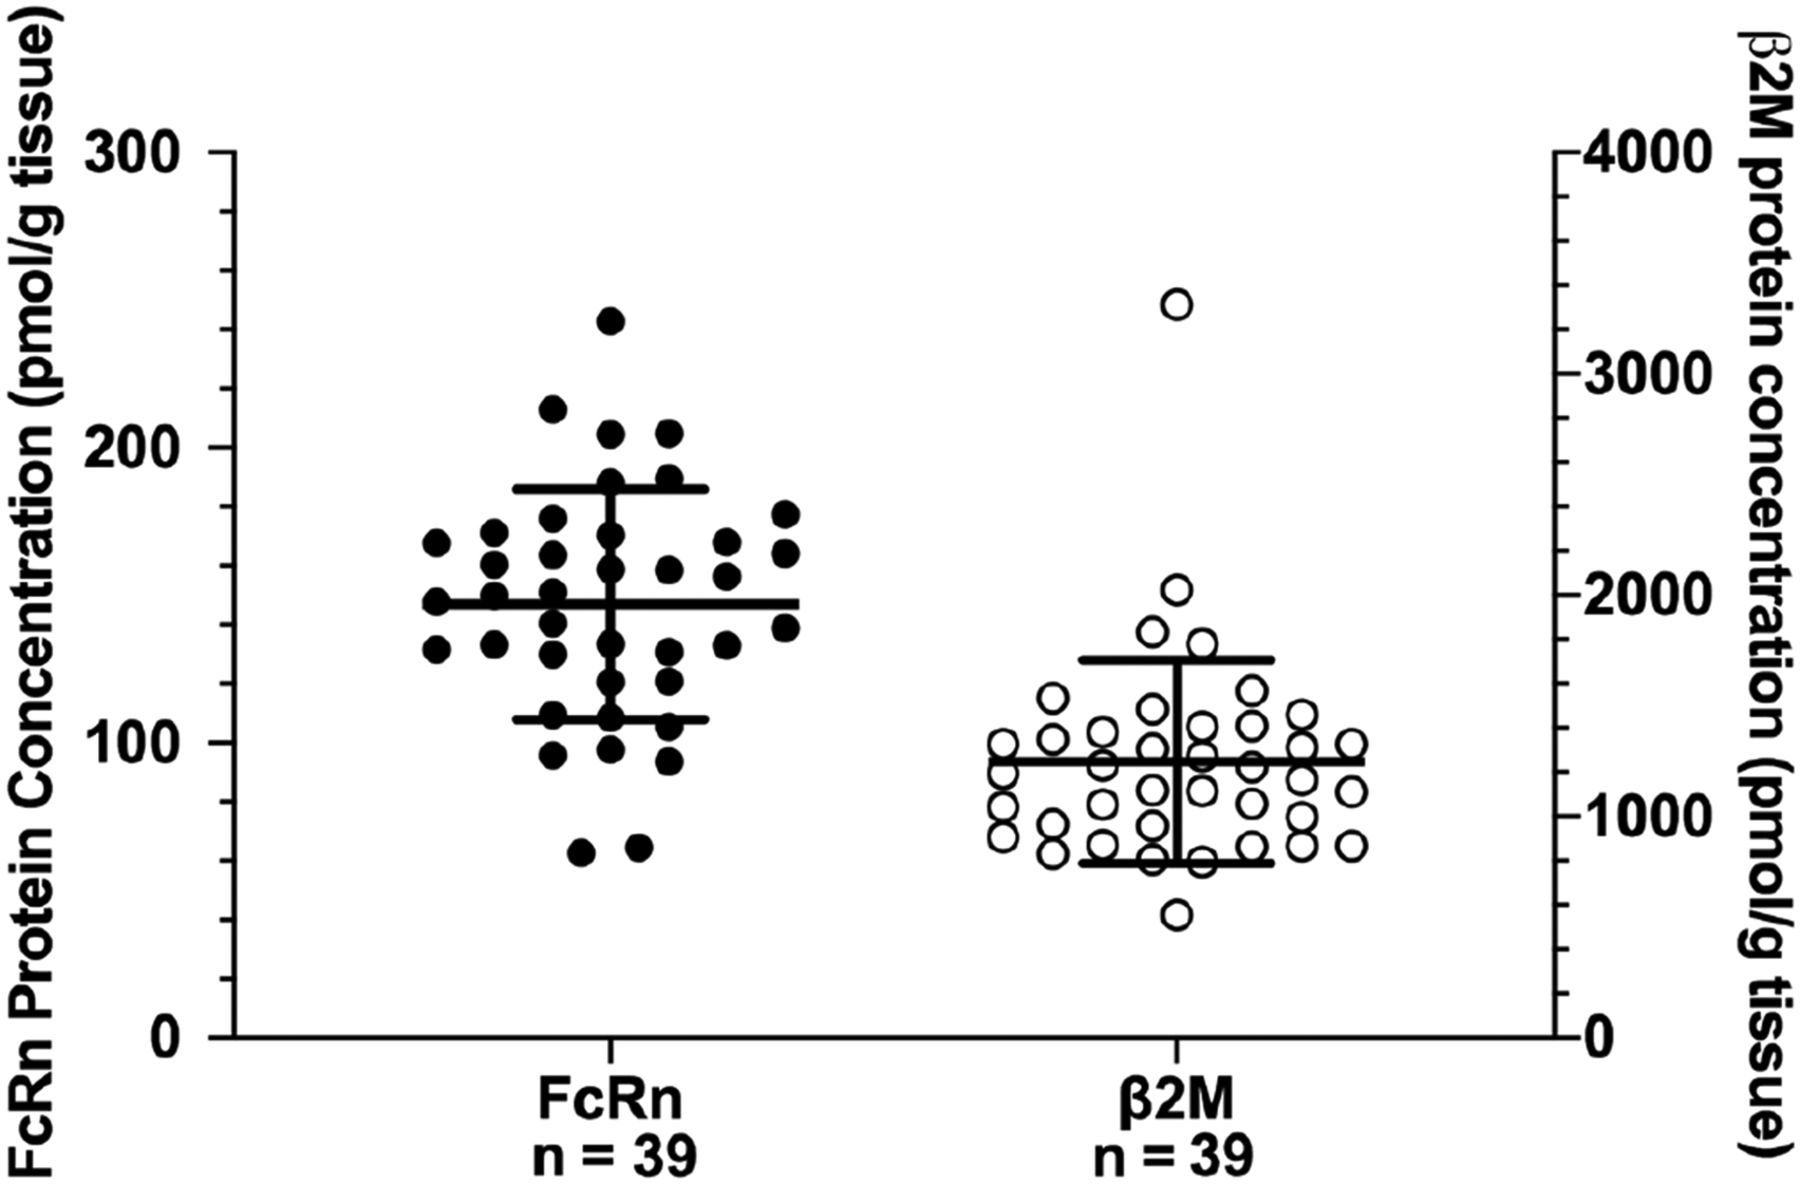
- Fig. 5.
Absolute quantification of FcRn and β2M in individual human livers (n = 39). Concentration of both proteins are expressed in picomole protein per gram of liver tissue. Lines and error bars represent the average and S.D. of all human liver analyzed. Symbols represent the average concentration determined from three separate digestions for each individual donor. The y-axis for FcRn quantification is plotted on the left, and the y-axis for β2M is plotted on the right.
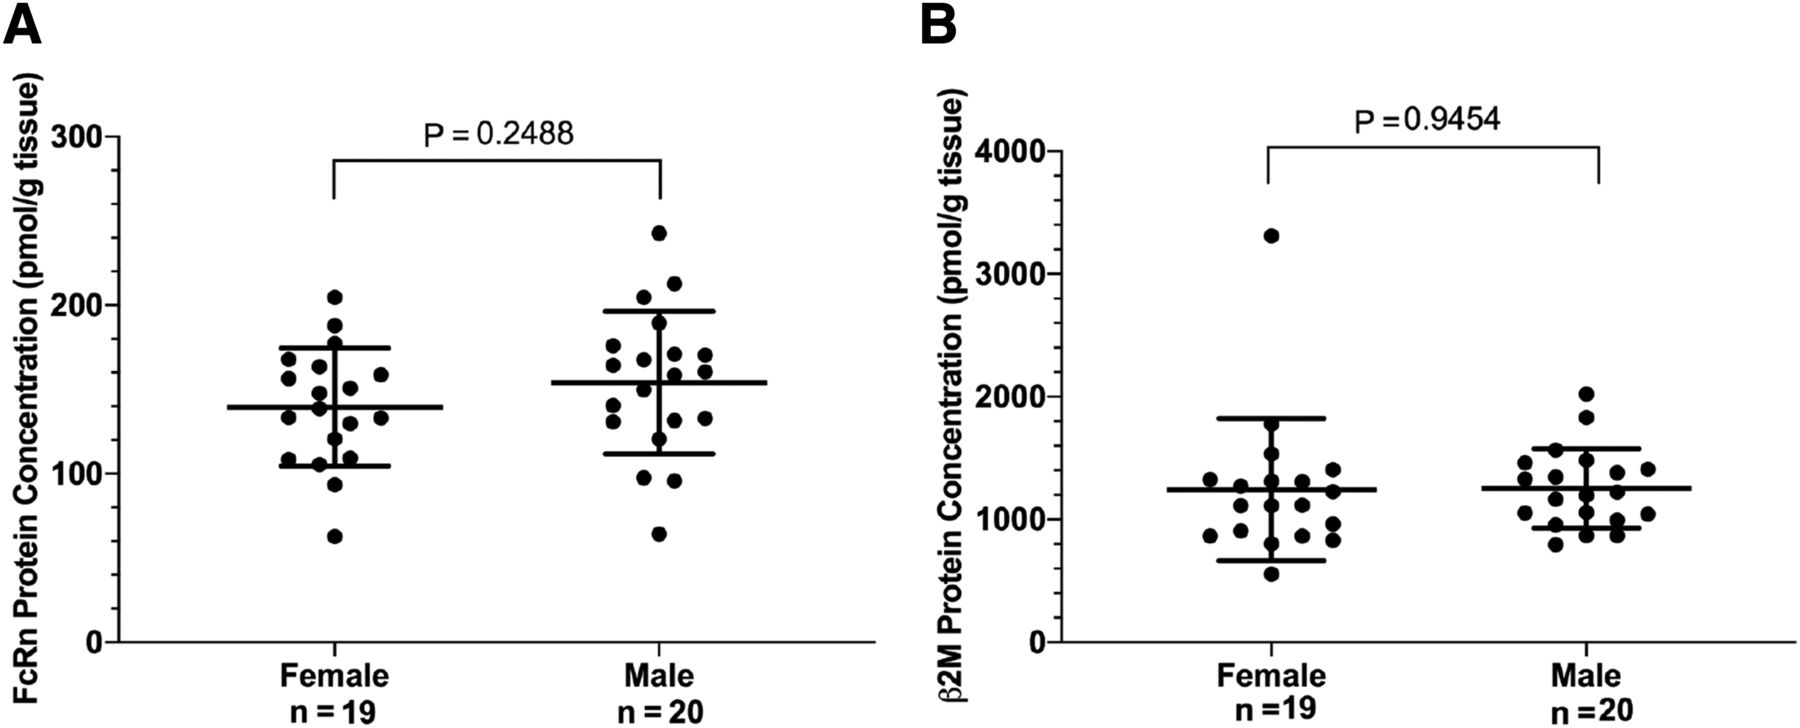
- Fig. 6.
FcRn (A) and β2M (B) concentrations based on gender. Lines and error bars represent the average and S.D. of all human liver analyzed in each gender group. Symbols represent the average concentration determined from three separate digestions for each individual donor. Unpaired two-tailed t test found no significant statistical differences between two groups for both FcRn and β2M.
- Fig. 7.
FcRn (A and C) and β2M (B and D) concentrations based on age. (A and B) Symbols and error bars represent the average and S.D. of triplicates of digestion for each human liver donor. (C and D) Lines and error bars represent the average and S.D. of all human liver analyzed in each age group. Symbols represent the average concentration determined from three separate digestions for each individual donor. One-way ANOVA followed by Tukey’s multiple comparisons test with a single pooled variance found no significant statistical differences among age groups for both FcRn and β2M.
- Fig. 8.
FcRn (A) and β2M (B) concentrations based on race. Lines and error bars represent the average and S.D. of all human liver analyzed in each race group. Symbols represent the average concentration determined from three separate digestions for each individual donor. Unpaired two-tailed t test found no significant statistical differences between Caucasian and African American donors for FcRn expressions and found significant statistical differences (P = 0.0218) for β2M expressions including the statistical outlier determined by Grubb’s test.
- Fig. 9.
Correlation analysis of FcRn concentration and β2M concentration (n = 39). Symbols and error bars represent the average and S.D. of triplicates of digestion for each human liver donor. The dotted line represents the best-fit lines determined using least-square linear regression analysis.


Tables
Protein Signature Peptidea Start to Endb Average Mass MH+c MRM Cone CEe Precursor Ion Product Iond Da m/z m/z V eV β2Μ VNHVTLSQPK 102–111 1123.3 562.16 351.18 56 22 455.26 18 673.39 20 VNHVTLSQP(K) 1131.3 566.06 351.18 22 459.26 18 681.39 20 IQVYSR 27–32 765.9 383.45 425.21 32 16 524.28 12 652.34 14 IQVYS(R) 775.9 388.42 435.26 16 534.27 12 662.34 14 FcRn WQQQDK 164–169 832.9 416.95 500.25 34 16 518.26 14 629.29 16 WQQQD(K) 840.9 420.95 508.25 16 526.26 14 637.29 16 VELESPAK 288–295 873.0 437.00 315.20 32 20 644.36 14 773.40 16 VELESPA(K) 881.0 440.97 323.20 20 652.36 14 781.40 16 LFLEAFK 97–103 868.1 434.54 365.22 20 18 607.35 12 754.41 16 LFLEA(F)K 878.1 439.54 375.22 18 617.35 12 764.41 16 ↵a Stable isotope–labeled amino acid residues are included in parentheses.
↵b Start and end residue positions of peptides in the corresponding full-length protein.
↵c Theoretical average mass of monoprotonated molecular ion.
↵d Bolded product ions were used as the quantification trace.
↵e CE = collision energy
β2M FcRn % % P1 24.7 23.0 P2 4.4 4.5 PNS 71.0 72.5 - TABLE 3
Summary of analytical performance of the UPLC-MRM method for FcRn and β2M signature peptides
Protein Signature Peptide LLOQa ULOQa Accuracy (CV) 0.1 nM QCa 1 nM QC 30 nM QC 120 nM QC nM nM % % % % β2M IQVYSR 0.067 133.3 NDa 96 (4.5) 98 (7.2) 115 (10.6) FcRn LFLEAFK 0.007 133.3 86 (25.7) 83 (2.8) 90 (3.0) 100 (1.4) ↵a LLOQ, lower limit of quantification; ND, not determined; QC, quality control; ULOQ, upper limit of quantification.
- TABLE 4
Summary of average concentration and 95% CI of FcRn and β2M for different age groups
Protein Concentration (pmol/g liver tissues) Age groups (years) <20 21–30 31–40 41–50 51–60 >61 β2M Mean 1122 1258 1194 1326 1330 1244 Lower 95% CI of mean 962.7 975.0 813.1 1040 476.8 662.1 Upper 95% CI of mean 1281 1542 1576 1611 2184 1825 FcRn Mean 132.3 178.9 141.8 144.2 133.1 158.9 Lower 95% CI of mean 95.16 145.9 122.8 102.6 98.59 85.89 Upper 95% CI of mean 169.4 211.9 160.7 185.8 167.7 231.9
Data Supplement
- Supplemental Data -
Supplementary Table 1 - Summary of human liver donor information (n=39).
Supplementary Table 2 - Normality tests of FcRn and beta2M measured protein expressions.
Supplementary Figure 1 - UPLC-MRM chromatograms of FcRn and beta2M from L369D1 PNS.
Supplementary Figure 2 - Absolute quantification of FcRn (A) and beta2M (B) for each individual liver tissue donor and concentration frequency distribution for FcRn (C) and beta2M (D).
Supplementary Figure 3 - Beta2M concentrations with outlier inclusion based on ethnicity.
Supplementary figure 4 - Correlation analysis of FcRn concentration and beta2M concentration without the outlier (n-38).
- Supplemental Data -


