


Visual Overview

Abstract
Estimation of unbound drug concentration in the brain (Cu,brain) is an essential part of central nervous system (CNS) drug development. As a surrogate for Cu,brain in humans and nonhuman primates, drug concentration in cerebrospinal fluid (CCSF) collected by lumbar puncture is often used; however, the predictability of Cu,brain by lumbar CCSF is unclear, particularly for substrates of the active efflux transporter P-glycoprotein (P-gp). Here, we measured lumbar CCSF in cynomolgus monkey after single intravenous administration of 10 test compounds with varying P-gp transport activities. The in vivo lumbar cerebrospinal fluid (CSF)-to-plasma unbound drug concentration ratios (Kp,uu,lumbar CSF) of nonsubstrates or weak substrates of P-gp were in the range 0.885–1.34, whereas those of good substrates of P-gp were in the range 0.195–0.458 and were strongly negatively correlated with in vitro P-gp transport activity. Moreover, concomitant treatment with a P-gp inhibitor, zosuquidar, increased the Kp,uu,lumbar CSF values of the good P-gp substrates, indicating that P-gp–mediated active efflux contributed to the low Kp,uu,lumbar CSF values of these compounds. Compared with the drug concentrations in the cisternal CSF and interstitial fluid (ISF) that we previously determined in cynomolgus monkeys, the lumbar CCSF were more than triple for two and all of the good P-gp substrates examined, respectively. Although lumbar CCSF may overestimate cisternal CSF and ISF concentrations of good P-gp substrates, lumbar CCSF allowed discrimination of good P-gp substrates from the weak and nonsubstrates and can be used to estimate the impact of P-gp–mediated active efflux on drug CNS penetration.
SIGNIFICANCE STATEMENT This is the first study to systematically evaluate the penetration of various P-glycoprotein (P-gp) substrates into lumbar cerebrospinal fluid (CSF) in nonhuman primates. Lumbar CSF may contain >3-fold higher concentrations of good P-gp substrates than interstitial fluid (ISF) and cisternal CSF but was able to discriminate the good substrates from the weak or nonsubstrates. Because lumbar CSF is more accessible than ISF and cisternal CSF in nonhuman primates, these findings will help increase our understanding of drug central nervous system penetration at the nonclinical stage.
Introduction
Ensuring that drugs reach their target in the central nervous system (CNS) at appropriate concentrations is an important part of CNS drug development. The CNS is protected by blood-tissue barriers, such as the blood-brain barrier (BBB), which are characterized by highly developed tight junctions and active efflux transporters, such as P-glycoprotein (P-gp), that act to prevent or reduce exposure of the CNS to drugs and other xenobiotics (Urquhart and Kim, 2009). Active efflux by these transporters reduces the unbound concentration of their substrates in the brain (Cu,brain), which in turn reduces the effects of these substrates on the CNS (Xie et al., 1999; Zong and Pollack, 2000). This means that high doses are required for active efflux transporter substrates to attain an efficacious concentration, resulting in higher systemic exposure and a narrower therapeutic index with respect to peripheral toxicities. The unbound concentration of such drugs in the plasma (Cu,plasma) is no longer considered an appropriate biomarker of Cu,brain in understanding of the pharmacokinetics (PK)/pharmacodynamics relationship of CNS-active compounds (Watson et al., 2009; Kanamitsu et al., 2016). Therefore, methods to quantitatively determine Cu,brain are required.
Determination of drug concentrations in brain interstitial fluid (CISF) by microdialysis (Benveniste and Hüttemeier, 1990) is a direct approach to estimate Cu,brain; however, because of its low throughput and technical difficulties, this technique is rarely used in drug development. Instead, the concentration of drug in cerebrospinal fluid (CCSF) collected from the cisterna magna (the fourth ventricle) is used as a surrogate for Cu,brain since the CSF is in close contact with the CNS and separated only by a layer of ependymal cells, which do not have a barrier function (Liu et al., 2006; Kodaira et al., 2011). Indeed, we have reported that for a set of compounds with high passive diffusion permeabilities and varying P-gp transport activities in rats and monkeys, the cisternal CCSF was within or close to triple the CISF (Nagaya et al., 2014, 2016).
Microdialysis and cisternal CSF sampling can provide a reliable estimate of Cu,brain; however, they are highly invasive, requiring surgery for implanting catheters or microdialysis probes in nonhuman primates and humans. Lumbar puncture is another technique often used to collect CSF samples, which is less invasive and applicable to healthy volunteers. Because drugs in the fourth ventricle are considered to diffuse into the ventricular space surrounding the spinal cord by bulk flow, no gradient between lumbar CCSF and cisternal CCSF is generally assumed. However, regional differences in the drug concentration in the CNS are a major concern when the pharmacological target site (e.g., cerebrum) is located far from the site of lumbar puncture. Indeed, differences in the CCSF between cisternal and lumbar sites have been reported for some compounds (Strong et al., 1986; Blaney et al., 1995; Baker et al., 1996). Moreover, drug transporters in the arachnoid mater, under which the CSF flows, could modulate drug concentrations in the ventricles (Zhang et al., 2018). These findings cast doubt on the suitability of using lumbar CCSF as a surrogate of Cu,brain, prompting us to systematically evaluate lumbar CCSF of drugs that are transported by P-gp.
In the present study, a set of compounds with high passive diffusion membrane permeabilities and varying P-gp transport activities were intravenously administered to cynomolgus monkeys, and CSF was collected by lumbar puncture to measure lumbar CCSF. Cynomolgus monkeys were used because the expression levels of P-gp in their BBB are similar to those in humans (Ito et al., 2011; Uchida et al., 2011). To evaluate the impact of P-gp on drug CNS penetration in monkeys, the effect of a P-gp inhibitor (zosuquidar) was also tested in vivo. For this purpose, (2R)-anti-5-{3-[4-(10,11-dichloromethanodibenzo-suber-5-yl)piperazin-1-yl]-2-hydroxy-propoxy}quinolone trihydrochloride, cyclosporine A, tariquidar, elacridar, and valspodar were previously used in the positron emission tomography studies (Kurdziel et al., 2003; Lee et al., 2006; Zoghbi et al., 2008; Eyal et al., 2009; Tournier et al., 2017) in which the observation time period was relatively short (at most 4 hours after administration). Dosing schedule of zosuquidar was established in this study to achieve potent P-gp inhibition over 24 hours. Finally, the lumbar CCSF values obtained in the present study were compared with CISF and cisternal CCSF values that we previously determined (Nagaya et al., 2014) to gain an insight into the regional differences of drug concentrations in the CNS. This is the first study to systematically evaluate the penetration of various P-gp substrates into lumbar CSF in nonhuman primates and the suitability of using lumbar CCSF as a surrogate of Cu,brain.
Materials and Methods
Chemicals.
Antipyrine, carbamazepine, propranolol hydrochloride, quinidine hydrochloride, and verapamil hydrochloride were purchased from Sigma Aldrich (St. Louis, MO). Desloratadine and ondansetron hydrochloride dehydrate were obtained from LKT Laboratories (St Paul, MN) and Tokyo Chemical Industry (Tokyo, Japan), respectively. Risperidone and paliperidone were purchased from AK scientific (Union City, CA), and zosuquidar hydrochloride was from Cayman Chemical (Ann Arbor, MI). A proprietary compound, E2074 (Nagaya et al., 2013), synthesized in Tsukuba Research Laboratories, Eisai Co., Ltd. (Ibaraki, Japan) was used. All other reagents and solvents were of analytical grade and commercially available.
Animal Experiments.
All experimental protocols and procedures were approved by the Institutional Animal Care and Use Committee of Eisai, and animal experiments were performed in Eisai Tsukuba Research Laboratories (Ibaraki, Japan), which was accredited by Japan Health Sciences Foundation (Tokyo, Japan). All efforts were made to minimize suffering. Six male cynomolgus monkeys (4–6 years old, 3–5 kg) were used in this study. The in vivo study consisted of two parts. In part 1, single intravenous bolus dose of E2074 (1 mg/kg), carbamazepine (3 mg/kg), lamotrigine (3 mg/kg), ondansetron (3 mg/kg), verapamil (3 mg/kg), desloratadine (3 mg/kg), quinidine (5 mg/kg), or risperidone (0.5 mg/kg) was given to monkeys (n = 3) via the saphenous vein to measure the drug concentrations in plasma and lumbar CSF up to 24 hours postdose. To see interday variabilities in the monkey PK, antipyrine (1 mg/kg) was intravenously administered to monkeys concomitantly with each of the test compounds. No considerable interday variabilities were observed in the PK of antipyrine. Paliperidone (an active metabolite of risperidone) was not directly administered to monkeys but was quantified in plasma and lumbar CSF after risperidone administration. The same animals were repeatedly used with at least 3-week washout period between doses in part 1, allowing the animals to fully recover from lumbar puncture and CSF loss. In part 2, the effect of a P-gp inhibitor (zosuquidar) on the CNS penetration of test compounds was examined in monkeys. An intravenous bolus dose of zosuquidar (10 mg/kg) or vehicle (DMSO/5% glucose, 5/95, v/v) was given to monkeys (n = 3) via the saphenous vein. Ten minutes later, a cocktail of four test compounds (antipyrine, ondansetron, desloratadine, and quinidine) was intravenously given to the animals as a single dose via the saphenous vein with the same dose levels as used in part 1. At 8 hours after the first zosuquidar administration, zosuquidar (10 mg/kg) was intravenously administered again to maintain the inhibitory effect on P-gp for 24 hours. The same animals were used for zosuquidar and vehicle treatments in part 2, and 1-month washout period was allocated between doses.
In parts 1 and 2, blood (0.5 ml per sampling point) was collected via cephalic vein, and CSF (0.1 ml per sampling point) was collected by lumbar puncture at 2, 6, and 24 hours postdose of the test compounds. For lumbar CSF collection, animals were anesthetized with intramuscular administration of ketamine (5 mg/kg) and xylazine (1 mg/kg) immediately before each time point, and the lumbar puncture site was swabbed with povidone-iodine–containing disinfectant. Lumbar CSF was collected at the L3 to L6 intervertebral space in a flexed position, and then the site was swabbed again with the disinfectant. The blood samples were centrifuged to prepare plasma. The plasma and CSF samples were stored below −20°C until analysis.
In Vitro Transcellular Transport Study Using P-gp–Expressing and Control Cell Monolayers.
The inhibitory effect of zosuquidar on P-gp–mediated transcellular transport of desloratadine and quinidine was evaluated using human P-gp–expressing LLC-PK1 and control LLC-PK1 cells (Corning Inc., Corning, NY). The cells were seeded at 6 × 10⁵ cells/cm2 in a cell culture insert (HTS Transwell-24-well permeable support with 0.4-µm pore polyester membrane and 6.5-mm inserts; Corning Inc.) and cultured for 5 days. Then, the medium in the apical and basal sides was replaced with Hanks’ balanced salt solution (HBSS) containing 10 mmol/l HEPES (HBSS/HEPES) and zosuquidar (0–1 μmol/l). After 2-hour preincubation at 37°C, the receiver-side solution was replaced with HBSS/HEPES containing zosuquidar, and the donor-side solution was replaced with HBSS/HEPES containing zosuquidar (0–1 μmol/l) and desloratadine (0.3 μmol/l) or quinidine (0.3 μmol/l). The cells were incubated at 37°C for 2 hours, and a 40-μl aliquot of the receiver-side solution was collected and stored at below −20°C until analysis. The transcellular transport of paliperidone (1 μmol/l) was also evaluated in the same manner, using HBSS/HEPES without zosuquidar.
Analytical Procedure.
In vivo samples (monkey plasma and CSF) were mixed with acetonitrile containing an internal standard (10 nmol/l propranolol) followed by centrifugation. The samples from in vitro P-gp transcellular transport study were mixed with methanol containing the internal standard and centrifuged. The resulting supernatant was filtrated, and an aliquot of the filtrate was subjected to high-performance liquid chromatography with tandem mass spectrometry analysis. Chromatography was performed using an ACQUITY UPLC CSH C18 column (1.7 μm, 2.1 mm i.d. × 50 mm; Waters, Milford, MA) at a flow rate of 0.3 ml/min. Distilled water containing 0.02% or 0.1% formic acid (solvent A) and acetonitrile containing 0.02% or 0.1% formic acid (solvent B) were used as the mobile phases. The initial mobile phase was 100% solvent A, and the percentage of solvent B was linearly increased to 50% or 80% over 3 minutes. The column was equilibrated with the initial mobile phase before each injection. A Xevo TQ-S or Xevo TQ-XS mass spectrometer (Waters) was used for detection. Analytes were ionized by electrospray ionization in positive ion mode, and the selected ion-monitoring transitions were: 189.0 > 76.7 for antipyrine, 237.3 > 193.6 for carbamazepine, 256.0 > 210.5 for lamotrigine, 294.1 > 169.8 for ondansetron, 407.3 > 172.0 for E2074, 411.2 > 190.7 for risperidone, 427.4 > 207.4 for paliperidone, 455.2 > 164.8 for verapamil, 311.2 > 259.2 for desloratadine, 325.2 > 160.2 for quinidine, 260.1 > 115.9 for propranolol, and 528.5 > 241.1 for zosuquidar.
Parameter Calculations.
Unbound drug concentration in plasma (Cu,plasma) was calculated by multiplying total plasma concentration (Cplasma) by unbound fraction in plasma (fu,plasma). The fu,plasma values of antipyrine (1.00), carbamazepine (0.366), lamotrigine (0.536), ondansetron (0.551), E2074 (0.676), paliperidone (0.308), risperidone (0.163), verapamil (0.328), desloratadine (0.142), and quinidine (0.156) were previously determined by an equilibrium dialysis method in blank plasma freshly prepared from cynomolgus monkeys (Nagaya et al., 2014). The fu,plasma of zosuquidar (0.00356) was also determined in the freshly prepared monkey plasma by the equilibrium dialysis (RED device, 8K MWCO; Thermo Fisher Scientific, Waltham, MA) by a dilution method according to the previous study (Riccardi et al., 2015). In the present study, the lumbar CSF-to-unbound plasma AUC ratio (Kp,uu,lumbar CSF) was calculated as an index for drug CNS penetration by the following equation: The AUC of test compounds was calculated by a linear trapezoidal method from 2 to 24 hours postdose for plasma (AUCplasma(2–24 h)) and CSF (AUCCSF(2–24 h)) using Excel 2016. Protein binding of the test compounds except for paliperidone was previously measured in the monkey CSF (Nagaya et al., 2014) and was found to be negligible (0%–13%); therefore, observed CSF concentrations were directly used for calculating AUCCSF(2–24 h) in this study. When the drug concentration in a sample obtained at 24 hours postdose was below quantification limit, zero was used to calculate the AUC.
In the in vitro transcellular transport study, the efflux ratio (ER) was calculated from the ratio of the apparent permeability (Papp) in basal-to-apical direction (Papp,B-A) to that in apical-to-basal direction (Paap,A-B) in the P-gp–expressing cells (ERP-gp) and control cells (ERCtrl). The corrected efflux ratio (CER) was defined as follows:
In the in vitro P-gp inhibition study, ERP-gp and ERCtrl were calculated for desloratadine and quinidine. The percentage of control values for P-gp–mediated transcellular transport of desloratadine and quinidine in the presence of zosuquidar were calculated from the ER values according to the following equation: in which ERP-gp,ZOS(+) and ERCtrl,ZOS(+) represent ERP-gp and ERCtrl determined in the presence of zosuquidar (0–1 μmol/l), respectively. ERP-gp,ZOS(−) and ERCtrl,ZOS(−) represent ERP-gp and ERCtrl determined in the absence of zosuquidar, respectively. According to the following equation, the IC50 value of zosuquidar was calculated from the relationship between zosuquidar concentrations ([I]) and the % of control by the nonlinear regression least-squares method using GraphPad Prism (ver. 8.0).
 The maximum % of control value in the absence of zosuquidar (Top) was set as a free parameter and estimated.
Statistics.
Data are expressed as mean or mean ± S.D. Pearson correlation coefficient (r) was computed to analyze the relationship between in vitro P-gp CER values and in vivo Kp,uu,lumbar CSF values. Paired t test was performed to identify significant difference in CCSF/Cu,plasma at 24 hours with and without zosuquidar (Supplemental Table 2B), and the differences were considered significant when P < 0.05. Statistical analysis was performed using GraphPad Prism Ver 8.0 (GraphPad Software, SanDiego, CA).
Results
Penetration of Test Compounds into Lumbar CSF.
Based on their CERs, we classified the test compounds as nonsubstrates (CER < 2; antipyrine, carbamazepine, and lamotrigine), weak substrates (CER, 2 to 3; ondansetron and E2074), or good substrates of P-gp (CER > 3; paliperidone, risperidone, verapamil, desloratadine, and quinidine) according to our previous study (Nagaya et al., 2014). The CERs of nine of the test compounds were taken from that previous study, and that for paliperidone was determined in the present study under assay conditions identical to those used previously.
For all of the compounds, Cplasma and lumbar CCSF decreased in parallel throughout the observation period, except for desloratadine, for which lumbar CCSF increased from 2 to 6 hours after administration (Fig. 1). For the nonsubstrates and weak substrates of P-gp throughout the observation period, the lumbar CCSF was comparable with the Cu,plasma (Kp,uu,lumbar CSF, 0.885–1.34; Table 1), whereas for the good substrates, the lumbar CCSF was lower than the Cu,plasma (Kp,uu,lumbar CSF, 0.195–0.458). All test compounds were well tolerated by the monkeys under the study conditions, although drowsiness was observed in all three animals treated with risperidone but was fully resolved by 24 hours postdose.

Total plasma (black solid lines with closed circles), unbound plasma (gray solid line with closed circles), and lumbar CSF (dotted line with open circles) concentration-time profiles of antipyrine (1 mg/kg), carbamazepine (3 mg/kg), lamotrigine (3 mg/kg), ondansetron (3 mg/kg), E2074 (1 mg/kg), paliperidone, risperidone (0.5 mg/kg), verapamil (3 mg/kg), desloratadine (3 mg/kg), and quinidine (5 mg/kg) after single intravenous administration in cynomolgus monkey. Paliperidone, an active metabolite of risperidone, was quantified after risperidone dosing. Blood and lumbar CSF were serially collected at 2, 6, and 24 hours postdose. Each point represents the mean ± S.D. of three animals, except for lumbar CSF concentration of risperidone at 24 hours (n = 1, below quantification limit in the other two animals). Since antipyrine was administered concomitantly with each of the test compounds, representative data are presented.
Kp,uu values of test compounds in cynomolgus monkeys
The Kp,uu,lumbar CSF values were compared with Kp,uu,cisternal CSF and Kp,uu,ISF values that were previously determined.
Figure 2 shows the in vivo Kp,uu,lumbar CSF values of the test compounds plotted against their in vitro P-gp CER values. A strong negative correlation (R2 = 0.762) was observed, in which a higher in vitro P-gp CER was associated with a lower in vivo Kp,uu,lumbar CSF.

Relationship between in vitro human P-gp CER and the Kp,uu,lumbar CSF in cynomolgus monkey. Kp,uu,lumbar CSF is presented as the mean ± S.D. of three animals. The CER values (mean of triplicate or quadruplicate determinations) of test compounds except for paliperidone were obtained from our previous study (Nagaya et al., 2014), and that of paliperidone (1 μmol/l) was determined in the present study as described under Materials and Methods. The test compounds were classified into nonsubstrates (CER < 2; open circles), weak substrates (CER, 2 to 3; gray circles), or good substrates of P-gp (CER > 3; closed circles) according to the previous study (Nagaya et al., 2014). 1, antipyrine; 2, carbamazepine; 3, lamotrigine; 4, ondansetron; 5, E2074; 6, risperidone; 7, verapamil; 8, paliperidone; 9, desloratadine; 10, quinidine.
Effect of a P-gp Inhibitor on the Penetration of P-gp Substrates into the Lumbar CSF.
A cocktail of antipyrine (nonsubstrate), ondansetron (weak substrate), desloratadine (good substrate), and quinidine (good substrate) was intravenously administered to monkeys in the presence or absence of concomitant treatment with the P-gp inhibitor zosuquidar. The animals received two intravenous bolus doses of zosuquidar (both 10 mg/kg), with the first given 10 minutes before the administration of the test compound cocktail and the second given 8 hours later. In the zosuquidar treatment phase, convulsion was observed in one of the three animals shortly after administration of the test compound cocktail, and blood and lumbar CSF could not be collected at 2 hours postdose from that animal. Thereafter, convulsion disappeared, and blood and CSF sampling (at 6 and 24 hours postdose) and the second administration of zosuquidar were performed as scheduled for that animal without recurrence of convulsion.
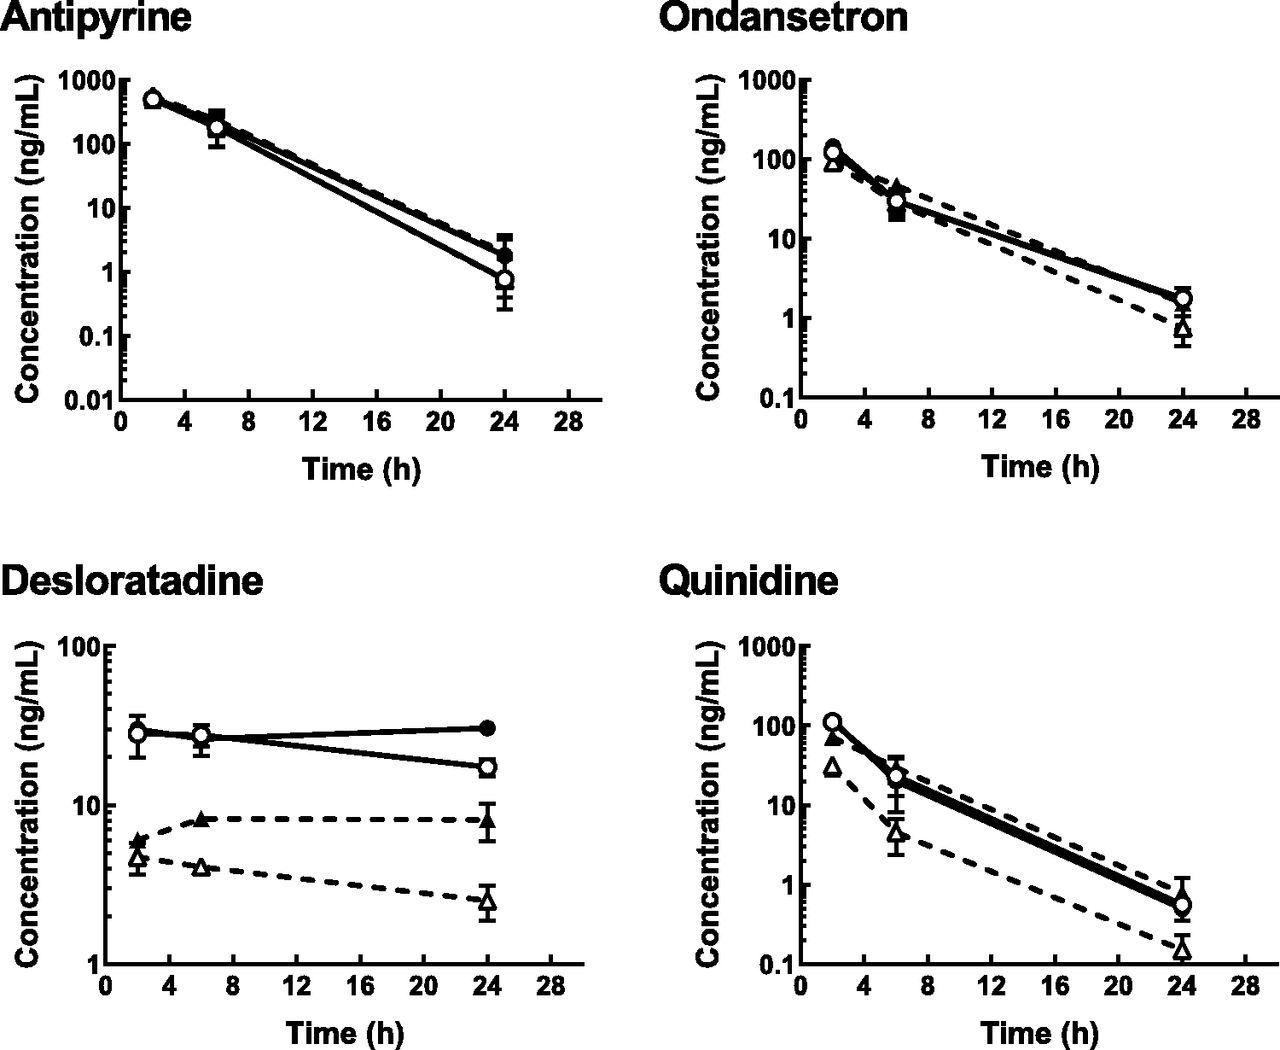
Zosuquidar had no effect on the Cu,plasma of antipyrine, ondansetron, and quinidine, whereas it delayed the elimination of desloratadine from the systemic circulation (Fig. 3). The Cplasma (and Cu,plasma) of desloratadine at 24 hours postdose with zosuquidar treatment was 1.8 times that without. Zosuquidar had no effect on the lumbar CCSF of antipyrine but slightly increased the lumbar CCSF of ondansetron, with the Kp,uu,lumbar CSF increasing from 0.861 to 1.08 (Table 2). For desloratadine, zosuquidar increased the lumbar CCSF and delayed the time to maximum concentration from 2 to 6 hours postdose, resulting in an increase in Kp,uu,lumbar CSF from 0.151 to 0.250. For quinidine, the time profile of lumbar CCSF completely matched that of Cu,plasma in the presence of zosuquidar, and the Kp,uu,lumbar CSF increased from 0.239 to 0.987. Thus, the effect of zosuquidar on lumbar CCSF was more evident for desloratadine and quinidine than it was for antipyrine and ondansetron.

Unbound plasma (solid line with circles) and CSF (dotted line with triangles) concentration-time profiles of antipyrine, ondansetron, desloratadine, and quinidine in cynomolgus monkeys in the absence (open symbols) or presence (closed symbols) of concomitant intravenous administration of zosuquidar at 10 mg/kg. Zosuquiar and a cocktail of the test compounds were intravenously given to cynomolgus monkeys as described under Materials and Methods. Each point represents the mean ± S.D. of three animals, except for the following: plasma and CSF concentration of all test compounds at 2 hours postdose in the presence of zosuquidar (mean of two animals because of convulsion observed in one of the three animals) and plasma concentration of antipyrine at 24 hours postdose in the absence of zosuquidar (mean of two animals because of below-quantification limit in one of the three animals).
Kp,uu,lumbar CSF values of test compounds in the presence or absence of concomitant treatment with zosuquidar in cynomolgus monkeys
The Cplasma, Cu,plasma, and CCSF of zosuquidar were also measured in cynomolgus monkeys administered the test compound cocktail (Fig. 4). The Cu,plasma of zosuquidar was 3.12, 0.954, and 0.218 ng/ml at 2, 6, and 24 hours postdose of the test compound cocktail. The corresponding lumbar CCSF of zosuquidar was 0.414, 0.376, and 0.230 ng/ml, respectively.

Total plasma (closed circles), unbound plasma (gray circles), and CSF (open circles) concentration-time profiles of zosuquidar in cynomolgus monkey. The animal received two intravenous bolus doses of zosuquidar (both 10 mg/kg): immediately (10 minutes) before dosing the test compound cocktail and at 8 hours later (indicated by arrows). Each point represents the mean ± S.D. of three animals, except for 2 hours postdose (mean of two animals because of convulsion observed in one of the three animals). The dashed and dotted lines show the simulated Cplasma and Cu,plasma of zosuquidar, respectively, based on the two-compartment model analysis (Supplemental Fig. 1).
Inhibition of P-gp by Zosuquidar In Vitro.
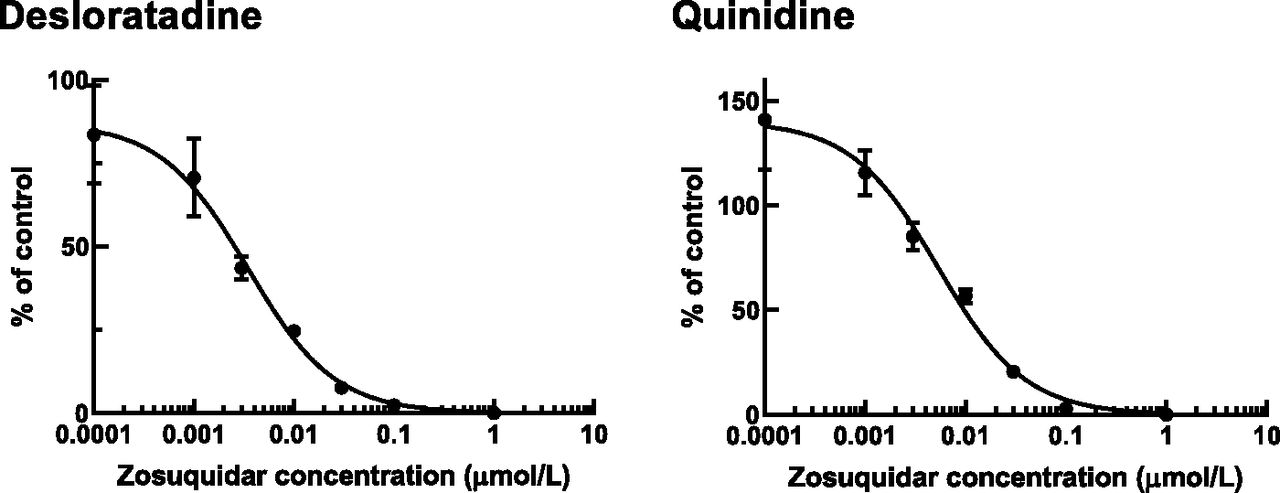
The inhibitory effect of zosuquidar on human P-gp–mediated transport of desloratadine and quinidine was examined in vitro by using human P-gp–expressing cells (Fig. 5; Supplemental Table 1). The IC50 values (parameter estimate ± parameter S.D.) of zosuquidar for P-gp–mediated transport of quinidine and desloratadine transport were 5.38 ± 0.67 and 3.46 ± 0.35 nmol/l (corresponding to 2.84 and 1.82 ng/ml), respectively.

Inhibitory effect of zosuquidar (0–1 μmol/l) on human P-gp–mediated transport of desloratadine (0.3 μmol/l) and quinidine (0.3 μmol/l). The data are shown as the percent of control as described in Materials and Methods. Each point represents the mean ± S.D. of triplicate samples.
Comparison of Kp,uu,lumbar CSF with Kp,uu,cisternal CSF and Kp,uu,ISF Values.
We compared the Kp,uu,lumbar CSF values of the test compounds obtained in the present study with the cisternal CSF-to-unbound plasma concentration ratio (Kp,uu,cisternal CSF) and ISF-to-unbound plasma concentration ratio (Kp,uu,ISF) reported previously (Fig. 6; Table 1). (Fig. 6; Table 1). The Kp,uu,lumbar CSF values of the nonsubstrates (antipyrine, carbamazepine, and lamotrigine) were quite similar to the previous Kp,uu,cisternal CSF and Kp,uu,ISF values. The Kp,uu,lumbar CSF values of the weak P-gp substrates (ondansetron and E2074) were slightly greater than the previous Kp,uu,cisternal CSF and Kp,uu,ISF values but by less than a factor of 3. The Kp,uu,lumbar CSF values of the good P-gp substrates (paliperidone, risperidone, verapamil, desloratadine, and quinidine) were more than triple the previous Kp,uu,cisternal CSF and Kp,uu,ISF values. The Kp,uu,lumbar CSF:Kp,uu,cisternal CSF ratio of paliperidone was 4.6, and that of risperidone was 3.4. The Kp,uu,lumbar CSF:Kp,uu,ISF of all of the good substrates examined was 3.2–5.1.

Comparison of Kp,uu,lumbar CSF of test compounds with the Kp,uu,ISF (A) and Kp,uu,cisternal CSF (B) in cynomolgus monkey. The Kp,uu,ISF and Kp,uu,cisternal CSF values are presented as the mean ± S.D. of three to five animals. The solid line passing through the origin represents the line of unity ± 3-fold (dashed lines). According to the previous report (Nagaya et al., 2014), the test compounds are classified into nonsubstrates (open circles: 1, antipyrine; 2, carbamazepine; 3, lamotrigine), weak substrates (gray circles: 4, ondansetron; 5, E2074), or good substrates of P-gp (closed circles: 6, risperidone; 7, verapamil; 8, paliperidone; 9, desloratadine; 10, quinidine) based on the in vitro CER values.
Discussion
Lumbar puncture is a widely used means of collecting CSF to obtain an estimate of Cu,brain of drugs in nonhuman primates and humans; however, the predictability of Cu,brain by lumbar CCSF has not been systematically evaluated, particularly for P-gp substrates. In the present study, penetration into the lumbar CSF of 10 compounds with high passive diffusion membrane permeabilities and varying P-gp transport activities was examined in cynomolgus monkeys. Since sampling of the cisternal CSF could affect the downstream spinal CSF flow, only lumbar CSF was sampled in the present study, and the data obtained were compared with CISF and cisternal CCSF data we reported previously (Nagaya et al., 2014).
After intravenous administration of a single dose, the lumbar CCSF quickly reached a pseudosteady state for all the test compounds except for desloratadine (Fig. 1). The lumbar CCSF to Cu,plasma ratio at a given sampling time point provides a reliable estimate of Kp,uu,lumbar CSF (Supplemental Table 2), which would be useful to mitigate the stress of repeated lumbar punctures in animals by avoiding the need for sampling at multiple time points. The strong brain tissue binding of desloratadine, as compared with other test drugs (Nagaya et al., 2014), likely accounts for the slower distribution of desloratadine into lumbar CSF. Furthermore, the Kp,uu,lumbar CSF decreased with increasing P-gp activity, allowing discrimination of good P-gp substrates (paliperidone, risperidone, verapamil, desloratadine, and quinidine) from the nonsubstrates (antipyrine, carbamazepine, and lamotrigine) and weak substrates (ondansetron and E2074) of P-gp (Fig. 2), which is consistent with our previous observations for Kp,uu,ISF and Kp,uu,cisternal CSF (Nagaya et al., 2016).
We then examined the effect of zosuquidar, a P-gp inhibitor, on the Kp,uu,lumbar CSF using a cocktail of antipyrine, ondansetron, desloratadine, and quinidine to confirm that the Kp,uu,lumbar CSF is indeed related to the P-gp activity. The reported plasma concentration threshold to increase the brain-to-plasma total drug concentration ratio of P-gp substrates is 0.3–0.4 µg/ml in rats (Anderson et al., 2006). Based on the single-dose pharmacokinetic profile of zosuquidar in cynomolgus monkey (Supplemental Fig. 1), a 10-mg/kg intravenous bolus dose of zosuquidar was given twice during a 24-hour period. This dosing regimen was projected to achieve a mean zosuquidar plasma concentration of 0.83 μg/ml for 24 hours, which was greater than the plasma concentration threshold in rats. Although the observed Cu,plasma of zosuquidar (0.4–5.9 nmol/l, Fig. 4) over the 24-hour observation period was similar to or lower than the in vitro IC50 values of zosuquidar against P-gp (3.5–5.4 nmol/l) (Fig. 5), the Kp,uu,lumbar CSF values of the P-gp substrates ondansetron, desloratadine, and quinidine were increased by 1.3-, 1.7-, and 4.1-fold, respectively, being close to unity for ondansetron (1.1) and quinidine (0.99) (Supplemental Table 2; Table 2). The absence of change of the Kp,uu,lumbar CSF of antipyrine (nonsubstrate) excluded the possibility of a nonselective effect of zosuquidar on the barrier function. Thus, we contend that the zosuquidar dosing regimen presented in this study adequately inhibited P-gp in the CNS, and that the Kp,uu,lumbar CSF is a useful surrogate index for quantitative assessment of P-gp in the barrier of CNS. It is also noteworthy that the Kp,uu,lumbar CSF value of each test compound after the cocktail dosing (Table 2) was consistent with that determined with antipyrine (Table 1), and antipyrine did not alter the CNS penetration of good P-gp substrates (risperidone and paliperidone) in rats (unpublished data). Therefore, it is unlikely that drug-drug interactions via P-gp occurred in the CNS after the cocktail dosing.
The in vitro P-gp CERs of desloratadine and quinidine were comparable (12 and 13, respectively) (Table 1), resulting in similar Kp,uu,lumbar CSF values (Fig. 2); nevertheless, the degree of the increase of Kp,uu,lumbar CSF by zosuquidar was modest for desloratadine. We confirmed that the IC50 values of zosuquidar against human P-gp–mediated transport of desloratadine (3.5 nmol/l) and quinidine (5.4 nmol/l) were similar in vitro (Fig. 5), thereby excluding the possibility of substrate-dependent inhibition, as reported for other transporters (Nozaki and Izumi, 2020). Given that human and monkey P-gp show 96% amino acid sequence homology and are well correlated with respect to their in vitro transport activities (Takeuchi et al., 2006; Kim et al., 2008), the IC50 values of zosuquidar for P-gp in the monkey are unlikely to show any remarkable substrate dependence. There are two possibilities. In addition to P-gp, other transporter(s) could also mediate the active efflux of desloratadine from the CNS. However, breast cancer resistance protein, a well characterized efflux transporter in the BBB, did not accept desloratadine (CER = 0.81) as a substrate in human breast cancer resistance protein–expressing Madin-Darby canine kidney II cells (CER of 2-amino-1-methyl-6-phenylimidazo(4,5-b)pyridine as a positive control substrate, 14.78). Another possibility is that the lumbar CCSF might not reach the pseudosteady state by 24 hours because of the extremely low unbound fraction in the brain (Nagaya et al., 2014).
During cotreatment with zosuquidar and the test compound cocktail, convulsion occurred in one of the three animals shortly after administration of the cocktail. Since convulsion did not recur after the second dose of zosuquidar in the same animal, this suggests that one or more of the compounds in the test cocktail were the cause of the convulsions. Of the compounds included in the cocktail, quinidine and desloratadine are reported to elicit convulsions in humans (Kerr et al., 1971; Cerminara et al., 2013), and zosuquidar increased the lumbar CCSF of these compounds.
Regional differences in the drug concentrations in the CNS are a potential concern when using lumbar puncture to estimate Cu,brain. Indeed, the AUC of lamivudine in lumbar CSF was 5.5 times that in ventricular CSF in rhesus monkeys (Blaney et al., 1995). Conversely, in children, the CSF penetration of topotecan into the lumbar space was significantly lower than that into the ventricular space (Baker et al., 1996). The reported exposure to thiotepa is equal between the lumbar and ventricular CSF in rhesus monkeys (Strong et al., 1986). To provide more information in this context, we compared the Kp,uu,lumbar CSF values obtained in the present study with the Kp,uu,ISF (Fig. 6A) and Kp,uu,cisternal CSF values (Fig. 6B) determined under steady-state conditions in cynomolgus monkeys in our previous study (Nagaya et al., 2014). The Kp,uu,ISF and Kp,uu,cisternal CSF values of the nonsubstrates and weak substrates of P-gp were within a factor of 3 of the corresponding Kp,uu,lumbar CSF values. Therefore, the lumbar CCSF can be used as a surrogate of CISF for new chemical entities with high passive permeability that are not/only weakly transported by P-gp. In contrast, the Kp,uu,lumbar CSF values of the good substrates were more than triple the corresponding Kp,uu,ISF values. Kp,uu,cisternal CSF originally tended to overestimate Kp,uu,ISF of the good substrates (Nagaya et al., 2014), and collection of CSF from downstream of the flow (lumbar puncture) further increased the gap by 2- to 3-fold (Table 1). Although such regional concentration differences can be a limiting factor in the precise estimation of Cu,brain, the lumbar CCSF allowed discrimination of good P-gp substrates from weak and nonsubstrates (Fig. 2). Taking into consideration the easy accessibility and lower burden to the experimental animals, lumbar CCSF can be used for compound prioritization in the nonclinical stages. When investigators focus on good P-gp substrates, and 3- to 5-fold overestimation given by lumbar CCSF is not acceptable, microdialysis or cisternal CSF sampling will be a better option.
The reason for the increasing cerebral-cisternal-lumbar concentration gradient observed for the good P-gp substrates is unknown. Whether choroid plexus epithelial cells, which show weak P-gp expression but are on the side facing the CSF (Rao et al., 1999), are able to extrude P-gp substrates into the ventricles remains unknown. Lumbar CSF is surrounded by the blood-arachnoid barrier, with P-gp expression demonstrated on the dura side of the membrane in rats and pigs (Yasuda et al., 2013; Uchida et al., 2020). If the expression of P-gp in the blood-arachnoid barrier is not as high as that in the BBB, the penetration of P-gp substrates from the systemic circulation would gradually increase from the ventricles to the spinal subarachnoid space. Further studies are needed to determine the lumbar CCSF and CISF of other P-gp substrates as data for use in a regression analysis to examine the concentration gradient.
In conclusion, this study demonstrated the usefulness of lumbar CCSF as a quantitative surrogate of CISF for nonsubstrate, weak-to-good substrates of P-gp. Lumbar CSF may contain >3-fold higher concentrations of good P-gp substrates than the ISF or cisternal CSF, but it was still possible to discriminate between good P-gp substrates and weak substrates/nonsubstrates. These findings will help lead optimization and drug candidate selection in the nonclinical phase of CNS drug development.
Acknowledgments
We would like to thank Tsugio Nakayama, Kenichi Kikuta, Katsuhiko Otsuka, Norio Fukuda, and Yosuke Nojiri (Sunplanet Co., Ltd, Tsukuba, Japan) for the technical assistance in the in vivo experiments.
Authorship Contributions
Participated in research design: Nagaya, Kusuhara, Nozaki.
Conducted experiments: Nagaya, Katayama.
Performed data analysis: Nagaya, Nozaki.
Wrote or contributed to the writing of the manuscript: Nagaya, Kusuhara, Nozaki.
Footnotes
- Received April 27, 2020.
- Accepted August 3, 2020.
↵1 Y.Na. and Y.No. contributed equally to this work.
This work received no external funding.
↵
 This article has supplemental material available at dmd.aspetjournals.org.

Abbreviations
- AUC
- area under the plasma concentration-time curve
- BBB
- blood-brain barrier
- CCSF
- drug concentration in CSF
- CER
- corrected efflux ratio
- CISF
- drug concentration in ISF
- CNS
- central nervous system
- Cplasma
- total plasma concentration
- CSF
- cerebrospinal fluid
- Cu,brain
- unbound drug concentration in the brain
- Cu,plasma
- unbound drug concentration in plasma
- E2074
- 2-[(2R)-2-Fluoro-3-{(3r)-[(3-fluorobenzyl)oxy]-8-azabicyclo[3.2.1]oct-8-yl}propyl]-4,5-dimethyl-2,4-dihydro-3H-1,2,4-triazol-3-one
- ER
- efflux ratio
- HBSS
- Hanks’ balanced salt solution
- ISF
- interstitial fluid
- Kp,uu,cisternal CSF
- cisternal CSF-to-unbound plasma concentration ratio
- Kp,uu,ISF
- ISF-to-unbound plasma concentration ratio
- Kp,uu,lumbar CSF
- lumbar CSF-to-unbound plasma AUC ratio
- P-gp
- P-glycoprotein
- PK
- pharmacokinetics
- Copyright © 2020 by The American Society for Pharmacology and Experimental Therapeutics


