


Abstract
In vitro to in vivo extrapolation (IVIVE) enables prediction of in vivo clinical outcomes related to drug exposure in various populations from in vitro data. Prudent IVIVE requires scalars specific to the biologic characteristics of the system in each population. This study determined experimentally for the first time scalars in liver samples from patients with varying degrees of cirrhosis. Microsomal and cytosolic fractions were extracted from 13 noncirrhotic and 32 cirrhotic livers (six mild, 13 moderate, and 13 severe, based on Child-Pugh score). Fractional protein content was determined, and cytochrome P450 reductase activity was used to correct for microsomal protein loss. Although the median microsomal protein per gram liver (MPPGL) in mild, moderate, and severe cirrhosis (26.2, 32.4, and 30.8 mg⋅g−1, respectively) seemed lower than control livers (36.6 mg⋅g−1), differences were not statistically significant (Kruskal-Wallis test, P > 0.05). Corresponding values for cytosolic protein per gram liver were 88.2, 67.9, 62.2, and 75.4 (mg⋅g−1) for mild, moderate, and severe cirrhosis and control livers, respectively, with statistically lower values for severe versus controls (Mann-Whitney P = 0.006). Cirrhosis associated with cancer showed lower MPPGL (24.8 mg⋅g−1) than cirrhosis associated with cholestasis (38.3 mg⋅g−1, P = 0.003). Physiologically based pharmacokinetic simulations with disease-specific scalars captured cirrhosis impact on exposure to alfentanil, metoprolol, midazolam, and ethinylestradiol. These experimentally-determined scalars should alleviate the need for indirect scaling using functional liver volume. Scaling factors in cirrhosis might be a reflection of the etiology rather than the disease severity. Hence, bundling various cirrhotic conditions under the same umbrella when predicting hepatic impairment impact should be revisited.
SIGNIFICANCE STATEMENT Cirrhosis-specific scalars required for extrapolation from microsomal or cytosolic in vitro systems to liver tissue are lacking. These scalars can help in predicting drug clearance and selection of dosage regimens for cirrhosis populations. Attempts to consider potential changes have been empirical and ignored the potential impact of the cause of cirrhosis. We obtained experimental values for these scalars for the first time and assessed their impact on predicted exposure to various substrate drugs using physiologically-based pharmacokinetics simulations.
Introduction
Cirrhosis is a histologic endpoint of most chronic liver diseases. It is characterized by pathologic deposition of extracellular matrix, fibrosis, and impairments of liver functions, including metabolic activity. Chronic liver disease can be secondary to different etiologies, such as alcoholic and nonalcoholic fatty livers, chronic biliary disease, viral infections, and other causes. Moreover, most hepatocellular carcinomas arise within chronic liver cirrhosis (Schuppan and Afdhal 2008; Kanda et al., 2019). Liver cirrhosis is commonly classified using the Child-Pugh score, which ranges from A (least severe) to C (most severe), based on synthetic liver function (prothrombin time, albumin, and bilirubin serum levels) and clinical liver function (ascites and encephalopathy scores). This classification gives prognostic information on survival and assessment of disease severity. However, it is not predictive of metabolic capacity for drug hepatic elimination (Pugh et al., 1973; EMA, 2005) and consequently may not be useful in predicting the necessary drug dose changes in patients suffering from hepatic impairment.
Physiologically based pharmacokinetic (PBPK) modeling offers the possibility of model-informed precision dosing (MIPD) in cases in which drug label information is not provided for vulnerable patients (Darwich et al., 2017). To achieve MIPD, PBPK modeling requires information on how systems’ parameters change in these special patient populations along with drug-specific parameters. The prediction of in vivo hepatic clearance from in vitro data using in vitro to in vivo extrapolation (IVIVE) has been reported to considerably improve drug exposure predictions within the PBPK modeling framework (Chen et al., 2012).
Scaling from in vitro enriched subcellular fractions, such as microsomes or the cytosol, is common in IVIVE (Houston, 1994). In most cases, these scaling approaches rely on robust estimates of biologically relevant scaling factors, including protein content of subcellular fractions from the tissue of interest. Microsomal protein per gram liver (MPPGL) for healthy human liver ranges from 32 to 40 mg⋅g−1 and is commonly used for IVIVE of drug metabolism data (Barter et al., 2007). Factors such as age and sex that contribute to differences in MPPGL have been highlighted (Barter et al., 2008). Additional variability in reported values originates from differences in specificities of the markers used for correction for protein loss during the preparation of subcellular fractions and in the design of these studies (Harwood et al., 2014). Cytochrome P450 content and P450 reductase activity are frequently used as markers for microsomal protein loss (Barter et al., 2008). Activities of glutathione-S-transferase or alcohol dehydrogenase can be used to estimate loss in cytosolic protein per gram liver (CPPGL) (Cubitt et al., 2011).
Although scaling factors have been reported in human liver samples obtained from healthy individuals and certain patient populations (Barter et al., 2007; De Bock et al., 2014), data are lacking for liver cirrhosis, particularly with reference to disease severity (Johnson et al., 2010) and the cause of cirrhosis. Previous attempts to incorporate fractional protein content in severe cirrhosis compared with healthy livers did not consider any estimate of protein recovery and reported the values in milligrams of microsomal protein while assuming these recoveries to be similar between cirrhotic and noncirrhotic tissue (Wang et al., 2016; Prasad et al., 2018).
The current practice of scaling in vitro data for prediction of hepatic clearance in cirrhosis populations is based on functional liver mass (Edginton and Willmann, 2008; Johnson et al., 2010; Prasad et al., 2018). This empirical parameter is derived using a radioligand that binds to a surface antigen on viable cells (Miki et al., 2001) along with some computed tomography image processing (Matsui et al., 1996). It assumes that viable cells in diseased livers retain similar microsomal and cytosolic protein yields as viable healthy hepatocytes (intact cell theory), which has not been confirmed (Morgan and McLean, 1995). Moreover, this assumption does not account for changes in overall liver weight in cirrhosis relative to healthy liver (Supplemental Table 1). At its best, this approach can be considered as an indirect way of estimating scaling factors, with no differentiations for various subcategories of cirrhosis.
Therefore, there is an urgent need for determining cirrhosis-specific MPPGL and CPPGL values that can serve as a biologic mean for PBPK-based extrapolation from normal to diseased liver function, thereby enabling model-informed dose adjustments for the cirrhosis population. To our knowledge, this is the first report to provide such experimental data, which will facilitate accurate prediction of clearance and help in MIPD in cirrhosis populations. It also provides preliminary links between these scalars and disease severity as well as causes/associated diseases with cirrhosis. Applicability of the generated data are demonstrated in PBPK simulations using different probe drugs.
Materials and Methods
Liver Samples and Donor Characteristics.
Liver samples, obtained from explanted livers from patients with cirrhosis undergoing liver transplantation or liver resection, were provided by Cambridge University Hospitals tissue bank, Cambridge, UK [cirrhotic (n = 32)]. Histologically noncirrhotic/normal control liver tissues were obtained from tissue adjacent to metastatic tumors after surgical liver resection (n = 13). Anonymized demographic and clinical data are provided in Supplemental Tables 2 and 3. This study is covered by ethical Health Research Authority and Health and Care Research Wales approval (Research Ethics Committees reference 18/LO/1969).
The samples were categorized for severity of cirrhosis according to the Child-Pugh system using clinical data extracted from the records related to each donor into Child-Pugh A for mild severity (CP-A, n = 6), Child-Pugh B for moderate severity (CP-B, n = 13), Child-Pugh C for severe stage (CP-C, n = 13) (see Supplemental Table 3 for details). The power of the study (80%) had been estimated based on sample size of ≥10 per each group to detect at least a 12 mg⋅g−1 difference in scalar values (confidence level 95%). The above difference was deemed to be of adequate clinical significance. Post hoc analysis of data (see Results section) indicated that the differences in many cases were lower than the level that we could statistically detect with the current sample size.
The number of cirrhosis liver samples was higher than the control, allowing assessment of the hypothesis regarding the possible effect of the etiology of the disease or coexisting liver conditions on the scalars. Using patient diagnosis data, the samples were further classified into the following groups: cirrhosis associated with cancer, biliary or cholestatic liver disease, and alcoholic and nonalcoholic fatty liver disease (NAFLD).
Preparation of Microsomal and Cytosolic Fractions.
Microsomal fractions were isolated from control and cirrhotic liver samples using differential centrifugation (Graham, 2002) (Fig. 1). Homogenization of the liver tissue (50–380 mg) was performed on ice using a mechanical homogenizer (CamLab, Cambridge, UK) in potassium phosphate buffer (0.25 M, pH 7.25, and 1.15% KCl) at 10 ml buffer per gram of liver tissue. The homogenate was centrifuged with an Optima L-100 ultracentrifuge (Beckman Coulter, Inc., Fullerton, CA) at 10,000g for 20 minutes at 4°C, and the supernatant (S9 fraction) was retained and centrifuged at 100,000g for 75 minutes at 4°C. The supernatant (cytosol) was retained, and the microsomal pellet was suspended at 1 ml of storage buffer (0.25 M potassium phosphate, pH 7.25) per gram of liver tissue. Homogenate, cytosol, and microsomal fractions from each sample were stored at −80°C.

Preparation of subcellular fractions from liver tissue samples. Microsomal protein loss is estimated by cytochrome P450 reductase activity to correct MPPGL. CPPGL and HomPPGL are the uncorrected cytosol and homogenate protein contents per gram of liver, respectively.
Determination of the Total Protein Content.
Protein content in all fractions was determined using bicinchoninic acid assay (Pierce Microplate BCA Protein Assay Kit – Reducing Agent Compatible). Each sample fraction was assessed in triplicate, and the mean of the three readings was calculated. The protein concentrations of each fraction were used to determine the amount of protein per gram liver, as described below.
NADPH Cytochrome P450 Reductase Activity.
MPPGL was corrected for loss due to centrifugation based on cytochrome P450 reductase activity, a marker of microsomal membrane. The choice of the activity assay compatible with bilirubin was necessary because a subset of the samples were from patients with biliary disease. Bilirubin shows absorption at 453 nm (Vreman et al., 2019), which interferes with the absorbance results of the dithionite difference method obtained at 450 nm (De Bock et al., 2014). The NADPH cytochrome P450 reductase method relies on measurement of absorbance at a different wavelength (550 nm) and was therefore preferred (Omura and Sato, 1964; Matsubara et al., 1976), and it was used as previously described (Guengerich et al., 2009; Achour et al., 2011). Briefly, microsomal or homogenate fraction from 1 mg of tissue was mixed in a 1.5-ml cuvette with 80 µl of 0.5 mM oxidized equine cytochrome c (Sigma-Aldrich, Poole, UK), 900 μl of potassium phosphate buffer, and 10 μl of 1 mM potassium cyanide. Baseline absorbance was measured at 550 nm using the kinetic mode of a Jenway 7315 UV-Visible spectrophotometer (Camlab Ltd.) every 20 seconds for 2 minutes. The reaction was started by adding 10 μl of 10 mM NADPH, and the absorbance (A) was measured every 20 seconds for 3 minutes. The activity of NADPH-P450 reductase, represented in units per milliliter of the fraction (homogenate or microsome), was determined by calculating the slope of the linear phase of the curve after the addition of NADPH and applying the following equation: (1)where 1 U will reduce 1 μmol of oxidized cytochrome c in the presence of 100 μM NADPH per minute at pH 7.8 at 25°C; ΔA550/min = the rate of change in the absorbance at 550 nm = Δ Asample − Δ Ablank; dil is the dilution factor of the original enzyme sample; Enzvol is the volume of the sample equivalent to 1 mg of tissue (milliliter), and 21.1 is the extinction coefficient (εmM) for reduced cytochrome c.
The ratio of the microsomal slope to the homogenate slope per gram of tissue indicates the fraction of recovered microsomal protein and is used to correct MPPGL values for each individual liver sample (eq. 2; Fig. 1) (Barter et al., 2008). (2)The ratio of the slopes of the microsomes and the homogenate per 1 mg total protein was used to calculate enrichment in the microsomal fraction.
Assessing the Effect of Disease Severity and Etiology or Underlying Liver Conditions with Cirrhosis.
The median values of the scalars (MPPGL, CPPGL, and homogenate protein content per gram of liver/HomPPGL) from six mild, 13 moderate, and 13 severe cirrhosis samples were compared with the control set (n = 13). Further, the cirrhotic samples were stratified according to coexisting liver diseases into four different groups: NAFLD (n = 8), hepatocellular carcinoma (n = 9), alcoholic liver injury (n = 2), and biliary disease or cholestasis (n = 13). The MPPGL and CPPGL values in these different groups were compared against one another and to normal controls.
Statistical Data Analysis.
Statistical analysis of the data was carried out, and graphs were created using GraphPad Prism version 7.0 (La Jolla, CA). Shapiro-Wilk normality test was applied to assess normality of the distribution of the data. Data sets with P values >0.05 were considered to be normally distributed.
For reporting NADPH-P450 reductase activities, mean ± S.D. was used, as normal distribution was confirmed in all groups. For all other data, in the absence of normal distribution, nonparametric statistics were used, and results were presented as median and 95% confidence interval (CI). Equality of variance was assessed by a modified Levene’s test (Brown-Forsythe test) at a 0.05 significance level.
The differences in median values of MPPGL and CPPGL between the control group and the three levels of disease severity (mild, moderate, and severe) were assessed using Kruskal-Wallis ANOVA test with the statistical significance level set at 0.05. If this test indicated statistically significant differences, a post hoc Mann-Whitney test was performed for all pairwise comparisons with statistical significance considered after Bonferroni correction at *P < 0.0085 and **P < 0.0017 (six iterations). Similarly, Kruskal-Wallis test and Mann-Whitney tests with Bonferroni correction were performed to compare the data for the control group and four different underlying disease states. For post hoc analysis in this case, *P < 0.005 and **P < 0.001 were considered statistically significant (10 iterations).
Mann-Whitney test was performed at a 0.05 significance level to compare MPPGL and CPPGL values between male and female donors within either control or disease groups. Correlation with age of the donors was assessed using Spearman correlation test.
PBPK Simulations to Assess the Impact of Scalars for Cirrhotic Liver.
PBPK simulations were performed to assess the impact of the experimentally-determined scalars on drug exposure. Substrates predominantly metabolized by the liver were selected. Three cytochrome P450 substrates with different hepatic extraction ratios (ERs)—namely, alfentanil (low ER), metoprolol (high ER), and midazolam (intermediate ER)—were selected from the compound library in Simcyp Simulator V18 Release 1 (Certara, Sheffield, UK) to compare the impact of three different methods of scaling on their predicted clearance and exposure. No modifications were made to metoprolol and midazolam compound files. However, for alfentanil, the full PBPK distribution model recently described and verified in healthy adults by Abduljalil et al. (2020) was used (see Supplemental Information for more details).
Alfentanil is mainly metabolized by CYP3A4, and midazolam is a substrate of CYP3A4 and UDP-glucuronosyltransferase (UGT) 1A4, whereas metoprolol is mainly metabolized by CYP3A4/2D6. All these enzymes are microsomal.
Firstly, the model was validated in a healthy population and then extrapolated to cirrhosis populations using three different methods of scaling (Fig. 2).
Method 1 [cirrhosis-specific scalar, no liver size adjustment (CS)] uses cirrhosis-specific scaling factor values (MPPGL) from the current study and normal liver volume (1.65 l).
Method 2 [cirrhosis-specific scalar + whole liver size adjustment (CS + SA)] uses cirrhosis-specific scaling factor values (MPPGL) from the current study and the average liver volume corresponding to each Child-Pugh grade (1.04-fold of normal liver volume for CP-A, 0.87 of normal liver volume for CP-B, 0.68 of normal liver volume for CP-C) (Ozaki et al., 2016).
Method 3 [empirical functional liver volume + scalars from healthy population (EFLV)] uses eq. 3 below from Barter et al. (2008), which describes the relationship between MPPGL and age (in years) in healthy subjects, and accounts for the change in the functional hepatocyte volume as a reflection of the functional reserve of the liver (1.469 l for CP-A, 1.17 l for CP-B, and 0.94 l for CP-C). These functional hepatocyte volumes are implemented into the simulator according to unpublished meta-analysis of tissue imaging literature data (Lin et al., 1998; Zhu et al., 1999; Li et al., 2003; Shan et al., 2005; Reddy et al., 2018).
 (3)where C0 = 1.407, C1 = 0.0158, C2 = −0.00038, and C3 = 0.0000024.

A schematic illustration showing the workflow of PBPK simulations for alfentanil, midazolam, metprolol, and ethinylestradiol to validate the simulator’s built-in model and extrapolate to cirrhosis populations using empirical scaling with functional liver volume compared with scaling with cirrhosis-specific scalars from the current study (MPPGL/CPPGL).
For methods 1 and 2, the coefficients of variation (CV) in MPPGL for mild, moderate, and severe cirrhosis populations were calculated from the S.D. and mean for CP-A and CP-B groups in this study; for method 3, the CV was 26.9% (Barter et al., 2008).
To assess the impact of change in the CPPGL on drug exposure, ethinylestradiol was selected from Simcyp compound file library as a substrate of both microsomal enzymes (mainly CYP3A4, 2C9, and 1A2 and UGT1A1) and a cytosolic sulfotransferase 1E1 (SULT1E1) (Zhang et al., 2007). The compound file supplied with the software was altered to allow inclusion of cytosolic elimination (Supplemental Table 6). All hepatic intrinsic clearance other than those for P450s and UGTs was assumed to be cytosolic (by SULT1E1). So, the additional human liver microsomal clearance, obtained by the back-calculation from the intravenous clearance via the well-stirred liver model and reported by Ezuruike et al. (2018), was converted to human liver cytosol intrinsic clearance after the correction with the relative ratio of healthy MPPGL to healthy CPPGL values.
The three cirrhosis scaling methods mentioned above were also applied for ethinylestradiol in addition to using the current study’s median CPPGL and CV values corresponding to each CP group in methods 1 and 2. The mean (CV) CPPGL for a healthy virtual population of 81.03 mg⋅g−1 (21.47%) (Mallick et al., 2020) was applied in the healthy population simulations and in scaling method 3 for the cirrhosis populations.
The demographic, anatomic, and physiologic parameters that were used in the creation of virtual populations (healthy and disease) were based on Simcyp population libraries with no change apart from the scaling parameters illustrated above for the three methods (Supplemental Table 9).
Simulations of virtual or mixed virtual populations were performed with 10 trials. The number of subjects in each trial, age range, and proportion of females were consistent with clinical studies with the drugs from which observed data were derived (Supplemental Table 5). For all models, nonspecific binding in microsomes or hepatocytes from diseased livers were assumed to be similar to healthy livers. In the case of ethinylestradiol, no clinical data were available for the cirrhosis groups; therefore, a trial design of 10 subjects per trial, age range of 21–23 years, and 100% females was used.
The arithmetic mean of plasma concentration–time profile for the 10 trials per simulation was plotted using Microsoft Excel. The average AUC0–t of the 10 simulation trials for each simulation method was calculated for each drug using the linear trapezoidal method. Average AUC∞ was used only for metoprolol to allow comparison with clinical data.
Predictions within the 1.5-fold range of the observed AUC were considered acceptable for both healthy and cirrhosis simulations. The ratios of AUC in the cirrhosis population to the AUC in healthy population (AUCR) was reported for each scaling method. Then, the ratio of predicted AUCR to the observed AUCR (AUCR_pred/AUCR_obs) was calculated to evaluate the ability of the model to capture the disease effect (Fig. 2). Any difference in the predicted cirrhosis AUC values less than 25% between different scaling methods was considered negligible. Doses similar to those used in the corresponding clinical studies were chosen for alfentanil, metoprolol, and midazolam simulations (Supplemental Table 5). Input parameters for each drug are reported in Supplemental Table 6.
Results
In this study, homogenate, microsomal, and cytosol protein concentrations were measured in relevant fractions from healthy livers (n = 13) and in livers with varying degrees of cirrhosis (n = 32) (Supplemental Table 7). The median and range of the uncorrected protein contents per gram tissue for each fraction (microsomes, cytosol, and homogenate) in control and cirrhotic groups were calculated based on measured concentrations, as shown in Supplemental Table 8.
Recovery and Enrichment of Microsomal Fractions.
Cytochrome P450 reductase activity in homogenate and microsomal fractions was measured for each sample (Supplemental Table 4). Data for all groups (control as well as mild, moderate, and severe cirrhosis) showed a normal distribution (P > 0.05 with Shapiro-Wilk normality test). The mean ± S.D. of activity in homogenate fraction for the control group was 3.4 ± 1.13 U⋅mg−1 of tissue, and it decreased in mild and moderate cirrhosis (2.8 ± 0.09, 2.13 ± 0.69 U⋅mg−1 of tissue, respectively). The recovery and enrichment ratios were measured based on P450 reductase activity using the ratio of the slope associated with the microsomal fraction to the slope for the homogenate corresponding to 1 mg of tissue or 1 mg of total protein, respectively, for each individual sample. Recovery ratios ranged from 20% to 90% (mean of 50.8%), whereas the enrichment factor ranged from 1.6- to 9.0-fold (mean ∼3.0-fold).
MPPGL and CPPGL Values for Control and Cirrhosis Samples.
MPPGL values for the control group did not show a normal distribution (Shapiro-Wilk test, P = 0.005). Similarly, CPPGL data for the CP-C group, NAFLD, and cholestasis-associated cirrhosis groups were not normally distributed (P < 0.01). Therefore, nonparametric statistics were applied for all comparisons. Using the Brown-Forsythe test, MPPGL and CPPGL values among all groups with different Child-Pugh scores and causes of disease showed homogeneity of variance (P > 0.05), and accordingly, Kruskal-Wallis and post hoc Mann-Whitney tests were used for comparison between groups.
Although median MPPGL values in all three cirrhosis groups were lower compared with the control group (Fig. 3), these were not statistically significant (Kruskal-Wallis test, P = 0.054).

Protein content per gram of liver for microsomal (A) and cytosolic (B) fractions (MPPGL and CPPGL) for samples from control, mild cirrhosis (Child-Pugh A), moderate cirrhosis (Child-Pugh B), and severe cirrhosis (Child-Pugh C) groups. Horizontal lines represent median values, and error bars represent 95% confidence intervals. The asterisk (*) represents a statistically significant difference in the median of the severe cirrhotic group relative to control determined (Mann-Whitney test, P = 0.006). For cirrhosis groups, different symbols refer to different disease severities, and different colors refer to the primary concomitant liver disease.
Median MPPGL values in the disease sets were 26.2 tissue (95% CI 12.9–42.2 mg⋅g−1), 32.4 (95% CI 24.8–42.4 mg⋅g−1), and 30.8 mg⋅g−1 (95% CI 25.1–38.3 mg⋅g−1) for mild, moderate, and severe cirrhosis, respectively, compared with 36.6 mg⋅g−1 (95% CI 33–49.5 mg⋅g−1) for the control group.
There was an apparent gradual decrease in median CPPGL with increasing disease severity. Kruskal-Wallis ANOVA test showed a significant difference among the four groups (P = 0.008). CPPGL median values were 88.2 (95% CI 61.4–105.5 mg⋅g−1; P = 0.28) and 67.9 mg⋅g−1 (95% CI 58.3–76.9 mg⋅g−1; P = 0.07) in the mild and moderate cirrhosis groups, respectively, compared with 75.4 mg⋅g−1 (95% CI 63.2–89.5 mg⋅g−1) for the control group. The CPPGL median value for the severe cirrhosis group was 62.2 mg⋅g−1 (95% CI 58.1–64.9 mg⋅g−1), which was significantly lower than the control group (P = 0.006*). The CPPGL median values of the three groups of cirrhosis were not significantly different from each other (P > 0.0085).
Effects of Underlying Liver Disease on Scaling Factors.
MPPGL and CPPGL were compared for different groups of samples classified according to the most likely cause of liver cirrhosis and/or coexisting disease conditions related to cirrhosis (Fig. 4). Kruskal-Wallis test showed significant differences in median MPPGL values among all groups (P = 0.001).

Differences in median MPPGL (A) and CPPGL (B) values between groups of cirrhotic livers with different underlying pathologies and associated diseases. Alcoholic SH, cirrhosis with alcoholic steatohepatitis; Cancer, cirrhosis with hepatocellular carcinoma; Cholestasis, cirrhosis with any biliary/cholestatic liver disease; NAFLD, cirrhosis with nonalcoholic fatty liver disease. Horizontal lines represent median values, and error bars represent 95% confidence intervals. * and ** represent statistically significant differences between different groups at P < 0.005; P < 0.0025, respectively.
Cirrhosis groups associated with NAFLD and cancer showed significantly lower median MPPGL values of 27.2 (95% CI 20–36 mg⋅g−1; P value of Mann-Whitney test compared with control = 0.003*) and 24.8 mg⋅g−1 (95% CI 22–32.8 mg⋅g−1; P = 0.0009**), respectively (Fig. 4A), compared with control group median MPPGL at 36.6 mg⋅g−1 (95% CI 33–49.5 mg⋅g−1), whereas MPPGL for cirrhosis with cholestasis and alcoholic liver was comparable to the control groups with median values of 38.3 (95% CI 29.5–42.4 mg⋅g−1; P = 0.96) and 31.3 mg⋅g−1 (95% CI 30.2–32.4 mg⋅g−1; P = 0.08), respectively.
Among cirrhosis groups, only cancer-associated cirrhosis showed statistically significant lower median MPPGL compared with the cholestasis-cirrhosis group (P = 0.003*).
Although Kruskal-Wallis test showed P = 0.009 (<0.05), Mann-Whitney pairwise comparisons with Bonferroni correction showed no significant differences in median CPPGL values among all groups. CPPGL median values for cirrhosis groups associated with cholestasis, NAFLD, alcoholic liver injury, and cancer were 60.7 (95% CI 56.7–68.9 mg⋅g−1; P = 0.01), 66.4 (95% CI 61.7–87.5 mg⋅g−1; P = 0.12), 59.3 (95% CI 58.3–60.2 mg⋅g−1; P = 0.08), and 78.9 mg⋅g−1 (95% CI 66.9–94.4 mg⋅g−1; P = 0.74), respectively (Fig. 4B), compared with the control group at 75.4 mg⋅g−1 (95% CI 63.2–89.5 mg⋅g−1).
Impact of Demographics on Scaling Factors.
Among the 13 histologically normal liver samples, four were from female donors. The age range of all control liver donors was from 36 to 83 years, with a median age of 71 years. For the 32 cirrhosis livers, the median age of donors was 61 years (from 39 to 75 years), and 13 were females (Supplemental Tables 2 and 3).
Nonparametric Spearman correlation between age and MPPGL or CPPGL in both control and diseased groups was weak (Rs = −0.11 and −0.40 for the control group and 0.02 and 0.20 for the diseased group, respectively, P > 0.05). Differences in MPPGL and CPPGL values between males and females were not significant in control or disease groups (Mann-Whitney test, P > 0.05).
Comparison of Scaling in the Current Study with Previous Scaling Methods.
Previous scaling methods (Edginton and Willmann, 2008; Johnson et al., 2010; Prasad et al., 2018) used the difference in functional liver volume because of unavailability of experimental MPPGL values for cirrhosis populations (Supplemental Table 1). For MPPGL-based scaling methods, the ratios of the scalars from the current study relative to control were comparable to corresponding ratios with the functional liver volume, especially for moderate and severe cirrhosis populations (Table 1).
Comparing MPPGL-based scaling factors for mild, moderate, and severe cirrhosis relative to control from the current study with empirical scaling methodology
PBPK Simulations Using the Measured Scaling Factors.
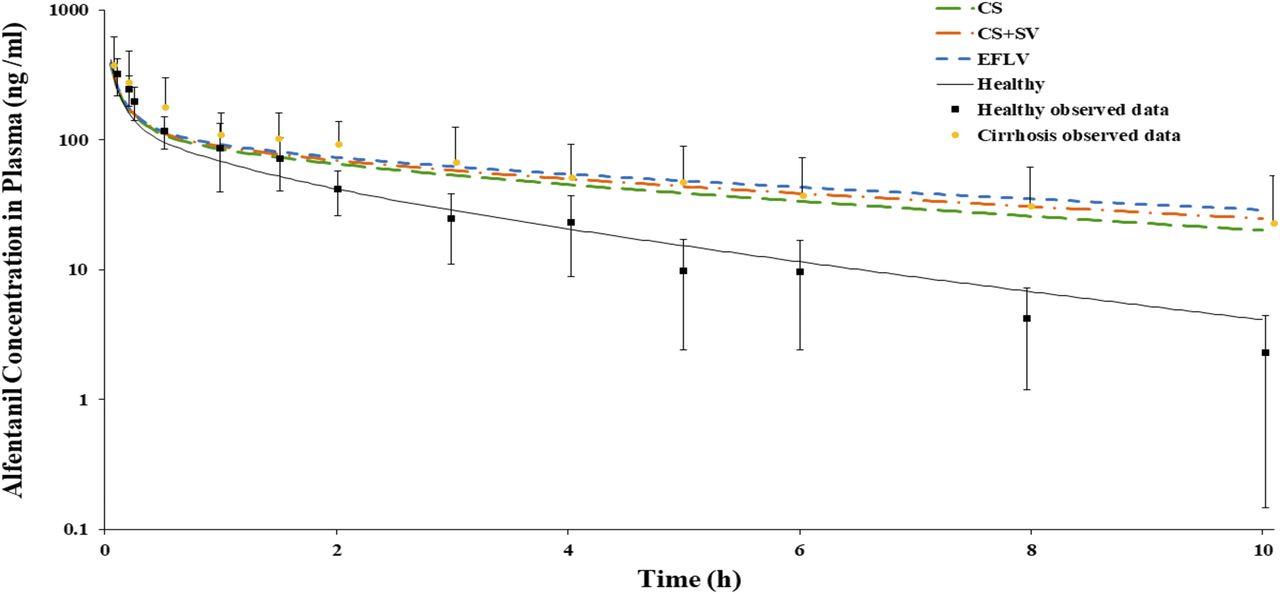
Figure 5 shows alfentanil simulations in a healthy population and in mixed virtual cirrhosis populations (CP-A, one individual; CP-B, seven individuals; CP-C, three individuals). In cirrhosis simulations, the three scaling methods were applied and compared. The three methods showed average AUC0–10 h within 1.5-fold of observed values obtained from a previous study (Ferrier et al., 1985) (Fig. 5; Table 2). The relative difference in AUCR_pred/AUCR_obs ratio among all simulations with the three different scaling methods did not exceed 17% (Table 2).

Alfentanil plasma concentration–time profile after a single bolus dose of 0.05 mg⋅kg−1 i.v. of in healthy (black line) and cirrhosis populations (colored dashed lines) with three different in vitro to in vivo scaling methods (CS, CS + SA, EFLV). Symbols represent observed clinical data from healthy individuals and cirrhosis patients (mixed CP-A, -B, and -C) (Ferrier et al., 1985). Error bars represent the S.D. from the mean observed data.
Measures of alfentanil model predictive performance in healthy and cirrhosis populations using three in vitro to in vivo clearance scaling methods after a single bolus dose of 0.05 mg⋅kg−1 i.v.
A, B, and C refer to a mixed population with different Child-Pugh scores.
For metoprolol, the predicted AUC0–∞ for healthy populations was within 1.5-fold of the corresponding observed value from a previous study (Regårdh et al., 1981). Regårdh et al. (1981) also reported metoprolol pharmacokinetic data for patients with cirrhosis, although there were no specific data in this report on the Child-Pugh score for these individuals with cirrhosis. Therefore, simulations for mild, moderate, and severe cirrhosis were performed separately with the three scaling methods, and each was compared with the clinical data of Regårdh et al. (1981) (Fig. 6). For the mild cirrhosis population only, the AUCR_pred/AUCR_obs ratio was close to unity; the difference in these ratios was less than 8% for the three methods of scaling (Table 3). For moderate and severe populations, the CS method showed modest deviations in relative disease impact factor from CS + SV (9% and 20%, respectively) and EFLV (19% and 25%, respectively) methods. Scaling with the CS + SA method showed comparable predictability to the EFLV method, with differences within 15% in all degrees of the disease severity.

Metoprolol plasma concentration–time profiles after intravenous infusion in healthy (black line) vs. (A) Child-Pugh A, (B) Child-Pugh B, and (C) Child-Pugh C cirrhosis populations (colored dashed lines) with three different in vitro to in vivo scaling methods (CS, CS + SA, EFLV). Symbols represent observed clinical data from healthy individuals and patients with cirrhosis (Regårdh et al., 1981). Error bars represent the S.D. from the mean observed data.
Measures of metoprolol model predictive performance in healthy and cirrhosis populations using three in vitro to in vivo clearance scaling methods after intravenous infusion with 20 mg metoprolol tartarate over 10 min
Good predictive performance of the PBPK model was also noted for midazolam in both healthy and cirrhosis populations (within 1.5-fold of the observed AUC0–24 h values) for intravenous and oral routes of administration (Fig. 7). The clinical data derived from a previous study (Pentikäinen et al., 1989) represented a mixed cirrhosis population consisting of both CP-B (n = 5) and CP-C (n = 2) patients. The differences in AUCR_pred/AUCR_obs among the three methods were within 20% for both intravenous and oral dosing (Table 4).

Intravenous (A) and oral (B) observed and simulated midazolam plasma concentration–time profiles in healthy (black line) and cirrhosis populations (colored dashed lines) with three different in vitro to in vivo scaling methods (CS, CS + SA, EFLV). Symbols represent observed clinical data from healthy individuals and patients with cirrhosis (mixed CP-B and -C) (Pentikäinen et al., 1989). Error bars represent the S.D. from the mean observed data.
Measures of midazolam model predictive performance in healthy and cirrhosis populations using three in vitro to in vivo clearance scaling methods after single intravenous bolus and oral doses
Overall, for MPPGL at high severities of cirrhosis, the CS scaling method showed the highest predicted clearance compared with other scaling methods for all drugs evaluated, whereas EFLV showed the lowest predicted clearance. The CS + SV method was closer to the EFLV scaling method than the CS method in all scenarios. Nevertheless, these differences were effectively negligible (<25%).
For ethinylestradiol, simulations were run with a single oral dose (0.05 mg) in healthy and mild, moderate, and severe cirrhosis populations. In the healthy population, the predicted AUC0–24 was within 1.5-fold of observed values derived from previous study (Back et al., 1979). Predicted AUC0–24 (AUC_pred) was 1.03 ng⋅h/ml (95% CI 1.01–1.06 ng⋅h/ml). AUC_obs in healthy populations was 1.048 ng⋅h/ml (95% CI 0.564–1.53 ng⋅h/ml). Because of the lack of clinical data for single oral ethinylestradiol dosing in cirrhosis populations, only the simulations for the cirrhosis populations were presented in this study (Fig. 8; Table 5). The differences in the predicted AUCR for the CS and CS + SV methods of scaling relative to the EFLV method were 40% and 2% in mild, 8% and 1.4% in moderate, and 12.1% and 12.4% in severe cirrhosis (Fig. 8; Table 5). The exposures predicted by the CS + SA and EFLV methods were comparable, with lower differences than the CS method in all cirrhosis populations (Table 5).

Simulated ethinylestradiol plasma concentration–time profiles after a single 0.05 mg oral dose in healthy (black line) vs. (A) Child-Pugh A, (B) Child-Pugh B, and (C) Child-Pugh C cirrhosis populations (colored dashed lines) with three different in vitro to in vivo scaling methods (CS, CS + SA, EFLV). Black squares represent observed clinical data from healthy individuals (Back et al., 1979). Error bars represent the S.D. from the mean observed data.
Differences in the predicted impact of cirrhosis on ethinylestradiol exposure between three in vitro to in vivo clearance scaling methods after 0.05 mg single oral dose
Discussion
Subcellular fractions are frequently used in in vitro studies to assess the activity or the expression of different hepatic enzymes, followed by IVIVE scaling based on protein content per unit liver mass (MPPGL and CPPGL) (Barter et al., 2007). Cirrhosis is a chronic hepatic disorder characterized by impaired drug and xenobiotic metabolism (Prasad et al., 2018). There are different classification systems for the degree of cirrhosis, with the Child-Pugh being the most widely used for diagnosis as well as clinical pharmacokinetic studies and dose adjustment recommendations (Talal et al., 2017). Information on the effects of hepatic impairment associated with cirrhosis on IVIVE scaling factors is lacking. Therefore, this study aimed to investigate for the first time the impact of various cirrhosis conditions on MPPGL and CPPGL.
The average activity of P450 reductase in the control group (0.097 ± 0.029 U⋅mg−1 microsomal protein) was in agreement with reported values (Mishin et al., 2014). The median MPPGL for controls (36.6 mg⋅g−1) was within the reported range for healthy human liver (Barter et al., 2007). Although CPPGL was not corrected for loss, no major loss in the cytosol (soluble fraction) is expected during preparation. The median value for the control group (75.4 mg⋅g−1) was within the reported range of 45–134 mg⋅g−1 (Cubitt et al., 2011) and close to the range reported using organelle-specific markers (65–75 mg⋅g−1) (Xu et al., 2018).
Differences in MPPGL and CPPGL between males and females in both control and diseased groups were negligible, and correlation with age was weak, in agreement with published evidence from adult livers (Barter et al., 2007, 2008). Moreover, the set of samples used in this study was obtained from the right lobe of the liver to allow comparison between scalar values; evaluation of any potential differences due to liver lobe heterogeneity were therefore beyond the scope of this study.
Fewer CP-A samples were acquired than intended based on the power analysis. Clinical sample acquisition and annotation is a commonly cited challenge for this type of research, frequently leading to apparently low sample sizes (Grizzle et al., 2010); indeed, a consensus paper that reported meta-analysis of 10 publications for healthy livers had 197 samples in total (i.e., average of nearly 20 samples per publication, some of them with only four samples) (Barter et al., 2007).
We expected a decline in both MPPGL and CPPGL with the severity of cirrhosis to reflect the decrease in amounts of most metabolic proteins within hepatocytes, as reported previously by Prasad et al. (2018). However, there was no statistically significant differences in MPPGL among groups (Fig. 1), which may be attributed to the following factors:
First, the small sample size, especially in the case of mild cirrhosis, may have affected the confidence in the detection of small differences.
Second, Child-Pugh classification is a clinical classification with some subjective elements, such as scoring ascites and encephalopathy, which are variable according to the physician’s judgment, and patient compliance on diuretics and lactulose (Peng et al., 2016),
Third, this classification does not consider the cause of cirrhosis and is not directly related to liver metabolic function (Talal et al., 2017). There seems to be a confounding effect by the accompanying disease of cirrhosis. For example, most of the mild cirrhosis samples were diagnosed with cancer and had the lowest MPPGL values. This, in turn, caused the median MPPGL to drop to a lower value than the severe group, most of which belong to cholestasis origin. Less subjective classification systems might be required, such as National Cancer Institute and Model for End-Stage Liver Disease scores, but donors’ data were not enough to calculate these scores.
Comparsion of cirrhotic MPPGL ratios (relative to control) against ratios of functional liver volume showed very similar trends, especially after correction by the change in whole liver size (Table 1), lending more support to the observation of concommitent decrease in content and function associated with cirrhotic livers. This comparison was only confined to previous studies that have used MPPGL and functional liver volumes as scalars. Studies that have scaled the clearance using functional liver volume values reported based on a single article and only one cause of the disease (alcoholic cirrhosis) were not included (Edginton and Willmann, 2008).
The control group MPPGL values were mostly (11 samples out of 13) within the 95th confidence interval of age-matched predicted values using eq. 3 from Barter et al. (2008) (Supplemental Fig. 1). The little bias observed might be attributed to the fact that the control samples were from histologically normal samples from metastatic liver diseases and not from healthy volunteers (Supplemental Table 2).
Patients with cirrhosis tend to exhibit various concomitant liver diseases that either are most likely to be a cause of cirrhosis or are developed as a result of cirrhosis progression (e.g., hepatocellular carcinoma). Some of these disorders were reflected in the samples used in this study. We could not confirm whether these associated diseases were the main cause of cirrhosis according to the clinical information provided by the tissue bank; however, diagnosis notes showed these as existing conditions at the time of sample collection.
A decrease in the expression of cytochrome P450 enzymes with increasing severity of fatty liver disease has been reported previously (Fisher et al., 2009), and this could be a general trend for microsomal proteins. There were only two samples associated with alcoholic liver disease, which also showed lower levels of MPPGL relative to controls; however, a larger sample size might be recommended for future studies to assess any differences (Fig. 4). Similarly for CPPGL, although previous proteomic and immuohistochemical investigations reported changes in expression of various cytosolic proteins in alcohol-fed rats compared with normal control animals (Kim et al., 2015), cytosolic protein contents did not show significant differences.
A statistical analysis of the subgroups with different coexisting diseases and according to Child-Pugh score was not possible because of the low sample size. The variations in scalars associated with coexisting conditions (especially in the case of MPPGL) might assist in more specific scaling of in vitro data for the development of models in various cirrhosis populations with different underlying conditions instead of the conventional practice of averaging values from all cirrhotic livers.
The PBPK simulations compared different methods to recapitulate cirrhosis within IVIVE scaling. Very limited differences in alfentanil model’s performance was noted between the methods (Fig. 5; Table 2), whereas for metoprolol and midazolam, late stages of cirrhosis showed modest differences between CS and EFLV methods (Figs. 6 and 7; Tables 3 and 4). These results indicate that changes in cirrhosis-specific MPPGL values correlate with changes in functional liver mass, especially when the former values were adjusted with actual whole liver volume at different cirrhosis populations. As the hepatic extraction ratio of the drug increased, the sensitivity to this whole liver volume adjustment increased. This can be attributed to the change in whole liver volume among the three methods of scaling leading to changes in liver blood flow and consequently variability in hepatic clearance of these drugs.
The ethinylestradiol model was developed to assess the simultaneous impact of cirrhosis-specific CPPGL and MPPGL values on the drug exposure. As intrinsic clearance per milligram of cytosolic protein was used in the model, changes due to differences in the cytosolic enzyme expression or activity between healthy and cirrhosis populations were not considered in this model; the main variables influencing the overall hepatic clearance of the drug were CPPGL, MPPGL, liver volume, fraction unbound, and liver blood flow changes. Similar to P450 specific substrates, the ethinylestradiol profile showed that the CS + SV scalar method agreed with EFLV scalar in all stages of the disease.
Further studies might be required not only to validate current experimental scalars with already established PBPK models but also to assess the in vivo clearance of different probes using in vitro liver microsomal and cytosol fractions from patients with cirrhosis. This is a common approach when a considerable amount of in vitro fractions are available and when the model is not yet defined for drugs in early stages of development (Obach et al., 1997; Obach, 1999).
In conclusion, this study compared for the first time MPPGL and CPPGL scalars in livers with varying severity of cirrhosis relative to histologically normal livers. Cirrhosis associated with NAFLD and liver cancer showed the largest reduction in MPPGL. Simulations using experimentally derived MPPGL and CPPGL values showed agreement with empirical methodology using functional liver volume, especially when considering that whole liver volume changes with disease progression. However, the experimental and biologic nature of MPPGL and CPPGL values provided here offer more confidence to PBPK models for a priori dose adjustment in patients with cirrhosis. This finding is in line with what was promoted by different reports (Jadhav et al., 2015; Younis et al., 2017) to acheive evidence-based dosage adjustment for special populations when there are no clinical data available (instead of the guesswork or in cerebro modeling). It also helps in including patients with cirrhosis into drug clinical trials with safe doses, as described in recent Food and Drug Administration guidance (https://www.fda.gov/regulatory-information/search-fda-guidance-documents/enhancing-diversity-clinical-trial-populations-eligibility-criteria-enrollment-practices-and-trial).
Acknowledgments
E.E.-K. was sponsored by the Egyptian missions sector of the Egyptian government to conduct this work at the University of Manchester, UK. The authors acknowledge Dr. Grace Dolman, Cambridge University Hospitals, for her valuable assistance in providing the anonymized clinical data related to the donors of the samples. The authors also acknowledge Eleanor Savill and Jessica Waite from Certara for their help in manuscript submission.
Authorship Contributions
Participated in research design: El-Khateeb, Achour, Athwal, Barber, Rostami-Hodjegan.
Conducted experiments: El-Khateeb, Achour, Al-Majdoub.
Performed data analysis: El-Khateeb, Achour, Scotcher, Athwal.
Wrote or contributed to the writing of the manuscript: El-Khateeb, Achour, Scotcher, Al-Majdoub, Athwal, Barber, Rostami-Hodjegan.
Footnotes
- Received June 16, 2020.
- Accepted September 8, 2020.
This work was supported by the Centre for Applied Pharmacokinetic Research, University of Manchester, UK, and Egyptian government funding [Grant P120144].
A.R.-H. holds shares in Certara, a company focusing on model‐informed drug development, and declares no support from any organization for the submitted work. All other authors declare that they have no conflicts of interest.
↵
 This article has supplemental material available at dmd.aspetjournals.org.

Abbreviations
- CI
- confidence interval
- CP
- Child-Pugh
- CPPGL
- cytosolic protein per gram liver
- CS
- cirrhosis-specific scalar from the current study and normal liver size
- CS + SA
- cirrhosis-specific scalar + liver size adjusted for each Child-Pugh grade
- CV
- coefficient of variation
- EFLV
- empirical functional liver volume with scalars from healthy population
- ER
- extraction ratio
- IVIVE
- in vitro to in vivo extrapolation
- MIPD
- model-informed precision dosing
- MPPGL
- microsomal protein per gram liver
- NAFLD
- nonalcoholic fatty liver disease
- P450
- cytochrome P450
- PBPK
- physiologically based pharmacokinetics
- UGT
- UDP-glucuronosyltransferase
- Copyright © 2020 by The American Society for Pharmacology and Experimental Therapeutics


