


Abstract
Two types of systems are used in ex vivo human placental perfusion studies to predict fetal drug exposures, that is, closed systems with recirculation of the maternal and fetal buffer and open systems using a single-pass mode without recirculation. The in vivo fetal/maternal (F:M) ratio of metformin, a cationic drug that crosses the placenta, is consistent with that reported in an open system ex vivo but not with that in a closed system. In the present study, we aimed to develop a pharmacokinetic (PK) model of transplacental transfer of metformin to predict in vivo fetal exposure to metformin and to resolve the apparent inconsistency between open and closed ex vivo systems. The developed model shows that the difference between open and closed systems is due to the difference in the time required to achieve the steady state. The model-predicted F:M ratio (approx. 0.88) is consistent with reported in vivo values [mean (95% confidence interval): 1.10 (0.69–1.51)]. The model incorporates bidirectional transport via organic cation transporter 3 (OCT3) at the basal plasma membrane, and simulations indicate that the use of trimethoprim (an OCT3 inhibitor) to prevent microbial growth in the placenta ex vivo has a negligible effect on the overall maternal-to-fetal and fetal-to-maternal clearances. The model could successfully predict in vivo fetal exposure using ex vivo human placental perfusion data from both closed and open systems. This transplacental PK modeling approach is expected to be useful for evaluating human fetal exposures to other poorly permeable compounds, besides metformin.
SIGNIFICANCE STATEMENT We developed a pharmacokinetic model of transplacental transfer of metformin, used to treat gestational diabetes mellitus, in order to predict in vivo fetal exposure and resolve the discrepancy between reported findings in open and closed ex vivo perfusion systems. The discrepancy is due to a difference in the time required to reach the steady state. The model can predict in vivo fetal exposure using data from both closed and open systems.
Introduction
For many years, direct measurements of drug concentrations in blood in the umbilical cord have been used to assess drug exposure of the human fetus. Alternatively, ex vivo perfusion of human placental cotyledon with buffer containing a test drug has been used to predict fetal exposure. Two main types of ex vivo perfusion systems are used: a closed system with recirculation of maternal and fetal buffer (Fig. 1A) and an open system without recirculation (Fig. 1B) (Kovo and Golan, 2008). In closed perfusion systems, the ratio of drug concentration in the fetal umbilical circulation to that in the maternal circulation (ex vivo F:M ratio) at the steady state can be directly compared with the in vivo ratio in blood of the umbilical cord and maternal blood (in vivo F:M ratio). On the other hand, in open perfusion systems, a test drug is perfused without recirculation, and the maternal-to-fetal (MF) and the fetal-to-maternal (FM) clearances (CLmf and CLfm, respectively) can be calculated (Tertti et al., 2010). The clearance ratio (CLmf/CLfm) in an open perfusion system is equivalent to the F:M concentration ratio in a closed perfusion system in the steady state.

Schematic diagrams of a typical closed system and open system for ex vivo human placenta perfusion study. (A) In the closed perfusion system, test drug is mainly added in the maternal reservoir, and the drug concentrations in the sampling ports (SP) at the maternal artery (MA) and fetal vein (FV) are measured. (B) In the open perfusion system, test drugs are continuously infused from the maternal container for MF perfusion or from the fetal container for FM perfusion. The drug concentrations in fetal effluent and in the SP at the MA are measured in MF perfusion, and the drug concentrations in maternal effluent and in the SP at the fetal artery (FA) are measured in FM perfusion. The concentrations of test drug in reservoirs in closed systems, which reflect the concentration in SP, alter gradually according to the time after staring of the drug perfusion due to recirculation of buffer, but the concentrations of containers in open systems are unchanged because of no recirculation through the containers (i.e., no reservoir). In both systems, the drug concentration in placental tissue may also be measured.
Metformin is recommended for women with gestational diabetes mellitus as a first-line option along with insulin (National Institute for Health and Care Excellence, 2015; American College of Obstetricians and Gynecologists Committee on Practice Bulletins-Obstetrics, 2018). It has a low risk of maternal weight gain and is very unlikely to cause hypoglycemia (Blair et al., 2019). However, it was recently reported that children whose mothers were treated with metformin during pregnancy showed significantly lower birth weights than those whose mothers were treated with insulin, but then appeared to experience accelerated postnatal growth (Tarry-Adkins et al., 2019), which might be associated with adverse long-term cardiometabolic outcomes (Eriksson et al., 1999; Forsen et al., 2000). Metformin is transported across the placenta by organic cation transporter (OCT) 3 located at the basal plasma membrane (BM) of human placental syncytiotrophoblasts (Sata et al., 2005), so fetal exposure may be unavoidable. Therefore, to understand the potential adverse effects on offspring, it would be helpful to quantify the fetal transfer of metformin across the placenta.
In this context, a quantitative comparison of in vivo F:M ratios for 24 drugs with ex vivo F:M ratios determined by placental perfusion was reported in a systematic review (Hutson et al., 2011). The in vivo F:M ratios were broadly consistent with the corresponding ex vivo F:M ratios, except for four drugs, of which one was metformin. In the case of metformin, the ex vivo F:M ratios determined in a closed perfusion system, 0.55 (Nanovskaya et al., 2006) and 0.17 (Kovo et al., 2008a), are considerably lower than the in vivo F:M ratio of approximately 1 (Vanky et al., 2005). However, an open perfusion system gave a value (0.88; calculated from the reported CLmf and CLfm; Tertti et al., 2010) similar to the in vivo value. The reason for these differences in the F:M ratio for metformin remains unclear. Moreover, the transfer mechanism of metformin across the placenta has not yet been quantitatively characterized.
Pharmacokinetic (PK) models have been constructed to predict fetal exposure using transplacental transfer parameters obtained from ex vivo human placental perfusion systems for various drugs, including tenofovir, emtricitabine (De Sousa Mendes et al., 2016), nevirapine (De Sousa Mendes et al., 2017), and acyclovir (Liu et al., 2020) in closed systems; paroxetine, antipyrine (Nagai et al., 2013), fluvoxamine (Matsuoka et al., 2017), and ketoprofen (Tanaka et al., 2017) in open systems; and darunavir (Schalkwijk et al., 2018) in a hybrid system (closed-open system). However, in those studies, the transplacental transfer of test drugs was mostly mediated by passive diffusion, and thus the contribution of transporter(s) to the clearance was not estimated. No transplacental PK models are available for drugs crossing the plasma membrane with the aid of transporter(s), except for computational models of transplacental amino acid transfer (Sengers et al., 2010; Panitchob et al., 2016). Therefore, in the present study, we aimed to develop a transplacental PK model incorporating transporter-mediated transfer across the microvillous and basal plasma membranes of syncytiotrophoblasts, to predict in vivo fetal exposure to metformin and to resolve the apparent inconsistency between open and closed ex vivo systems.
Materials and Methods
A flowchart of construction of the transplacental PK model for metformin, model validation, and prediction of human fetal exposure is shown in Fig. 2. The model was developed using previously reported metformin concentration-time profiles in maternal artery, umbilical vein, and placental tissue obtained in an ex vivo human placental perfusion study using a closed system (Nanovskaya et al., 2006). The developed model was verified by examining whether it could simulate the metformin concentration-time profiles obtained in another ex vivo closed perfusion study (Kovo et al., 2008a), as well as the transplacental transfer percent (TPT%)–time profiles obtained in an ex vivo open perfusion study (Tertti et al., 2010) of human placenta. Finally, the F:M ratio at the steady state was predicted by simulation using the developed PK model and compared with reported in vivo F:M ratio measurements (Vanky et al., 2005; De Oliveira Baraldi et al., 2011; Tertti et al., 2014).

Flowchart of construction of the transplacental PK model for metformin, model validation, and prediction of human fetal exposure
Development of the Transplacental PK Model for Metformin.
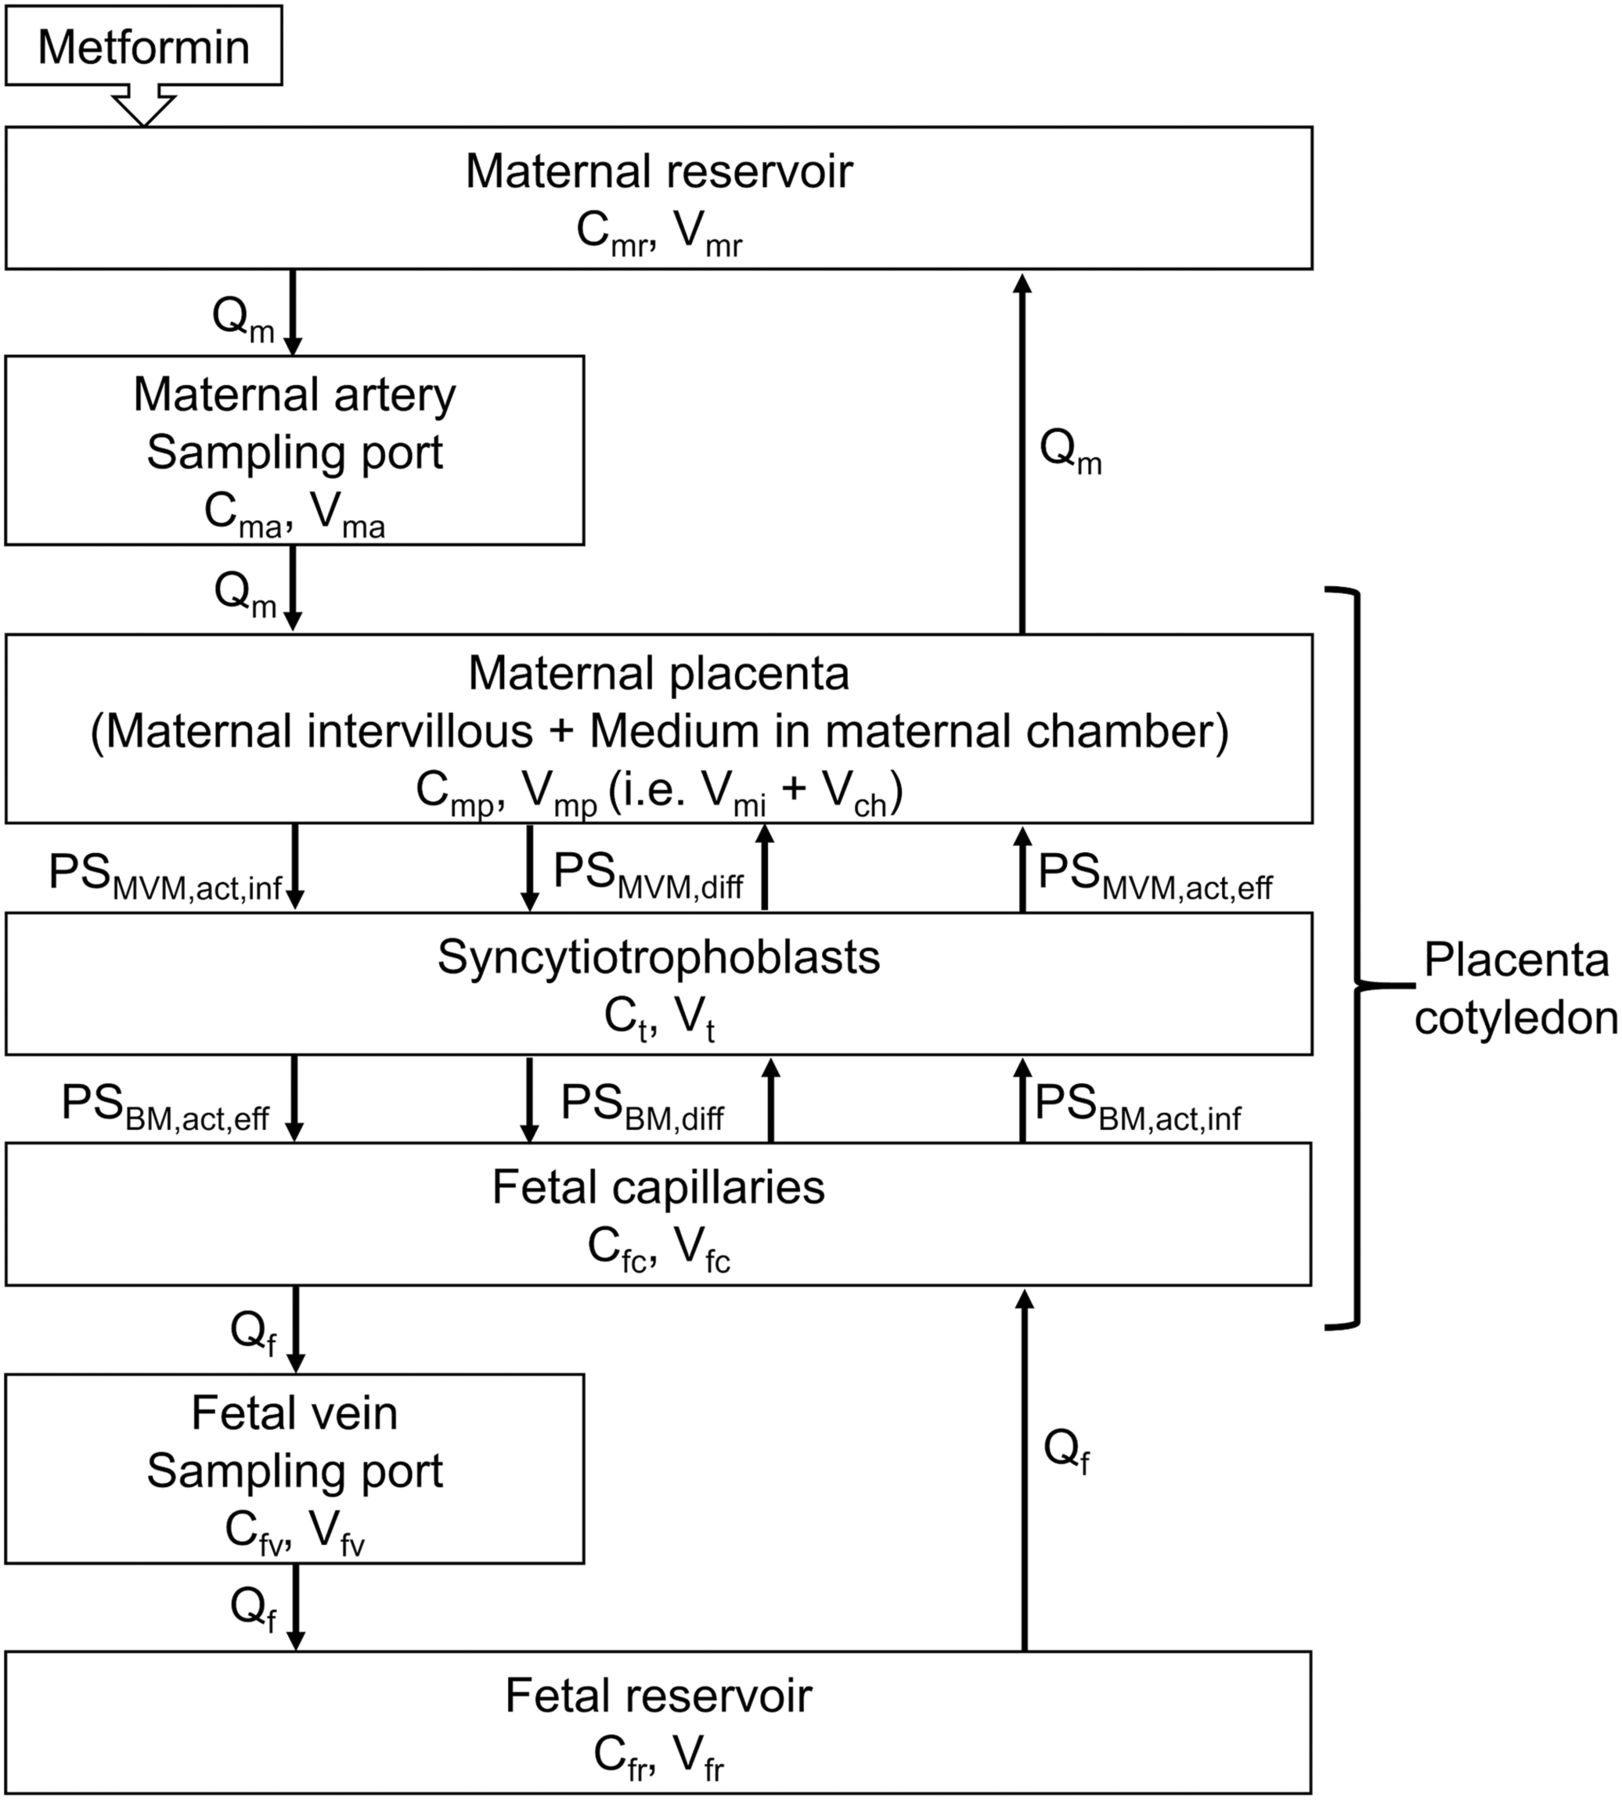
The time and metformin concentration data (Nanovskaya et al., 2006) were obtained by digitizing the published PK profiles using the online tool WebPlotDigitizer version 4.2 (https://automeris.io/WebPlotDigitizer.). Their study was performed by closed perfusion with a single cotyledon from an uncomplicated human placenta at delivery, as illustrated in Fig. 1A. The perfusion medium was recirculated at flow rates of Qm for the maternal side and Qf for the fetal side. Metformin (5.0 µg/ml) was added in the maternal reservoir and perfused for 240 minutes. The constructed transplacental PK model is shown in Fig. 3. The differential equations are as follows (eqs. 1–7): (1)
(1) (2)
(2) (3)
(3) (4)
(4) (5)
(5) (6)
(6) (7)Cmr, Cma, Cmp, Ct, Cfc, Cfv, and Cfr represent metformin concentrations in the maternal reservoir, maternal artery, maternal placenta, syncytiotrophoblast, fetal capillary, umbilical vein, and fetal reservoir compartments, respectively. At time 0 minutes (the start of metformin perfusion), Cmr was 5.00 µg/ml, and other values were fixed at 0 µg/ml.

The structure of the human transplacental PK model for ex vivo human placental perfusion in a closed system.
Vmr, Vmp, Vt, Vfc, Vfr, Vfv, and Vma represent the volumes of the maternal reservoir, maternal placenta, syncytiotrophoblast, fetal capillary, fetal reservoir, and sampling ports of the umbilical vein and maternal artery, respectively. Vfc (1.34 ml) was calculated using value of 6.00 × 10⁻² ml/g placenta (Drury et al., 1981) and weight of a placental cotyledon of 22.4 g (Kovo et al., 2008a). Vt and maternal intervillous volume (Vmi) were, respectively, calculated as 2.0 and 4.5 times Vfc (Mayhew et al., 2008). Vmp is the sum of the medium volume in the maternal chamber (Vch) and Vmi. Vch was estimated by model fitting.
The passive clearances of metformin in the microvillous plasma membrane (MVM; PSMVM,diff) and in the BM (PSBM,diff) were calculated using the equations and parameters detailed in Supplemental Text and Supplemental Table 1. Because metformin is a substrate of OCT3, which is located at the BM of human placental syncytiotrophoblasts and is a bidirectional transporter (Kekuda et al., 1998; Lee et al., 2014, 2018), active influx and efflux clearances through the BM (PSBM,act,inf and PSBM,act,eff) were incorporated into the model. Active influx and efflux clearances through the MVM (PSMVM,act,inf and PSMVM,act,eff, respectively) were also assumed to be involved in the transport of metformin.
In the placental perfusion study by Nanovskaya et al. (2006), the perfusion medium contained the antibiotic trimethoprim at the concentration of 16 mg/L to prevent microbial growth in the placenta (Nanovskaya et al., 2002, 2006). Since trimethoprim is an inhibitor of OCT3 (Lepist et al., 2014), the following equations (eqs. 8 and 9) were used to take into account the inhibition of OCT3-mediated metformin transport by trimethoprim: (8)
(8) (9)The trimethoprim concentration in fetal capillary (Ifc: 16.0 mg/l = 55.1 µmol/l) was assumed to be the same as that in the fetal reservoir because the perfusion media including trimethoprim in the maternal and fetal reservoirs were recirculated for 2 hours prior to the start of metformin perfusion in the ex vivo closed system; thus, it is considered that the trimethoprim concentration would have reached a steady state before the start of metformin perfusion. Trimethoprim is mainly metabolized by CYP3A4 and CYP2C9 (Goldman et al., 2015), but mRNA and protein expressions of these enzymes in human placenta are weak or undetectable (Hakkola et al., 1996; Bièche et al., 2007; Cizkova and Tauber, 2018). Therefore, we assumed that trimethoprim was not metabolized in human placenta in the ex vivo closed perfusion system. The trimethoprim concentration in syncytiotrophoblasts (It) was calculated from Ifc and the syncytiotrophoblast-to-fetal capillary concentration ratio (0.90), which was determined from the concentrations in placental tissue and fetal circulation after placental perfusion of trimethoprim in the MF direction for 60 minutes in the closed system (Bawdon et al., 1991); this was considered to be a steady-state condition. The inhibition constant of trimethoprim for OCT3 (Ki,OCT3; 12.3 µmol/l) was taken as equal to the reported in vitro value (Lepist et al., 2014).
The physicochemical properties of metformin, the experimental conditions for perfusion, and the physiologic PK parameters used for development of the PK model are listed in Table 1.
Parameters used or determined on fitting in the human transplacental PK model for metformin
The model optimization was performed by nonlinear least-squares regression using NONMEM version 7.3 (Icon Development Solutions, Ellicott City, MD; Beal and Sheiner, 1992). The data management, graphics generation, post-processing of NONMEM and statistical analysis were carried out using R Project for Statistical Computing, version 3.5.1 for Windows (Comprehensive R Network, http://cran.r-project.org).
Model Verification and Prediction of In Vivo Fetal Metformin Exposure.
To validate the transplacental PK model obtained from the metformin concentration data reported by Nanovskaya et al. (2006), the transplacental physiologic parameters and determined PK parameters for the cotyledon were applied to the different experimental settings employed in two other ex vivo human placental perfusion studies of metformin, one using a closed system (Kovo et al., 2008a) and the other using an open system (Tertti et al., 2010).
For the closed perfusion study (Kovo et al., 2008a), Cma and Cfv were simulated using the same model described in Fig. 3 and eqs. 1–7; in this case, eqs. 8 and 9 were not included since the perfusion medium did not contain an OCT3 inhibitor. The experimental parameters used in this closed perfusion study are listed in Supplemental Table 2.
For the open perfusion study (Tertti et al., 2010), metformin was perfused without recirculation, and the transport in the MF or FM direction was determined. The model structures for transport in the MF and FM directions are shown in Fig. 4, and the differential equations are given in the Supplemental Text. The experimental parameters used in this open perfusion study are listed in Supplemental Table 3. Umbilical vein effluent metformin concentration and maternal vein effluent concentration were simulated in the perfusion of maternal and umbilical circulations, respectively, and value of TPT% for both directions were calculated according to the equations given in the Supplemental Text.
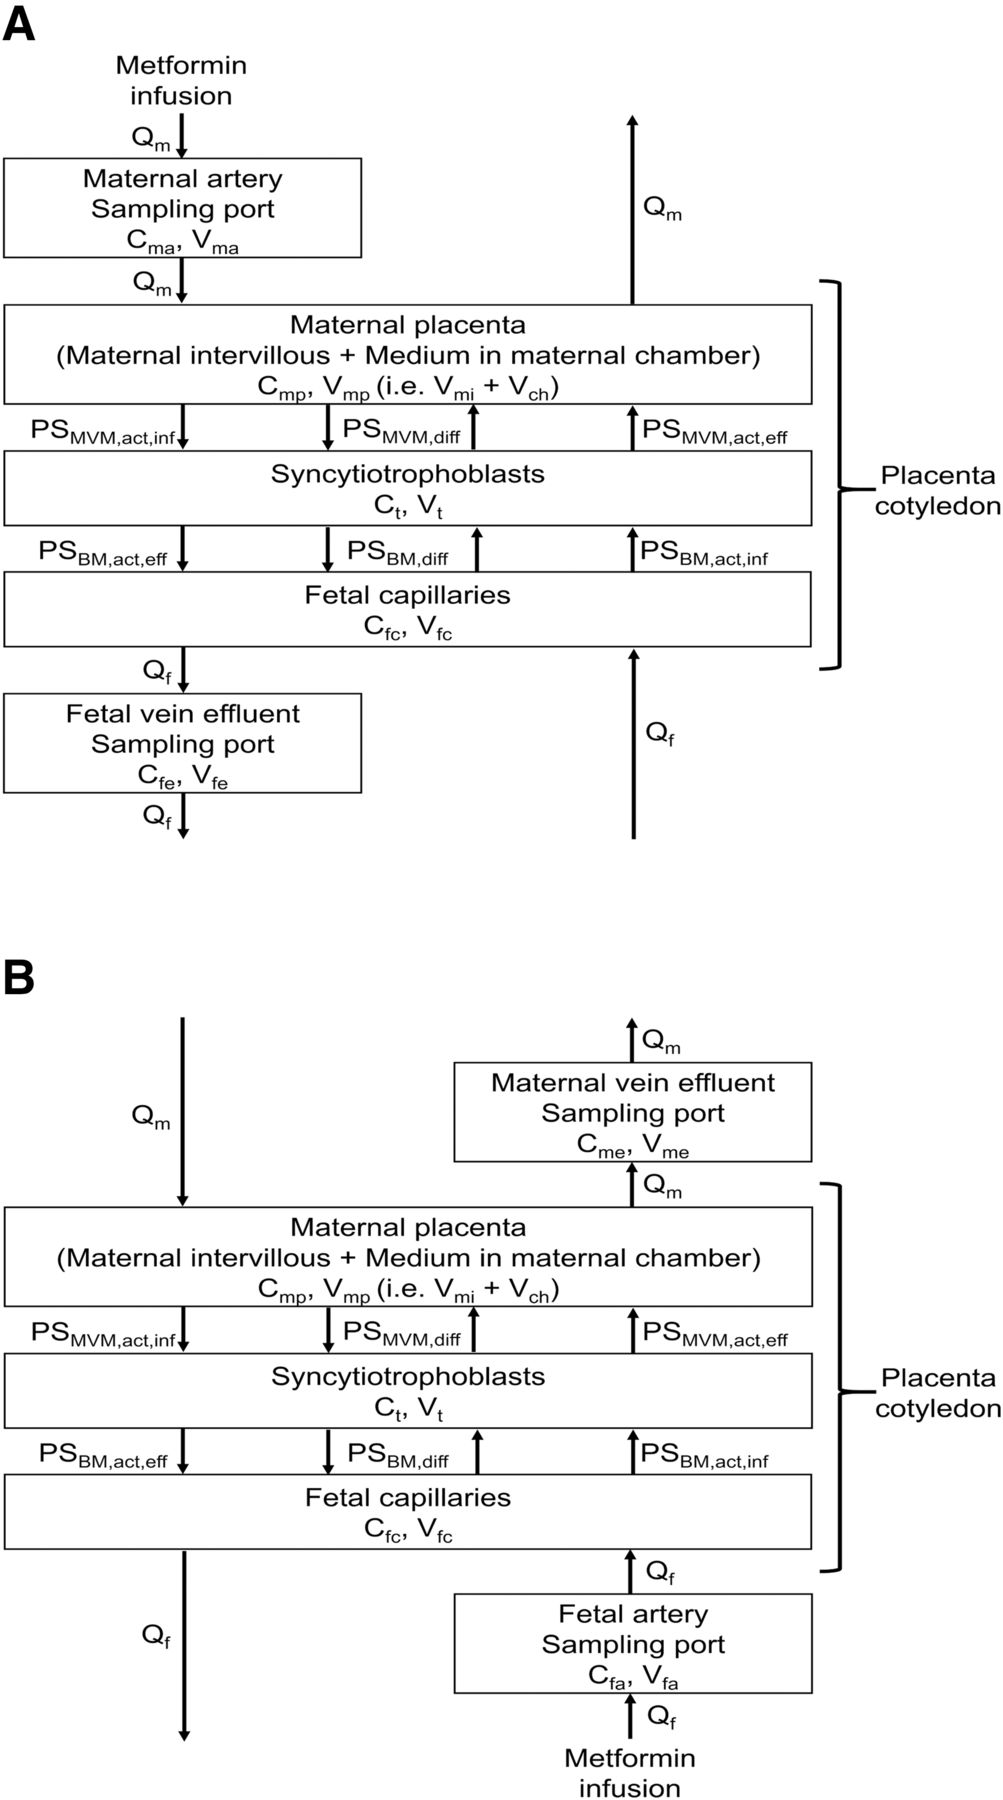
The structure of the human transplacental PK model for ex vivo human placental perfusion in an open system. (A) MF direction. (B) FM direction. For the MF or FM directions, metformin is perfused through the maternal artery or fetal artery, respectively.
To predict in vivo fetal exposure to metformin, simulations using the developed model were performed for the experimental conditions used in the ex vivo studies by Nanovskaya et al. (2006), Kovo et al. (2008a), and Tertti et al. (2010), except for the inclusion of a long perfusion time to achieve the steady-state (tss) condition and the absence of OCT3 inhibitor in the perfusion medium. The unbound fraction of metformin was set to be 1 (Tucker et al., 1981) for the in vivo prediction. The predicted F:M ratios were derived from the ratio of predicted steady-state Cfr and Cmr values in the closed perfusion system and the ratio of predicted CLmf and CLfm values in the open perfusion system. CLmf and CLfm were calculated according to the reported equations (Supplemental Text, Tertti et al., 2010). The ex vivo F:M ratios were compared with the mean and range of the in vivo F:M ratio derived from multiple sources (Vanky et al., 2005; De Oliveira Baraldi et al., 2011; Tertti et al., 2014).
Statistical Method.
The in vivo F:M ratio [mean ± 95% confidence interval (CI)] was estimated from the mean, S.D., and number of subjects reported in multiple sources (Vanky et al., 2005; De Oliveira Baraldi et al., 2011; Tertti et al., 2014) using the Dersimonian and Laird procedure (Dersimonian and Laird, 1986). If only the median and range of in vivo F:M ratio were available in the literature (De Oliveira Baraldi et al., 2011), the mean and S.D. were estimated from the median, range, and sample size (Supplemental Text, Hozo et al., 2005).
Results
Development of the Human Transplacental PK Model for Metformin.
The model was developed using the reported data from a closed perfusion system in the presence of trimethoprim, which is an OCT3 inhibitor (Nanovskaya et al., 2006). The fitted profiles of Cma, Cfv, and Ct were consistent with the observed concentrations (Fig. 5). Active influx (PSMVM,act,inf and PSBM,act,inf) and efflux (PSMVM,act,eff and PSBM,act,eff) clearances and Vch were determined by fitting to the observed Cma, Cfv, and Ct values (Table 1).
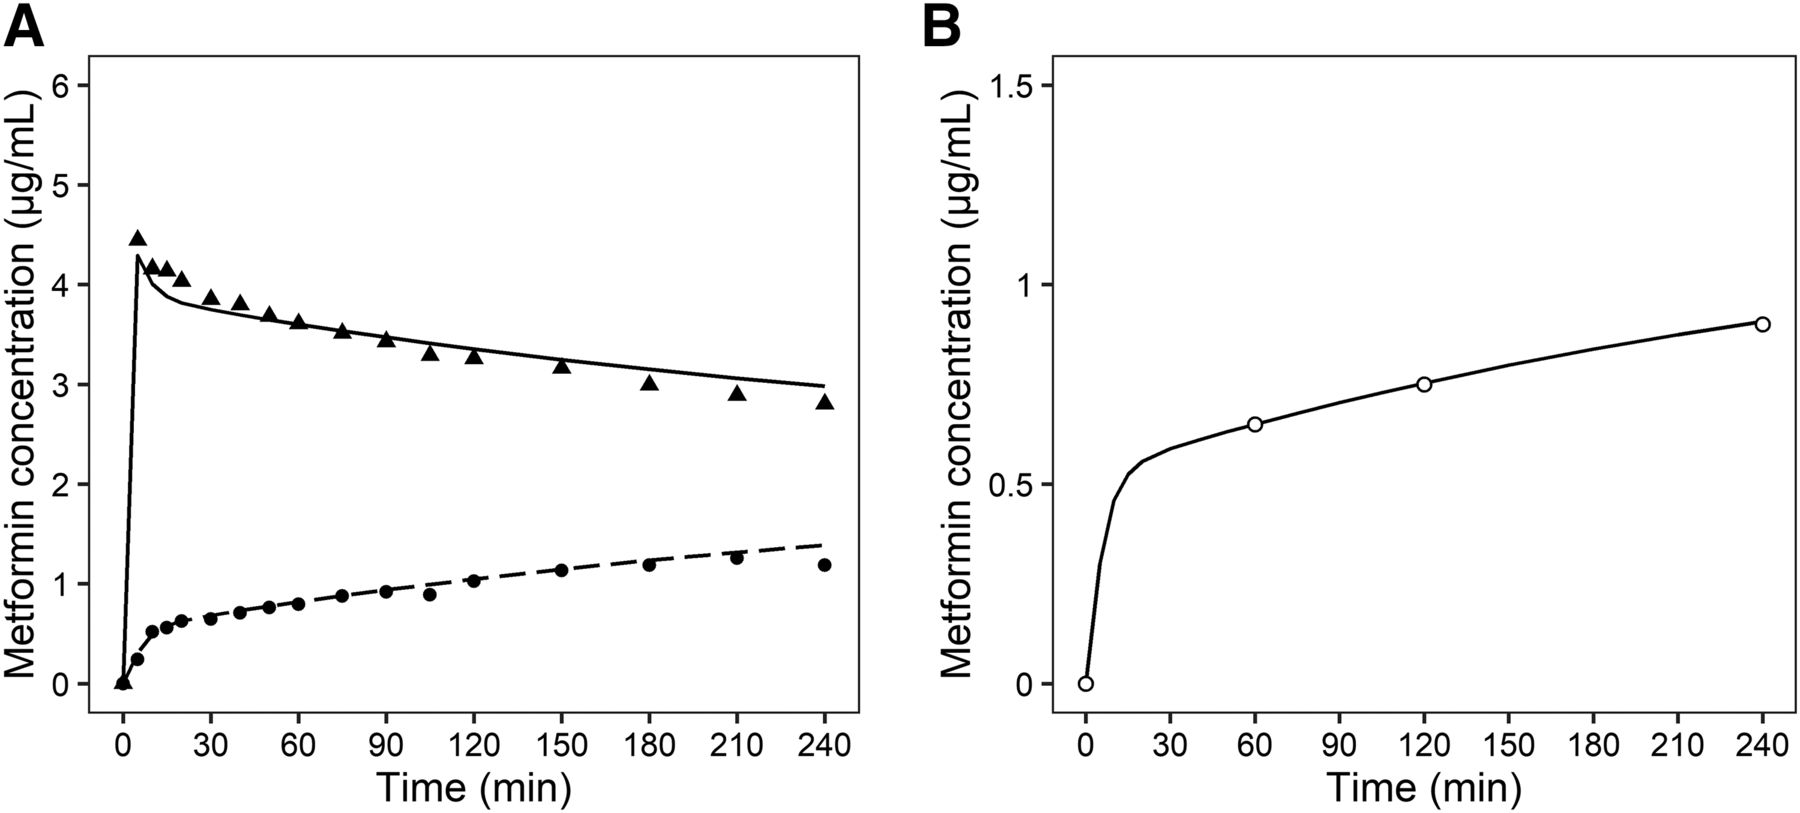
Fitted metformin concentration-time profiles for maternal artery, fetal vein, and tissue in a closed perfusion system (Nanovskaya et al., 2006). Metformin (5 μg/ml) was added to the maternal reservoir at 0 minutes. In the reported conditions, OCT3 would be inhibited by trimethoprim. (A) In the maternal artery and fetal vein, metformin concentrations were measured at 0 (preperfusion), 5, 10, 15, 20, 25, 30, 40, 50, 60, 75, 90, 105, 120, 150, 180, 210, and 240 minutes after the start of metformin Cma and Cfv. The solid line in this panel represents maternal artery concentration-time profile; closed triangles (▲) represent the mean reported concentration of metformin for the maternal artery. The dashed line represents fetal vein concentration-time profile; closed circles (●) represent the mean reported concentration of metformin for the fetal vein. (B) In the tissue, Ct was measured at 0 (preperfusion), 60, 120, and 240 minutes after the start of metformin perfusion. The solid line in this panel represents tissue concentration-time profile; open circles (○) represent the mean reported concentration of metformin for the tissue.
Verification of the Human Transplacental PK Model for Metformin.
The transplacental PK model was verified by applying it to the reported data from two other experimental settings without OCT3 inhibitor (Kovo et al., 2008a; Tertti et al., 2010). The simulated Cma and Cfv profiles corresponded well with the observed concentrations in the closed perfusion system (Kovo et al., 2008a) (Fig. 6). Furthermore, the simulated TPT% profiles for the MF and FM directions were consistent with those observed in the open systems (Tertti et al., 2010) (Fig. 7).

Simulated metformin concentration-time profiles for maternal artery (solid line) and fetal vein (dashed line) in a closed perfusion system (Kovo et al., 2008a). Symbols [closed triangle (▲), maternal artery; closed circle (●), fetal vein] and bars represent the mean reported concentrations and 95% CIs, respectively. Metformin (1 μg/ml) was added to the maternal reservoir at 0 minutes. No trimethoprim was present in the perfusion medium in this study. Metformin concentrations were measured at 0 (pre-perfusion), 5, 10, 15, 20, 30, 60, 90, 120, 150, and 180 minutes after the start of perfusion. Dotted lines represent the simulated concentration-time profiles from the sensitivity analysis of Vch (0–176.7 ml).

Simulated metformin TPT%-time profiles for the MF direction (solid line) and the FM direction (solid line) in an open perfusion system (Tertti et al., 2010). (A) The MF direction. (B) The FM direction. Metformin (2 μg/ml as continuous infusion) was perfused from the maternal container in the MF direction and from the fetal container in the FM direction. No trimethoprim was present in the perfusion medium in this study. Metformin concentrations in the fetal vein effluent (Cfe) for the MF direction and in the maternal vein effluent (Cme) for the FM direction were measured at 0 (preperfusion), 10, 20, 30, 40, 50, 60, 80, 100, and 120 minutes after the start of perfusion. Cma for the MF direction and Cfa for the FM direction were in a steady-state condition. TPT% for the MF or FM direction was calculated using the equations in the Supplemental Text. Solid lines represent simulated metforming TPT%-time profiles. Open circles (○) and bars represent mean reported values and 95% CIs, respectively. Dotted lines represent the simulated TPT%-time profiles from the sensitivity analysis of Vch (0–176.7 ml).
Sensitivity Analysis for Maternal Chamber Volume.
Among the parameters determined on fitting (Table 1), the value of 68.7 ml for Vch [the volume of medium in the maternal chamber (gray area of the chamber in Fig. 1)] could be different depending on the experimental set-up of the perfusion system. Therefore, sensitivity analysis of Vch was performed. The minimum value was set as no remaining medium (0 ml) in the maternal chamber, and the maximum was set as 176.7 ml according to the apparatus size reported by Schneider et al. (1972). Simulated values of Cma and Cfv in the closed perfusion system and TPT% in the open perfusion system mostly lay within the 95% CIs of the observed values (Figs. 6 and 7). Therefore, we concluded that the effect of variation in Vch is negligible.
Prediction of In Vivo Fetal Metformin Exposure.
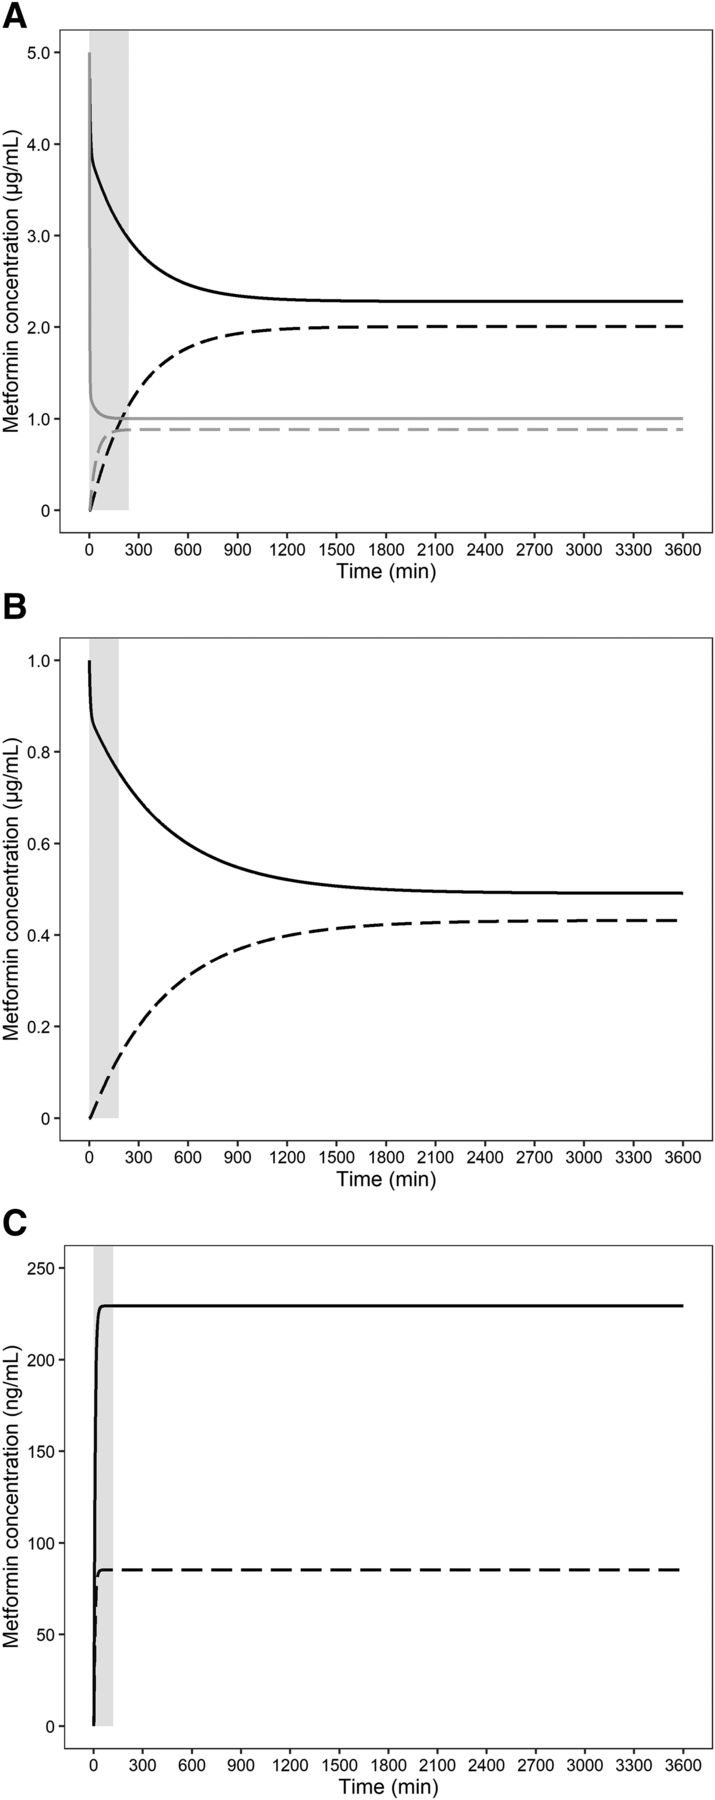
Simulations of closed perfusion studies of metformin indicated that the time required to achieve an apparent steady state would have been around 1000 minutes in the study by Nanovskaya et al. (2006) (Fig. 8A) and around 1500 minutes in that by Kovo et al. (2008a) (Fig. 8B), but the actual ex vivo perfusions of metformin were discontinued before those times (at 240 and 180 minutes, respectively). On the other hand, the simulation of the open perfusion study (Tertti et al., 2010) indicated that the time required to achieve an apparent steady state was around 30 minutes, as shown in Fig. 8C, and the actual ex vivo perfusion of metformin was performed for 120 minutes.

Simulated metformin concentration-time profiles for the maternal reservoir (black solid line) and fetal reservoir (black dashed line) under the experimental conditions used by Nanovskaya et al. (2006) (A), except for the absence of OCT3 inhibitor in the perfusion medium, as well as under the experimental conditions used by Kovo et al. (2008a) (B), and for the fetal effluent in the MF direction (solid line) and the maternal effluent in the FM direction (dotted line) under the experimental conditions used by Tertti et al. (2010) (C). Light gray solid and dashed lines in (A) represent the simulated metformin concentration–time profiles for the maternal reservoir and fetal reservoir, respectively, under the experimental conditions used by Nanovskaya et al. (2006) except for maternal and fetal reservoir volumes (each 25 ml) and without OCT3 inhibitor in the perfusion medium.
The F:M ratios at the steady state were all calculated as approximately 0.88 from the simulated Cfr and Cmr values at the apparent steady state in the closed perfusion systems of Nanovskaya et al. (2006) (2.00 and 2.28 µg/ml, respectively) and Kovo et al. (2008a) (0.43 and 0.49 µg/ml, respectively), and from the simulated CLmf and CLfm values in the open perfusion system of Tertti et al. (2010) (0.47 and 0.53 ml/min, respectively). These simulated F:M ratios correspond well with reported in vivo F:M ratios [mean (95% CI): 1.10 (0.69–1.51)] (Fig. 9).

In vivo F:M metformin concentration ratios (means ± 95% CI) collected from multiple sources (Vanky et al., 2005; De Oliveira Baraldi et al., 2011; Tertti et al., 2014) and the ex vivo predicted and observed F:M ratios (Nanovskaya et al., 2006; Kovo et al., 2008a; Tertti et al., 2010). To obtain the in vivo F:M ratios in this analysis, the literatures were selected to be matched with the following criteria: 1) Blood was simultaneously sampled from maternal venous and umbilical cord. 2) The ratio of umbilical cord to maternal blood concentrations with S.D. or range was described. The clinical PK study information of metformin at delivery used in the present study is listed in Supplemental Table 4. Ex vivo predicted F:M ratios (●) were obtained by simulations using our developed transplacental PK model. Ex vivo observed mean F:M ratios [(▲): Nanovskaya et al., 2006; (♦): Kovo et al., 2008a; (▪): Tertti et al., 2010] were calculated from the values in the literature as described in Materials and Methods. For in vivo values, open squares (▢) show mean values of F:M ratio with the sample size reported in the literature (square size). The solid lines show the 95% CIs. The mean ratios and 95% CIs (fixed or random) were estimated using the Dersimonian and Laird method (Dersimonian and Laird, 1986).
As regards the reason for the difference of tss between closed and open perfusion systems, the main factor is considered to be the reservoir volume. Closed perfusion systems are equipped with reservoirs (250 ml on the maternal and fetal sides) that are obviously larger than the cotyledon volume, whereas open perfusion systems are not. When the reservoir volume was changed from 250 to 25 ml in the simulation of the closed perfusion study by Nanovskaya et al. (2006), the time required to achieve the steady state was reduced from approximately 1000 minutes to 120 minutes (gray solid and dashed lines in Fig. 8A).
Parameter Estimation for the Case Without OCT3 Inhibition by Trimethoprim.
A contribution of OCT3 to the disposition of metformin in placenta was established based on studies in OCT3 knockout mice (Oct3−/−) (Lee et al., 2018). The area under the fetal plasma concentration-time curve of metformin in the Oct3−/− pregnant mice was reduced to 47% of that in wild-type mice. On the other hand, cimetidine at 0.4 mM, an OCT3 inhibitor, failed to inhibit maternal-to-fetal or fetal-to-maternal transport of metformin in an ex vivo human placental perfusion study using an open system (Tertti et al., 2010). Since it is unclear whether OCT3 expressed at the BM of human placental syncytiotrophoblasts contributes to metformin disposition to the fetus, the transplacental PK parameters were also estimated from the data of Nanovskaya et al. (2006) based on the assumption that active influx and efflux clearances at BM are insensitive to trimethoprim, by employing the PK model without eqs. 8 and 9. Parameters identical to those in Table 1 were obtained by the fitting, except for the underestimation of PSBM,act,inf (4.90 ml/min) and PSBM,act,eff (8.40 ml/min), which, respectively, correspond to the apparent PSBM,act,inf [= 26.9/(1 + Ifc/Ki,OCT3)] and apparent PSBM,act,eff [= 42.3/(1 + It/Ki,OCT3)] under the assumption that active influx and efflux clearances at BM are sensitive to trimethoprim. The fitted profiles of Cma, Cfv, and Ct without OCT3 inhibition were consistent with the concentrations observed during perfusion with medium containing the inhibitor (trimethoprim) (Supplemental Fig. 1, A and B). The underestimation of PSBM,act,inf and PSBM,act,eff did not affect the simulations of Cma and Cfv under the conditions used by Kovo et al. (2008a) (Supplemental Fig. 2) or the TPT% values in the MF and FM directions under the conditions used by Tertti et al. (2010) (Supplemental Fig. 3, A and B). The fact that the differences in PSBM,act,inf and PSBM,act,eff did not significantly affect the simulation of CLmf and CLfm is in good agreement with the insensitivity of transplacental metformin transport to cimetidine in an ex vivo human placental perfusion study (Tertti et al., 2010).
Discussion
The F:M ratios obtained by ex vivo human placental perfusion using closed systems are inconsistent with those found in in vivo studies for some drugs, including metformin (Hutson et al., 2011). In the present study, our human transplacental PK model for metformin could successfully predict in vivo fetal exposure from ex vivo human placental perfusion studies with both closed and open systems. Furthermore, the model revealed that the observed differences of metformin F:M ratios between ex vivo closed perfusion and open perfusion or in vivo studies is due to a difference of tss. Because of the poor membrane permeability of metformin, it takes 1000–1500 minutes to reach the steady state according to our simulation (Fig. 8A). In the reported closed perfusion systems (Nanovskaya et al., 2006; Kovo et al., 2008a), perfusion was conducted for only 180 or 240 minutes, and the observed F:M ratios were 0.17 or 0.55, respectively, which are less than the in vivo F:M ratio of 1.10 and the simulated F:M ratio at steady state of 0.88 (Fig. 9). In contrast to the low lipophilicity of metformin, for which LogD at pH 7.4 is −5.4 (Benet et al., 2011), antipyrine has a higher lipophilicity (0.28; Benet et al., 2011) and has been used as a marker compound for passive diffusion. Antipyrine reportedly reached the steady state at around 200 minutes in a closed perfusion system with 250 ml of reservoir volume on both the maternal and fetal sides (Conings et al., 2017). Tissue distribution can be described by either perfusion rate-limited or permeability rate-limited kinetics, which tend to occur for small lipophilic or polar molecules, respectively (Jones and Rowland-Yeo, 2013). Rapid distribution equilibrium can be assumed in the case of perfusion rate-limited rather than permeability rate-limited kinetics (Yuan et al., 2019). Antipyrine transfer across the perfused human placenta is perfusion rate-limited (Schneider et al., 1972), but metformin should have permeability rate-limited kinetics. In the PK model describing permeability rate-limited kinetics, the uptake clearance with an extracellular compartment is especially important to estimate the tss as well as the time-dependence of Cma and Cfv.
In open perfusion systems, test drugs are perfused unidirectionally without recirculation, so the ex vivo F:M concentration ratio does not correspond to that in vivo. Based on our simulation of Tertti et al.’s study (2010), the tss was around 30 minutes for metformin, and the F:M clearance ratio (CLmf/CLfm) was comparable with in vivo F:M ratio. In open perfusion systems, test drug is perfused continuously without reservoirs. Therefore, tss would be more rapid than in the closed perfusion system with reservoirs. Actually, Tertti et al. (2010) performed ex vivo open perfusions for 120 minutes, and the F:M ratio (0.88) was consistent with our simulation (Fig. 9). In addition, reservoir volume also affects tss (Fig. 8A). Thus, an open perfusion system is better to predict fetal exposure in vivo, especially for drugs with poor membrane permeability. However, open perfusion systems have the disadvantage that the concentration ratio is calculated from CLmf and CLfm obtained from separate experiments, whereas the ratio can be obtained from a single experiment in a closed system.
Hence, the difference of the tss between open and closed system is accounted for by the differences between reservoir with recirculation in closed system and containers without recirculation in open systems (Fig. 8A). However, the tss differences were lessened significantly by rapid distribution when the compound with high membrane permeability was applied to the perfusion systems (data not shown), as was observed in antipyrine. When the compounds are transported by transporters, the activity is also related to the tss differences.
OCT3 is a most possible transporter for metformin in human placenta (Lee et al., 2018). The activity of OCT1 and OCT2 are 0.34-fold lower and 1.54-fold higher per mg protein than that of OCT3, respectively (Han et al., 2015). However, mRNAs of these transporters in human term placenta are reportedly minimally expressed relative to OCT3 (Nishimura and Naito, 2005; Lee et al., 2013). Since OCT3 is a bidirectional transporter (Lee et al., 2014), OCT3-mediated transport in both the influx and efflux directions at the BM was taken into account in the model. The ex vivo human placental perfusion study (Nanovskaya et al., 2006) referred to for our model construction was conducted with trimethoprim as an antibiotic in the perfusion medium. Because trimethoprim is an OCT3 inhibitor, it is necessary to incorporate the inhibition of bidirectional transport of metformin via OCT3 into the model. Tertti et al. (2010) demonstrated that cimetidine, an inhibitor of OCTs, did not affect metformin transfer in an ex vivo human placental perfusion study. In our model fitting, the parameters estimated in the presence of the OCT3 inhibitor trimethoprim (Table 1) were comparable with those in the absence of the inhibitor, except for PSBM,act,inf and PSBM,act,eff. The simulations using the estimated parameters with or without OCT3 inhibition provided comparable profiles of Cma and Cfv to those observed by Kovo et al. (2008a) and comparable TPT% of MF and FM to those observed by Tertti et al. (2010). Thus, our model analysis indicated that trimethoprim has essentially no effect on transplacental transfer of metformin.
This finding can be explained in terms of the extended clearance concept by applying the well-stirred model for liver (Shitara et al., 2013) to human placenta according to the following equations (eqs. 10 and 11) (Supplemental Text): (10)
(10) (11)According to these equations, CLmf for metformin is affected by PSMVM,inf (i.e., PSMVM,act,inf + PSMVM,diff). Moreover, since the condition of PSBM,eff (i.e., PSBM,act,eff + PSBM,diff) > > PSMVM,eff (i.e., PSMVM,act,eff + PSMVM,diff) was determined by fitting (Table 1), βmf is only slightly decreased by OCT3 inhibition at BM and is close to 1 regardless of the inhibition. Likewise, CLfm is only slightly affected by OCT3 inhibition because PSBM,inf (i.e., PSBM,act,inf + PSBM,diff) is decreased with increasing βfm value to a similar extent (Supplemental Text). The insignificant change of transplacental transfer of metformin by cimetidine reported by Tertti et al. (2010) can presumably be accounted for in the same way. This insensitivity to the inhibitor was observed under the condition of PSBM,act,eff>>PSMVM,act,eff regardless of inhibition. On the other hand, in the case of OCT3 deficiency, metformin is not transferred to the fetus (data not shown), and βmf is decreased because PSBM,act,eff<<PSMVM,act,eff due to almost complete loss of PSBM,act,eff. This is consistent with the observation that the fetal exposure in Oct3−/− mice showed a 50% reduction in comparison with that in wild type (Lee et al., 2018).
The functional expression of transporters was also assumed at the MVM (PSMVM,act,inf and PSMVM,act,eff). Metformin is expected not to diffuse across the membrane, as judged from parallel artificial membrane permeation assay (Kovo et al., 2008b), and it exists mainly as the ionized form in physiologic pH. Based on the results from ex vivo perfusion study, Kovo et al. suggested that active transport of metformin occurs bidirectionally in the MVM. As regards influx transport in the MVM, serotonin transporter and carnitine/organic cation transporter 1 are candidates, since these transporters are expressed in the placenta (Carrasco et al., 2000; Wu et al., 2000; Kliman et al., 2018) and recognize metformin as a substrate (Nakamichi et al., 2013; Han et al., 2015). As for efflux transport in the MVM, ATP-dependent uptake of metformin by placental brush border inside-out vesicles was reportedly detected and was inhibited by verapamil, an inhibitor of P-glycoprotein, and by Ko143, an inhibitor of breast cancer resistance protein (Hemauer et al., 2010). However, it has also been reported that metformin is not a substrate of P-glycoprotein and breast cancer resistance protein according to cell-based and vesicle-based assays in vitro (Poirier et al., 2014; Xue et al., 2016). Additionally, multidrug and toxin extrusion 1, efflux transporter of metformin, is expressed on MVM in rat placenta (Ahmadimoghaddam et al., 2012, 2013), whereas the mRNA was almost not detectable in human term placenta (Otsuka et al., 2005; Lee et al., 2013; Ahmadimoghaddam et al., 2013). Although multidrug and toxin extrusion 2-K transports metformin in vitro (Ito et al., 2012), the mRNA is reportedly minimally or not expressed in human term placenta (Lee et al., 2013; Ahmadimoghaddam et al., 2013). Simulations using our transplacental PK model without active influx and/or efflux clearance at the MVM failed to reproduce the reported concentration profiles (data not shown). Therefore, some active influx and efflux transporters appear to contribute to metformin transport in the MVM, but further studies will be needed.
In conclusion, using our developed human transplacental PK model for metformin, we have been able to resolve the inconsistency between the findings in ex vivo open and closed perfusion systems. The model shows that the discrepancy is due to the longer tss in a closed perfusion system than in an open perfusion system. Furthermore, our model was able to successfully predict the in vivo fetal exposure to metformin, showing good agreement with reported values. Our modeling and simulation approach should be a powerful tool to predict fetal exposure for various compounds including poor membrane permeability and substrates of transporters located in human placenta.
Acknowledgments
We thank Mahmoud S. Ahmed and Tatiana Nanovskaya for allowing us to visit their laboratory to see their ex vivo human placental perfusion study and for providing the information about the experimental conditions.
Authorship Contributions
Participated in research design: Kurosawa, Chiba, Noguchi, Nishimura, Tomi.
Conducted experiments: Kurosawa, Chiba, Tomi.
Contributed new reagents or analytic tools: Kurosawa, Chiba, Tomi.
Performed data analysis: Kurosawa, Chiba.
Wrote or contributed to the writing of the manuscript: Kurosawa, Chiba, Noguchi, Nishimura, Tomi.
Footnotes
- Received June 5, 2020.
- Accepted September 14, 2020.
↵
 This article has supplemental material available at dmd.aspetjournals.org.

Abbreviations
- BM
- basal plasma membrane
- Cfr
- drug concentration in fetal reservoir
- Cfv
- drug concentration in umbilical vein
- CI
- confidence interval
- CLfm
- fetal-to-maternal drug clearance
- CLmf
- maternal-to-fetal drug clearance
- Cma
- drug concentration in maternal artery
- Cmr
- drug concentration in maternal reservoir
- Ct
- drug concentration in syncytiotrophoblasts
- FM
- fetal-to-maternal
- F:M
- fetal-to-maternal drug concentration ratio
- Ifc
- inhibitor concentration in fetal capillaries
- It
- inhibitor concentration in syncytiotrophoblasts
- Ki,OCT3
- inhibition constant for organic cation transporter 3
- MF
- maternal-to-fetal
- MVM
- microvillous plasma membrane
- OCT
- organic cation transporter
- PK
- pharmacokinetic
- PSBM,act,eff
- active efflux clearance in BM
- PSBM,act,inf
- active influx clearance in BM
- PSBM,diff
- passive clearance in BM
- PSMVM,act,eff
- active efflux clearance in MVM
- PSMVM,act,inf
- active influx clearance in MVM
- PSMVM,diff
- passive clearance in MVM
- Qm
- perfusion flow rate on the maternal side
- Qf
- perfusion flow rate on the fetal side
- TPT%
- transplacental transfer percent
- tss
- time to achieve the steady state
- Vch
- medium volume in maternal chamber
- Vfc
- volume of fetal capillaries
- Vfr
- fetal reservoir volume
- Vfv
- sampling port volume for umbilical vein
- Vma
- sampling port volume for maternal artery
- Vmi
- maternal intervillous volume
- Vmp
- maternal placenta volume
- Vmr
- maternal reservoir volume
- Vt
- volume of syncytiotrophoblasts
- Copyright © 2020 The Author(s).
This is an open access article distributed under the CC BY Attribution 4.0 International license.


