


Abstract
The physiologic and pharmacologic roles of the blood-arachnoid barrier (BAB) remain unclear. Therefore, the purpose of the present study was to comprehensively evaluate and compare the absolute protein expression levels of transporters in the leptomeninges and plexus per cerebrum, and to determine the localizations of transporters at the cerebrospinal fluid (CSF)-facing and blood (dura)-facing plasma membranes of the BAB in pig. Using multidrug resistance protein 1 (MDR1) and organic anion transporter (OAT) 1 as blood (dura)-facing and CSF-facing plasma membrane marker proteins, respectively, we established that breast cancer resistance protein (BCRP), multidrug resistance-associated protein (MRP) 4, organic anion-transporting polypeptide (OATP) 2B1, multidrug and toxin extrusion protein 1 (MATE1), and glucose transporter 1 (GLUT1) are localized at the blood-facing plasma membrane, and OAT3, peptide transporter (PEPT) 2, MRP3, organic cation transporter (OCT) 2, xCT, monocarboxylate transporter (MCT) 1, MCT4, and MCT8 are localized at the CSF-facing plasma membrane of the BAB. The absolute protein expression levels of OAT1, OAT3, MDR1, BCRP, PEPT2, xCT, MATE1, OCT2, and 4f2hc in the whole BAB surrounding the entire cerebrum were much larger than those in the total of the choroid plexuses forming the blood-cerebrospinal fluid barrier (BCSFB). Although MRP4, OATP2B1, MCT8, GLUT1, and MCT1 were also statistically significantly more abundant in the BAB than in the choroid plexuses per porcine cerebrum, these transporters were nevertheless almost equally distributed between the two barriers. In contrast, OATP1A2, MRP1, OATP3A1, and OCTN2 were specifically expressed in the choroid plexus. These results should be helpful in understanding the relative overall importance of transport at the BAB compared with that at the BCSFB, as well as the rank order of transport capacities among different transporters at the BAB, and the directions of transport mediated by individual transporters.
SIGNIFICANCE STATEMENT We found that BCRP, MRP4, OATP2B1, MATE1, and GLUT1 localize at the blood-facing plasma membrane of the blood-arachnoid barrier (BAB), while OAT3, PEPT2, MRP3, OCT2, xCT, MCT1, MCT4, and MCT8 localize at the CSF-facing plasma membrane. 4F2hc is expressed in both membranes. For OAT1, OAT3, MDR1, BCRP, PEPT2, xCT, MATE1, OCT2, and 4f2hc, the absolute protein expression levels in the whole BAB surrounding the entire cerebrum are much greater than the total amounts in the choroid plexuses.
Introduction
Studies of the central nervous system (CNS) barriers have often focused on the blood-brain barrier (BBB). However, many aspects of substance exchange between the peripheral blood and CNS cannot be explained solely in terms of the transport systems at the BBB. The arachnoid membrane covers the cerebrospinal fluid (CSF) in the subarachnoid space, which contains about 80% of the total CSF volume (Thorne, 2014). The arachnoid membrane consists of arachnoid epithelial cells linked by tight junctions, and is called the blood-arachnoid barrier (BAB). The epithelial cells have polarized dual plasma membranes on the blood (dura)- and CSF-facing sides. Although the leptomeninges consist of arachnoid membrane, pia mater, and subarachnoid space containing the CSF, only the arachnoid membrane forms tight junctions and serves to separate the CSF and circulating blood sides. Yasuda et al. (2013) reported that multiple transporters are expressed in leptomeninges at the mRNA level, and we subsequently found that oat3 and oatp1a4 contribute to the elimination of anionic compounds from the CSF in rodents (Zhang et al., 2018; Yaguchi et al., 2019). Therefore, the BAB may be a major elimination route for organic anions from the CNS. However, it is not clear whether the results obtained in rodent studies adequately reflect the role of the BAB in large animals, including human beings, because large interspecies differences have been found in the protein expression levels of transporters (Kubo et al., 2015). Not only organic anions, but also neurotoxic cations produced in the CNS [creatinine, N-methylnicotinamide (NMN), etc.] are eliminated from the CNS. For example, large amounts of creatinine are produced from creatine in the brain, but cannot be eliminated via the BBB. Nevertheless, the subarachnoid CSF concentration is much lower than the brain concentration in humans (Marescau et al., 1992; De Deyn et al., 2001), so it is plausible that creatinine may be mainly eliminated from the CSF at the BAB. However, it is not yet known which cation transporters are expressed at the BAB.
Substance exchange between CSF and blood is known to be mediated via the blood-cerebrospinal fluid barrier (BCSFB), which consists of choroid plexus epithelial cells. It is crucial to clarify the functional significance of the transport systems of the BAB, compared with those of the BCSFB, to understand the physiologic role of the BAB. Since our first report on quantitative targeted absolute proteomics (qTAP) (Kamiie et al., 2008), we have quantified multiple proteins (including transporters, enzymes, and receptors) in plasma membrane fractions prepared from a variety of tissues and cells using protein concentration units of femtomole per 1 μg protein of plasma membrane fraction (femtomoles per microgram protein) (Ohtsuki et al., 2012, 2013; Uchida et al., 2015a,b). We also recently employed this unit to compare the protein concentrations of transporters in the plasma membrane fractions of leptomeninges and choroid plexus in rat (Zhang et al., 2018). However, neither losses of plasma membrane during plasma membrane preparation nor the relative whole-tissue amounts of leptomeninges and choroid plexuses were taken into account. Thus, the relative transport contributions of the whole BAB in one brain and the whole BCSFB of four ventricles remain unclear. To more deeply understand the physiologic roles of the BAB and BCSFB, we also need to investigate the differences in the transport systems of the BAB among different lobes of the brain, as well as those in the BCSFB among different ventricles.
Another important issue is to clarify the membrane localizations of transporters in the BAB. Whether the BAB contributes to CSF-to-blood efflux or blood-to-CSF influx of substances would depend on whether transporters are localized at the CSF-facing or blood (dura)-facing plasma membranes. Interestingly, an immunostaining study indicated that breast cancer resistance protein (BCRP), an efflux transporter of xenobiotics, is expressed on both sides of plasma membranes in arachnoid epithelial cells (Yasuda et al., 2013). This was a dramatic finding because BCRP is always localized at the apical (luminal) membrane in other tissue barriers. Therefore, the membrane localizations of transporters at the BAB may be different from those in the BCSFB and BBB, and establishing the differences may be the key to understanding the role of BAB.
Thus, the purpose of the present study was to clarify the absolute abundances of a wide range of transporters at the whole BAB and whole BCSFB in porcine cerebrum, as well as the regional differences among the four different cerebral lobes and four ventricles, by means of qTAP. We also aimed to clarify the CSF-facing/blood-facing membrane localizations of transporters at the BAB. For the present study, we selected the pig as a target animal because porcine biology, including genome, anatomy, physiology, and disease progression, reflects human biology more closely than is the case for many other experimental animals (Walters et al., 2011; Patabendige et al., 2013) and porcine tissues are readily available compared with tissues of other large animals.
Materials and Methods
Materials.
Unlabeled (standard) and stable isotope-labeled (internal standard) peptides for quantifying targeted proteins were designed by using the in silico peptide selection criteria that we reported previously (Kamiie et al., 2008) and were synthesized by SCRUM Inc. (Tokyo, Japan) and Thermo Fisher Scientific (Sedanstrasse, Germany) with >95% peptide purity. The concentrations of peptide solutions were quantified by quantitative amino acid analysis using a high-performance liquid chromatography UV system with postcolumn ninhydrin derivatization (LaChrom Elite; Hitachi, Tokyo, Japan). Other chemicals used were commercial products of analytical grade.
Porcine brain tissues isolated from healthy pigs at about 6 months after birth (100–120 kg of body weight, male:female = 1:1, without any drug treatment) were purchased from Tokyo Sibaura Zouki Inc. (Tokyo, Japan). The protocols for the present study were approved by the Livestock Hygiene Service Center authorized by the Ministry of Health, Labor and Welfare, and the Ministry of Agriculture, Forestry and Fisheries in Japan.
Preparation of Plasma Membrane Fraction and Whole-Tissue Lysate of Porcine Leptomeninges and Choroid Plexus and the Experimental Parameters Used for Unit Conversions of Protein Expression Level.
The leptomeninges were isolated separately from the frontal, parietal, occipital, and temporal lobes of porcine cerebrum. Choroid plexuses were isolated separately from the right-lateral, left-lateral, third, and fourth ventricles of porcine brain. The tissue weights of all leptomeninges and the choroid plexus of each ventricle from one porcine cerebrum and the weight of 1 cm2 leptomeninges were measured (Supplemental Table 1). For each region of leptomeninges and choroid plexus, tissue of a specific weight (described as tissue weight used for plasma membrane preparation in Supplemental Table 1) was used for the preparation of whole-tissue lysate. Subsequently, almost all of the prepared whole-tissue lysate (except for a part of this lysate used for the proteomics experiment) were used for plasma membrane preparation. The plasma membrane fractions were prepared as described previously (Uchida et al., 2015b). The protein concentrations of whole-tissue lysate and plasma membrane fraction were determined by the Lowry method, which are summarized in Supplemental Table 1, together with the volume of solution used to dissolve whole-tissue lysate and plasma membrane fraction. The protein expression levels of the following marker proteins in the whole-tissue lysate and plasma membrane fraction were determined by means of qTAP, as described subsequently. Anion exchanger 2 (AE2) and organic anion transporter (OAT) 1 are specifically expressed at the plasma membrane of epithelial cells in choroid plexus and leptomeninges, respectively (Christensen et al., 2013; Zhang et al., 2018). They were used as marker proteins in quantifications of choroid plexus and leptomeninges samples, respectively (Supplemental Table 1). These experimental parameters were used for unit conversions of protein expression levels, as described subsequently. The plasma membrane fractions and whole-tissue lysates were stored at −80°C.
Separation of CSF- and Blood-Facing Plasma Membranes of Arachnoid Epithelium from Porcine Leptomeninges by Density-Gradient Ultracentrifugation.
The isolated leptomeninges from porcine whole cerebrums were minced well with scissors on ice and homogenized in hypotonic buffer [10 mM Tris-HCl, 10 mM NaCl, and 1.5 mM MgCl2 (pH 7.4)], using a Potter-Elvehjem glass homogenizer (10 up-and-down strokes with rotation at 1000 rpm and 4°C). After incubation for 30 minutes on ice, 20 up-and-down strokes were applied with rotation at 1000 rpm and 4°C. The resulting homogenate was subjected to nitrogen cavitation twice at 1500 psi for 15 minutes at 4°C. The homogenate thus obtained was centrifuged twice at 10,000g for 10 minutes at 4°C and the resulting supernatant was centrifuged at 100,000g for 40 minutes at 4°C. The pellet was suspended in suspension buffer [10 mM Tris-HCl and 250 mM sucrose (pH 7.4)], layered on top of a 24%/27%/30% (w/v) sucrose density gradient solution, and centrifuged at 195,700g for 3 hours at 4°C. The three turbid layers at the interfaces (first layer, top/24%; second layer, 24%/27%; third layer, 27%/30%) were recovered and each was suspended in suspension buffer and centrifuged at 100,000g for 40 minutes at 4°C. The resultant pellets were suspended in the suspension buffer to obtain the individual membrane fractions. The Lowry method with the DC Protein Assay Reagent (Bio-Rad Laboratories, Hercules, CA) was used to measure protein concentrations. The membrane fractions were stored at −80°C.
Lysyl Endopeptidase and Trypsin Digestion for Quantitative Targeted Absolute Proteomics.
The plasma membrane fractions, separated membrane fractions, and whole-tissue lysates were subjected to LysC and trypsin digestion according to the reported protocol for qTAP (Uchida et al., 2013, 2015b).
Clean-Up of Peptide Samples for qTAP-Based Liquid Chromatography–Tandem Mass Spectrometry Analysis.
The peptide samples (equivalent to 25 µg protein) were spiked with 750 fmol of stable isotope-labeled peptides, and cleaned up as described subsequently.
For the measurement using nanoLC-TripleTOF5600: after overlaying a 200 µl tip GL-SDB (GL Sciences Inc., Tokyo, Japan) on a 200 µl tip GL-GC (GL Sciences Inc.), 200 μl of 100% acetonitrile was added to the combined tip and centrifuged at 3000g and 10°C for 5 minutes. Then, 200 μl of 50% acetonitrile/50% water/0.5% formic acid was added to the tips and centrifuged at 3000g and 10°C for 5 minutes. Next, 200 μl of 0.1% trifluoroacetic acid (TFA)/water was added to the tips and centrifuged at 3000g and 10°C for 5 minutes. The peptide samples were added to the tips and centrifuged at 3000g and 10°C for 5 minutes. Then, 200 μl of 0.1% TFA/water was added to the tips and centrifuged at 3000g and 10°C for 5 minutes. The same operation was repeated two more times. Next, 200 μl of 0.5% formic acid/water was added to the tips and centrifuged at 3000g and 10°C for 5 minutes, and the same operation was performed again. After overlaying the 200 µl tip GL-GC on the 200 µl tip GL-SDB, 60 μl of 50% acetonitrile/50% water/0.5% formic acid was added to the tips and centrifuged at 3000g and 10°C for 5 minutes to elute the peptides, and the same operation was performed again.
For the measurement using microLC-QTRAP5500: after overlaying a 200 μl tip GL-SDB on a 200 μl tip GL-GC, 50 μl of 80% acetonitrile/0.1% TFA was added to the tips and centrifuged at 3000g and 10°C for 5 minutes. Then, 50 μl of 0.1% TFA/water was added to the tips and centrifuged at 3000g and 10°C for 5 minutes. The peptide samples were added to the tips and centrifuged at 3000g and 10°C for 5 minutes. Next, 50 μl of 0.1% TFA/water was added to the tips and centrifuged at 3000g and 10°C for 5 minutes, and the same operation was performed again. After overlaying the 200 µl tip GL-GC on the 200 µl tip GL-SDB, 50 μl of 80% acetonitrile/0.1% TFA was added to the tips and centrifuged at 3000g and 10°C for 5 minutes to elute peptides, and the same operation was performed again.
The subsequent procedure was the same as for the measurement using nanoLC-TripleTOF5600 and microLC-QTRAP5500; the eluted peptide solution was dried in a centrifugal concentrator CC-105 (TOMY) under vacuum (around 40°C and 1 hour). The residue was reconstituted with 2% acetonitrile/98% water/0.1% formic acid and centrifuged at 15,000g for 10 minutes, and the supernatant was used for liquid chromatography–tandem mass spectrometry analysis.
For the calibration curve, tryptic digests were obtained from 25 µg protein of Escherichia coli lysate and spiked with unlabeled (standard) peptides (0, 5, 10, 15, 20, 50, 100, 150, 750, 2000, or 4000 fmol for the points of 0, 0.2, 0.4, 0.6, 0.8, 2, 4, 6, 8, 30, 80, or 160 fmol/µg protein, respectively) and 750 fmol of stable isotope-labeled (internal standard) peptides. The amino acid sequence of each internal standard peptide was identical to that of the corresponding standard peptide, and an amino acid residue of the internal standard peptide was labeled with stable isotopes (13C and 15N). The calibration curve samples were acidified with TFA and cleaned up as described previously.
Quantification of Target Proteins in qTAP-Based Liquid Chromatography–Tandem Mass Spectrometry Analysis.
The measurements of the plasma membrane fractions and whole-tissue lysates of leptomeninges and choroid plexus were performed by parallel reaction monitoring using the nanoLC-TripleTOF5600 system (SCIEX, Framingham, MA) or by selected reaction monitoring using the microLC-QTRAP5500 system (SCIEX), as previously reported (Sadiq et al., 2015; Uchida et al., 2019). The measurements of the separated membrane fractions of leptomeninges were performed in the sequential window acquisition of all theoretical (SWATH) fragment ion spectra mode as follows. The cleaned up peptide samples were injected into an Ekspert nanoLC 425 system (Eksigent Technologies, Dublin, CA) coupled with an electrospray-ionization TripleTOF5600 mass spectrometer (SCIEX), which was set up for a single direct injection. The peptides were directly loaded onto a self-packed C18 analytical column, prepared by packing ProntoSIL 200-3-C18 AQ beads (3 μm, 200 Å; Bischoff Chromatography, Germany) in a PicoFrit tip (75 μm i.d.; New Objective) of 20 cm length. After sample loading, the peptides were separated and eluted with a linear gradient of 2% B (0 minutes), 35% B (120 minutes), 100% B (121–125 minutes), and 2% B (126–155 minutes); mobile phase A, 0.1% formic acid in water, and mobile phase B, 0.1% formic acid in acetonitrile. The flow rate was 300 nl/min. The eluted peptides were positively ionized and measured in the SWATH mode: SWATH window, 64 variable windows from 400 to 1200 m/z; product ion scan range, 50–2000 m/z; declustering potential, 100; rolling collision energy value, 0.0625 × (m/z of each SWATH window) − 3.5; collision energy spread, 15; and accumulation time, 0.05 seconds for each SWATH window. In the parallel reaction monitoring, selected reaction monitoring, and SWATH modes, the target peptides listed in Supplemental Table 2 were quantified. MultiQuant software (SCIEX) was used for data analysis. Signal peaks over 1000 counts detected at the same retention time as an internal standard peptide were defined as positive. When positive peaks were observed in at least three sets of transitions, the protein molecules were considered to be expressed in the sample of interest, and the protein expression levels (femtomole per microgram protein) were calculated using the peak area ratio (native peptide/internal standard peptide) and the calibration curve. The limit of quantification was calculated as described previously (Uchida et al., 2015b).
Unit Conversion of Protein Expression Level from Femtomole per Microgram Protein to Picomole per Pig Cerebrum.
It is necessary to compare the absolute abundances of transporters in the BAB and BCSFB in one porcine cerebrum to understand and compare the physiologic and pharmacologic roles of the BAB and BCSFB. Here, we describe how the unit of protein expression level is converted from femtomole per microgram protein to picomole per pig cerebrum.
The recovery of plasma membrane protein of epithelial cells in the plasma membrane preparation (D) was calculated from experimental parameters (Supplemental Table 1) as follows: (1)where B4 and C4 are the absolute amounts of the epithelial cell plasma membrane marker (AE2 or OAT1) in the total plasma membrane fraction and whole-tissue lysate, respectively (in picomoles); B1 (micrograms of protein per microliter) and C1 (milligrams of protein per milliliter) are the protein concentrations of plasma membrane fraction and whole-tissue lysate, respectively; B2 (in microliters) and C2 (in milliliters) are the solution volumes of the plasma membrane fraction and whole-tissue lysate, respectively; and B3 and C3 are the epithelial cell plasma membrane marker (AE2 or OAT1) expression levels in plasma membrane fraction and whole-tissue lysate, respectively (femtomoles per microgram of protein).
The ratio to convert the absolute amount of target protein in plasma membrane fraction to that in whole-tissue lysate (E) was calculated using D (Supplemental Table 1) as follows: (2)The correction factor to convert the units from femtomoles per microgram of protein in the plasma membrane fraction to picomoles per gram of wet weight of choroid plexus and leptomeninges (where F is in milligrams of protein per gram of tissue) was calculated using the experimental parameters (Supplemental Table 1) as follows:
 (3)where A is the tissue weight used for plasma membrane preparation (in grams of tissue).
The protein expression level of the target protein in units of picomoles per gram of wet weight of choroid plexus and leptomeninges was calculated as follows: (4)where the protein expression level in the plasma membrane fraction is in units of femtomoles per microgram of protein; and F is in milligrams of protein per gram of tissue. The protein expression level of the target protein in units of picomole per pig cerebrum was calculated as follows:
 (5)where the protein expression level is in units of picomoles per gram of wet weight of choroid plexus and leptomeninges; and G is the tissue weight per pig cerebrum (grams of tissue per pig cerebrum) (Supplemental Table 1). To calculate the protein expression level (picomoles per pig cerebrum) in the leptomeninges, the average of the protein expression levels (picomoles per gram of wet weight of leptomeninges) of the four regions and the tissue weight of whole leptomeninges from one cerebrum (grams of tissue per pig cerebrum) were used.
Estimation of CSF- and Blood (dura)-Facing Plasma Membrane Localization.
The CSF- and blood (dura)-facing plasma membrane localizations of transporters were estimated according to our mathematical method (Kubo et al., 2015) with minor modifications. Multidrug resistance protein 1 (MDR1) localizes at the blood (dura)-facing plasma membrane (Yasuda et al., 2013). Our functional study of oat1 has shown that the elimination of para-aminohippuric acid, a substrate of oat1, from cisternal CSF was inhibited by the oat1 inhibitors cephalothin and ceftriaxone 15 minutes after intracisternal administration, as was expected from the relationship of the cisternal CSF concentration and IC50(oat1) of the inhibitors (Zhang et al., 2018). This suggests that oat1 is involved in the transport of para-aminohippuric acid from CSF to arachnoid epithelial cells at the CSF-facing plasma membrane. Therefore, MDR1 and OAT1 were considered as blood (dura)- and CSF-facing plasma membrane markers at the BAB, respectively, in the present localization analysis. The fcsf and fblood (dura) values represent the extent of CSF- and blood (dura)-facing membrane distributions, respectively, and were calculated as follows: (6)
(6) (7)where Pu,1 and Pu,3 are the protein abundances (femtomoles per microgram of protein) of the molecule of interest in the first turbid layer between the top and 24% sucrose and the third turbid layer between 27% and 30% sucrose, respectively; Pu is the total protein abundance (femtomoles per microgram of protein) of the molecule of interest in the first, second, and third turbid layers; Pcsf,1 and Pcsf,3 are the protein abundances (femtomoles per microgram of protein) of the CSF-facing membrane marker OAT1 in the first and third turbid layers, respectively; Pcsf is the total protein abundance (femtomoles per microgram of protein) of OAT1 in the first, second, and third turbid layers; Pblood,1 and Pblood,3 are the protein abundances (femtomoles per microgram of protein) of the blood-facing membrane marker MDR1 in the first and third turbid layers, respectively; and Pblood is the total protein abundance (femtomoles per microgram of protein) of MDR1 in the first, second, and third turbid layers.
Statistical Analysis.
Unless otherwise indicated, all data are the mean ± S.E.M. Statistical significances of differences between two groups were determined using the Welch t test and the P values were adjusted by the Bonferroni method in cases of multiple testing by using R software version 3.5.3; P values less than 0.05 were considered statistically significant.
Results
Unit of Femtomole per Microgram Protein: Absolute Protein Expression Levels of 34 Transporters and Six Marker Proteins in 1 μg Protein of Plasma Membrane Fractions of the Choroid Plexuses in Four Different Ventricles and the Leptomeninges in Four Different Lobes of Cerebrum.
To understand whether there is a difference in the transport functions of the BAB among the four different lobes of cerebrum and to clarify the difference in the protein expression between the BAB and the four ventricular BCSFB, the protein expression levels of 34 transporters (which mediate transport of a range of endogenous bioactive compounds and xenobiotics) were measured in the plasma membrane fractions of the leptomeninges isolated from the frontal, parietal, occipital, and temporal lobes and choroid plexuses isolated from the right lateral, left lateral, third, and fourth ventricles. Twenty transporters were detected and their protein expression levels were determined (Table 1). The other 14 transporters were not detected. The limits of quantification for all of the molecules are listed in Supplemental Table 3. Multidrug and toxin extrusion protein 1 (MATE1), organic cation transporter (OCT) 2, and amino acid transporter A2 were detected in the leptomeninges, but not in the choroid plexus, except for MATE1 and OCT2 in the third ventricle. On the other hand, multidrug resistance-associated protein (MRP) 1, organic anion-transporting polypeptide (OATP) 1A2, OATP3A1, and OCTN2 were detected in the choroid plexus, but not in the leptomeninges. The regional differences among the four choroid plexuses were within a 2-fold range for most of the transporters, except OAT1, OAT3, and MRP4 (2.44-, 2.01-, and 2.06-fold differences, respectively). The regional differences among the four leptomeninges were also within a 2-fold range, except for MRP4 and MATE1 (2.04- and 2.92-fold differences, respectively).
Protein concentrations of 34 transporters and six marker proteins in 1 μg protein of plasma membrane fractions of choroid plexuses isolated from the four ventricles and leptomeninges isolated from the four cerebral lobes (unit: femtomoles per microgram protein)
Plasma membrane fractions of porcine choroid plexus and leptomeninges were prepared from the pooled and freshly isolated choroid plexus tissues and freshly isolated leptomeninges of 10–30 pigs. The plasma membrane fractions were digested with Lys-C and trypsin. Using the digested peptide samples spiked with internal standard peptides, all of the target molecules were quantified by liquid chromatography–tandem mass spectrometry. Four sets of transitions were used for each peptide pair (target peptide and the corresponding internal standard peptide). The protein expression levels represent the mean ± S.E.M. (three to four transitions × three measurements, except for xCT, which was quantified using two sets of transitions). Max/Min represents the ratio of the maximum value to the minimum value among the four ventricular choroid plexuses, or among the leptomeninges in the four cerebral lobes. The values of the limit of quantification are shown in parenthesis.
To compare the extent of contamination with other cells and the purity of plasma membrane among the samples, six marker proteins were quantified (Table 1). The average of the absolute abundances of vascular endothelial cell marker platelet endothelial cell adhesion molecule 1 from the four choroid plexuses was 1.31-fold greater than that from the four leptomeninges. Astrocyte marker glial fibrillary acidic protein and neuron marker synaptophysin showed 3.72- and 1.74-fold greater expression levels in leptomeninges compared with choroid plexus, respectively, based on the average values of the four leptomeninges and the four choroid plexuses. The absolute abundances of AE2 (choroid plexus epithelial cell plasma membrane marker), Na+/K+-ATPase (plasma membrane marker), and γ-GTP (plasma membrane marker) were within 1.24-, 1.12-, and 1.53-fold ranges, respectively, among the four choroid plexuses. The absolute abundances of Na+/K+-ATPase and γ-GTP were within 1.08- and 1.22-fold ranges, respectively, among the four leptomeninges.
Absolute Protein Expression Levels of 20 Transporters and Six Marker Proteins in 1 g Wet Weight of Choroid Plexus in Four Different Ventricles (Picomoles per Gram of Wet Weight of Choroid Plexus) and in 1 g Wet Weight of Leptomeninges in Four Different Lobes of Cerebrum (Picomoles per Gram of Wet Weight of Leptomeninges).
To more precisely understand the regional differences in protein expression levels, it is important to correct the values for differences in the purity of plasma membrane in the plasma membrane fraction. We chose AE2 and OAT1 as markers of the plasma membrane of epithelial cells in choroid plexus and leptomeninges, respectively (Christensen et al., 2013; Zhang et al., 2018). As described in Materials and Methods, the protein expression levels of 20 transporters and six marker proteins in units of picomoles per gram of wet weight of the choroid plexus and leptomeninges (Supplemental Table 4) were estimated using the protein expression levels of AE2 and OAT1 in the plasma membrane fraction and whole-tissue lysate (Supplemental Table 1). The differences among the four regions were within a 2-fold range for most of the molecules, except for MATE1 and glial fibrillary acidic protein, which were within 3.21- and 2.13-fold ranges, respectively, in the four leptomeninges (Supplemental Table 4).
Unit of Picomole per Pig Cerebrum: Absolute Protein Expression Levels of 20 Transporters and Six Marker Proteins in the Whole Choroid Plexuses and Whole Leptomeninges in One Porcine Cerebrum.
To understand the differences in the physiologic and pharmacologic roles of BAB and BCSFB in cerebrum per one pig, we need to compare the absolute abundances of transporters in the whole BAB and the whole BCSFB in one porcine cerebrum. The protein expression level (picomoles per pig cerebrum) of a target protein at the BAB of whole cerebrum (Table 2) was estimated by multiplying the tissue weight of whole leptomeninges from one cerebrum (Supplemental Table 1) by the average of the four regional protein expression levels in units of picomoles per gram of wet weight of leptomeninges (Supplemental Table 4). To estimate the total protein expression level (picomoles per pig cerebrum) of a target protein in the four choroid plexuses (Table 2), the protein expression level in units of picomoles per gram of wet weight of choroid plexus (Supplemental Table 4) was multiplied by the tissue weight of the choroid plexus per pig cerebrum in each ventricle (Supplemental Table 1), and then summed over the four choroid plexuses. The protein expression levels (picomoles per pig cerebrum) of OCT2, MATE1, OAT1, OAT3, xCT, peptide transporter (PEPT) 2, BCRP, and MDR1 in the whole leptomeninges were 89.8-, 32.8-, 8.94-, 7.76-, 6.50-, 5.79-, 4.29-, and 1.84-fold greater than those in the whole choroid plexuses, respectively (Table 2). The level of 4F2hc, which is an anchor protein of xCT, glucose transporter 1 (GLUT1), large amino acid transporter 1, etc., was 3.77-fold greater in leptomeninges than that in the choroid plexus. MRP4, OATP2B1, monocarboxylate transporter (MCT) 8, GLUT1, and MCT1 proteins were also significantly more abundant in the whole leptomeninges than in the whole choroid plexuses, but their leptomeninges/choroid plexus ratios were each within a 1.58-fold range.
Protein expression levels of 20 transporters and six marker proteins in all choroid plexuses and all leptomeninges of one porcine cerebrum (unit: picomoles per pig cerebrum)
The protein expression levels (picomoles per pig cerebrum) in the choroid plexus of each ventricle and all of the choroid plexuses and leptomeninges of one porcine cerebrum were calculated using Supplemental Table 4 as described in Materials and Methods. The protein expression levels represent the mean ± S.E.M. The values of the limit of quantification are shown in parenthesis. The total of four choroid plexuses was calculated by summing the protein expression levels in the individual ventricles. For the ULQ proteins in all four ventricles the sum of the four limits of quantification is shown. For the proteins detected in one, two, or three regions out of four, the sum was calculated only using the protein expression levels in the regions detected. The protein expression levels in the whole leptomeninges of one cerebrum were divided by the total of four choroid plexuses to obtain the leptomeninges/choroid plexus ratio. Statistical significance of differences between the whole leptomeninges and total choroid plexuses was determined using the Welch t-test; the P values were adjusted by the Bonferroni method.
The Distribution of 14 Transporters and Two Marker Proteins in CSF- and Blood (dura)-Facing Plasma Membrane at the BAB of Porcine Cerebrum.
Parameters fcsf and fblood (dura) describe the degree of distribution of target proteins in the CSF- and blood (dura)-facing plasma membranes, respectively. As described in Materials and Methods, these parameters were estimated using the protein abundances of target proteins in the three separated membrane fractions and those of the blood-facing membrane marker MDR1 and CSF-facing membrane marker OAT1 (Table 3). This localization estimation method using the protein abundances has been previously established and its mathematical method has been described in detail (Kubo et al., 2015). In a plot of the two parameters (Fig. 1), OAT3, MRP3, PEPT2, OCT2, MCT1, MCT4, xCT, and MCT8 were located near OAT1, while MRP4, OATP2B1, MATE1, BCRP, and GLUT1 were located near MDR1. 4F2hc was positioned in the middle of OAT1 and MDR1. When the plot was divided into regions, as shown by the broken lines in Fig. 1, the vascular endothelial cell marker platelet endothelial cell adhesion molecule 1 and astrocyte marker glial fibrillary acidic protein were located in different regions from the transporters estimated to be distributed in the CSF- or blood-facing plasma membranes (Fig. 1).
Quantitative analysis of 14 transporters, vascular endothelial marker PECAM1, astrocyte marker GFAP, blood-facing marker MDR1, and CSF-facing marker OAT1 in the three membrane fractions separated by sucrose density gradient ultracentrifugation of cerebral leptomeninges
Leptomeninges freshly isolated from porcine cerebrum were homogenized in a Potter-Elvehjem glass homogenizer and subjected to nitrogen cavitation twice at 1500 psi for 15 minutes at 4°C. The homogenate was centrifuged at 10,000g and the resultant supernatant was centrifuged at 100,000g. The pellet was suspended in suspension buffer [10 mM Tris-HCl and 250 mM sucrose (pH 7.4)], layered on top of a 24%/27%/30% (w/v) sucrose density gradient solution, and centrifuged at 195,700g for 3 hours at 4°C. The three turbid layers at the interfaces (the first layer, top/24%; the second layer, 24%/27%; the third layer, 27%/30%) were recovered, and each was suspended in suspension buffer and centrifuged at 100,000g. The resultant pellets were suspended in the suspension buffer to obtain the individual membrane fractions. The protein abundance (femtomole per microgram protein) of the target proteins in the three separated membrane fractions were measured three times by the qTAP method. The values of fcsf and fblood(dura) were calculated as described in Materials and Methods. The data are the mean ± S.E.M. of three measurements.

Quantitative determination of the CSF- or blood (dura)-facing plasma membrane localizations at the BAB of porcine cerebrum for 14 transporters, vascular endothelial marker platelet endothelial cell adhesion molecule 1 (PECAM1), and astrocyte marker glial fibrillary acidic protein (GFAP). The values of fcsf and fblood(dura) were taken from Table 3 and are plotted as the mean ± S.E.M. of three measurements. Bold lines go through the origin, and the broken lines were drawn at −0.4, 0.2, 0.8, and 1.4 on the x and y axes. MDR1 is located at fblood(dura) = 1 and fcsf = 0 as a blood (dura)-facing plasma membrane transporter. OAT1 is located at fblood(dura) = 0 and fcsf = 1 as a CSF-facing plasma membrane transporter. A solid line passes through MDR1 and OAT1. The proteins located close to fblood(dura) = 1 and fcsf = 0 should be localized at the blood (dura)-facing plasma membrane at the BAB. The proteins located close to fblood(dura) = 0 and fcsf = 1 should be localized at the CSF-facing plasma membrane at the BAB. Closed circles indicate transporters estimated to localize at the blood-facing plasma membrane. Open circles indicate transporters estimated to localize at the CSF-facing plasma membrane. The gray circle indicates 4F2hc, which is expressed at both CSF- and blood-facing plasma membranes. The open square indicates the vascular endothelial cell marker PECAM1 and the closed triangle indicates the astrocyte marker GFAP.
Discussion
The present study is the first to establish the polarized localization and absolute abundance of transporters at the BAB in porcine cerebrum (Fig. 2). Using MDR1 and OAT1 as blood (dura)-facing and CSF-facing plasma membrane marker proteins, respectively, we found that BCRP, MRP4, OATP2B1, MATE1, and GLUT1 localize at the blood-facing plasma membrane, while OAT3, PEPT2, MRP3, OCT2, xCT, MCT1, MCT4, and MCT8 localize at the CSF-facing plasma membrane. 4F2hc was expressed in both membranes. For OAT1, OAT3, MDR1, BCRP, PEPT2, xCT, MATE1, OCT2, and 4f2hc, absolute protein expression levels in the whole BAB surrounding the entire cerebrum were much greater than the total amounts in the choroid plexuses. Although MRP4, OATP2B1, MCT8, GLUT1, and MCT1 proteins were also statistically significantly more abundant in the BAB than the choroid plexuses per porcine cerebrum, they were almost equally distributed between the two barriers. These results demonstrate the importance of transport functions at the BAB compared with choroid plexus consisting of BCSFB. They also enable us to quantitatively understand the transport directions of individual transporters and the rank order of transport activity among different transporters at the BAB.
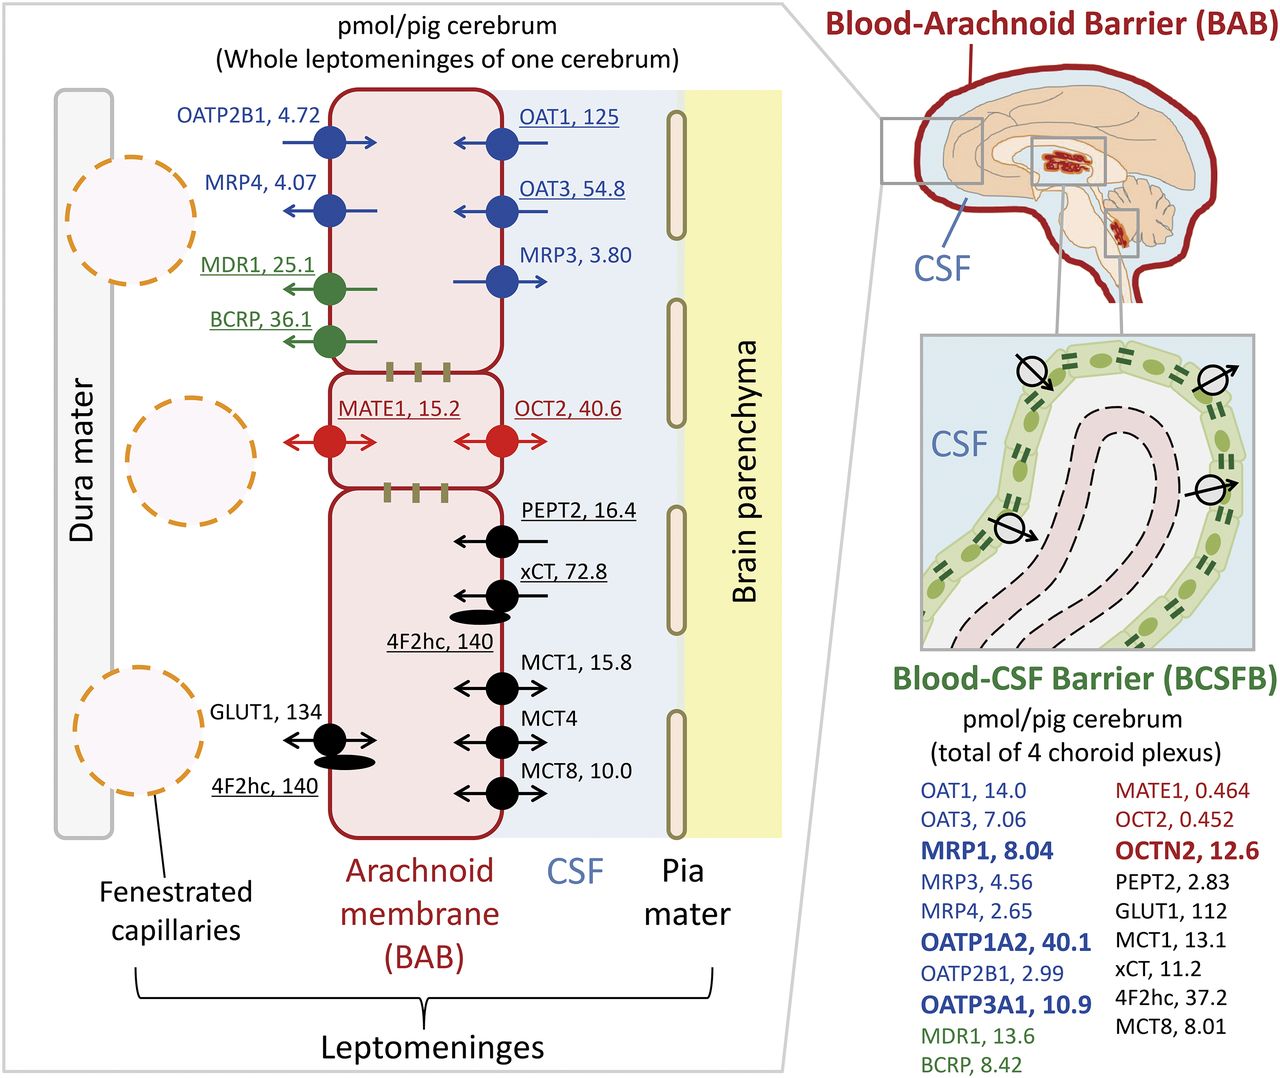
Summary of key findings at the porcine BAB and BCSFB in the present study, which illustrates the protein expression levels of transporters at the whole BAB and BCSFB in one porcine cerebrum (picomole per pig cerebrum) and the determined localizations of transporters at the blood (dura)- or CSF-facing plasma membrane of arachnoid epithelial cells. The number next to each transporter name represents the protein expression level with the unit of picomoles per pig cerebrum. The underlined transporters are >1.8-fold more abundantly expressed at the BAB than the BCSFB. The four transporters indicated in bold were detected only in the choroid plexus, but not in the leptomeninges. Blue, organic anion transporters; red, organic cation transporters; green, lipophilic drug transporters; black, endogenous compound transporters.
The elimination of organic anionic neurotoxins from the CNS is essential to maintain the homeostasis of brain function. We have previously shown that organic anion transporters at the BBB eliminate anionic neurotoxins such as the major catecholamine metabolite homovanillic acid and uremic toxins in rodents (Mori et al., 2003; Deguchi et al., 2006). However, in contrast to rodents, protein expression of OAT, OATP, and MRP family members at the BBB of large animals, including human beings, has either not been detected or has been detected at only extremely low levels compared with rodents (Uchida et al., 2011; Zhang et al., 2017). We also reported that the protein expression levels of these anion transporters in the choroid plexus were smaller in human than in rat (Uchida et al., 2015b). In contrast, our present results show that OAT1 and OAT3 are abundantly expressed in the leptomeninges of porcine cerebrum, and their levels (27.2 and 12.1 fmol/μg protein) (Table 1) are 9.97- and 1.82-fold greater than those reported in rat leptomeninges, respectively (Zhang et al., 2018). Furthermore, as shown in Table 2, OAT1 and OAT3 were 8.94- and 7.76-fold more abundant in the whole BAB than in the total choroid plexuses per porcine cerebrum, respectively. These results suggest that the contribution of BAB to the elimination of organic anions from CNS is large in pig compared with rodent. Because homovanillic acid is selectively transported by human OAT1 (Shen et al., 2018), it has been identified as an endogenous biomarker to quantify the in vivo transport activity of OAT1. In dog, the concentration of homovanillic acid in cisterna magna is 28-fold smaller than that in brain ventricles, and is increased by 8-fold by oral administration of probenecid, an inhibitor of OAT1 (Guldberg et al., 1966). By contrast, probenecid did not increase the ventricular concentration very much (1.5-fold) (Guldberg et al., 1966). These results support the idea that the transport activity of OAT1 is much larger at the BAB compared with the choroid plexus, although we cannot rule out the possibility that the probenecid concentration after oral administration is higher in cisternal CSF than in ventricular CSF.
PEPT2 is involved in the elimination of the sleep hormone melatonin (Huo et al., 2017), small neuropeptides (L-kyotorphin and carnosine), and peptidomimetics from CSF (Keep and Smith, 2011). The whole BAB per porcine cerebrum has a 5.79-fold greater expression level than the total choroid plexus per porcine cerebrum (Table 2). These results suggest that the transport function of PEPT2 at the BAB is greater than that at the choroid plexus in pig. Because approximately 80% of the CSF exists in the subarachnoid space (Thorne, 2014), more abundant expression of PEPT2 in the BAB than the BCSFB seems reasonable from the viewpoint of efficient elimination of endogenous substrates from CSF. Melatonin is secreted from the pineal gland to brain ventricles and acts on periventricular tissues to induce sleep. In sheep, the concentration of melatonin in ventricles is extremely high, while that in cisterna magna is low (Shaw et al., 1989). The low expression of PEPT2 in the choroid plexus and high expression at the BAB thus seem reasonable in terms of maintaining melatonin action in the periventricular tissues and its efficient clearance from the CNS in response to light (upon awakening).
Glucocorticoids such as cortisol are stress-responsive hormones synthesized in the adrenal cortex and are endogenous substrates of P-glycoprotein (P-gp). Because excess entry of glucocorticoids into the CNS causes neurotoxicity and decreases proliferation of nerve and hippocampus cells (Abrahám et al., 2001; Anacker et al., 2013), its penetration into CNS is limited by P-gp under normal conditions. However, in meningitis, which is an inflammation of the leptomeninges, the glucocorticoid penetrates into the inflamed leptomeninges and plays anti-inflammatory and immunomodulatory roles to suppress the meningitis. We have reported that the efflux activity of P-gp rapidly decreases during acute inflammation and oxidative stress in brain capillary endothelial cells (Hoshi et al., 2017, 2019). Therefore, decreased efflux activity of P-gp at the BAB may play a role in smoothly delivering glucocorticoids to the inflamed leptomeninges in the acute phase of meningitis.
MATE1 and OCT2 eliminate various organic cations including xenobiotics and endogenous compounds in the kidney, but have been thought not to play a major role in transport across the BAB because their expression has not been detected at the BAB thus far (Yasuda et al., 2013). Several exogenous (1-methyl-4-phenylpyridinium and tetraethylammonium) and endogenous (creatinine and NMN) cationic neurotoxins can be transported by MATE1 and OCT2 (Terada et al., 2006; Tanihara et al., 2007; Müller et al., 2015; Chu et al., 2016). In brain, creatinine is continually generated nonenzymatically from creatine in large amounts, but is eliminated from the CNS efficiently. This is important because accumulation of creatinine causes convulsions (Tachikawa et al., 2008). Since creatinine cannot be eliminated via the BBB and its CSF concentration is much smaller than the brain concentration in humans, it is thought to be eliminated mainly from the CSF (Tachikawa et al., 2008). OCT3 and creatine transporter 1 at the BCSFB have been considered as elimination pathways based on a rodent study (Tachikawa et al., 2008), but the protein expression levels at the BCSFB (see Table 1 for OCT3; see Uchida et al., 2015a for creatine transporter 1) are much lower than those of MATE1 and OCT2 in the leptomeninges (Table 1). Furthermore, NMN is generated from nicotinamide by nicotinamide N-methyltransferase in the CNS. Excessive production of NMN, as well as 1-methyl-4-phenylpyridinium, may be involved in the pathogenesis of Parkinson’s disease, but the concentration of NMN is maintained at a low level under healthy conditions (Williams and Ramsden, 2005). The >30-fold more abundant expression levels of MATE1 and OCT2 in the leptomeninges compared with choroid plexus (Table 2) and the estimated membrane localization of these two transporters (Fig. 1; Table 3) suggest that, rather than BCSFB, MATE1 at the blood-facing membrane and OCT2 at the CSF-facing membrane at the BAB play major roles in the elimination from CSF of cationic neurotoxins produced in the CNS.
Although Yasuda et al. (2013) reported that BCRP is expressed at both CSF- and blood-facing plasma membranes, we found here that BCRP localizes at the blood-facing plasma membrane at the BAB, like MDR1 (Fig. 1; Table 3). BCRP mediates drug efflux from the brain at the luminal membrane of the BBB and drug influx into CSF in brain ventricles at the CSF-facing plasma membrane of choroid plexus epithelial cells. Knockout of the BCRP gene in mice increases the penetration of substrates into the brain while decreasing penetration into ventricular CSF (Shen et al., 2009). These results suggest that brain concentrations of substrates are regulated by BCRP at the BBB, while ventricular CSF concentrations are regulated by BCRP at the BCSFB. We have already shown that the corresponding transporters at the BAB regulate the concentrations of substrates in cisternal CSF (Zhang et al., 2018; Yaguchi et al., 2019). The CSF-to-plasma concentration ratios of the BCRP-selective substrates daidzein and genistein in cisterna magna are 3.96- and 2.54-fold larger, respectively, in bcrp-knockout mice than in wild-type mice (Kodaira et al., 2011), and this supports the idea that BCRP limits the penetration of substrates into CSF at the blood-facing plasma membrane of the BAB. It should be noted that Yasuda et al. (2013) determined the BCRP localization by using immortalized arachnoid epithelial cells, but immortalization might have disrupted the polarized localization of BCRP since it would potentially impair cell-to-cell tight junctions, which maintain the polarity of membrane transporters. However, the localization analysis in the present study still has several issues because sucrose density gradient ultracentrifugation cannot clearly separate the blood- and CSF-facing plasma membranes of arachnoid epithelial cells, and also cannot clearly separate their plasma membranes from the membrane fractions of other cells (such as pia mater, vessels, and dura mater) contained in the leptomeninges isolated at the beginning of the experiment. An electron microscopic immunogold localization study would be needed in the future to confirm the transporter localizations estimated in the present study.
It is an important issue whether the pig is an appropriate model for humans and monkeys in terms of the BAB transporters. For P-gp, the protein expression levels are within 1.5-fold difference between pigs and humans in both the brain capillaries (BBB) and choroid plexus (BCSFB) (Kubo et al., 2015; Uchida et al., 2015b) (Table 1). Based on this similarity between pigs and humans, it is plausible that the protein expression level of P-gp is similar in pigs and humans at the BAB as well as the BBB and BCSFB. Because the protein expression levels of transporters in monkeys are almost the same as those in humans, e.g., at the BBB (Ohtsuki et al., 2011), the monkey BAB could also express P-gp protein at a similar level to pig (5.42 fmol/μg protein, average of four regions of leptomeninges) (Table 1). This level is 3-fold smaller than that in the rat leptomeninges (16.6 fmol/μg protein) (Zhang et al., 2018). Although P-gp gene knockout increases the CSF concentrations of P-gp substrates in rodents (Kodaira et al., 2011), the inhibition of P-gp activity does not increase the CSF concentration of nelfinavir (P-gp substrate) in monkeys (Kaddoumi et al., 2007). This can be explained by the lower protein expression level of P-gp at the BAB in monkeys.
Regarding transporters other than P-gp at the BCSFB, many transporters such as OAT3, MRP1, MRP4, MDR1, and MCT1 have similar protein expression levels in pigs (Table 1) and humans (Uchida et al., 2015b), although some transporters such as OATP1A2 and MATE1 show large differences between pigs and humans. This suggests that the relationship of protein expression levels between the BAB and BCSFB found in the present study using pigs may be preserved in human and monkey for some transporters, although not all. Therefore, absolute quantification using the human and monkey samples will be necessary in the future to clarify the differences in the roles of the BAB and BCSFB in human and monkey.
In conclusion, the present study is the first to clarify the differences in the absolute protein abundance of transporters at the BAB and BCSFB per porcine head, as well as their membrane localizations at the BAB (Fig. 2). Our results indicate that the transport systems at the BAB may make a greater overall contribution than those at the BCSFB. This information about the transport capacities and directions of substances across the BAB should lead to a better understanding of the physiologic and pharmacologic roles of the BAB.
Acknowledgments
We thank A. Niitomi for secretarial assistance.
Authorship Contributions
Participated in research design: Uchida, Usui, Tachikawa, Terasaki.
Conducted experiments: Goto, Takeuchi, Łuczak.
Contributed new reagents or analytic tools: Uchida, Goto.
Performed data analysis: Uchida, Goto, Takeuchi, Łuczak.
Wrote or contributed to the writing of the manuscript: Uchida, Goto, Terasaki.
Footnotes
- Received September 26, 2019.
- Accepted November 19, 2019.
This study was supported in part by Grants-in-Aids from the Japanese Society for the Promotion of Science for Young Scientists (A) [KAKENHI Grant 16H06218], Scientific Research (B) [KAKENHI Grant 17H04004], Bilateral Open Partnership Joint Research Program (between Finland and Japan), Fostering Joint International Research (A) [KAKENHI Grant 18KK0446], and Early-Career Scientists [KAKENHI Grant 19K16438]. This study was also supported in part by Grants-in-Aids from the Ministry of Education, Culture, Sports, Science and Technology for Scientific Research on Innovative Areas [KAKENHI Grant 18H04534], and the Mochida Memorial Foundation for Medical and Pharmaceutical Research. M.Ł. was supported by a Research Fellowship Program (2019) from Matsumae International Foundation.
T.T. is a full professor at Tohoku University, and also a director of Proteomedix Frontiers Co., Ltd. This study was not supported by Proteomedix Frontiers Co., Ltd., and his position at Proteomedix Frontiers Co., Ltd. did not influence the design of the study, the collection of the data, the analysis or interpretation of the data, the decision to submit the manuscript for publication, or the writing of the manuscript and did not present any financial conflicts. The other authors declare no competing interests.
↵
 This article has supplemental material available at dmd.aspetjournals.org.

Abbreviations
- AE2
- anion exchanger 2
- BAB
- blood-arachnoid barrier
- BBB
- blood-brain barrier
- BCRP
- breast cancer resistance protein
- BCSFB
- blood-cerebrospinal fluid barrier
- CNS
- central nervous system
- CSF
- cerebrospinal fluid
- GLUT1
- glucose transporter 1
- MATE1
- multidrug and toxin extrusion protein 1
- MCT
- monocarboxylate transporter
- MDR1
- multidrug resistance protein 1
- MRP
- multidrug resistance-associated protein
- NMN
- N-methylnicotinamide
- OAT
- organic anion transporter
- OATP
- organic anion-transporting polypeptide
- OCT
- organic cation transporter
- PEPT
- peptide transporter
- P-gp
- P-glycoprotein
- qTAP
- quantitative targeted absolute proteomics
- SWATH
- sequential window acquisition of all theoretical
- TFA
- trifluoroacetic acid
- Copyright © 2020 by The American Society for Pharmacology and Experimental Therapeutics


