


Abstract
Organic cation transporter 1 (OCT1) plays a role in hepatic uptake of drugs, affecting in vivo exposure, distinguished primarily through pharmacogenetics of the SLC22A1 gene. The role of OCT1 in vivo has not been confirmed, however, via drug–drug interactions that similarly affect exposure. In the current research, we used Oct1/2 knockout mice to assess the role of Oct1 in hepatic clearance and liver partitioning of clinical substrates and assess the model for predicting an effect of OCT1 function on pharmacokinetics in humans. Four OCT1 substrates (sumatriptan, fenoterol, ondansetron, and tropisetron) were administered to wild-type and knockout mice, and plasma, tissue, and urine were collected. Tissue transporter expression was evaluated using liquid chromatography-mass spectrometry. In vitro, uptake of all compounds in human and mouse hepatocytes and human OCT1- and OCT2-expressing cells was evaluated. The largest effect of knockout was on hepatic clearance and liver partitioning of sumatriptan (2- to 5-fold change), followed by fenoterol, whereas minimal changes in the pharmacokinetics of ondansetron and tropisetron were observed. This aligned with uptake in mouse hepatocytes, in which inhibition of uptake of sumatriptan and fenoterol into mouse hepatocytes by an OCT1 inhibitor was much greater compared with ondansetron and tropisetron. Conversely, inhibition of all four substrates was evident in human hepatocytes, in line with reported clinical pharmacogenetic data. These data confirm the role of Oct1 in the hepatic uptake of the four OCT1 substrates and elucidate species differences in OCT1-mediated hepatocyte uptake that should be considered when utilizing the model to predict effects in humans.
SIGNIFICANCE STATEMENT Studies in carriers of SLC22A1 null variants indicate a role of organic cation transporter 1 (OCT1) in the hepatic uptake of therapeutic agents, although OCT1-mediated drug–drug interactions have not been reported. This work used Oct1/2 knockout mice to confirm the role of Oct1 in the hepatic clearance and liver partitioning in mice for OCT1 substrates with reported pharmacogenetic effects. Species differences observed in mouse and human hepatocyte uptake clarify limitations of the knockout model for predicting exposure changes in humans for some OCT1 substrates.
Introduction
Data implicating the role of organic cation transporter 1 (OCT1) in the hepatic uptake of therapeutic agents have intermittently emerged in the past two decades. In vitro, it was recognized that variants in OCT1 had decreased uptake of substrates, including clinical compounds such as metformin, following which it was demonstrated in the clinic that OCT1 function was related to metformin’s glucose-lowering effect (Shu et al., 2003, 2007). Although larger studies report conflicting results on the role of OCT1 function in metformin efficacy (Zhou et al., 2011; Dujic et al., 2017), positron emission tomography imaging of 11C-metformin has confirmed a role of OCT1 in at least metformin hepatic disposition by direct measurement of metformin uptake into the liver in humans in vivo, demonstrating a difference in liver exposure in subjects with and without OCT1 variant alleles (Jensen et al., 2016). Given that the liver is not the major clearance organ for metformin, large changes in the plasma exposure with differences in OCT1 function would not be expected, and indeed only minor effects of OCT1 variants on the plasma pharmacokinetics of metformin are observed clinically (Shu et al., 2008; Jensen et al., 2016). However, other therapeutic agents have been identified as OCT1 substrates in vitro, including sumatriptan, fenoterol, morphine, and 5HT3-receptor antagonists, which are cleared via the liver in humans. For each of these, single studies have indicated an effect of OCT1 genotype on the plasma clearance in the clinic, in turn leading to altered pharmacodynamic effects (Tzvetkov et al., 2012, 2013, 2018; Matthaei et al., 2016). These data are in agreement with in vitro activity for the OCT1 variants; whereas there appears a substrate-dependent effect on in vitro activity for some variants, for each of the studied OCT1 substrates there are OCT1 alleles that demonstrate no active uptake (Tzvetkov et al., 2012, 2013, 2018; Matthaei et al., 2016). Change in systemic exposure in the clinical studies is demonstrated in carriers of these variants with no in vitro activity for the substrate.
Although the effect of variants of SLCO1B1, encoding the protein OATP1B1, has substantial evidence for affecting in vivo exposure of organic anion-transporting polypeptide (OATP) substrates, the drug–drug interactions (DDIs) with OATP inhibitors are generally even larger, most likely because these variants have reduced, but not completely abolished transporter function, and because of overlapping substrate affinity between OATPs in the liver (Shitara et al., 2013). Conversely, although the pharmacogenetic effects of OCT1 are in agreement with in vitro studies and have been exemplified with multiple substrates, DDIs involving OCT1 have not yet been identified with these same clinical substrates. The only DDI reported to involve OCT1 indicated an effect of verapamil, an OCT1 inhibitor, on the pharmacodynamic effect of metformin. However, again, as the plasma clearance of metformin is not through the liver, plasma pharmacokinetic changes due to OCT1 inhibition were not detected (Cho et al., 2014). As of yet, no DDIs that affect the plasma clearance of an OCT1 substrate have been reported, which would significantly aid in further understanding the role of this transporter in vivo. Additional evidence of the role of OCT1 in hepatic clearance in vivo, even in preclinical species, would aid in validation, particularly with the ability to assess in vitro–to–in vivo correlation and substantiate the effect of transporter function on systemic exposure with that on liver partitioning. As such, mice void of organic cation transporters have previously been used to evaluate and confirm the role of Octs in the clearance and tissue partitioning of metformin. Data in both Oct1 and Oct1/2 knockout mice confirmed a decrease in liver:plasma partitioning in the absence of Octs (Wang et al., 2002; Shu et al., 2007; Higgins et al., 2012). Changes in metformin clearance, however, could only be observed in mice void of both Oct 1 and 2, as clearance is predominantly reliant on Oct2 in the kidney. As such, the effects and utility of Oct1/2 knockout mice to predict the effect of OCT1 on the plasma exposure in humans have not been evaluated using clinical substrates eliminated by the liver. In this research, we sought to evaluate the pharmacokinetics of four known OCT1 substrates in Oct1/2 knockout mice, compounds for which clinical pharmacogenetic effects of OCT1 have been demonstrated, to confirm the role of Oct1 in the hepatic clearance in vivo and to assess the Oct1/2 knockout model for predicting effects of OCT1 function in humans.
Materials and Methods
Materials.
Sumatriptan succinate, fenoterol hydrobromide, ondansetron hydrochloride, and tropisetron hydrochloride were purchased from Thermo Fisher Scientific (Waltham, MA). Metformin hydrochloride was purchased from U.S. Pharmacopeia (Rockville, MD). 3H-sumatriptan and 14C-metformin were purchased from American Radiolabeled Chemicals (St. Louis, MO). InVitroGRO HT medium, Krebs–Henseleit buffer (KHB), and male human cryopreserved hepatocytes (lot BRB) were purchased from Bioreclamation IVT (Westbury, NY). Rodent hepatocyte thawing medium and mouse hepatocytes (lot MBL192) were purchased from Lonza (Walkersville, MD). Buffers for cell culture and uptake (Dubecco’s PBS, HEPES, 4-morpholineethanesulfonic acid, NH4Cl, and calcium- and magnesium-free DPBS) were purchased from Thermo Fisher Scientific. Formic, acetic and trifluoroacetic acids, ammonium bicarbonate, digitonin, dithiothreitol, imipramine hydrochloride, verapamil hydrochloride, Triton X-100, sodium deoxycholate, β-casein, and iodoacetamide were from Sigma-Aldrich (St. Louis, MO). The Thermo Scientific Pierce BCA Protein Assay Kit was obtained from VWR International (Radnor, PA). Acetonitrile (high-pressure liquid chromatography grade) was from Fisher Scientific (Pittsburgh, PA). Mass spectrometry grade Trypsin Gold was purchased from Promega (Madison, WI) (product V5280). A Picopure 2 system (Hydro Service and Supplies, Durham, NC) was used to produce purified water. All of the stable isotope-labeled (SIL) (13C and 15N) proteotypic tryptic, purified and calibrated, peptide standards (SpikeTides_TQL) were purchased from JPT Peptide Technologies (Berlin, Germany). The standards are supplied with a tryptic linker, used for determining concentration at time of manufacture, at the C terminus, and thus are added to samples before digestion in order that the linker be released. Solid-phase extraction cartridges were Strata-X 33u polymeric reversed phase (10 mg/ml, part 8B S100 AAK) obtained from Phenomenex (Torrance, CA).
In Vivo Studies.
Breeding pairs of Oct1/2−/− mice were purchased from Taconic Biosciences (Rensselaer, NY), and a colony was maintained with Taconic, from which all knockout mice were obtained. Age-matched wild-type FVB mice were also obtained directly from Taconic. Studies were carried out at Covance (Greenfield, IN) and were approved by the Institutional Animal Care and Use Committee. Groups of male mice (25–30 g, age 8–14 weeks) were administered sumatriptan succinate, fenoterol hydrobromide, ondansetron hydrochloride, and tropisetron hydrochloride both intravenously (2 mg/kg) via the tail vein and orally (5 or 20 mg/kg, in the case of fenoterol) by gavage. Following compound administration, serial blood concentrations were collected as dried blood spots. For tropisetron, blood was collected on DMPK-A cards, to prevent cleavage by plasma esterases. At the end of blood pharmacokinetic studies, nine tissues (liver, spleen, kidney, duodenum, heart, lung, brain, muscle, and testes) were collected for transporter quantitation via liquid chromatography-mass spectrometry (LC-MS/MS). Separate groups of mice were housed eight/cage, and each compound was administered intravenously (2 mg/kg), following which urine was collected over 24 hours in metabolism cages. Additional groups were administered each compound intravenously (2 mg/kg), then sacrificed at time points for tissue collection to determine tissue concentrations (n = 7–16/time point); tissues were collected and snap-frozen in liquid nitrogen. Nine tissues (liver, spleen, kidney, duodenum, heart, lung, brain, muscle, and testes), blood, and plasma were collected at 0.75, 1.5, 2, and 3 hours following sumatriptan administration, and four tissues (liver, spleen, kidney, duodenum), blood, and plasma at 0.75 and 2 hours following administration of fenoterol, ondansetron, and tropisetron. For tropisetron, plasma was collected in tubes pretreated with phenylmethylsulfonyl fluoride (PMSF) and blood was again collected on DMPK-A cards. All samples were stored at −80°C prior to analysis of either drug concentrations or transporter quantitation. In pooled animal groups in which urine was collected, creatinine was measured in both plasma and urine using an enzymatic assay, to determine recovery of urine over the time frame.
LC-MS/MS Quantitation of Transporter Expression in Mouse Tissues.
The membrane fraction from tissue samples was prepared using an adapted differential surfactant extraction method, employing two surfactants (Ramsby and Makowski, 1999). Following gentle homogenization, the tissues were treated with digitonin. After light centrifugation, the pellets were treated with Triton X-100. For each sample extract, the total protein concentration was measured using the Thermo Scientific Pierce BCA Protein Assay Kit, enabling 20 µg aliquots to be measured for analyzing by the LC-MS/MS–targeted quantitative proteomic method (Fallon et al., 2013, 2016; Khatri et al., 2019). Membrane/Microsomal protein (20 µg) was pipetted into polymerase chain reaction tubes and evaporated in a ThermoSavant SpeedVac. To the tubes were then added 100 µl 50 mM ammonium bicarbonate, 10 µl 40 mM dithiothreitol, 10 µl β-casein (0.5 µg/10 µl), and 13.3 µl 10% sodium deoxycholate (to give a concentration of 1%). Samples were heated at 60°C, shaking at 500 rpm, for 40 minutes in an Isotemp Thermal Mixer (Fisher Scientific) to denature and reduce. After cooling to room temperature, 135 mM iodoacetamide (10 µl) was added and samples were then incubated in the dark for 30 minutes at room temperature. One picomole of each SIL peptide was then added from SIL peptide mixes used routinely and prepared in the laboratory. The concentration of each peptide in the mixes was 1 pmol per 10 µl. Ten microliters of 0.1 µg/µl trypsin in 50 mM acetic acid was then added to each sample to give a trypsin:protein ratio of 1:20 (w/w). Samples were vortexed and digested for 20 hours at 37°C, shaking at 300 rpm, in the Isotemp Thermal Mixer. Following the digestion period, the reaction was stopped by the addition of 10% trifluoroacetic acid, such that the volume added was 10% of the total reaction volume. The samples were then vortex mixed, and the precipitate was pelleted by centrifugation at 13.3 Kg for 5 minutes. After transfer of the supernatant to fresh tubes, the samples were evaporated in the ThermoSavant SpeedVac for 10 minutes to remove residual acetonitrile present from the SIL peptide mixes. Solid-phase extraction was then performed on the samples using polymeric reversed-phase 10 mg/ml cartridges. Conditioning was with methanol and purified water. After adding sample, the solid phase was washed with water. Peptides were eluted with 60% acetonitrile/40% formic acid 0.1% into 0.5 ml Eppendorf Protein LoBind tubes. Eluate was evaporated in the ThermoSavant SpeedVac, and reconstitution was with 50 µl modified mobile phase A (0.1% formic acid/acetonitrile, 98/2, i.e., changed from 1% acetonitrile). The sample was centrifuged at 13.3 Kg for 5 minutes, and the supernatant was transferred to a deactivated vial insert for analysis by nanoLC-MS/MS. A laboratory human liver microsome (pooled, N = 50) quality control digest was also prepared in duplicate with the samples.
Analysis was performed on a nanoACQUITY (Waters, Milford, MA) coupled to a SCIEX QTRAP 5500 hybrid mass spectrometer (Framingham, MA) equipped with a NanoSpray III source. Control was by Analyst 1.5 software (SCIEX) and nanoACQUITY Ultra High-Performance Liquid Chromatography (UPLC) Console. Mobile phase A consisted of 1% acetonitrile and 0.1% formic acid. Mobile phase B was 100% acetonitrile. Injection volume was 0.1 µl (0.04 µg or 0.2% of the 20-µg sample). The trap column was a Waters Symmetry C18, 2G-VM, 180 µm × 20 mm, 5 µm particle size (cat. no. 186006527). Sample was trapped at a flow of 15 µl/min of mobile phase A for 1 minute. After elution from the trap column, peptides were separated on a Waters BEH130 C18 column, 150 µm × 100 mm, 1.7 µm particle size (cat. no. 186003550). Flow rate was 1.3 µl/min. The gradient was 100% of A to start, decreasing to 58% at 24 minutes, 5% at 24.5 minutes for 3 minutes, and returning to 100% at 28 minutes for 7 minutes, the total run time being 35 minutes. The temperature of the analytical column was 35°C. Multiple reaction monitoring (MRM) analysis was in the positive mode with the ion spray voltage being 4000. The nanospray was produced using a 20 µm inner diameter (10 µm tip) PicoTip emitter by New Objective (Woburn, MA). Data for MRMs specific to mouse Octs 1, 2, and 3 peptides and other mouse and human (applicable to the human liver microsome quality control) specific peptides, including for two membrane markers, were acquired. The relevant peptides used for each, heavy labeled, are in Supplemental Table 1. Equality of response between the SIL and unlabeled peptides for each MRM was assumed.
Generation of Virally-Transfected OCT1-Expressing Cells and Uptake In Vitro.
Full-length cDNA of human SLC22A1 (NM_003057) was synthesized and cloned into the pLenti6.3 vector. pLenti6.3 empty vector and pLenti6.3-OCT1 were transfected into a lentiviral package cell line Lenti-X-293T to produce lentivirus supernatants. HEK293 cells were then transduced with these two lentivirus supernatants, respectively, and a single clone was selected by blasticidin (5 µg/ml) to generate stable cell lines. OCT1 expression in HEK293 was confirmed by flow cytometry using antibody staining (catalogue NBP1-51684; Novusbio). HEK-293 stably-transfected cells with pLenti 6.3-empty vector, pLenti6.3-OCT1 were grown in 5% CO2 at 37°C in Dulbecco’s modified Eagle’s medium supplemented with 10% FBS, 50 µg/ml gentamicin, and 5 µg/ml blasticidin. Cell lines were maintained in T-75 flasks, reaching approximately 80% confluence before being passaged twice weekly at 1:10 ratio (volume:volume).
HEK293-vector control (VC), -OCT1, and -OCT2 cells were seeded onto 12-well poly-D lysine plates at concentrations ranging from 3.42 × 10⁵ to 7.22 × 10⁵ cells/ml. (OCT2-expressing cells were previously generated in-house by plasmid transfection.) Three days postseeding, the cells were washed twice with prewarmed pH 7.4 Hanks’ balanced salt solution buffer and preincubated with or without OCT inhibitor, 1-methyl-4-phenylpyridinium (MPP+) (1 mM), for 10 minutes at 37°C. Following the preincubation, cells were treated with the desired substrate with or without inhibitor for 1 minute at 37°C. After 1 minute at 37°C, the cells were washed three times with ice-cold Hanks’ balanced salt solution and extracted with 80% MeOH containing an internal standard mix for sample analysis via LC-MS/MS. A separate set of cells was used to confirm proper cell function using positive control substrate, 14C metformin, and protein concentration was determined by bicinchoninic acid method. Uptake was assessed in duplicate or triplicate in two separate experiments. Using the same experimental method, a range of substrate concentrations was used to assess the kinetics of each substrate in OCT1- and OCT2-expressing cells, using a time point of 1 minute at each concentration. Again, using a similar experimental method, a range of MPP+ concentrations was also assessed to determine the IC50 for OCT1 and OCT2, using sumatriptan as a substrate over 1 minute.
In Vitro Assessment of Lysosomal Trapping of OCT1 Substrates.
In uptake experiments, MPP+ was used as the OCT inhibitor, due to its reported lack of effect on lysosomal trapping (Kubo et al., 2016), an additional mechanism by which cations can be sequestered into cells, depending on their physicochemical properties. The role of lysosomal trapping on the cellular uptake of OCT1 substrates was assessed in vector control cells. For initial assessment, HEK293-VC cells were plated on poly-D-lysine–coated 12-well plates. Confluent cells (day 4) were rinsed twice with either Dulbecco’s PBS (DPBS) plus 10 mM HEPES or DPBS, 10 mM 4-morpholineethanesulfonic acid, and 20 mM NH4Cl and pH to 7.4 or 5.0, respectively. Cells were conditioned at either pH for 30 minutes at 37°C and then exposed to 25 nM test compound for 2 minutes in the same buffer and pH (pH 7.4 or pH 5). Following a 2-minute uptake, the cells were rinsed twice in cold calcium- and magnesium-free DBPS, and the intracellular contents were extracted with 80% MeOH containing an internal standard mix for LC-MS/MS analysis. Furthermore, the effect of other OCT inhibitors, imipramine and verapamil, on uptake of OCT1 substrates was assessed. Although imipramine and verapamil are reported to potently inhibit OCT1 and OCT2, they are also reported to affect lysosomal trapping (Kazmi et al., 2013; Kubo et al., 2016). To further assess the role of lysosomal trapping on the uptake on OCT1 substrates and to distinguish the effect of these inhibitors on OCT1 versus lysosomal trapping, uptake experiments were carried out similar to that using MPP+ above, using 100 μM imipramine or verapamil, in VC- and OCT-expressing cells.
In Vitro Hepatocyte Uptake.
Uptake of all compounds was evaluated in cryopreserved primary mouse and human hepatocytes in suspension using the oil–spin method (Morse et al., 2015). Hepatocytes were thawed at 37°C and then placed in InVitroGRO HT medium (human) or rodent hepatocyte thawing medium (mouse). Cells were spun down and reconstituted in KHB, and viability was determined to be >85% by trypan blue staining. The cells were then diluted to a density of 1.5 to 2 × 10⁶ viable cells/ml in KHB with 4% bovine serum albumin. Uptake was evaluated from 0.25 to 60 minutes at 1 µM at 37°C in the absence and presence of 1 mM MPP+. All time points were evaluated in triplicate in two experiments. H3-Sumatriptan was used as a positive control in all experiments. Cells were prewarmed for 5 minutes prior to the initiation of uptake. To initiate uptake, an equal volume of 4% bovine serum albumin in KHB containing twice the concentration of test article was added. The 100 µl aliquots were removed at specified time points and added to microcentrifuge tubes containing 100 µl 8:1 silicone (1.05 g/ml) to mineral oil (1.015 g/ml) mixture (final density = 1.027 g/ml) and 100 µl 5 M ammonium acetate, and then spun down using table-top centrifuges at 12,500 rpm for 15 seconds. Tubes were immediately placed on dry ice and stored at −80°C.
Determination of Concentration Samples Using LC-MS/MS.
For HEK samples, cells were lysed in 80/20 methanol/water for 5 minutes. Samples were loaded into a polymerase chain reaction plate containing 80:20 methanol cell extract:water with stable-labeled internal standard. Positive control samples were analyzed via scintillation. Tubes containing in vitro hepatocyte uptake samples were cut at the oil layer into 96-well deep-well plates, and an 80:20 methanol:water mix containing internal standard was added. Samples were sonicated for 4 hours on ice until the cells had lysed thoroughly. Tubes containing positive control samples were cut in a similar fashion and analyzed via scintillation. Concentrations were normalized by viable incubation cell concentration. The LC-MS/MS method details for cold sumatriptan, fenoterol, ondansetron, and fenoterol are given in Supplemental Materials.
Data and Statistical Analysis.
In vivo blood parameters were determined by noncompartmental analysis using Watson 7.2. Renal clearance (CLR) was determined as Ae/AUC, where Ae represents the amount recovered in urine, and AUC represents the area under the blood concentration–time curve (the mean AUC of animals administered the same dose of compound IV). The CLR was then corrected for creatinine recovery; the calculated CLR values were divided by [calculated creatinine CLR/reported creatinine clearance]. Creatinine CLR was calculated as above, and 14 ml/kg per minute was used as mouse creatinine clearance. Serum creatinine and creatinine clearance were similar in wild-type and knockout mice (Supplemental Fig. 1). Mean hepatic clearance was determined as total clearance-CLR (determined as one value for each compound, due to pooled nature of urine samples). Bioavailability (F) was calculated as AUCPO/AUCIV, after accounting for differences in dose. Fraction absorbed and fraction escaping metabolism in the gut (FaFg) were determined as FaFgFh = F, where fraction escaping first-pass hepatic extraction (Fh) = 1 − hepatic extraction ratio, using 125 ml/kg per minute as hepatic blood flow in mouse. Student’s t tests were used to determine statistically significant differences in pharmacokinetic parameters and tissue partitioning, using GraphPad Prism 8.1.1.
Following transporter expression LC-MS/MS analysis, MRM data processing was with MultiQuant 2.0.2 (SCIEX). One peptide was used to report protein concentration, with a second peptide, if available, being used as confirmation. Individual peptide concentrations were calculated from peak area ratios, for two MRMs summed, of unlabeled to corresponding SIL responses. Criteria for selecting peptides to report protein concentration included digestion stability, limit of detection, and quality control reproducibility (Fallon et al., 2013).
To determine statistically significant differences in uptake experiments, Student’s t tests were used to compare absolute uptake in OCT-transfected cells to VC cells, and to compare uptake in OCT-transfected cells with and without inhibitor. In VC cells with and without each inhibitor, one-way ANOVA was used to compare uptake in the presence of each inhibitor to control without inhibitor. To distinguish the effect of inhibitors on OCT-mediated transport, the effect of each inhibitor on VC cells was considered and the resulting ratios representing OCT-mediated uptake were calculated as the ratio of [mean uptake in OCT1 cells with/without inhibitor] over [mean uptake in VC cells with/without each inhibitor]. Inhibitor IC50 values for OCT1 and OCT2 were determined in GraphPad Prism 8.1.1 with the following equation: where Umin and Umax represent the minimum and maximum uptake, respectively, and [I] represents the concentration of inhibitor.
Km and Vmax values for OCT1 and OCT2 were determined using the equation below: where Vmax and Km represent the maximal rate of uptake and the concentration and half maximal rate of uptake, Pd represents passive diffusion and [S] represents substrate concentration.
Results
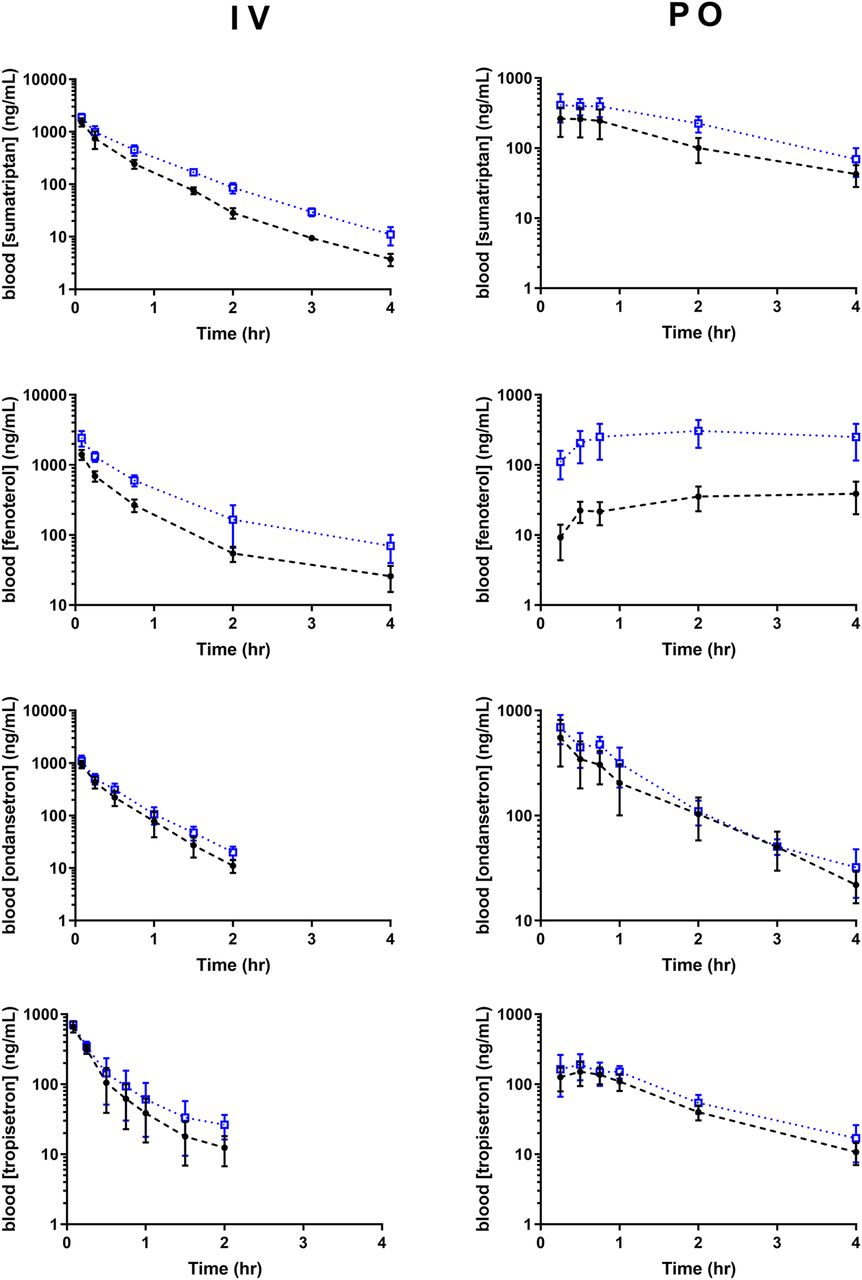
Blood concentration–time profiles of all four substrates in wild-type and knockout mice are shown in Fig. 1, and pharmacokinetic parameters in Table 1. Following intravenous administration, blood concentrations of all four substrates were higher in knockout mice compared with wild type, and intravenous clearance was significantly lower in knockout mice compared with wild type for every substrate, as shown in Table 1; however, effects were larger for sumatriptan and fenoterol than ondansetron and tropisetron. CLR was significant and involved active secretion for sumatriptan, fenoterol, and tropisetron. Oct1/2 knockout did not appear to affect CLR of sumatriptan or tropisetron, whereas that of fenoterol was decreased. After accounting for CLR, decreases in calculated hepatic clearance were observed for every compound. Following oral administration, exposure (AUC) was increased dramatically following oral administration of fenoterol in knockout compared with wild-type mice, and significantly increased following oral administration of sumatriptan and tropisetron, whereas no significant effect of knockout on ondansetron AUC was detected following oral administration. For comparison with previous data, the effect of Oct1/2 knockout on metformin in this colony of animals is shown in Supplemental Fig. 2. Similarly to that reported, metformin total clearance and liver partitioning were decreased in knockout mice, and F was similar between wild-type and knockout mice (Higgins et al., 2012).

Concentration profiles of OCT1 substrates in wild-type and Oct1/2−\− mice. Mice (n = 5–16/group) were administered all compounds intravenously (2 mg/kg) and orally (5 or 20 mg/kg for fenoterol), following which blood was collected. Solid black circles represent wild type, and open blue squares knockout mice. Data presented as mean ± S.D.
Pharmacokinetic parameters of OCT1 substrates in wild-type and Oct1/2−\− mice
Mice (n = 5–16/group) were administered all compounds intravenously (2 mg/kg) and orally (5 or 20 mg/kg for fenoterol). Data presented as mean (S.D.). Values beneath mean data represent ratio of wild-type/knockout mean values, when significant differences were determined or when mean-only values could be determined.
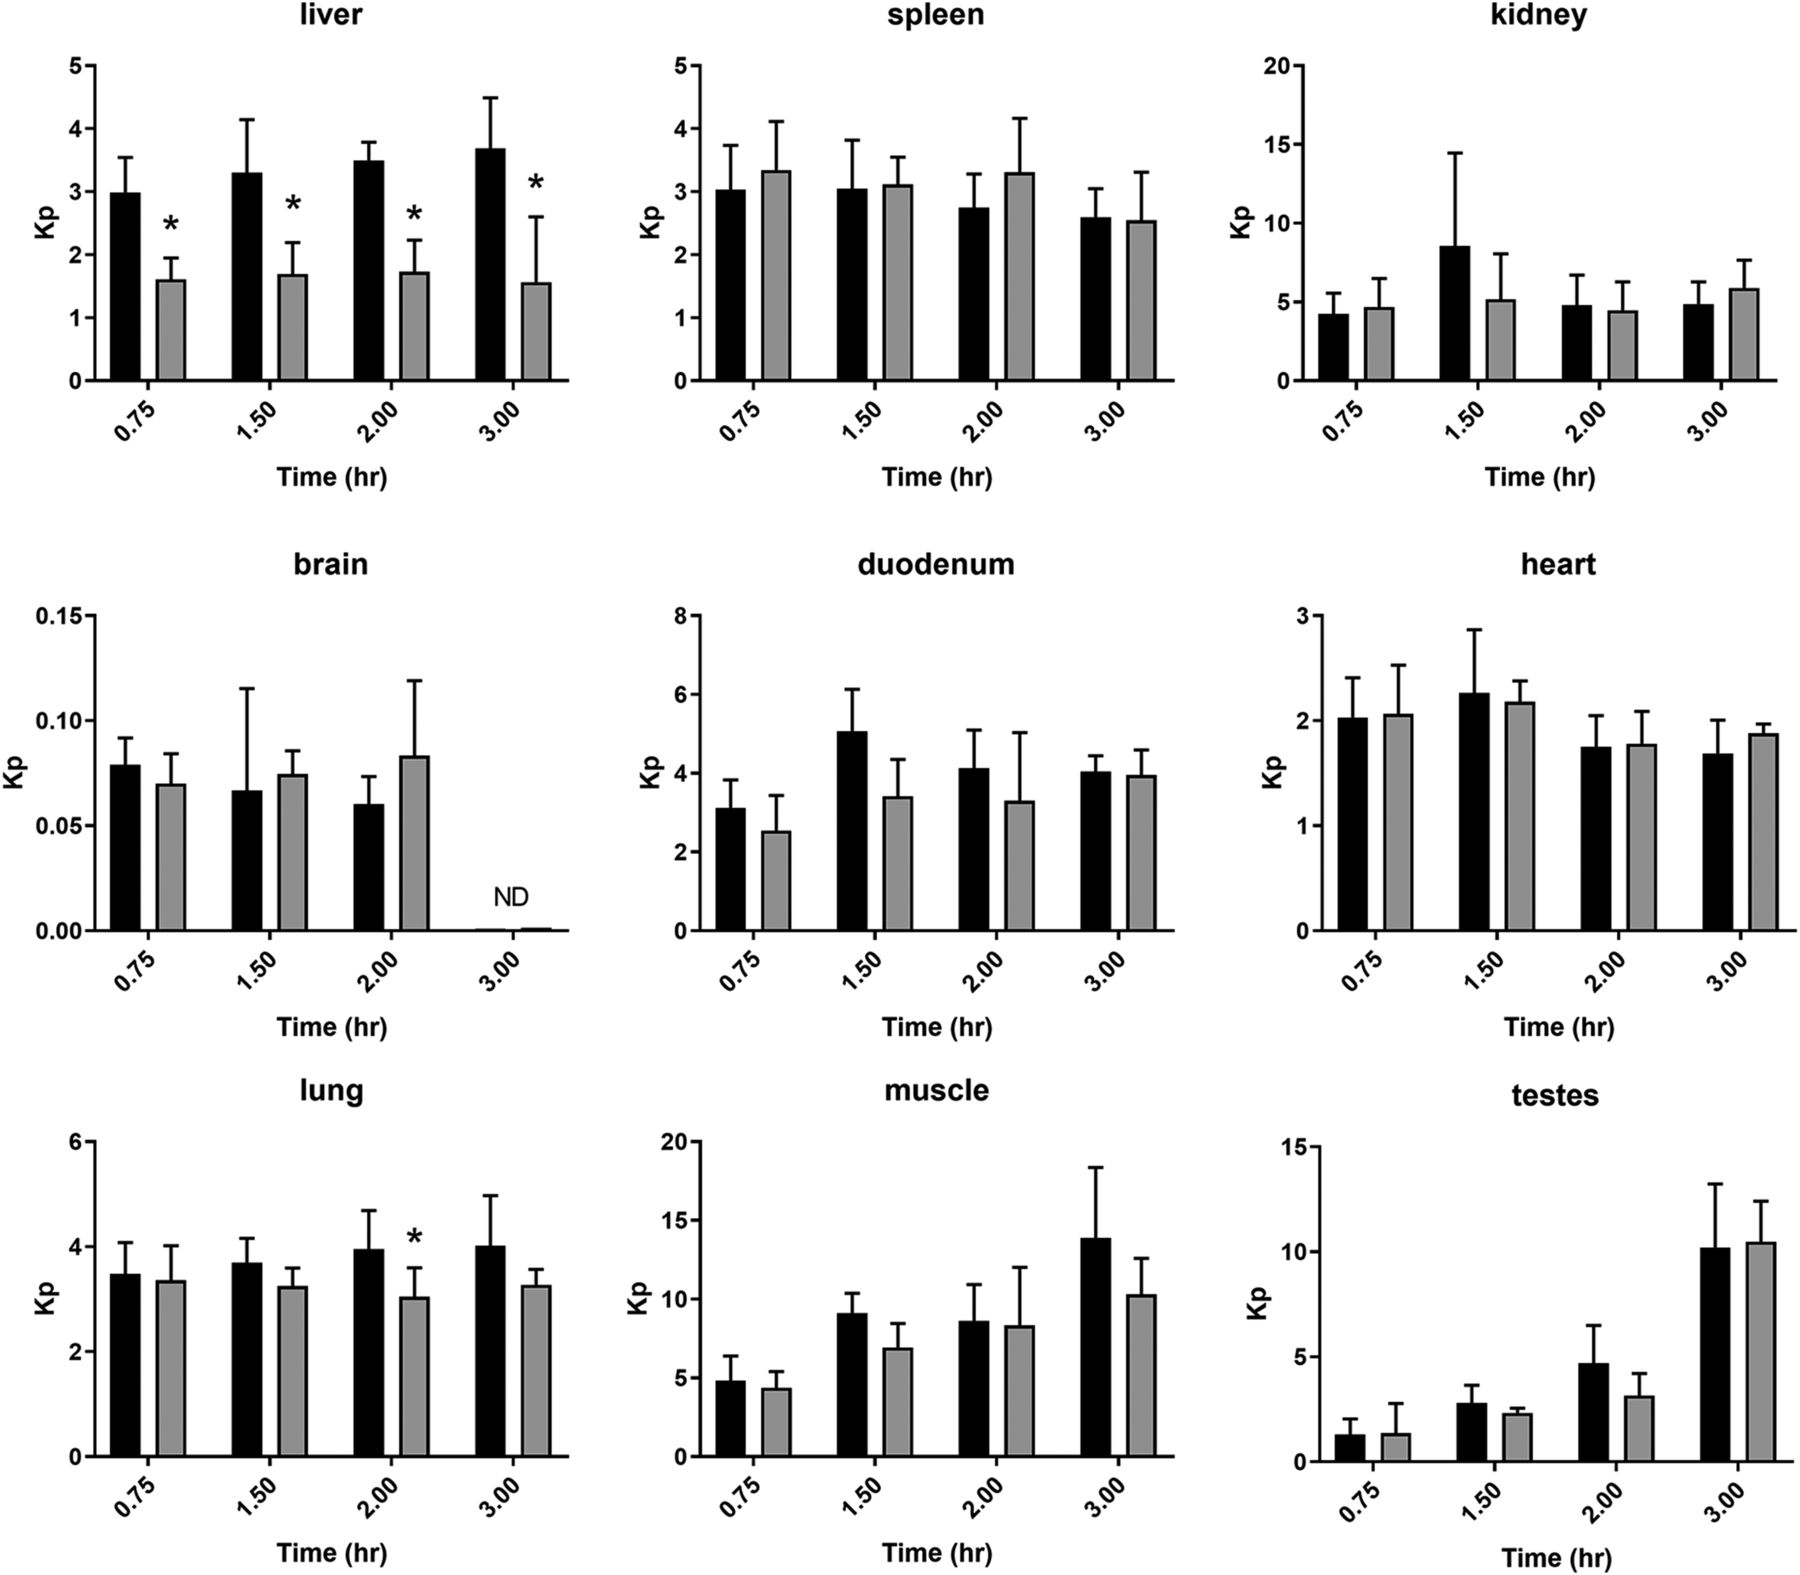
Tissue partitioning of sumatriptan is shown in Fig. 2, and that of fenoterol, ondansetron, and tropisetron in Fig. 3. Effect of Oct1/2 knockout on liver partitioning of sumatriptan and fenoterol was evident, although minimal or absent for ondansetron and tropisetron, consistent with the smaller changes in hepatic clearance observed with the latter. Oct1/2 knockout did not consistently affect partitioning of sumatriptan into any other tissues collected over the time course, conversely to that observed in the liver over time. No decrease in kidney partitioning of sumatriptan or tropisetron was detected, consistent with a lack of change in CLR. Conversely, for fenoterol, a decrease in kidney partitioning was observed, consistent with a decrease in fenoterol CLR. Uptake into the intestine was significantly decreased at one of two time points for fenoterol and tropisetron, following intravenous administration, suggesting an effect on intestinal secretion, which has been observed previously for cations in both Oct1 and Oct2 knockout mice (Jonker et al., 2001, 2003). This effect on partitioning into the intestine was not apparent for sumatriptan. Blood:plasma partitioning was unaffected by Oct1/2 knockout for any substrate.

Tissue partitioning (Kp) of sumatriptan in wild-type and Oct1/2−\− mice. Mice were administered sumatriptan intravenously (2 mg/kg) and sacrificed at time points indicated (n = 4–11 mice/time point), and plasma and tissues were collected. *P < 0.05 using Student’s t test, compared with wild type. Black bars represent wild type, and gray bars knockout mice. Data presented as mean ± S.D. ND, not detectable.
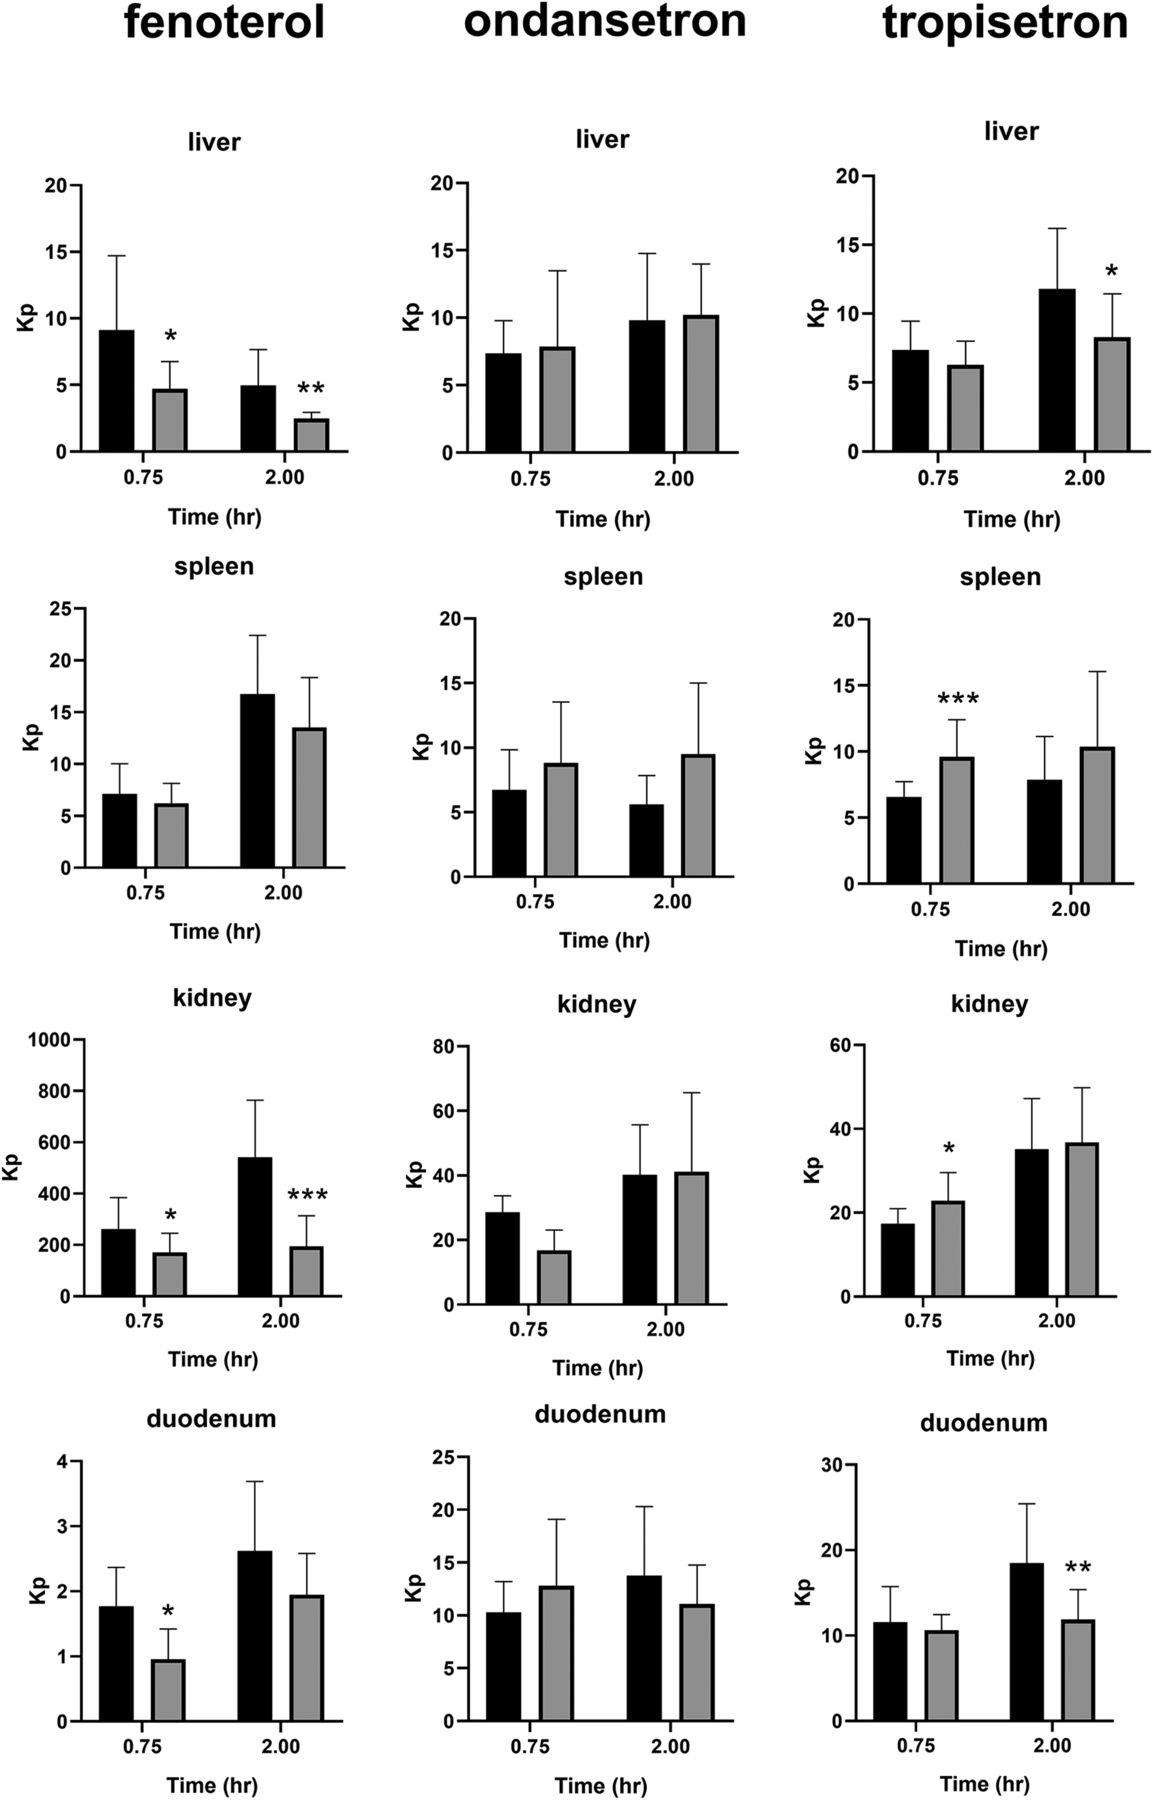
Tissue partitioning (Kp) of fenoterol, ondansetron, and tropisetron in wild-type and Oct1/2−\− mice. Mice were administered each compound intravenously (2 mg/kg) and sacrificed at time points indicated (n = 7–16 mice/time point), and plasma and tissues were collected. *P < 0.05 using Student’s t test, compared with wild type. **P < 0.01 using Student’s t test, compared with WT. ***P < 0.001 using Student’s t test, compared with WT. Black bars represent wild-type, and gray bars knockout mice. Data presented as mean ± S.D.
Oct protein expression in mouse tissues is shown in Fig. 4. Oct1 was found expressed in the liver and kidney, whereas Oct2 was found predominantly in mouse kidney, and present in the duodenum and testes. In all tissues expressing Oct1 or 2, knockout depleted expression. Interestingly, Oct3 expression was found in tissues in which Oct1 and 2 were not detected or below the limit of quantitation, including spleen, heart, and lung. Although knockout did not affect Oct3 expression in spleen or heart, Oct3 protein was detectable in the lung in wild-type mice, but not in knockout mice. As the OCT1 substrates are also substrates of other transporters, for example, ondansetron is also a substrate of P-gp, we included assessment of change in expression of other known transporters using LC-MS/MS. No differences in any other monitored transporters (detailed in Supplemental Table 1) were determined between wild-type and knockout mice (data not shown), indicating differences in substrate disposition between wild-type and knockout mice can be attributed to knockout of Oct1/2.

Oct expression in mouse tissues. Mice (n = 4) were sacrificed following pharmacokinetic studies, and tissues were collected. Transporters were quantitated using LC-MS/MS. Data presented as mean ± S.D. ND, not determined, below limit of quantitation in both strains.
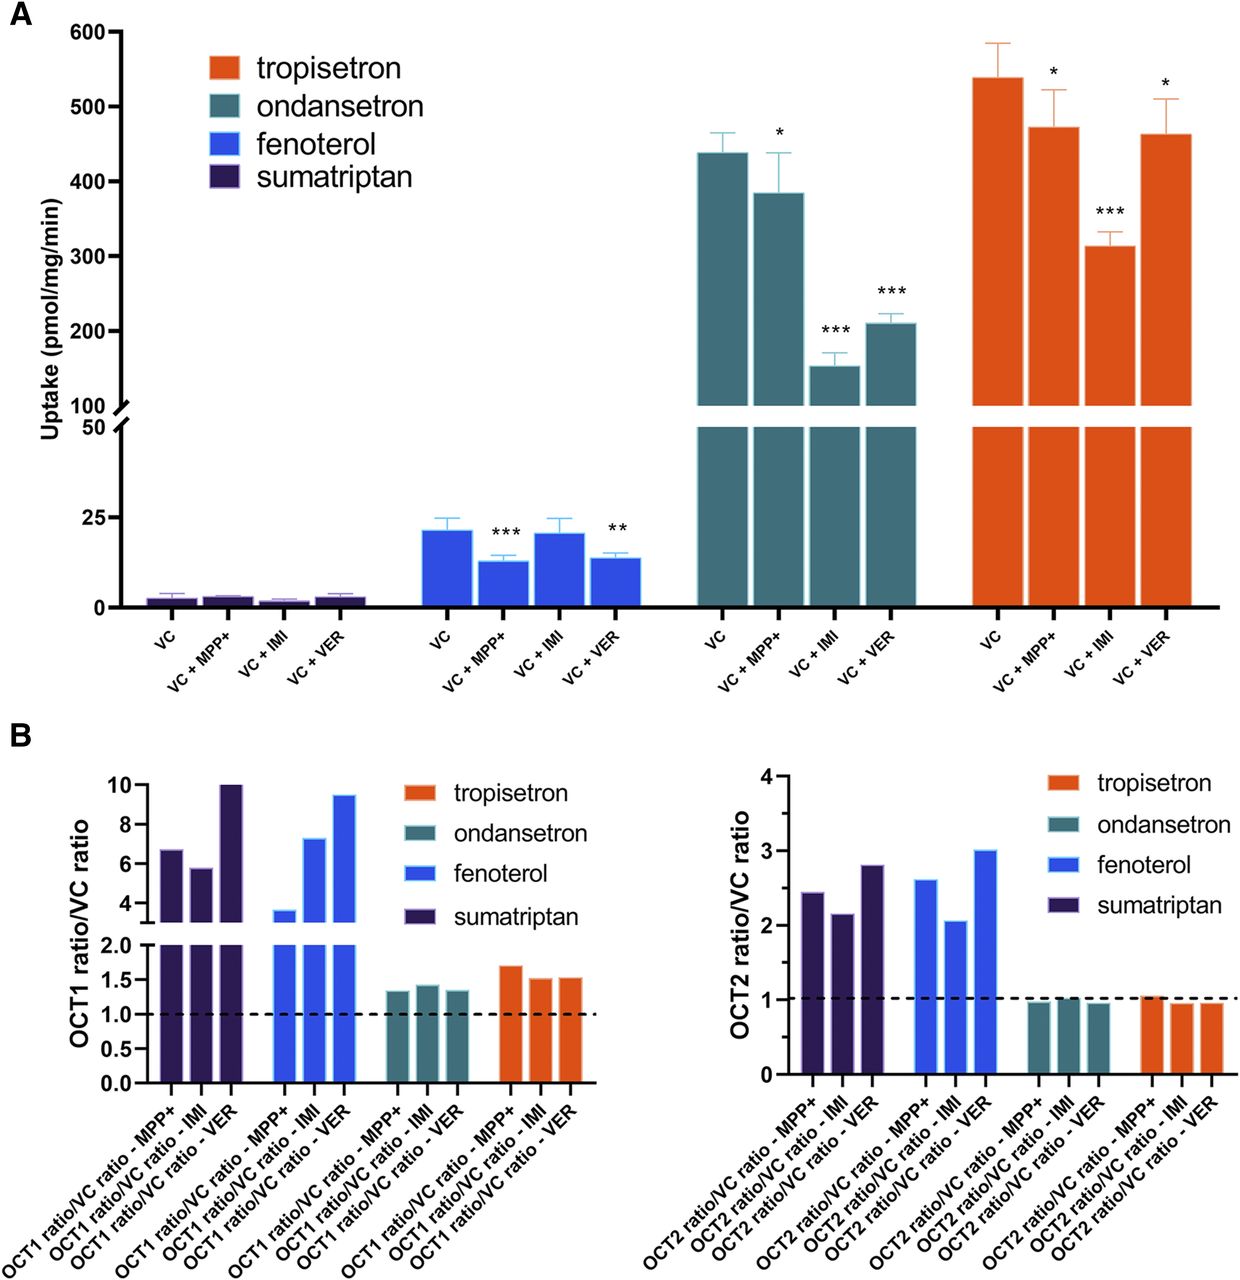
Uptake of the four compounds into OCT1- and OCT2-expressing HEK cells is shown in Fig. 5. Increased uptake of sumatriptan and fenoterol was evident in both OCT1- and OCT2-expressing cells, with ratios from 2.5 to 14 over vector control cells. Concentration-dependent uptake and Vmax and Km values for sumatriptan and fenoterol are shown in Supplemental Fig. 3A; OCT1 Km values are similar to those reported previously (Matthaei et al., 2016; Tzvetkov et al., 2018). We are not aware of any previously reported Km values for OCT2. For ondansetron and tropisetron, uptake in OCT1-expressing cells was significantly greater than vector control, and was significantly decreased in in the presence of MPP+, although ratios over vector control were less than for sumatriptan and fenoterol. Uptake of neither ondansetron nor tropisetron was significantly different in OCT2-expressing cells, compared with vector control. Overall, absolute uptake of ondansetron and tropisetron into cells was much higher than that of sumatriptan and fenoterol, which was hypothesized to involve lysosomal trapping of the former. Accordingly, lysosomal-trapping experiment results using NH4Cl, shown in Table 2, indicate no effect on the uptake of sumatriptan or fenoterol into vector control HEK cells, suggesting no lysosomal trapping of these compounds. However, uptake of ondansetron and tropisetron was decreased in the presence of NH4Cl, as much as the positive control imipramine, suggesting a role of lysosomal trapping in the partitioning of these compounds into cells. Furthermore, as shown in Fig. 6A, uptake of ondansetron and tropisetron into VC cells was significantly decreased by agents affecting lysosomal trapping, imipramine, and verapamil, and much less so by MPP+, which does not affect lysosomal trapping. Neither imipramine nor verapamil affected uptake of sumatriptan into VC cells, consistent with lack of effect by NH4Cl. Uptake of fenoterol into VC cells was affected by both MPP+ and verapamil, to unknown mechanism, but unaffected by imipramine. Concentration-dependent inhibition of OCTs by MPP+ is shown in Supplemental Fig. 3B. The IC50 for OCT1 was 608 µM and for OCT2 was 0.14 µM. As reported previously (Kido et al., 2011; Zhu et al., 2018), potent OCT inhibition was observed by imipramine and verapamil; IC50 values for OCT1 were 0.67 and 10.1 µM, respectively, and were 0.14 and 0.11 µM for OCT2 (data not shown). After accounting for the effect of all three inhibitors in VC cells, the ratios of uptake in OCT1 cells with/without inhibitor over VC cells with/without inhibitor are consistent with each inhibitor, and represent the effect of each inhibitor specifically on OCT1-mediated uptake, shown in Fig. 6B. Importantly, whereas the ratios for ondansetron and tropisetron are <2 for OCT1, they are consistent with each inhibitor and are clearly higher than the ratios for OCT2, which was approximately 1 for every inhibitor.

Uptake of OCT substrates in (A) OCT1- and (B) OCT2-overexpressing HEK cells. Uptake of each compound was assessed over 1 minute in VC, OCT1-, and OCT2-expressing cells. Uptake was assessed in triplicate or quadruplicate. MPP+ was used as an OCT inhibitor at a concentration of 1 mM. Data presented as mean ± S.D. *P < 0.05 using Student’s t test, compared with VC. ***P < 0.001 using Student’s t test, compared with VC. #P < 0.05 using Student’s t test, compared with OCT1. ##P < 0.01 using Student’s t test, compared with OCT1. ###P < 0.001 using Student’s t test, compared with OCT1.
Physicochemical properties, permeability, and lysosomal trapping of OCT1 substrates
Imipramine was used as a positive control for lysosomal trapping.

(A) Effect of OCT inhibitors on uptake of OCT substrates into VC cells and (B) calculated mean OCT-mediated ratios using MPP+, imipramine (IMI), and verapamil (VER) as OCT inhibitors. Data presented as mean ± S.D. The dotted lines in (B) indicate a ratio of 1. *P < 0.05 using ANOVA, compared with no inhibitor. **P < 0.01 using ANOVA, compared with no inhibitor. ***P < 0.001 using ANOVA, compared with no inhibitor.
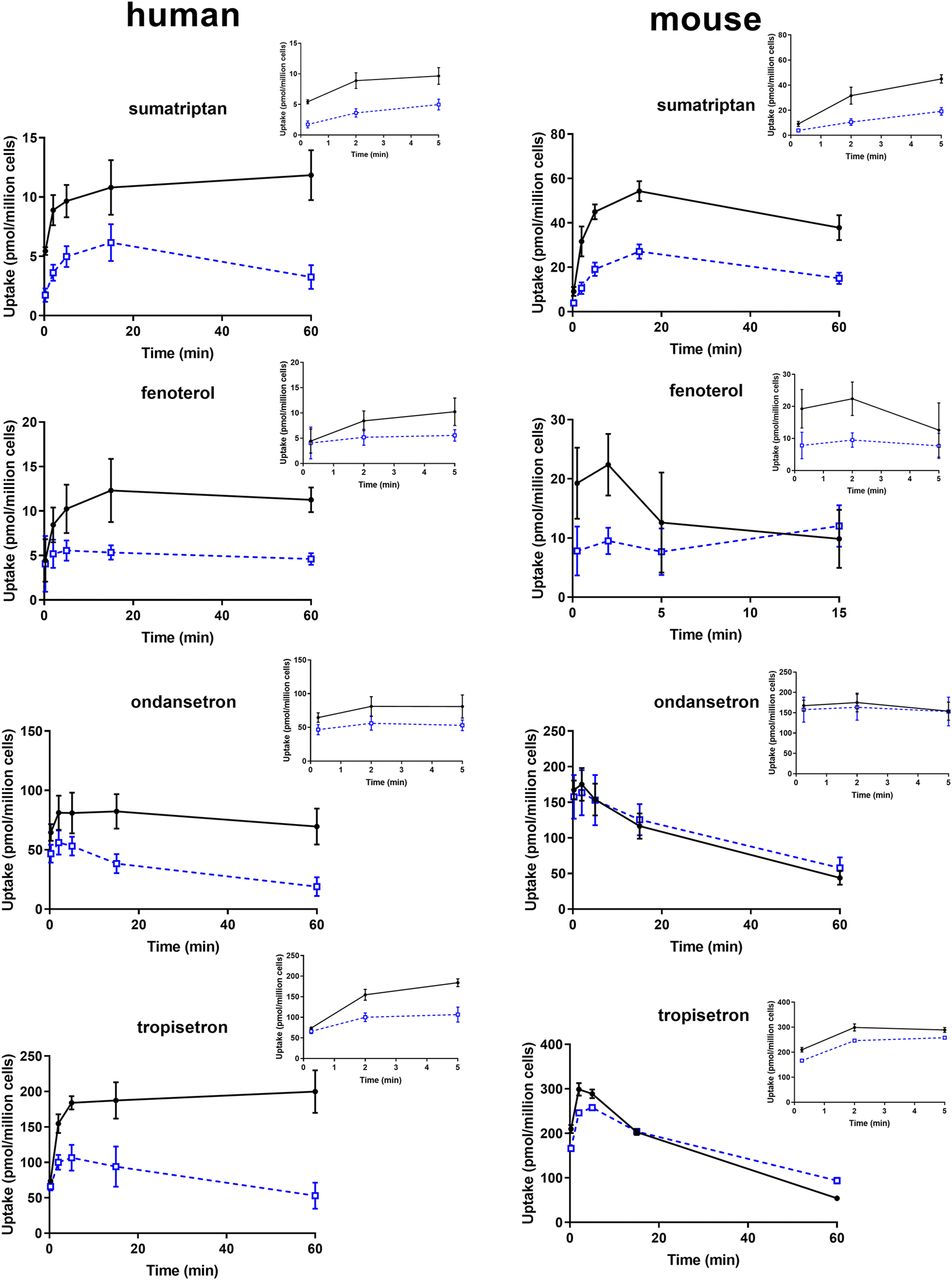
Uptake of each OCT1 substrate into human and mouse hepatocytes, with and without MPP+, is shown in Fig. 7. In human hepatocytes, inhibition of uptake by MPP+ was evident for all compounds. Conversely, in mouse hepatocytes, uptake of sumatriptan and fenoterol was decreased similarly as in human hepatocytes; however, minimal or no inhibition was observed for ondansetron or tropisetron. Consistent with the effect of lysosomal trapping and uptake observed in HEK cells, accumulation of both ondansetron and tropisetron was greater in both mouse and human hepatocytes, compared with sumatriptan and fenoterol.

Uptake of OCT1 substrates in mouse and human hepatocytes. Uptake was assessed in hepatocyte suspension via the oil–spin method. Each time point was assessed in triplicate. Solid black circles and open blue squares represent uptake in the absence and presence of 1 mM MPP+, respectively. Data presented as mean ± S.D.
Discussion
The use of Oatp knockout mice has been demonstrated valuable for reproducing effects of decreased OATP function observed in the clinic with OATP substrates. This model has been found to be quite robust, with differences in plasma exposure greater than 10-fold in wild-type and knockout mice for some substrates, likely related to the increased function and expression of Oatps in rodents relative to human (Higgins et al., 2014; Salphati et al., 2014). The OATP substrates highlighted the concept that uptake could be rate-limiting for hepatic clearance, and recent data indicate OCT1 represents an uptake mechanism that may also be rate-limiting for plasma exposure in humans (Tzvetkov et al., 2012, 2018; Matthaei et al., 2016). Subsequently, recent recommendations on assessing the role of OCT1 in the clinic have been produced (Zamek-Gliszczynski et al., 2018a,b). As the role of OCT1 variants on the plasma clearance of more substrates is revealed, confidence in tools for assessing the in vivo role of OCT1 becomes increasingly relevant.
Of the four compounds assessed currently, the role of OCT1 in the clearance of fenoterol in humans is most clear in participants with null OCT1 variants (Tzvetkov et al., 2018); as fenoterol is administered via intravenous infusion, it can be concluded that the systemic clearance of fenoterol is indeed altered with changes in OCT1 function. Although CLR was not measured in the clinical study, there is no reported expression of OCT1 in the kidney in humans; hence, it is assumed that only changes in hepatic clearance resulted in the altered plasma exposure. The current results in knockout mice are in alignment with a decrease in hepatic clearance and liver partitioning with decreased Oct function, with a similar magnitude change in total clearance as that reported in the clinic of ∼2-fold. The effect of OCT1 on the pharmacokinetics of sumatriptan in humans is also clear, with the plasma AUC over 8 hours following oral administration increasing ∼2-fold in humans with null OCT1 variants (Matthaei et al., 2016). Although in the clinic a change in hepatic clearance could only be inferred from the results following oral administration, in this study, in the mouse model, we confirmed the role of Oct1 in the hepatic clearance of sumatriptan, through both plasma clearance and liver partitioning. After accounting for CLR and hepatic extraction in mice, the current data indicate the absorption of sumatriptan to be incomplete or lost due to intestinal metabolism. However, these data suggest the change in oral AUC to be restricted to changes in hepatic first-pass and that absorption/intestinal first-pass (FaFg) did not change. Absorption in humans is also incomplete, based upon calculated Fh (Fowler et al., 1991); however, currently it is not known whether OCT1 variants affect sumatriptan absorption in humans, as effects in the intestine and liver cannot be elucidated from oral data in humans. From the current data, it is concluded that Oct1 in the liver decreases the hepatic clearance and partitioning of fenoterol and sumatriptan, and that these compounds represent the best clinical probes for evaluation of OCT1-mediated DDIs in the clinic.
Clinical data on ondansetron and tropisetron are not as robust; plasma concentrations at 3 and/or 6 hours following oral administration were reported higher in patients with two null OCT1 variants (Tzvetkov et al., 2012). Although the pharmacokinetic data are sparse, they did align with an enhanced pharmacodynamic effect, with decreased episodes of vomiting in patients with null variants taking these antiemetics. The knockout mice indicate a small, albeit statistically significant, role of Oct1 in the liver for these compounds, and the decrease in hepatic clearance was only 18% to 27%, compared with that of 4-fold for sumatriptan. As a change in overall AUC in humans has not yet been reported with OCT1 null variants for ondansetron or tropisetron, a direct comparison between the magnitude of change in the knockout and in humans cannot be ascertained. It is of interest, however, that the in vitro data in mouse hepatocytes would have predicted this smaller change in mice with these two substrates, with minimal change in the presence of an OCT1 inhibitor. Furthermore, in human hepatocytes, there was clear inhibition in the presence of an OCT1 inhibitor, which is consistent with the reported clinical data. Therefore, it is concluded that the lack of effect in the knockout model does not likely indicate a minor role of OCT1 for these substrates in humans, but instead a species difference in the Oct1-mediated hepatic uptake of these compounds. Species differences as well as substrate dependence in OCT interactions are well-documented in the literature (Dresser et al., 2000). Previous in vitro investigation reported it difficult to detect both tropisetron and ondansetron in OCT1-expressing in vitro systems, although pharmacogenetic results on pharmacokinetics and pharmacodynamics were positive (Tzvetkov et al., 2012). In agreement with our results in human hepatocytes, we did find uptake in OCT1-expressing cells to be significantly higher than VC cells, although the ratios were low, consistent with previous data. We proposed that the lysosomal trapping of these two compounds results in a high background even in control cells in vitro, causing low ratios to be ascertained with MPP+, an inhibitor of OCT1 that does not affect lysosomal trapping. The subsequent experiments assessing lysosomal trapping results using both NH4Cl and chemical inhibitors confirm this, and are in line with physicochemical properties of these two compounds (Table 2). Furthermore, after discerning the role of OCT1/lysosomal agents imipramine and verapamil on both vector control and OCT-expressing cells, there does appear a consistent OCT1-mediated effect with inhibitors that both do and do not affect lysosomal trapping. However, even though current in vitro data are in line with effects of OCT1 null variants in the clinic, given the sparse clinical pharmacokinetic data currently available and limitations due to lysosomal trapping in vitro, confirmation for the effect of OCT1 on these two compounds in the clinic would be valuable.
The current data point out an obvious limitation of the mouse model, in that species differences in OCT1-mediated hepatic uptake appear evident. Additionally, this double-knockout model warrants evaluation of CLR, as Oct2 is the predominant form in the mouse kidney; collection of urine in mice can be technically challenging and may confound the understanding of effects on hepatic clearance, although the ability to assess liver partitioning somewhat mitigates this limitation. Furthermore, although available LC-MS/MS transporter data in human liver and kidney are in general agreement with the current mouse data, with OCT1 expression in liver and OCT2 predominant in kidney (Prasad et al., 2016; Drozdzik et al., 2019), previous data in mouse Oct knockout models indicate that Oct1 can play a role in the renal excretion of cations, as demonstrated for tetraethylammonium (TEA) (Jonker et al., 2003). Even though expression may be lower than Oct2, the role of Oct1 in mouse kidney may be another mechanism of species difference, along with differences in the fractional excretion of any drug between mice and humans. Additionally, whereas current protein expression data by LC-MS/MS indicate expression of Oct3 in the liver to be undetectable, Oct3 mRNA has previously been detected in mouse liver (Chen et al., 2015) and OCT3 is detectable in human liver, from recent LC-MS/MS expression data (Khatri et al., 2019). However, the effect of Oct3 knockout on liver partitioning of metformin in previous studies is conflicting, and, in most human subjects, OCT3 protein was found at much lower protein levels than that of OCT1 (Drozdzik et al., 2019). Data regarding uptake of these four clinical substrates currently investigated by OCT3 are not available; however, it appears that OCT1 is the predominant form in both mouse and human liver, from current data, and likely does not imply a role of OCT3 in the species differences currently observed. Our current data do indicate lack of compensatory upregulation of Oct3 protein with Oct1/2 knockout, in any tissues assessed.
In conclusion, the current data in knockout mice support a primary role of Oct1-mediated hepatic uptake in vivo for sumatriptan and fenoterol. A minor role for OCT1 substrates ondansetron and tropisetron coincides with the minor inhibition in mouse hepatocytes and does not reflect in vitro results in human hepatocytes. These species differences need to be considered when using this model to predict a role of OCT1 in the hepatic uptake of other compounds, as does a potentially limiting effect of lysosomal trapping on in vitro investigations for OCT substrates. Human hepatocyte in vitro uptake appears to be the most predictive for initiating investigation into OCT1 pharmacogenetics in the clinic. The mouse model could be used for confirmation or mechanistic insight, as done in this study; however, negative results must also be interpreted in concordance with uptake into mouse and human hepatocytes.
Authorship Contributions
Participated in research design: Morse, Kolur, Hudson, Fallon, Smith, Hillgren.
Conducted experiments: Morse, Kolur, Hudson, Hogan, Brackman, Sawada, Fallon.
Contributed new reagents or analytic tools: Morse, Kolur, Hogan, Chen, Sawada, Fallon, Smith, Hillgren.
Performed data analysis: Morse, Kolur, Hudson, Brackman, Sawada, Fallon.
Wrote or contributed to the writing of the manuscript: Morse, Kolur, Hudson, Chen, Brackman, Sawada, Fallon, Smith, Hillgren.
Footnotes
- Received July 19, 2019.
- Accepted November 8, 2019.
This work was supported by Eli Lilly and Company.
This work has been presented as an abstract: Species Differences and Translational Tools for Assessing OCT1-Mediated Hepatic Clearance. 11th BioMedical Transporters Conference (BMT2019), Swiss Museum of Transport, Lucerne, Switzerland. August 4–8, 2019.
↵
 This article has supplemental material available at dmd.aspetjournals.org.

Abbreviations
- AUC
- area under the concentration–time curve
- CLR
- renal clearance
- DDI
- drug–drug interaction
- DPBS
- Dulbecco’s PBS
- F
- bioavailability
- Fa
- fraction absorbed
- Fg
- fraction escaping metabolism in the gut
- Fh
- fraction escaping first-pass hepatic extraction
- KHB
- Krebs–Henseleit buffer
- LC-MS/MS
- liquid chromatography/mass spectrometry
- MPP
- 1-methyl-4-phenylpyridinium
- MRM
- multiple reaction monitoring
- OATP
- organic anion-transporting polypeptide
- OCT
- organic cation transporter
- SIL
- stable isotope label(ed)
- VC
- vector control
- Copyright © 2020 by The American Society for Pharmacology and Experimental Therapeutics


