


Abstract
Long-term hepatocyte culture systems such as HepatoPac are well suited to evaluate the metabolic turnover of low clearance (CL) drugs because of their sustained metabolic capacity and longer-term viability. Erythromycin (ERY), a moderate, mechanism-based inhibitor of CYP3A, was evaluated as a tool in the HepatoPac model to assess contribution of CYP3A to the clearance of drug candidates. ERY inhibited CYP3A activity by 58% and 80% at 3 and 10 μM, respectively, for up to 72 hours. At 30 µM, ERY inhibited midazolam hydroxylation by >85% for the entire 144-hour duration of the incubation. Alprazolam CLint was inhibited 58% by 3 μM of ERY, 75% by 15 μM of ERY, 89% by 30 μM of ERY, and 94% by 60 μM of ERY. ERY (30 μM) did not markedly affect CLint of substrates for several other major cytochrome P450 isoforms evaluated and did not markedly inhibit uridine diphosphoglucuronosyl transferase (UGT) isoforms 1A1, 1A3, 1A4, 1A6, 1A9, 2B7, or 2B15 as assessed using recombinant UGTs. ERY only mildly increased CYP3A4 gene expression by 2.1-fold (14% of rifampicin induction) at 120 µM, indicating that at effective concentrations for inhibition of CYP3A activity (30–60 µM), arylhydrocarbon receptor, constitutive androstane receptor, and pregnane-X-receptor activation are not likely to markedly increase levels of other drug-metabolizing enzymes or transporters. ERY at concentrations up to 60 µM was not toxic for up to 6 days of incubation. Use of ERY to selectively inhibit CYP3A in high-functioning, long-term hepatocyte models such as HepatoPac can be a valuable strategy to evaluate the contribution of CYP3A metabolism to the overall clearance of slowly metabolized drug candidates.
SIGNIFICANCE STATEMENT This work describes the use of erythromycin as a selective inhibitor of CYP3A to assess the contribution of CYP3A in the metabolism of compounds using long-term hepatocyte cultures.
Introduction
Cytochrome P450s (P450) are drug-metabolizing enzymes that contribute to the elimination of approximately 45% of marketed drugs (Jones et al., 2009; Cerny, 2016). CYP3A continues to play a dominant role as the P450 isoform most often involved in the metabolism of drugs (Guengerich, 1999; Zhang et al., 2007; Zientek and Youdim, 2015).
Determining the contribution of P450 isoform metabolism to the total body clearance of drug candidates is required to predict the susceptibility of a drug to changes in exposure caused by inhibition or induction of its metabolism by comedicants (drug-drug interactions, DDI). Typical in vitro reaction phenotyping methodologies include monitoring the depletion of parent compound, or monitoring metabolite formation, in recombinantly expressed P450 enzymes and/or human-derived microsomes in the presence and absence of isoform-selective inhibitor (Yan and Caldwell, 2013). The successful use of these methods to reliably predict clinical DDIs is contingent on a number of important factors, such as having sufficient metabolism of the drug to observe parent depletion or metabolite formation, and the selectivity of P450 inhibitors used. In addition, data generated from experiments in which recombinantly expressed enzymes are employed must then be considered in the context of appropriate scaling factors to reflect the relative abundance of each P450 in humans (Di, 2017). For slowly cleared compounds, when monitoring the depletion of the parent compound, the CLint of a drug can only be reliably determined if adequate turnover of the compound is observed. If compound turnover is imperceptible, monitoring metabolite formation is the only method to assess metabolic contribution. In this case, a firm understanding of the metabolic profile of the drug is required to interpret the data (Bohnert et al., 2016).
Hepatocytes have become a widely used tool to estimate the hepatic clearance of drug candidates (Sohlenius-Sternbeck et al., 2010). More advanced hepatocyte models have been identified, which can extend the viability of cultures out to several days rather than a few hours (Chan et al., 2013; Beckwitt et al., 2018). Additionally, such hepatocyte models are also capable of maintaining high enzyme function, including but not limited to P450 activity. HepatoPac is a micropatterned coculture system that has been shown to be able to leverage long-term viability and high functionality to be effective at predicting the clearance of slowly cleared compounds (Khetani and Bhatia, 2008; Chan et al., 2013; Lin et al., 2016). The increased metabolic rate and longer viability of hepatocytes in HepatoPac cultures makes the model ideal for determining contribution of hepatic metabolism to the overall hepatic clearance of slowly metabolized drug candidates, provided suitable isoform-selective inhibitors can be identified.
In this study, we evaluate ERY for its use as a potent and selective inhibitor of CYP3A in HepatoPac cultures.
Materials and Methods
HepatoPac cultures (Lots 3121B, 4202, 4297, 1307, ACR) were purchased from BioIVT Inc. Donor demographics are shown in Table 1. APZ, 6-(4-Chlorophenyl)imidazo[2,1-b][1,3]thiazole-5-carbaldehyde O-(3,4-dichlorobenzyl)oxime (CITCO), diazepam, omeprazole (OME), rifampicin (RIF), tolbutamide, riluzole, risperidone, and erythromycin were purchased from Sigma Aldrich. Nevirapine was obtained from Boehringer Ingelheim Pharmaceuticals.
Hepatopac donor demographics
Cell Culture.
HepatoPac plates were received from BioIVT in sealed 24- or 96-well polystyrene plates in warm packaging. A cell count value of 3350 hepatocytes/well was used to calculate Clint in a 96-well plate format. The shipment media was replaced with 64 µl/well of warmed HepatoPac maintenance media containing 10% FBS for a 96-well plate format or 400 µl/well for a 24-well plate format. Incubation conditions were 37°C, 90% humidity, and 10% CO2. After 2 to 3 days, the wells were washed with serum-free HepatoPac media and then filled with 32 µl of serum-free HepatoPac media (for earlier studies using donors 1307, 3121B, and 4202) or Hepatopac media containing 5% serum (for later studies using 4297 and ACR). After a 15-minute preincubation, 32 µl of compound at 2× concentration was added to each well. Final incubation concentrations were as follows: APZ and diazepam were 0.1 µM, risperidone and tolbutamide were 0.2 µM, riluzole was 0.4 µM, KTZ was 1 and 3 µM, and ERY was 3, 10, 15, 30, or 60 µM.
The rate of midazolam 1′hydroxylation was also measured after 12, 24, 48, 72, 100, and 144 hours after ERY treatment (3, 10, and 30 µM). This study was carried out in duplicate on a 96-well culture plate using donor 1307. After each time point, media containing ERY was removed and replaced with serum-free media containing midazolam (15 µM). After a period of 2, 4, and 6 minutes after midazolam addition (two wells/time point), the reaction was stopped by the addition of stop solution as described below.
In all incubations, the concentration of organic solvent (methanol or acetonitrile) did not exceed 0.52% (v/v).
At selected time points based on prior studies (Chan et al., 2013), 192 µl of stop solution containing 0.1 µM nevirapine in 60% acetonitrile, 59.9% water, and 0.1% acetic acid was added to a set of wells. The contents of each of the wells was triturated and transferred to a 96-well, 0.1-µm glass fiber filter plate fitted on top of a 96-deep well collection plate. Samples were centrifuged at 3000g for 15 minutes. The filtrates were injected into the mass spectrometer for quantitation.
CLint was calculated based on the following equation: where kel is the elimination rate constant. Percent inhibition was calculated based on the following equation.
 where CLint, inhibited is the CLint of the compound in the presence of the CYP3A inhibitor and CLint, control is the CLint of the compound in the absence of the inhibitor.
Viability.
HepatoPac cultures (lot ACR) were incubated with ERY at 0, 10, 30, and 60 µM or acetaminophen at 20 mM for 144 hours. Viability was assessed periodically by morphologic assessment using an Evos inverted microscope with a 20× phase contrast objective (Thermo Fisher Scientific). Cell layer samples were also collected at 2, 4, 24, 48, 96, and 144 hours from each well, and hepatocellular alanine transaminase (ALT) was measured indirectly by using an ALT spectrophotometric assay kit (Biovision Inc.) that measures the activity of ALT via conversion of alanine to pyruvate.
Nuclear Receptor Activation.
Arylhydrocarbon receptor (AhR), constitutive androstane receptor (CAR), and pregnane-X-receptor (PXR) activation, indirectly followed by monitoring CYP1A2, CYP2B6, and CYP3A4 induction, was assessed in the presence of 10, 30, 60, and 120 µM of ERY or positive controls OME (50 µM; CYP1A2), CITCO (0.1 µM; CYP2B6), and RIF (10 µM; CYP3A4). HepatoPac cultures consisting of a pool of 10 donors (Lot ACR) were used in a 24-well plate format. ERY or positive controls were incubated for 48 hours. Media with inducer was refreshed after 24 hours of incubation. The solvent used was acetonitrile, which did not exceed 0.5% of the incubation media. Cells were harvested in lysis buffer and mRNA was purified using the mRNA Catcher Plus system (Invitrogen). Reverse transcription was carried out using Superscript VILO mastermix (Invitrogen) on a Gene Amp 9700 thermocycler (Applied Biosystems). CYP1A2, 2B6, and 3A4 gene expression was assessed with real-time polymerase chain reaction, using a QuantStudio Flex 7 system (Applied Biosystems). Amplification was carried out by using commercially available Taqman assays for CYP1A2 (Hs00167927_m1), 2B6 (Hs00167937_g1), and 3A4 (Hs00604506_m1) and human glyceraldehyde-3-phosphate dehydrogenase (Hs02786624_g1) as the housekeeping gene. Gene expression was determined by using the ΔΔ cycle-threshold method (Livak and Schmittgen, 2001).
Effect of ERY on the Activity of Recombinant UGTs.
Recombinant UGTs (Supersomes; Corning Inc.) were incubated in 0.1 M Tris buffer, pH 7.8, with 5 mM MgCl2 and 25 μg/mg alamethecin. The protein concentrations used ranged from 0.083 to 1 mg/ml depending on the recombinant UGT. For UGTs 1A1 and 1A3, activity was assessed using 150 µM of b-estradiol. For UGT1A4, activity was assessed using 200 µM of trifluoperazine. For UGTs 1A6, 1A9, 2B7, and 2B15, activity was assessed using 7-hydroxy-4-(trifluoromethyl) coumarin. Incubations containing UGT substrates in the presence or absence of 30 or 60 µM of ERY were initiated by the addition of uridine diphosphoglucuronic acid at a final concentration of 2 mM.
Statistical Analysis.
Statistical significance of the differences in APZ or ERY CLint under varying concentrations of ERY were assessed by using a one-way ANOVA coupled with a Tukey’s post hoc test. Statistical differences between mRNA content in control studies and those treated with escalating concentrations of ERY were assessed by using one-way ANOVA coupled with Dunnett’s post hoc test. Statistical significance was defined as P < 0.05.
Liquid Chromatography–Tandem Mass Spectrometry.
Compound concentrations were measured by using liquid chromatography–tandem mass spectrometry on an Applied Biosystem Sciex API-4000 mass spectrometer coupled to a Waters Acquity ultra-high-performance liquid chromatography system or an Applied Biosystem Sciex API 6500 coupled to an Agilent Infinity 1290 HPLC in multiple reaction monitoring mode (MRM). Elution was carried out by using a linear gradient flow from 5% acetonitrile with 0.1% acetic acid in deionized water to 95% acetonitrile with 0.1% acetic acid in deionized water. For bioanalytical methods using the Waters Ultra Performance Liquid Chromatography system, separations were carried out with a Waters Acquity BEH C18 column (2.1 × 50 mm, 1.7 µm), whereas bioanalyses using the Agilent HPLC system were carried out with an Agilent InfinityLab Poroshell HPH-C18, 1.9 µm, (2.1 × 50 mm) column. Detection and quantification were carried out with MRM using known transitions shown in Table 2. In all methods for P450 substrates, the internal standard was nevirapine, measured using a mass-to-charge transition of 267→226 in positive mode. For UGT metabolites, the internal standard used was labetalol, measured using a mass-to-charge transition of 329.0→294.3 in positive mode.
MRM transitions used for liquid chromatography–tandem mass spectrometry analysis
Results
Inhibition of CYP3A Metabolism of APZ by KTZ.
Coincubation of 1 µM KTZ with APZ in HepatoPac cultures (donor 1307) resulted in partial inhibition of APZ metabolism characterized by a biphasic curve with noticeable inhibition of APZ turnover up to 48 hours, followed by the resumption of turnover that was approximately equal to the control from 48 hours to the end of the incubation period (Fig. 1A). By 48 hours, KTZ levels were depleted to approximately 1% of nominal concentrations (∼10 nM). Coincubation of 3 µM of KTZ with APZ resulted in sustained inhibition of APZ metabolism throughout the incubation period. By 138 hours, KTZ levels were depleted to approximately 3% of nominal concentrations (∼90 nM) (Fig. 1B).

Relationship between inhibition of APZ turnover (A) and KTZ exposure (B) in HepatoPac incubations (donor 1307). Values represent the mean ± S.D. from three replicates.
Inhibition of CYP3A Metabolism of APZ by ERY.
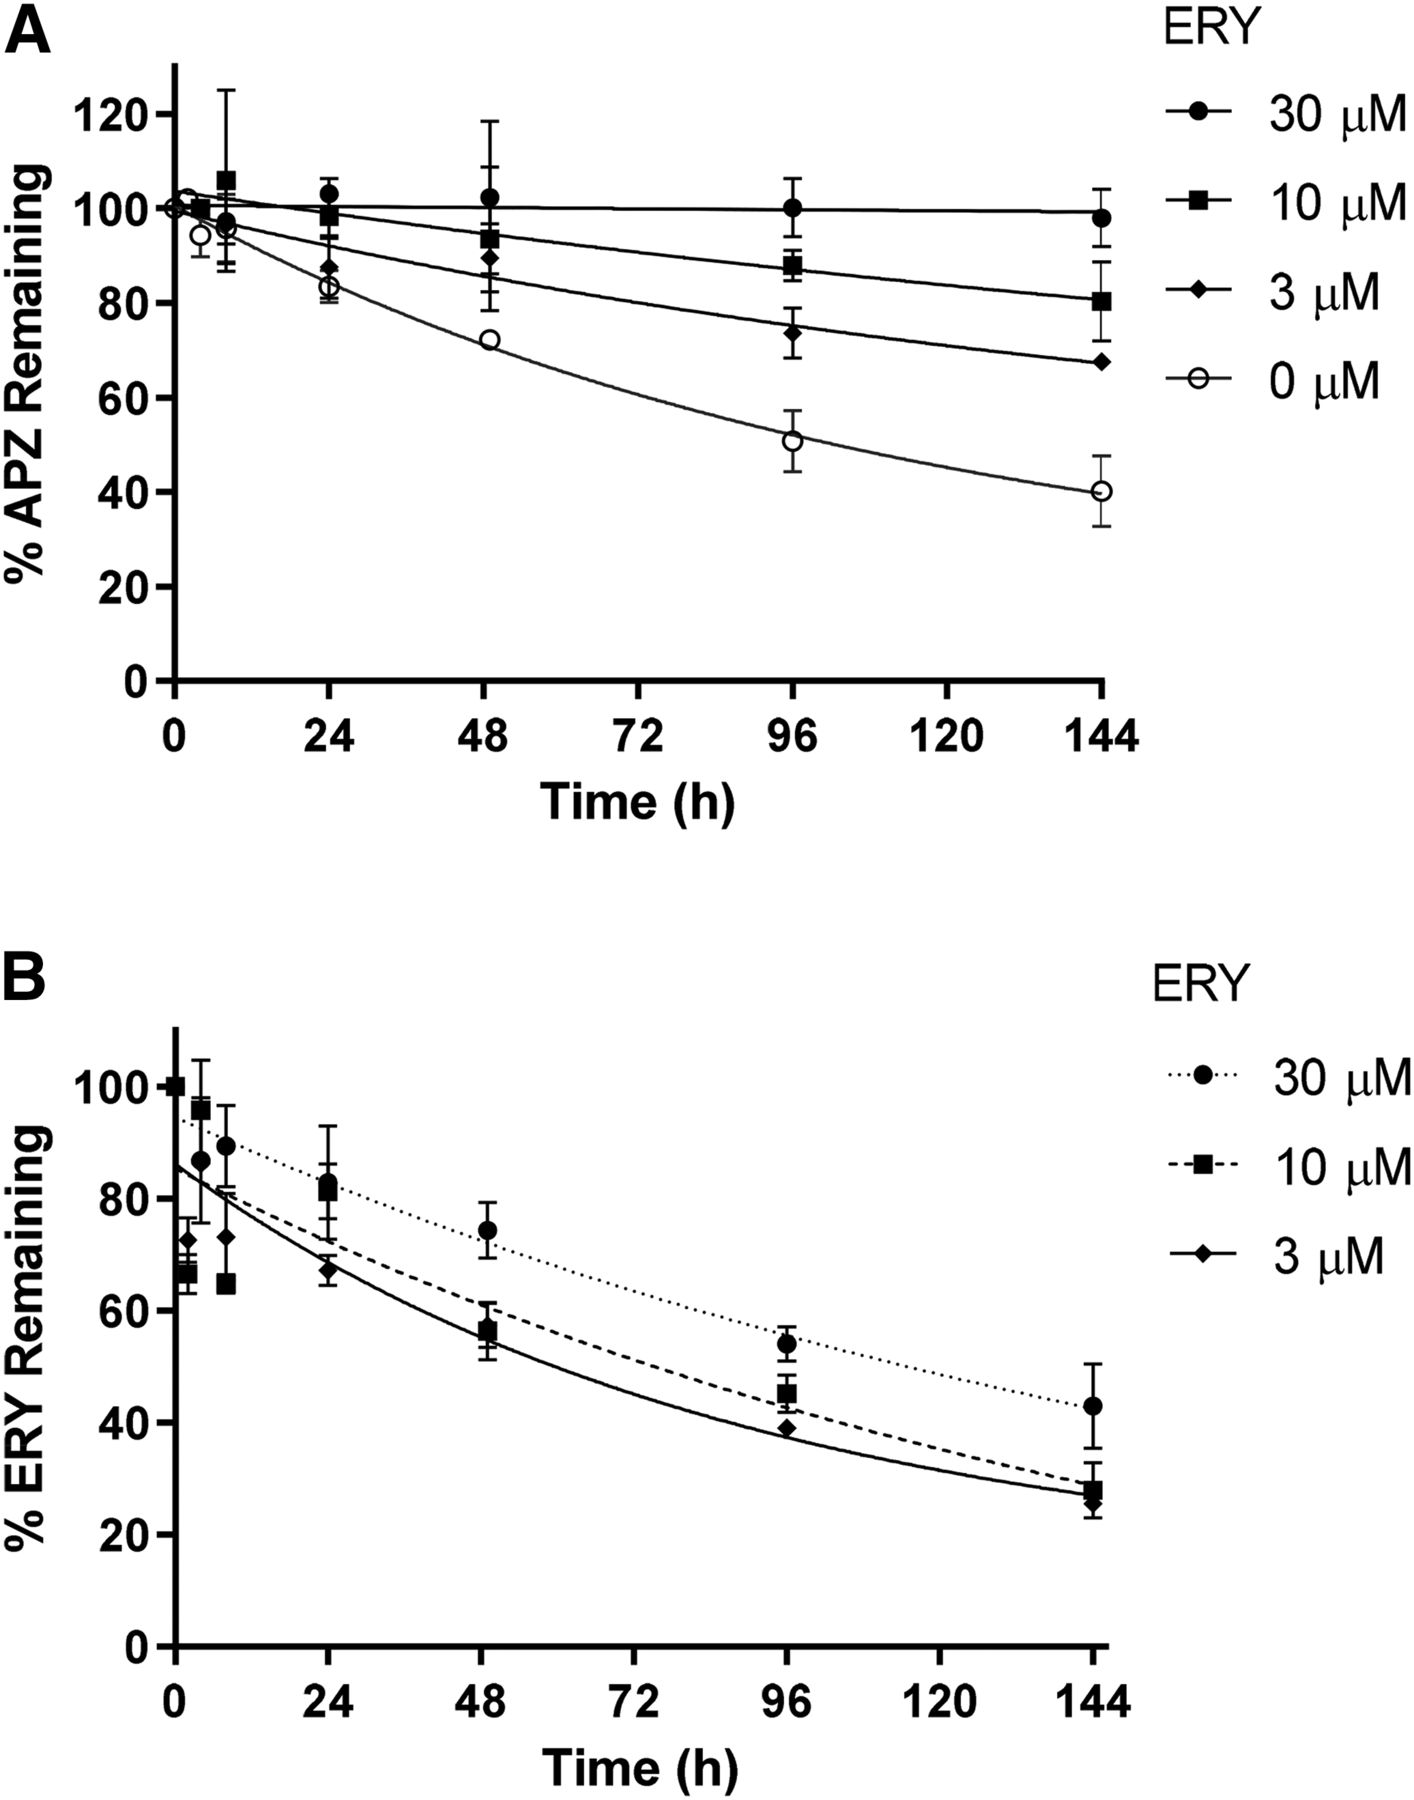
Coincubation of ERY with APZ in HepatoPac cultures (donor 1307) resulted in an ERY concentration-dependent decrease in the CLint of APZ (Fig. 2A). Unlike KTZ inhibition of APZ metabolism, the inhibition of APZ metabolism by ERY did not appear to be characterized by an initial slow rate of depletion followed by a later, more rapid rate of depletion. ERY turnover was concentration-dependent. At 3, 10, and 30 µM ERY, approximately 26% (0.78 µM), 28% (2.8 µM), and 43% (22 µM) ERY remained, respectively, after 6 days.

Relationship between inhibition of APZ turnover (A) and ERY exposure (B) in HepatoPac incubations (donor 1307). Values represent the mean ± S.D. from three replicates.
Inhibition of CYP3A-Mediated Midazolam 1′ Hydroxylation by ERY.
ERY caused a dose- and time-dependent decrease in CYP3A activity in HepatoPac cultures (donor 1307, male, age 31, Caucasian) as measured by the formation of 1′OH midazolam (MDZ) from MDZ (Fig. 3A). Relatively stable inhibition of CYP3A activity was observed up to 72 hours for all concentrations of ERY. Inhibition of CYP3A activity was approximately 60%, 80%, and 90% for 3, 10, and 30 µM ERY, respectively. After 72 hours, however, CYP3A activity in the 3- and 10-µM treatment groups began recovering relative to the control, whereas the 30-µM ERY treatment group maintained >85% inhibition of CYP3A activity over the course of the incubation (Fig. 3B).

Time course of CYP3A activity in the presence and absence of ERY. Values represent the mean of two replicates. (A) The time-dependent changes in 1′OH MDZ activity. (B) The percent remaining CYP3A activity in the presence of ERY relative to the control.
Evaluation of the Effect of ERY on Other P450 Isoforms.
The effect of ERY on the CLint of substrates of CYP1A2, CYP2C9, CYP2C19, and CYP2D6 was also evaluated at 30 µM of ERY (Table 3). Mild inhibition was observed in the presence of 30 µM of ERY for CYP2C9 (tolbutamide, 26% inhibition) and CYP2D6 (risperidone, 21% inhibition) metabolism. Diazepam (2C19/3A) turnover was inhibited to a greater extent (74%).
Effect of ERY on other CYP450 isoforms
For incubations with diazepam, riluzole, and risperidone, CLint values were derived from the average of two replicates using donor 1307. Tolbutamide CLint values were derived from the average of three replicates each for donors 1307 and ACR. APZ CLint values were derived from the average of two to five replicates each from donors 1307, 3121B, 4202, 4297, and ACR.
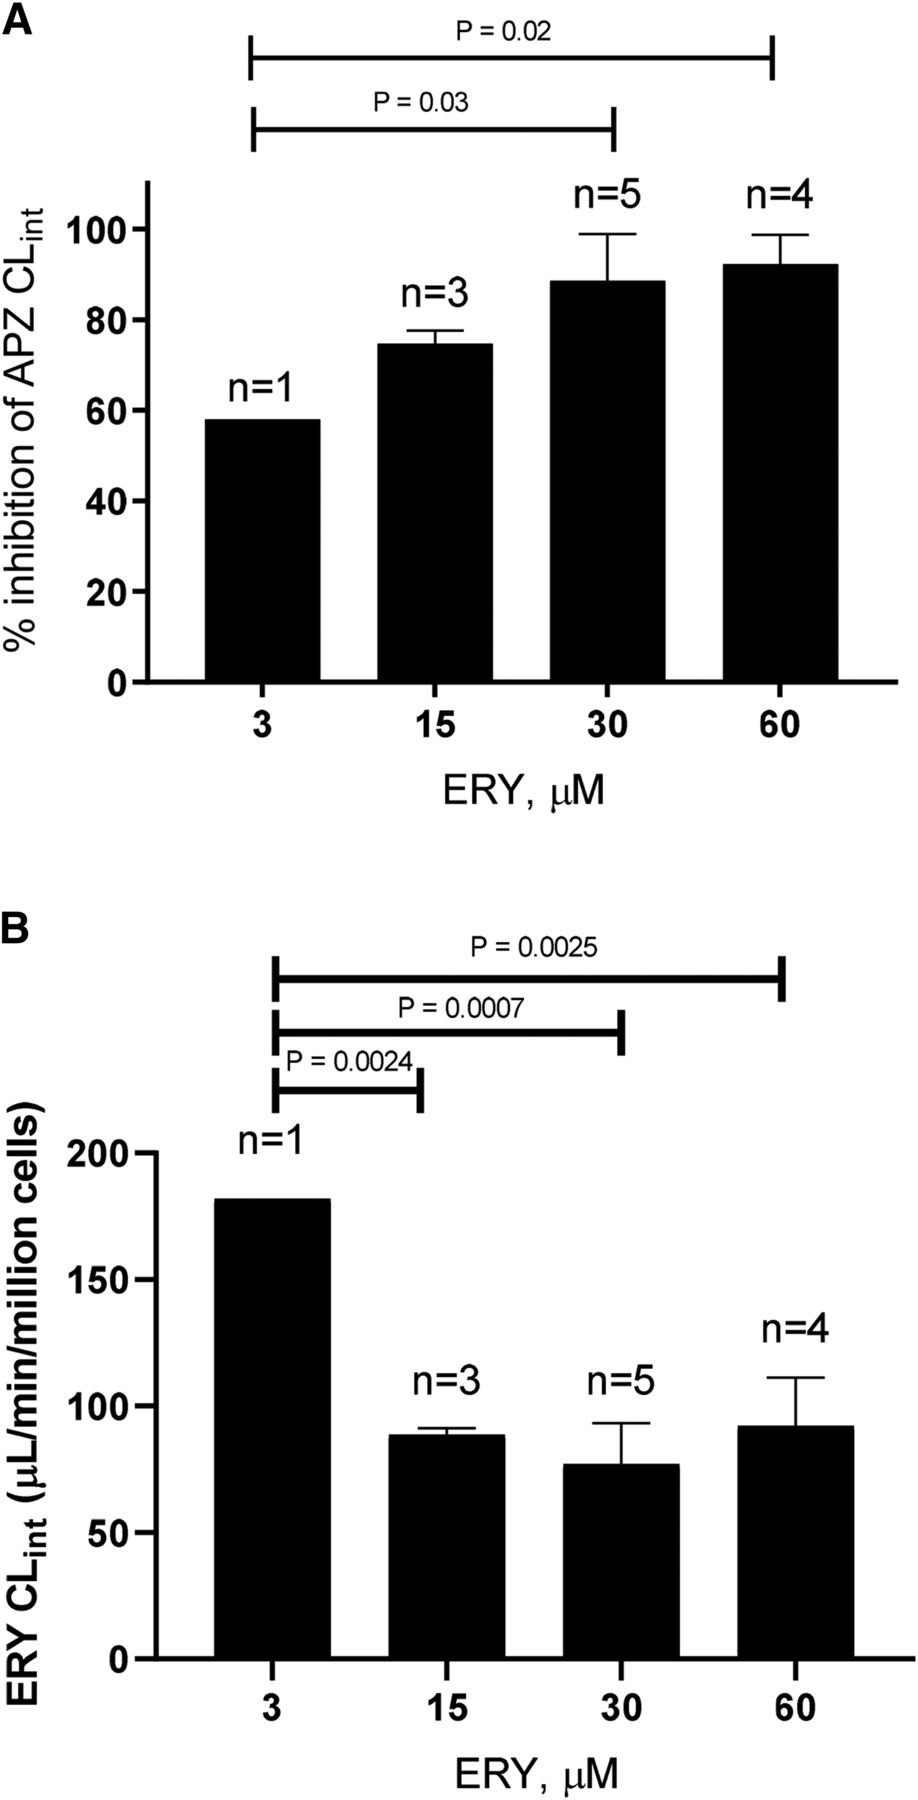
The inhibitory effect of ERY on APZ CLint was repeated with three to five additional donors at 15, 30, and 60 µM. At 30 µM of ERY, APZ CLint was, on average, inhibited by >80% (Fig. 4A). The CLint of ERY was approximately the same from 15 to 60 µM of ERY (Fig. 4B).

(A) Percent inhibition of APZ CLint by ERY in HepatoPac cultures from multiple donors. (B) ERY CLint from multiple donors at various concentrations of ERY. Values represent the mean ± S.D. of the number of donors used.
Effect of ERY on Recombinant UGT Activity.
The effect of ERY on the activity of recombinant UGTs 1A1, 1A3, 1A4, 1A6, 1A9, 2B7, and 2B15 was evaluated at 30 and 60 µM of ERY. Neither concentration of ERY was able to inhibit glucuronidation of B-estradiol glucuronidation by UGTs 1A1 and 1A3, trifluoperazine glucuronidation by UGT1A4, or 7-hydroxy-4-(trifluoromethyl) coumarin glucuronidation by UGTs 1A6, 1A9, 2B7, and 2B15 (data not shown).
Activation of Nuclear Receptors.
ERY was assessed for its potential to activate the major nuclear receptors AhR, CAR, and PXR that are involved in the induction of drug metabolism enzymes in HepatoPac cultures (lot ACR). No statistically significant increase in CYP1A2 or 2B6 mRNA were observed at any concentration of ERY evaluated. Statistically significant increases in CYP3A4 mRNA were observed at ERY concentrations of 60 µM (1.8-fold) and 120 µM (2.1-fold). In contrast, incubations with OME (50 µM), CITCO (0.1 µM), and RIF (10 µM) were associated with markedly higher mRNA fold increases in CYP1A2 (102-fold), 2B6 (16-fold), and 3A4 (8.7-fold) (Fig. 5).

CYP1A2 (A), CYP2B6 (B), and CYP3A4 (C) expression in the presence of up to 120 µM ERY, 50 µM OME, and 10 µM RIF. Values are depicted as the mean ± S.D. of three individual biologic replicates. *P < 0.05, statistically significant induction relative to the vehicle control.
Effect of ERY on Hepatocyte Viability.
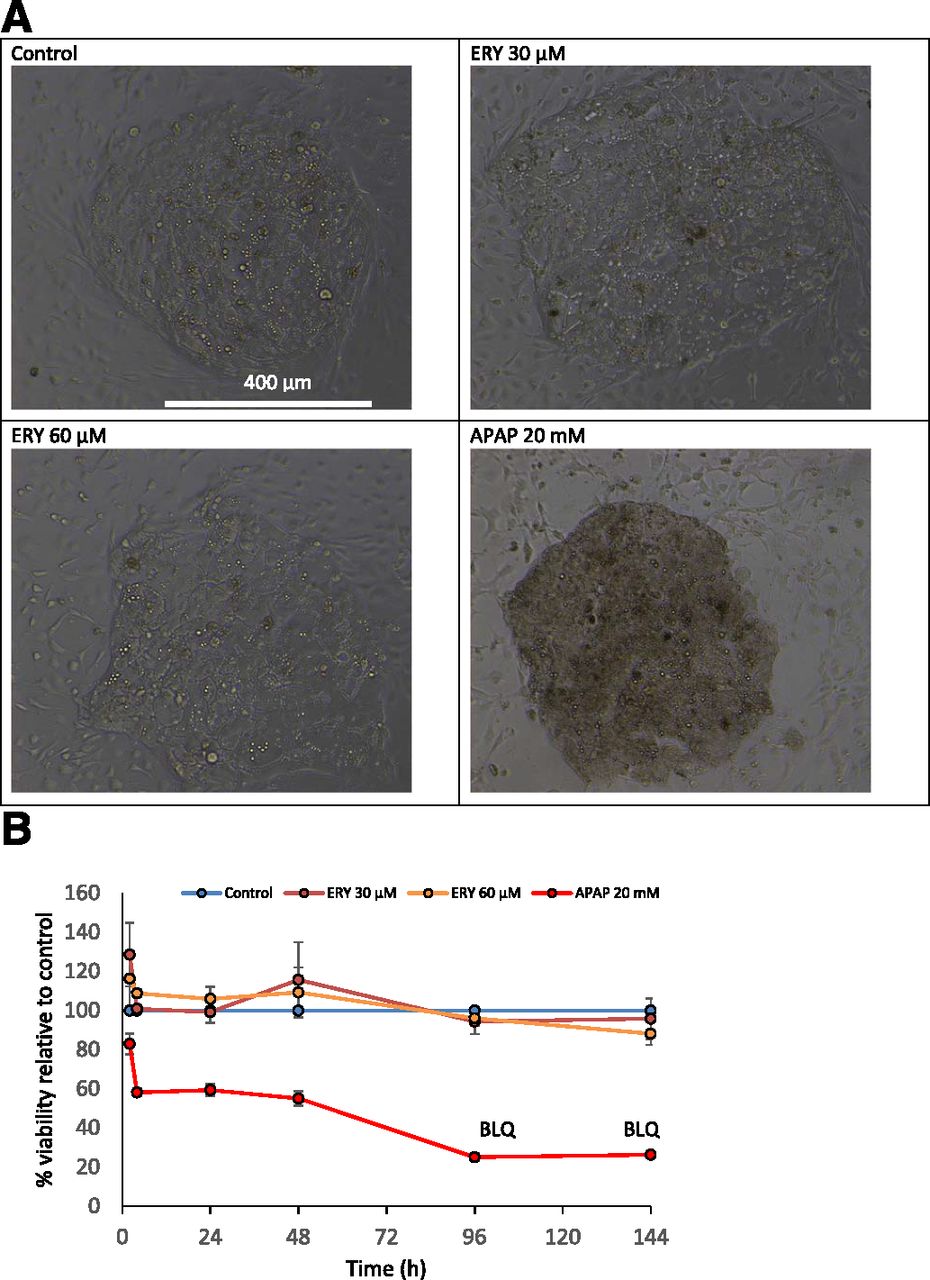
Hepatocyte viability was assessed in the presence of 30 and 60 µM of ERY by monitoring cell morphology and content of ALT in the cell fraction. Neither concentration of ERY was associated with a change in the morphology of the cells in comparison with the control (Fig. 6A). Furthermore, ERY was not shown to cause a change in ALT content in the cells. This is opposed to incubations with the positive control, acetaminophen (20 mM), which resulted in a marked decrease in the concentration of hepatocyte ALT content (Fig. 6B).

(A) Comparison of hepatocyte island morphology in the vehicle-treated control vs. hepatocyte island morphology in the presence of ERY (30 or 60 µM) and APAP (20 mM) 144 hours after start of the incubation. (B) Hepatocellular ALT content over the course of a 144 hours incubation (donor ACR). APAP, acetaminophen.
Discussion
Identification of the metabolic enzymes responsible for the elimination of drug candidates, commonly referred to as reaction phenotyping, is an important step in determining victim DDI risk. Conventional in vitro systems to study reaction phenotyping include human liver microsomes (HLM) with specific inhibitors and recombinantly expressed enzymes. For moderate or high clearance compounds, compound depletion in HLM incubations in the presence of specific inhibitors of drug-metabolizing enzymes can provide the data necessary to assign CLint values to metabolic pathways in the liver. However, for more slowly cleared compounds, lack of sufficient metabolic turnover precludes any reliable calculation of changes in CLint in the presence of inhibitors. As such, determination of CLint values for slowly cleared compounds would require synthesis of metabolite standards and extensive evaluation of metabolite formation kinetics, and resources to conduct such evaluations may not be available during early stage development.
The use of suspension hepatocytes for the conduct of CYP450 reaction phenotyping studies has been considered advantageous over the use of recombinant enzymes or microsomes, as hepatocytes in suspension generally yield greater compound turnover (through extended incubation times) and possess the complete array of hepatic drug metabolizing enzymes (Argikar et al., 2016; Matsunaga et al., 2018). However, suspension hepatocytes are limited by the relatively short lifespan, i.e., they can only be used for a maximum of 4–6 hours (Gebhardt et al., 2003; Chan et al., 2013). Such limitations of incubation time with hepatocyte suspensions have been improved by periodically replenishing incubations with freshly prepared hepatocytes in the Hepatocyte Relay Method (Yang et al., 2016). Long-term hepatocyte cultures such as cocultures, flow systems, or spheroids permit lengthier incubation durations, providing novel ways to address metabolism questions for slowly cleared compounds. In this work, we sought to determine if the enhanced metabolic competency of a long-term hepatocyte model, HepatoPac, could provide additional utility as a model to investigate reaction phenotyping of slowly cleared drugs using a CYP3A-selective inhibitor.
Earlier use of the HepatoPac model in our laboratory involved incubation of the cells without FBS to mitigate drug binding to proteins during the incubation. Initial studies without FBS included incubations involving donors 1307, 3121B, and 4202. In later studies, it was determined that overall morphology of the cells, particularly for the supporting fibroblasts, could be improved by the inclusion of 5% serum (1.6–3.5 g/l albumin and 0.65 g/l), without adversely affecting metabolism of APZ (fu,p = 0.29) and ERY (fu,p = 0.36) (Prandota et al., 1980; Gstraunthaler, 2003). Nevertheless, the inclusion of 5% serum can adversely affect the extent of depletion of substrates that are highly bound to plasma protein, which would decrease the ability to discern differences between treatments with and without ERY.
Ketoconazole.
Even though potent inhibition of CYP3A in HepatoPac was observed in the presence of KTZ (Fig. 1A), it is clear that the relatively short-lived effect of KTZ (1 µM) on CYP3A is associated with its rapid elimination (Fig. 1B). Sustained inhibitory activity would likely require higher KTZ concentrations at the expense of inhibitor selectivity because ideal concentrations of KTZ for selective inhibition of CYP3A should not exceed 1 µM in HLM (Bohnert et al., 2016). Alternatively, intermittent spiking of KTZ into the incubation could also achieve complete inhibition but was not evaluated in this study. For incubations with compounds that are more rapidly metabolized by hepatic CYP3A and that therefore do not require long incubation durations, KTZ can still provide a high degree of selective CYP3A inhibition. For more slowly eliminated compounds, the effect of the inhibitor must be sustained long enough for near-complete inhibition of the enzyme to discriminate parent turnover in the presence versus absence of the inhibitor. As such, the use of reversible inhibitors such as KTZ should not exceed durations that would lead to excessive depletion of KTZ and its associated inhibitory activity. In this study, the duration of effective CYP3A inhibition by KTZ at 1 μM is 1 day. Assuming first-order elimination kinetics with a half-life of 8 hours, the Ki value KTZ (∼76 nM) (von Moltke et al., 1994) would be reached by approximately 31 hours after the start of the incubation. Using the same calculation method, if 3 µM of KTZ is used, the Ki for KTZ should be reached by approximately 130 hours after the start of the incubation. These estimations are in good agreement with the data observed in this study (Fig. 1). At higher concentrations of KTZ, greater care should be exercised in accounting for loss of selectivity for CYP3A inhibition (Newton et al., 1995).
Erythromycin.
ERY at concentrations tested up to 60 µM was shown to be nontoxic to HepatoPac cultures over an incubation duration of up to 144 hours (Fig. 6), confirming the absence of any confounding effects it may have on viability of the cells. Time-dependent inactivation of CYP3A, which requires enzyme resynthesis as well as inactivator depletion to recover CYP3A activity, should result in a longer lasting inhibition of CYP3A activity compared with reversible inhibitors (Di, 2017). The KI and kinact values for ERY in HLM are 5.3 µM and 0.06 minutes−1, respectively (Chen et al., 2011). First-order loss of enzyme activity through inactivation can be described by the Michaelis-Menten model, where λ is the rate constant for loss of CYP3A activity and assuming complete permeability of ERY and full access to the CYP3A active site (eq. 1): (1)
(1)
At 20 µM of ERY (average concentration in incubation with 30 µM of ERY for donor 1307), CYP3A activity should be diminished to approximately 1%, 3.5 hours after the start of the incubation (Mayhew et al., 2000). This is a relatively short period of time in comparison with the full incubation period of 6 to 7 days. Even at 0.78 µM of ERY, which is the concentration of ERY remaining at the end of the incubation with 3 µM of ERY, CYP3A activity should have been diminished to approximately 1% by 10 hours, using the HLM parameters shown above. In the same study, inactivation parameters generated by using cryopreserved human hepatocytes in suspension were found to have approximately 10-fold lower inactivation efficiency, which was mainly due to a higher KI value (Chen et al., 2011). Although not evaluated, the authors hypothesized that the discrepancy between observed inactivation in microsomes and hepatocytes could be due to nonspecific binding, transport, or metabolism that is not present in the microsomal system. Using ERY inactivation parameters from these hepatocyte studies, a 25% loss of CYP3A4 activity would be expected by 48 hours using 3 µM of ERY, which is more consistent with the observations in this study. The discrepancy between the lower levels of inhibition observed in this study and the estimated calculations from parameters derived from HLM experiments could also be due to enzyme synthesis (Chan et al., 2018), which has also been shown to occur in the HepatoPac model (Ramsden et al., 2015). In addition, inhibitors that can activate nuclear receptors (e.g., ritonavir) can increase the synthesis rate of enzymes, further complicating the interpretation of the effect of the inhibitor on induced enzymes . In this study, ERY has been shown to cause very mild in vitro induction of CYP3A4 at concentrations up to 120 µM (Fig. 5C). It is possible that this mild level of induction could also counteract the inactivation of CYP3A, thus adding to the discrepancy between expected inhibition of CYP3A based on HLM data. ERY was not shown to activate AhR and CAR in this study as defined by mRNA fold increases in CYP1A2 and 2B6 that were ≥ 2. Furthermore, for CYP2B6, increases in mRNA content at any concentration of ERY evaluated were not found to be significantly different than the vehicle control. PXR activation as defined by a 2-fold increase in CYP3A4 mRNA was also not observed at up to 60 µM of ERY, whereas 120 µM of ERY only resulted in a 2.1-fold increase in CYP3A4 mRNA (Fig. 5). These results are consistent with a previous study demonstrating that the inducing effects of ERY on drug metabolizing enzymes appear to be markedly lower in comparison with other macrolide antibiotic CYP3A inactivators, such as troleandomycin (Ledirac et al., 2000). Sustained inhibition of CYP3A activity was observed with ERY concentrations ≥ 30 µM (Figs. 2A, 3B, and 4A) with minimal increase in CYP3A gene expression (1.8-fold) or significant loss in hepatocyte viability (Fig. 6), suggesting that this is an ideal concentration of ERY to be used for selectively inhibiting CYP3A in vitro. It is important to emphasize that these interpretations are confined to the use of ERY as an in vitro tool in long-term cultures such as HepatoPac and should not be interpreted in the context of its use as clinical DDI tool.
ERY is also a relatively selective inhibitor of CYP3A in the HepatoPac model as indicated by weak to no inhibition of CLint for substrates of several other major CYP450s (Table 2). Marked inhibition of diazepam CLint could be explained by data showing that diazepam is metabolized partly by CYP3A (60%) and CYP2C19 (40%) (Andersson et al., 1994). It is more difficult to understand why ERY inhibited tolbutamide clearance by 26% and riluzole clearance by 21%; to our knowledge, neither tolbutamide or riluzole have been reported to be substrates of CYP3A, and ERY has not been shown to be an inhibitor of CYP1A or CYP2C isoforms. Early studies in HLM have demonstrated inhibitory potential of KTZ on tolbutamide metabolism but with a very high IC50 value of 18 µM (Back et al., 1989). Also, the metabolism of the anticancer agent, 5,6-dimethyxanthenone-4-acetic acid (DMXAA), a substrate of CYP1A2, was shown to be inhibited by ERY by up to 31% in HLM, but only at a very high concentration (500 µM). Essentially no inhibition of DMXAA metabolism was observed at 100 µM ERY. Further assessment of the potential inhibition of CYP1A and CYP2C9 by ERY in HepatoPac cultures could benefit from the use of other CYP2C9 substrates and HepatoPac donors, particularly because the ERY has already been used in in vitro studies to help determine CYP3A contribution to metabolism. Some examples of the in vitro use of ERY as a selective CYP3A inhibitor include the anticancer drug 5,6- DMXAA, the analgesic, elitriptan, and dihydrocodeine (Kirkwood et al., 1997; Zhou et al., 2000; Evans et al., 2003). Regulatory authorities also list ERY as a prototypical moderate CYP3A inhibitor for use in clinical studies. Because this is the first time that ERY has been used as an inhibitor in the HepatoPac model, it is possible that distinguishing characteristics of the model could lead to CYP1A and 2C results, which are not completely consistent with more conventional models.
With respect to non-P450 drug-metabolizing enzymes, results using recombinant UGTs in this study demonstrated that ERY is also not likely to inhibit major UGT isoforms. Consistent with this, Takeda et al. (2006) reported that ERY did not inhibit UGT2B7 morphine glucuronidation. ERY however, has been shown to possess inhibitory activity against aldehyde oxidase (IC50 = 15 µM in HLM) (Obach et al., 2004) and P-glycoprotein (P-gp) (Eriksson et al., 2006; Eberl et al., 2007). As such, caution should be exercised in interpreting results using ERY when evaluated with a substrate of aldehyde oxidase or P-gp. P-gp inhibition could potentially alter metabolic turnover of compounds through alteration of intracellular concentrations.
In summary, based on its sustained inhibition of CYP3A, mild ability to activate PXR, relative selectivity, and tolerability in cell cultures, ERY may be a useful tool in combination with long-term hepatocyte cultures to study the contribution of CYP3A to overall hepatic metabolism of low-clearance compounds. The use of metabolically active, long-term models such as HepatoPac for reaction phenotyping studies can further benefit from the discovery of inhibitors with greater potency, selectivity. and stability (Khojasteh et al., 2011; Di, 2017).
Authorship Contributions
Participated in research design: Chan.
Conducted experiments: Chan, Scaringella, Raymond.
Performed data analysis: Chan, Scaringella, Raymond.
Wrote or contributed to the writing of the manuscript: Chan, Taub.
Footnotes
- Received February 20, 2020.
- Accepted April 29, 2020.
Abbreviations
- AhR
- arylhydrocarbon receptor
- ALT
- alanine transaminase
- APZ
- alprazolam
- CAR
- constitutive androstane receptor
- CL
- Clearance
- CLint
- intrinsic clearance
- DDI
- drug-drug interaction
- DMXAA
- 5,6-dimethyxanthenone-4-acetic acid
- ERY
- erythromycin
- HLM
- human liver microsome
- KTZ
- ketoconazole
- MDZ
- midazolam
- MRM
- multiple reaction monitoring
- P450
- cytochrome P450
- PCR
- polymerase chain reaction
- P-gp
- P-glycoprotein (MDR-1)
- PXR
- pregnane-X-receptor
- RIF
- rifampicin
- UGT
- uridine diphosphoglucuronosyl transferase
- Copyright © 2020 by The American Society for Pharmacology and Experimental Therapeutics


