


Article Figures & Data
Figures
- Fig. 1.
Inhibition of OATP1B1-mediated uptake of [3H]E1S (A), [3H]E2G (B), atorvastatin (C), pitavastatin (D), and rosuvastatin (E) after preincubation with CsA. The cells were washed with transport buffer prewarmed at 37°C and were then pretreated for 5 minutes with the transport buffer without substrates or inhibitors. The medium was then replaced with the transport buffer containing inhibitors at the various concentrations of CsA, and cells were further preincubated for 0 or 30 minutes at 37°C. After the preincubation, the transport buffer containing inhibitors was removed, and the reaction was then started by applying prewarmed fresh transport buffer containing [3H]E1S, [3H]E2G, atorvastatin (0.3 μM), pitavastatin (0.5 μM), or rosuvastatin (3 μM) and the inhibitors to the cells. At 0.5 minutes ([3H]E1S and [3H]E2G) or 1 minute (atorvastatin, pitavastatin, and rosuvastatin), the reaction solution was removed by aspiration, and cells were washed with ice-cold transport buffer. The OATP1B1-mediated uptake was obtained by subtracting the uptake in HEK293/mock cells from that in HEK293/OATP1B1 cells. Data are shown as percentage mean uptake volume values ± S.E. of three to six wells in one to two independent experiments compared with those of the control.
- Fig. 2.
Inactivation of OATP1B1-mediated uptake of [3H]E1S (A), [3H]E2G (B), atorvastatin (C), pitavastatin (D), and rosuvastatin (E) after preincubation with CsA. HEK293/OATP1B1 cells were preincubated with CsA at 0 (〇, black), 0.02 (△, blue), 0.05 (□, green), 0.1 (●, orange), 0.2 (▲, red), and 0.5 μM (■, purple) for [3H]E1S and [3H]E2G and 0 (〇, black), 0.005 (△, blue), 0.01(□, green), 0.02 (●, orange), 0.05 (▲, red), and 0.1 μM (■, purple) for atorvastatin, pitavastatin, and rosuvastatin for the designated periods. After preincubation, the cells were washed once with prewarmed transport buffer and incubated with each substrate. At 0.5 ([3H]E1S and [3H]E2G) or 1 minute (atorvastatin, pitavastatin, and rosuvastatin), the reaction solution was aspirated, and the cells were washed twice with ice-cold transport buffer, followed by determination of their uptake. Uptake values are represented as the percentage of the activity obtained in the vehicle control samples and are plotted vs. the preincubation period. Each symbol represents the mean ± S.E. of three wells in a single experiment.
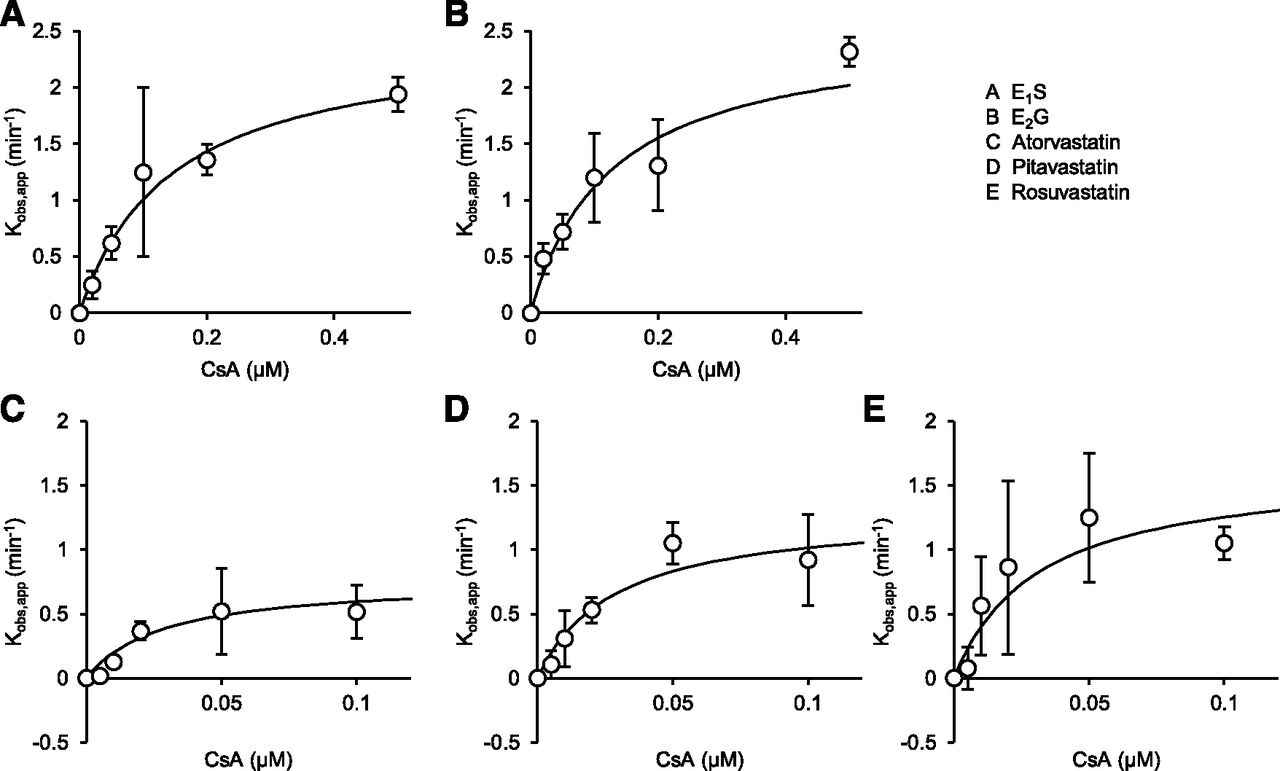
- Fig. 3.
Observed kobs,app values of OATP1B1-mediated uptake of [3H]E1S (A), [3H]E2G (B), atorvastatin (C), pitavastatin (D), and rosuvastatin (E) vs. CsA concentration. The kobs,app values were determined as the negative slopes of the natural logarithm (0–20 seconds for [3H]E1S, [3H]E2G, pitavastatin, and rosuvastatin; 0–3 minutes for atorvastatin) shown in Fig. 2. Solid lines represent the fitting curves of the observed kobs,app vs. CsA concentration by nonlinear regression analysis based on eq. 2. Each symbol represents the mean ± S.E. of three wells in a single experiment.
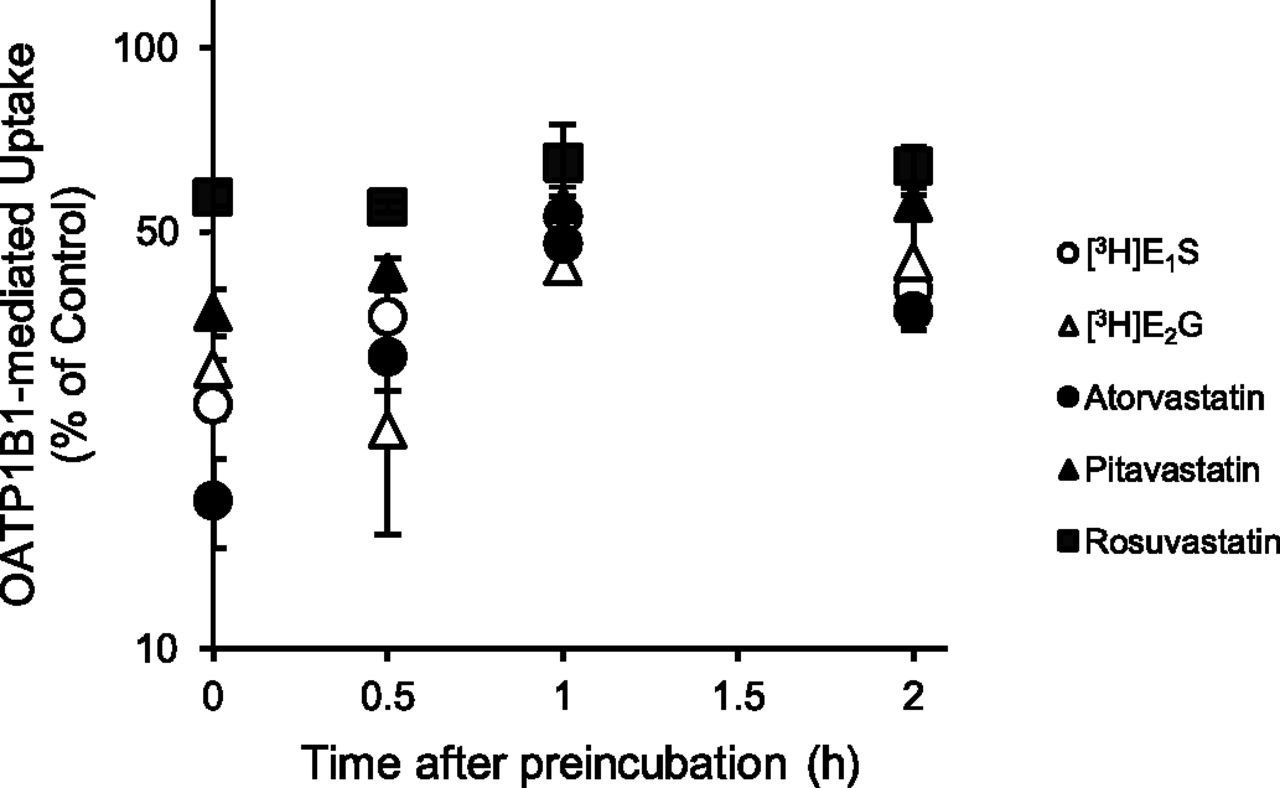
- Fig. 4.
Recovery of OATP1B1 activity after preincubation with CsA. HEK293/OATP1B1 cells were preincubated with culture medium containing CsA (0.3 μM) for 30 minutes. The medium was replaced with fresh culture medium and further incubated in the absence of CsA for the designated periods. The cells were then washed with prewarmed transport buffer once, and the transport buffer, including [3H]E1S (〇), [3H]E2G (△), atorvastatin (●), pitavastatin (▲), and rosuvastatin (■), was added, followed by determination of their uptake. Data are normalized with the control value obtained without the inhibitor and are shown as means ± S.E. of three wells in a single experiment.
- Fig. 5.
Screening of preincubation-dependent OATP1B1 inhibitors. HEK293/OATP1B1 and HEK293/mock cells were first preincubated with each compound at 1 µM for 30 minutes (closed column) or subjected to no preincubation (open column). Cells were then incubated with [3H]E1S and each compound for 0.5 minutes, followed by determination of OATP1B1-mediated uptake. Data are shown as the percentages of OATP1B1-mediated uptake obtained in the vehicle control samples of three wells in a single experiment.


Tables
- TABLE 1
Kinetic parameters for inhibition, inactivation, and recovery of OATP1B1 activity and estimation of DDI potential of CsA
Substrates IC50 (μM) kinacta kIa kobsb krecoveryc fu,p Iu,inlet, maxd fe R0f R1f R2f R3f Observed AUC Ratio Pre(−)g Pre(+)h min−1 μM min−1 min−1 (CsA) μM (R0′)e (R1′)e (R2′)e (R3′)e E1S 0.169 0.0354 2.47 0.145 0.369 0.0122 0.0107 0.0117 0.77 1.11 1.48 3.93 3.98 — (1) (1.15) (1.72) (31.2) (36.0) E2G 0.319 0.0548 2.53 0.126 0.426 0.00798 1 1.08 1.47 54.4 58.7 — (1) (1.08) (1.47) (54.4) (58.7) Atorvastatin 0.351 0.0319 0.734 0.0297 0.339 0.0161 0.8 1.06 1.55 4.23 4.28 9.0, 15hi (1) (1.07) (1.80) (22.1) (23.7) Pitavastatin 0.119 0.0239 1.3 0.0282 0.617 0.00702 0.43 1.08 1.29 1.74 1.74 4.6hi (1) (1.21) (2.07) (88.9) (108) Rosuvastatin 0.193 0.0312 1.64 0.0309 0.74 0.00227 0.82 1.10 1.59 5.48 5.49 7.1hi (1) (1.13) (1.82) (327) (371) ↵a Calculated using eq. 2 based on the data shown in Fig. 3.
↵b Calculated using eq. 8.
↵c Calculated by replotting the data shown in Fig. 4 into σ-minus plot in logarithmic scale, followed by linear regression analysis.
↵d Calculated using eq. 5 based on the data shown in Supplemental Table 3.
↵e R0′, R1′, R2′, and R3′ values were calculated by assuming f value as unity.
↵f R0 (R0′) and R1 (R1′) values were estimated based on direct inhibition, R2 (R2′) values were estimated based on inactivation/recovery kinetics, and R3 (R3′) values were estimated based on both direct inhibition and inactivation/recovery kinetics.
↵g IC50 values estimated without preincubation.
↵h IC50 values estimated after 30 min preincubation with CsA.
↵i Yoshida et al. (2012).
- TABLE 2
Kinetic parameters for inhibition, inactivation, and recovery of OATP1B1 activity and estimation of DDIs potential of preincubation-dependent inhibitors
Inhibitors IC50 Values (μM) kinacta kIa kobsb krecoveryc Iu,inlex, maxd R0e R1e R2e R3e Observed AUC Ratio Pre(−)f Pre(+)g min−1 μM min−1 min−1 μM (R0′)e (R1′)e (R2′)e (R3′)e Regorafenib >10 0.403 0.322 5.44 0.00757 0.0378 0.0769 (1.01) (1.19) (1.12) (1.13)h NAi Nilotinib >10 0.235 0.411 2.05 0.0154 0.0627 0.0797 (1.01) (1.34) (1.25) (1.26)h NAi Pazopanib 1.42j 0.314j 1.03 0.261 0.0422 0.0416 0.0272 (1.02) (1.09)j (3.34) (3.40) 1.26k, 1.89l Asunaprevir 0.17 0.0349 3.51 0.639 0.00565 0.289 0.00994 1.06m (1.05) 1.22m (1.28) 1.43m (1.58) 1.49m (1.67) 1.41n ↵a Calculated using eq. 2 based on the data shown in Supplemental Fig. 2.
↵b Calculated using eq. 8.
↵c Calculated by replotting the data shown in Supplemental Fig. 3 into σ-minus plot in logarithmic scale, followed by linear regression analysis.
↵d Calculated using eq. 5 based on the data shown in Supplemental Table 3.
↵e R0 (R0′) and R1 (R1′) values were estimated based on direct inhibition, R2 (R2′) values were estimated based on inactivation/recovery kinetics, and R3 (R3′) values were estimated based on both direct inhibition and inactivation/recovery kinetics.
↵f IC50 values estimated without preincubation.
↵g The lowest IC50 values shown in Supplemental Table 4.
↵h IC50,pre(−) is assumed to be 10 μM since inhibition did not reach 50% at maximum inhibitor concentration (10 μM).
↵i Not applicable.
↵j Cited from Taguchi et al. (2019).
↵k Hamberg et al. (2015).
↵l Calculated based on AUC of SN-38 after administration of irinotecan (Bennouna et al., 2015).
↵m f = 0.82 (rosuvastatin).
↵n Calculated based on AUC of rosuvastatin (Eley et al., 2015).
Data Supplement
- Supplemental Data -
Supplementary Figure 1 - OATP1B1 activity after preincubation with regorafenib, nilotinib, and asunaprevir.
Supplementary Figure 2 - Observed kobs,app values for OATP1B1-mediated transport of [3H]E1S versus OATP1B1 inhibitor concentration.
Supplementary Figure 3 - Recovery of OATP1B1 activity after preincubation with OATP1B1 inhibitors.
Supplementary Table 1 - Validation of bioanalytical methods.
Supplementary Table 2 - Concentrations used in in vitro study and reported Km values of OATP1B1 substrates.
Supplementary Table 3 - Pharmacokinetic parameters of preincubation-dependent OATP1B1 inhibitors.
Supplementary Table 4 - Effect of preincubation with regorafenib, nilotinib, pazopanib, and asunaprevir on OATP1B1-mediated uptake.
Supplementary References
- Supplemental Data -


