


Abstract
In drug discovery, the extent of brain penetration as measured by free brain/plasma concentration ratio (Kp,uu) is normally determined from one experiment after constant intravenous infusion, and pharmacokinetics (PK) parameters, including clearance (CL), volume of distribution at steady state (Vss), and effective half-life (t1/2,eff) are determined from another experiment after a single intravenous bolus injection. The objective of the present study was to develop and verify a method to simultaneously determine Kp,uu and PK parameters from a single intravenous infusion experiment. In this study, nine compounds (atenolol, loperamide, minoxidil, N-[3-(4′-fluorophenyl)-3-(4′-phenylphenoxy)propyl]sarcosine, sulpiride, and four proprietary compounds) were intravenously infused for 4 hours at 1 mg/kg or 24 hours at 1 or 6 mg/kg or bolus injected at 1 mg/kg. Plasma samples were serially collected, and brain and cerebrospinal fluid samples were collected at the end of infusion. The PK parameters were obtained using noncompartmental analysis (NCA) and compartmental analysis. The Kp,uu,brain values of those compounds increased up to 2.86-fold from 4 to 24 hours. The CL calculated from infusion rate over steady-state concentration from the 24-hour infusion studies was more consistent with the CL from the intravenous bolus studies than that from 4-hour infusion studies (CL avg. fold of difference 1.19–1.44 vs. 2.10). The compartmental analysis using one- and two-compartment models demonstrated better performance than NCA regardless of study design. In addition, volume of distribution at steady state and t1/2,eff could be accurately obtained by one-compartment analysis within 2-fold difference. In conclusion, both unbound brain-to-plasma ratio and PK parameters can be successfully estimated from a 24-hour intravenous infusion study design.
Significance Statement We demonstrated that the extent of brain penetration and pharmacokinetic parameters (such as clearance, Vss, and effective t1/2) can be determined from a single constant intravenous infusion study in rats.
Introduction
The blood-brain barrier (BBB) is a physiologic barrier formed by brain capillary endothelial cells with tight and adherens junctions (Rubin and Staddon, 1999; Abbott et al., 2010), which contribute to protecting the brain from endogenous and exogenous toxic compounds. In drug development, BBB is the major obstacle for the drug development targeting the central nervous system (CNS). The evaluation on the extent of brain penetration of drug candidates is one of the essential steps that is conducted during drug discovery and development for CNS diseases. It is also important for non–CNS-targeting drugs from a safety perspective. The brain penetration is commonly expressed as a brain-partitioning coefficient or brain-to-plasma concentration ratio based on either total and unbound concentrations at steady state [total brain-to-plasma ratio (Kp,brain) and unbound brain-to-plasma ratio (Kp,uu,brain)] (Hammarlund-Udenaes et al., 2009; Reichel, 2009; Freeman et al., 2019). Since only the protein unbound drug is assumed to bind to the target (Stain-Texier et al., 1999; Bouw et al., 2000) and produce therapeutic effects, the Kp,uu,brain is more physiologically relevant and widely used to describe the extent of brain penetration. Moreover, it also provides insight into the transport mechanism of a compound at BBB (Bostrom et al., 2006; Chen et al., 2014; Summerfield et al., 2016). Because of these reasons, Kp,uu,brain is an essential factor being considered with respect to pharmacology as well as pharmacokinetics of a compound in the early drug development (Hammarlund-Udenaes et al., 2008, 2009).
In general, the in vivo animal experiments to estimate Kp,uu,brain and pharmacokinetics (PK) characteristics of a compound targeting CNS diseases are performed separately. For Kp,uu,brain evaluation, 4-hour intravenous infusion study using a cassette dosing is commonly used to determine Kp,brain values of several compounds in the discovery stage/step (Fridén et al., 2010; Nagaya et al., 2016). Then the PK characteristics of the ones with favorable brain penetration are further investigated via intravenous bolus injection. Although this study flow can accurately characterize the pharmacokinetics of a compound, it takes time and may not be cost-effective because two separate animal experiments are needed. If the key PK parameters of each compound can be simultaneously estimated along with Kp,uu,brain from the same study, we can improve the efficiency for the experiment and reduce the usage of animals.
Herein, we performed intravenous bolus and intravenous infusion studies for 4 or 24 hours to evaluate Kp,uu,brain of nine compounds in rats, among which five were commercially available compounds, and four were proprietary compounds. Those compounds represent compounds with a wide range of clearance (CL) (i.e., low, medium, and high). One- and two-compartment models were applied to estimate the PK parameters [e.g., CL, Vss, and effective half-life (t1/2,eff)], and the performance of the two models was evaluated as compared with the PK parameters after intravenous bolus injection.
Materials and Methods
Chemicals.
Atenolol, loperamide, minoxidil, and sulpiride were obtained from Sigma-Aldrich (St. Louis, MO), and N-[3-(4′-fluorophenyl)-3-(4′-phenylphenoxy)propyl]sarcosine (NFPS) was purchased from Tocris Bioscience (Minneapolis, MN). Four proprietary compounds (compounds A, B, C, and D) were synthesized at Biogen. All chemicals used in the experiments were of the highest available grade.
Animal Experiments.
Jugular vein and carotid artery cannulated male Sprague-Dawley rats were purchased from Charles River Laboratory (Wilmington, MA). Upon arrival, the rats were acclimated for at least 3 days on a 12-hour light/dark cycle in a temperature- and humidity-controlled environment with free access to food and water. Animal experiments for proprietary and commercial compounds were separately conducted as two cassette administrations to rats, respectively (Nagilla et al., 2011; Liu et al., 2012). For both proprietary and commercial compounds, the dosing solution was prepared by dissolving compounds with 20% captisol and filtered with 0.2-µm syringe filter (Pall Life Sciences, Port Washington, NY). Then compounds were intravenously injected (1 mg/kg) or infused over 4 hours (1 mg/kg) or 24 hours (1 and 6 mg/kg) in rats (n = 3 for each group). Blood samples (100 µl) were serially collected from the left carotid artery into EDTA-containing tubes (SAI Infusion Technologies, Lake Villa, IL) at predetermined time points after dosing. For proprietary compounds, blood samples were collected prior to dosing and at 0.083, 025, 0.5, 0.75, 2, 4 (last sampling for 4-hour infusion group), 7, 10, 16, 22, and 24 hours postdosing. For commercial compounds, blood samples were withdrawn prior to dosing and at 0.083, 0.25, 0.5, 0.75, 1, 3, 5, 10, and 24 hours after a single intravenous injection and at 0.5, 1, 2, 4 (last sampling for 4-hour infusion group), 8, 16, 22, and 24 hours after intravenous infusion. After blood sampling, the same volume of heparinized saline (20 IU/ml) was injected to compensate for blood loss in rats. Plasma samples were prepared after centrifugation at 10,000 rpm for 5 minutes. At the last sampling time, cerebrospinal fluid (CSF) samples were collected from cisterna magna after CO2 euthanasia and were immediately diluted with the equivalent volume of 8% bovine serum albumin (BSA) in PBS. Then, brain samples were harvested. The collected samples were stored at −80°C until analysis. All animal experiments were approved by the Institutional Animal Care and Use Committee at Biogen, and the study was conducted in compliance with the institutional guidelines.
Sample Analysis.
Standard calibration curves were prepared using a serial dilution scheme of analytes in blank rat matrix. All standard calibrants were aliquoted into the extraction plate and normalized at a ratio of 1:1:1 to contain an equal mixture of plasma, brain homogenate, and artificial cerebrospinal fluid and 8% BSA (5:5 v/v). The collected brain samples were homogenized with two times of volume (w/v) of PBS (pH 7.4), and 20 µl brain homogenate was mixed with the same volume of blank plasma and mixture of artificial cerebrospinal fluid and 8% BSA (5:5 v/v). For plasma sample preparation, 20 µl of plasma sample was mixed with the same volume of brain homogenate and blank mixture of artificial cerebrospinal fluid and 8% BSA (5:5 v/v). For CSF sample preparation, 20 µl of CSF sample was added into 20 µl of each blank plasma and brain homogenate. Then proteins in a total of 60 µl of the standard, matrix blanks, or a sample were precipitated with 360 µl of acetonitrile or acetonitrile containing internal standards (glyburide, carbutamide, and chrysin). After vortexing and centrifuging at 3500 rpm for 10 minutes, 250 µl of supernatant was transferred into a 96-well injection plate and dried under nitrogen gas at 40°C. Then samples were reconstituted with 100 µl the mixture of water and acetonitrile (50:50 v/v) and analyzed with high-performance liquid chromatography equipped with mass spectrometry (Triple Quad 5500 System; AB Sciex, Framingham, MA). Mobile phases used were 0.1% formic acid in water and 0.1% formic acid in acetonitrile along with an Ace EXCEL 3 C18-PFP 2.1 × 50–mm column (3 µm particle size; Advanced Chromatography Technologies Ltd., Aberdeen, Scotland).
Single Intravenous Bolus Injection Data Analysis.
Noncompartmental analysis (NCA) was applied to estimate PK parameters from the intravenous bolus injection data. PK parameters including CL, volume of distribution at steady state (Vss), dose-normalized area under the plasma concentration-time curve (AUC∞/dose), and terminal half-life (t1/2,terminal) were estimated by Phoenix WinNonlin (version 7.0; Pharsight Corporation, Cary, NC). The t1/2,eff was calculated using eq. 1. It was proposed to reflect drug accumulation after multiple doses (Boxenbaum and Battle, 1995), whereas t1/2,terminal is a dependent parameter upon elimination phase. This treatment is a simplification of a more complex pharmacokinetic process in drug discovery wherein t1/2 is estimated from predicted CL and Vss. (1)
(1)
Intravenous Infusion Data Analysis.
Total (Kp,brain) and unbound (Kp,uu,brain) brain-to-plasma partition coefficients as well as the unbound CSF-to-plasma ratio (Kp,uu,CSF) were calculated as follows: (2)
(2) (3)
(3) (4)Cbrain, Cp, and CCSF are total brain, plasma, and CSF concentrations at the end of infusion, respectively, and fu,brain and fu,p are unbound fractions in the brain and plasma, respectively. The unbound fraction in the CSF (fu,CSF) was calculated from fu,p using a single binding site model as follows (Fridén et al., 2009):
 (5)
(5)
Qalb is the ratio of albumin in CSF over that in plasma, which was set to 0.003 for rats (Habgood et al., 1992).
Noncompartmental analysis was applied to determine CL from 4- to 24-hour infusion data using the following equation: (6)The plasma concentration at steady state (Css) was defined as the plasma concentration at 4 hours for the 4-hour infusion study and average plasma concentration of 22 and 24 hours for the 24-hour infusion study. In addition, the compartmental analysis was performed using both one- and two-compartment models, which were incorporated in Phoenix WinNonlin (version 7.0; Pharsight Corporation), to estimate the PK parameters, particularly for Vss, which cannot be obtained via noncompartmental analysis in this study. Using the obtained CL and Vss, the t1/2,eff was calculated using eq. 1 (Gunaydin et al., 2018; Smith et al., 2018), since the t1/2,terminal could not be estimated because of the lack of elimination phase of the infusion data.
The PK parameters were shown as mean ± S.D. The one-way ANOVA with post hoc Tukey’s test was performed to compare Kp,brain or Kp,uu,brain values among different study designs using GraphPad Prism (version 8.3.0; San Diego, CA), and P values <0.05 were considered statistically significant. Moreover, the estimated CL, Vss, and t1/2,eff values of each compound from constant infusion studies were divided by those from bolus injection to obtain the fold difference to compare the performance of different study designs as well as the data analysis methods. The average fold difference was calculated to assess the performance of different estimation approaches. Simple linear regression was performed to seek correlations of the calculated PK parameters after a single intravenous injection with the estimated PK parameters by NCA and/or compartmental analyses after intravenous infusion. The correlations plots for CL, Vss, and t1/2,eff were depicted in Supplemental Figs. 1–3, respectively.
Results
Pharmacokinetics after a Single Intravenous Injection.
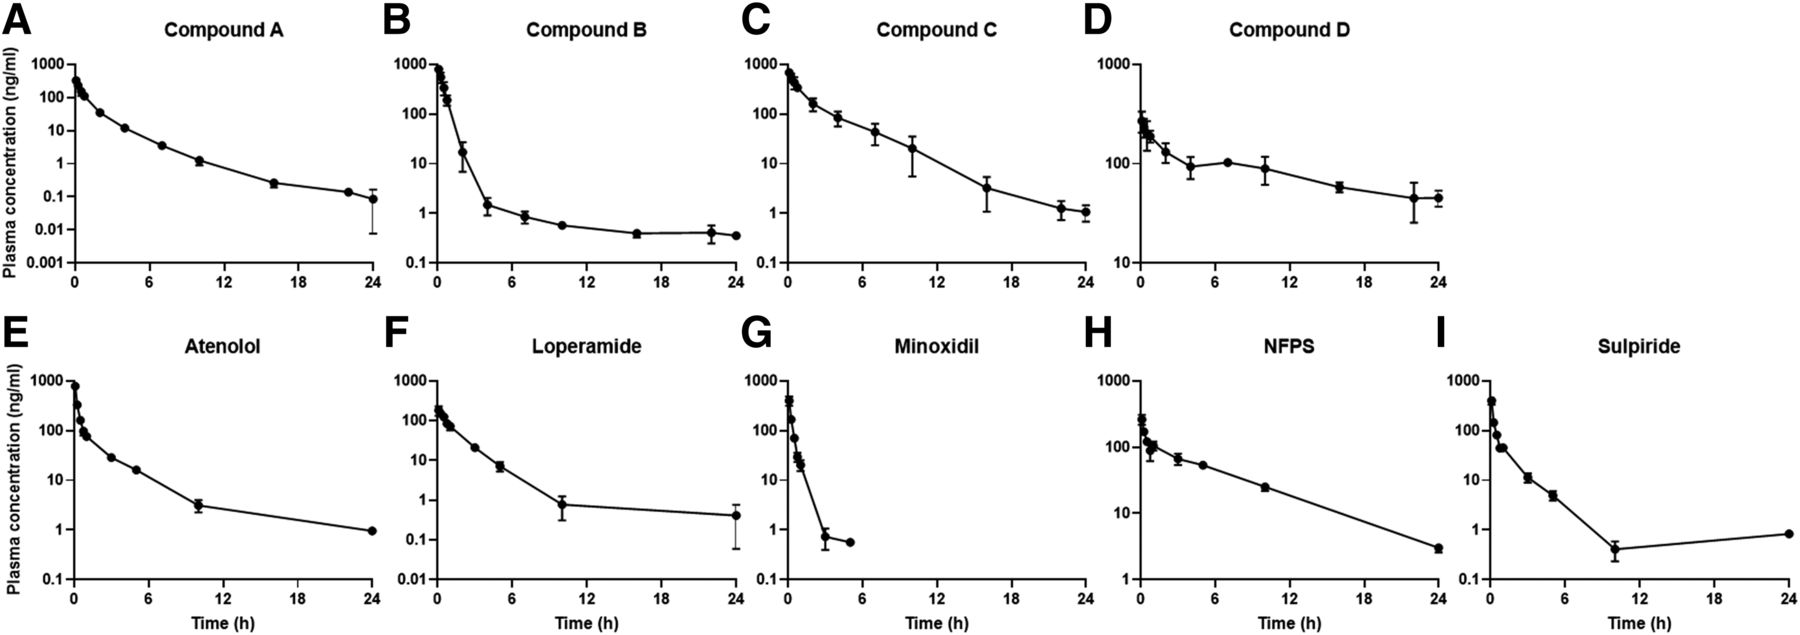
The plasma-concentrations-versus-time profiles of the proprietary (four compounds) and commercial compounds (five compounds) after the single intravenous injection were depicted in Fig. 1, and the estimated PK parameters for each compound were shown in Table 1. Most of the compounds exhibited lower CL than the hepatic blood flow rate (55 ml/min/kg) (Davies and Morris, 1993) except for minoxidil (113 ml/min/kg) and sulpiride (82.9 ml/min/kg). For Vss, all of the test compounds were higher than 1 l/kg (Kwon, 2001), although some had large variations in Vss possibly due to a small sample size. The t1/2,terminal ranged between 1.89 and 48.9 hours, whereas the t1/2,eff values were relatively smaller than t1/2,terminal, for which the values were between 0.79 and 15.1 hours (Table 1). The fractions of the unbound plasma and brain protein binding (fu,p and fu,brain) for each compound were collected from the literature or generated in house (Table 1) (Liu et al., 2005, 2018; Kodaira et al., 2011; Srikanth et al., 2013). Five and six of the nine compounds were highly bound to proteins in plasma and brain (fu,p and fu,brain < 0.1), respectively. Among the compounds with relatively low protein binding, the fu,p and fu,brain values were 0.135 and 0.0592 for compound B, 0.640 and 0.658 for minoxidil, and 0.880 and 0.345 for sulpiride, respectively, and atenolol showed the lowest protein binding among the tested compounds in both plasma and brain (Table 1). The fu,CSF values for all of the test compounds calculated by eq. 5 were higher than 0.9706, indicating most of compounds in CSF presented as unbound forms.

Plasma concentration vs. time profiles of (A–D) internal and (E–I) commercial compounds in rats after single intravenous injection as a cassette dosing (1 mg/kg). The closed circles represent observed data (n = 3; mean ± S.D.).
Pharmacokinetic parameters calculated by NCA after 1 mg/kg single intravenous injection of compounds (n = 3 for each group)
Data were shown as mean ± S.D.
Brain Penetration of the Compounds: Kp,uu,brain at 4 hours Is Lower than Kp,uu,brain at 24 hours for Most Compounds.
The Kp,brain, Kp,uu,brain, and Kp,uu,CSF values for each compound were calculated using eqs. 2–4, respectively (Table 2). Overall, both Kp,brain and Kp,uu,brain values after 4-hour intravenous infusion were lower compared with the values in the 24-hour intravenous infusion studies except for those of compound B and loperamide, whose Kp,brain and Kp,uu,brain values were similar in both 4- and 24-hour infusion studies. In particular, notable increases in Kp,brain and Kp,uu,brain values of compound C, NFPS, and sulpiride were observed by prolonged infusion time from 4 to 24 hours (Table 2). Despite the same infusion rate of 1 mg/kg/4 h and 6 mg/kg/24 h infusion studies, the calculated Kp,brain and Kp,uu,brain for compound C, NFPS, and sulpiride in 24-hour infusion groups were 70%, 224%, and 73% higher than those in 4-hour infusion groups, respectively. Interestingly, the compounds with a longer half-life (>4 hours), such as NFPS, exhibited a significant increase in brain penetration (Kp,uu,brain) by prolonged infusion time. Kp,brain and Kp,uu,brain values of the compounds A, C, and D were slightly increased by 1.20–1.70-fold after 24-hour infusion, and there were no differences in Kp,brain and Kp,uu,brain of compound B and atenolol between 4- and 24-hour infusion studies.
Calculated total (Kp,brain) and unbound (Kp,uu,brain) brain- and unbound CSF (Kp,uu,CSF)-to-plasma ratios
The CSF samples were only collected from the studies with the commercial compounds. Some of the determined CSF concentrations of loperamide, minoxidil, and NFPS were below the limit of quantification. Therefore, Kp,uu,CSF for those compounds could not be calculated or was shown without S.D. (n = 1–2) (Table 2). The average fold differences between Kp,uu,CSF and Kp,uu,brain for atenolol, minoxidil, and sulpiride were about within 2 folds, whereas loperamide and NFPS showed substantial differences between Kp,uu,CSF and Kp,uu,brain. The observed Kp,uu,brain and Kp,uu,CSF of commercial compounds were comparable with the reported values in the literature except Kp,uu,CSF of loperamide (Table 3).
Physicochemical and PK properties of test compounds from internal data base and literature
CL from Intravenous Infusion Studies: 24-Hour Infusion Studies Provided More Accurate CL than the 4-Hour Infusion Studies.
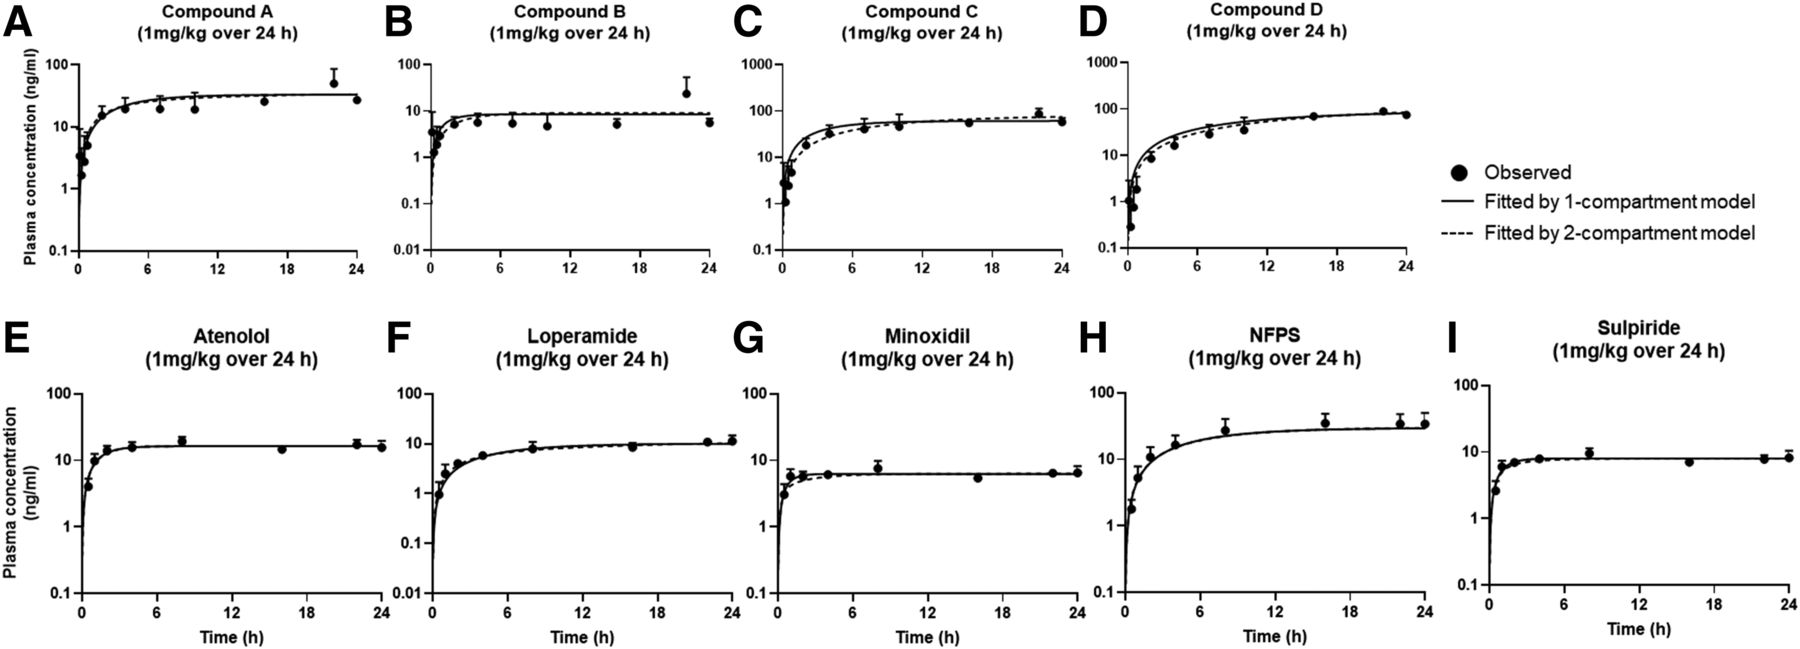
The CL values were calculated using NCA with equation CL = infusion rate/Css (eq. 6), and PK parameters including CL, Vss, and t1/2,eff were estimated using compartmental analyses and then normalized to the PK parameters determined from intravenous injection data for each compound (Tables 4⇓–6). The observed data and the fitted results by one- and two-compartment models based on infusion data were depicted in Figs. 2⇓–4. Overall, most of the estimated CL from the constant intravenous infusion data by both noncompartmental and compartmental analyses were within 2-fold difference compared with those of the single intravenous bolus data, whereas NCA method based on 4-hour infusion data slightly overestimated CL by more than 2 folds (Table 4). The average fold difference of CL in the 24-hour infusion groups normalized to the CL data of the intravenous bolus groups was much closer to 1 than that in the 4-hour infusion groups regardless of noncompartmental and compartmental analyses (Table 4). The CL tends to be overestimated in the 4-hour infusion studies probably due to not having enough time for these compounds to reach the steady states in vivo. The average fold differences of the CL values determined by one- and two-compartment models in the 24-hour infusion studies ranged between 1.07–1.42 and 1.13–1.29, respectively, whereas the average fold differences of the CL values determined by both models in the 4-hour infusion studies were between 1.81 and 1.82, suggesting that the 24-hour infusion studies provided more accurate CL than the 4-hour infusion studies (Table 4). In particular, the calculated CL of compound D in the 4-hour infusion study by NCA was 4.48-fold higher than the actual CL obtained after single intravenous bolus injection, whereas the average fold differences were less than 1.40 in the 24-hour infusion studies (estimated by the same NCA approach) (Table 4).
CL values estimated by noncompartmental and compartmental analyses based on 4- and 24-h intravenous infusion studies
Each value was normalized to the CL of intravenous bolus data and then shown as avg. fold difference. The actual mean CL values for each group were shown in the bracket (milliliter per minute per kilogram).
Vss estimated by one- and two-compartment models based on 4- and 24-h intravenous infusion studies
Each value was normalized to the Vss of intravenous bolus data and then shown as avg. fold difference. The actual mean Vss values for each group were shown in the bracket (liter per kilogram).
t1/2,eff estimated by one- and two-compartment models based on 4- and 24-h intravenous infusion studies
Each value was normalized to the t1/2,eff of intravenous bolus data and then shown as avg. fold difference. The actual mean t1/2,eff values for each group were shown in the bracket (h).

Plasma concentration vs. time profiles of (A–D) internal and (E–I) commercial compounds in rats after a constant intravenous infusion over 4 hours as a cassette dosing (1 mg/kg). The closed circles represent observed data (n = 3; mean ± S.D.), and the fitted results by one- and two-compartment models are depicted as solid and dashed lines, respectively.

Plasma concentration vs. time profiles of (A–D) internal and (E–I) commercial compounds in rats after a constant intravenous infusion over 24 hours as a cassette dosing (1 mg/kg). The closed circles represent observed data (n = 3; mean ± S.D.), and the fitted results by one- and two-compartment models are depicted as solid and dashed lines, respectively.

Plasma concentration vs. time profiles of (A–D) internal and (E–I) commercial compounds in rats after a constant intravenous infusion over 24 hours as a cassette dosing (6 mg/kg). The closed circles represent observed data (n = 3; mean ± S.D.), and the fitted results by one- and two-compartment models are depicted as solid and dashed lines, respectively.
With respect to the methodology for CL estimation, the average fold differences of CL estimated by NCA and one- and two-compartment models were 2.10, 1.81, and 1.82 for 1 mg/kg/4 h study; 1.44, 1.42, and 1.29 for 1 mg/kg/24 h study; and 1.19, 1.07, and 1.13 for 6 mg/kg/24 h study, respectively (Table 4), indicating that NCA provided the most inaccurate CL among the estimation methods (NCA, one- and two-compartmental analyses) regardless of the study design. In comparison, the observed data were well described by both one- and two-compartment models (Figs. 2⇑–4), and the estimated CL values by both models were similar and more accurate than the values by NCA. The average fold differences of the CL values determined by one- and two-compartment models in the 4- and 24-hour infusion studies ranged between 1.07–1.81 and 1.13–1.82, respectively, whereas the average fold differences of the CL values determined by NCA in the 4- and 24-hour infusion studies were between 1.19 and 2.10, suggesting that the compartmental analyses provided more accurate CL than NCA (Table 4).
Vss from Intravenous Infusion Study: the 24-Hour Infusion Studies Provided More Accurate Vss than 4-Hour Infusion Studies.
The compartmental analyses using one- and two-compartment models were applied to estimate Vss from the 4- and 24-hour infusion studies. The average fold differences of the Vss values were within 2 folds between the 4- and 24-hour infusion studies except for the estimated Vss by two-compartment model based on the 1 mg/kg/24 h infusion studies (Table 5). The estimated Vss from the 4-hour infusion studies tended to be underestimated by both one- and two-compartment models compared with that in the intravenous bolus studies; the average fold differences for one- and two-compartment models were 0.58 and 0.79, respectively. Interestingly, the 24-hour infusion studies provided more accurate Vss than 4-hour infusion studies.
Application of Compartmental Analyses for t1/2,eff Estimation from Intravenous Infusion Study without Elimination Phase Showed the Average Fold Differences Were Close to 1 Fold or within 2 Folds of the Actual Values.
The t1/2,eff was indirectly derived from the estimated CL and Vss using eq. 1. Therefore, only the values from the compartmental analyses using one- and two-compartment models were used to derive t1/2,eff (Table 6). Among the tested compounds, the t1/2,eff of compound D was poorly predicted in the 4-hour infusion study because the calculated t1/2,eff values by one- and two-compartment models were 15% and 11% of the actual values. For most of other compounds, the average fold differences in the t1/2,eff were very close to 1 fold or within 2 folds of the actual value (Table 6). Overall, using CL and Vss estimated by one-compartment model showed slightly better performance in predicting t1/2,eff than using the estimates by two-compartment model (Table 6).
Discussion
Brain penetration of compounds is a highly essential element in the drug discovery stage for CNS diseases. Thus, animal experiments should be adequately designed to accurately determine Kp,uu,brain of the tested compounds with various and different physicochemical properties. Although a cassette dosing with intravenous infusion for 4 hours is typically conducted to determine Kp,uu,brain in rats (Fridén et al., 2010; Nagaya et al., 2016), 4-hour infusion may not be long enough to reach the steady state for Kp,uu,brain evaluation if the compound has a longer half-life (Zheng, 2015). Thus, the longer duration of infusion is necessary for the compounds to reach equilibrium in plasma and brain, as demonstrated by the current study.
Comparing Kp,brain and Kp,uu,brain values from the 4- and 24-hour infusion studies with the same infusion rate (1 mg/kg/4 h vs. 6 mg/kg/24 h), the overall values of the 24-hour infusion studies tended to be higher than those of the 4-hour infusion studies (Table 2), indicating that 4-hour infusion was not sufficient to reach steady state. In particular, the brain penetration (Kp,uu,brain) of compound C and NFPS after 6 mg/kg/24 h infusion were 1.71- and 2.14-fold higher than the values after 1 mg/kg/4 h infusion, respectively (Table 2). When taking into consideration that t1/2,terminal values of compound C and NFPS were 6.8 and 4.59 hours (Table 1), the study design with 4-hour infusion could not be adequate to evaluate the brain penetration of a compound with a long half-life. In this study, most of the obtained Kp,uu,brain and Kp,uu,CSF for the commercial compounds were comparable with the previously reported values (Tables 2 and 3). However, the substantial difference between Kp,uu,brain and Kp,uu,CSF for loperamide and NFPS suggests that Kp,uu,CSF or CSF concentration cannot be used as a surrogate marker reflecting unbound brain concentration of the compounds with poor brain penetration (Lin, 2008).
The modified study design with serial blood sampling during the infusion allowed the estimation of critical PK parameters of a compound, such as CL, Vss, and t1/2,eff, simultaneously in addition to the determination of Kp,uu. In the present study, we demonstrated that 4-hour infusion was not adequate to obtain accurate PK parameters, particularly for CL and Vss, and 24-hour infusion is more accurate than 4-hour infusion on PK parameter determination. For CL, the average fold difference of the 4-hour infusion groups indicated that CL was overestimated by both NCA (2.1-fold) and compartment analyses (1.82-fold). In particular, the calculated CL of compound D after 4-hour infusion was 4.48-fold higher than the actual CL after intravenous bolus injection estimated by NCA, whereas a longer infusion time provided more accurate CL (1.26–1.40-fold; Table 4). For Vss, the estimated values by both one- and two-compartment models from the 4-hour infusion studies tended to be underestimated, possibly due to the overestimated CL when considering the inverse association between CL and volume of distribution (Tables 4 and 5). For the same reason, studies with 24-hour, constant infusions exhibited better performance in estimating Vss (Table 5). These results suggested that 24-hour infusion is a more appropriate study design for both Kp,uu,brain and PK parameter estimation. Furthermore, the average fold differences indicated that the PK parameters from both 1 and 6 mg/kg/24 h infusion groups were similar and more accurate compared with the values of 1 mg/kg/4 h infusion groups (Tables 4⇑–6), suggesting that infusion time is more critical for PK parameter estimation than infusion rate. We also demonstrated that compartment analysis is a useful approach to obtain PK parameters from a constant intravenous infusion study without elimination phase. Although the steady state of compound D was not achieved in the 4-hour infusion studies, compartment analyses using one- and two-compartment models provided more accurate CL values than NCA (Table 4). When one- and two-compartment models were applied to the 24-hour infusion studies (1 and 6 mg/kg), the average fold differences in CL and Vss by one- and two-compartment models were similar with acceptable accuracy 1.07–1.42 and 1.13–1.29 for CL and 0.79–0.82 and 0.97–1.10 for Vss (without loperamide), respectively (Tables 4 and 5). Similarly, t1/2,eff was also more accurately estimated by one-compartment model than two-compartment model when comparing average fold differences of 24-hour infusion studies in Table 6. Comparable performances of one- and two-compartment models in this study suggest that one-compartment model should be sufficient to obtain PK parameters from 24-hour constant infusion studies with no elimination phases in terms of model simplicity.
Infusion over 24 hours could be technically challenging sometimes depending on the physiochemical property of the compound (e.g., solubility of the compound). A formulation is generally needed that is stable over this time interval and physiologically acceptable for dosing in terms of volume and composition. Solubility (in aqueous solution) and stability of a compound are generally determined and optimized by chemist and formulation scientist prior to in vivo study, although it could still be challenging and not feasible to find the best combination of formulations for all the compounds. In this study, the best practice was applied, and dosing solutions were filtered prior to intravenous infusion. In addition, to avoid overestimated PK parameters caused by the compound’s poor solubility, the actual drug concentrations of the dosing solution were also measured with the above-mentioned method and then used for further PK analyses.
As presented, we validated that both brain penetration and informative PK parameters of a compound could be successfully estimated by applying compartmental analysis to constant infusion studies. In drug development, the pharmacokinetics of a compound is generally determined in a separate study after testing brain penetration because of the nature of differences in the study designs. Very few studies have been reported in an effort to consolidate two different studies into one study. Bridges et al. (2014) developed a study design with single intravenous bolus dosing of compounds as a cassette dosing followed by another single intravenous bolus injection at 24 hours after the first dosing. The brain was then harvested at 15 minutes after the second dosing. However, this method does not assure whether the steady state is achieved, leading to underestimation of Kp,uu,brain for a compound, particularly with low permeability. Fu et al. (2018) established another study design with a single oral administration followed by intravenous infusion for 17 hours to evaluate bioavailability, Kp,uu,brain, and CL from one study. Although this approach allowed the evaluation of bioavailability with brain penetration of the target compound, Vss could not be obtained from the study. Furthermore, both approaches by Bridges et al. (2014) and Fu et al. (2018) eventually had two different studies conducted sequentially while not consolidating two different studies into one study, since the brain penetration and the PK parameters of a compound were separately derived from two different studies that were performed in the same animals. In this study, we established a novel approach to evaluate brain penetration as well as critical PK parameters of the tested compounds by using compartmental analysis in one study with 24-hour constant infusion. According to the study by Jusko and Gibaldi (1972), about 90% of steady state could be achieved when a drug is infused for >3 mean residence time. Fu et al. (2018) reported that 88% of the compounds in the internal data base (>30,000 compounds) had a shorter mean residence time than 5 hours, inferring 24 hours of intravenous infusion used in the current study could be enough to reach steady state for most of the compounds in early drug discovery. Moreover, another strength of the 24-hour infusion study design is that it enables the assessment of Vss from a constant intravenous infusion study with frequent sampling during infusion. Although a drug with low Vss (<0.6 l/kg) (Smith et al., 2015) was not tested in this study, simulation proved that this study design is applicable to estimate Vss of compounds with wide range of Vss (Fig. 5).

Simulated plasma concentration vs. time profiles of compounds with low, moderate, and high volume of distribution after a constant intravenous infusion over 24 hours. The Vss values were set to 0.1, 0.3, 0.6, 1, 5, and 10 l/kg, and the CL values were assumed to be the same as the hepatic blood flow rate (55 ml/min/kg). For simulation, it was assumed that the blood samples were serially collected at 0.083, 0.25, 0.5, 0.75, 1, 3, 5, 10, and 24 hours after infusion.
However, the limitation of the current study is that the study design does not allow the estimation of bioavailability of test compound, and that is also an important aspect to be considered in drug development. Although an additional in vivo study is required to evaluate the bioavailability of compounds, the infusion study enables the narrowing down of compounds that could be further investigated. In other words, time and resources can be saved by performing bioavailability test for the optimal compounds with favorable brain penetration, CL, Vss, and t1/2. Further investigation is needed to develop a more efficient study design or PK approach for estimation of bioavailability along with other PK parameters (e.g., CL, Vss, and t1/2) as well as brain penetration.
In summary, we developed and validated a method to determine not only Kp,uu,brain but also PK parameters from one single 24-hour intravenous infusion study design.
Acknowledgments
We thank Taras Tuczkewycz for conducting some of the animal experiments.
Authorship Contributions
Participated in research design: Liu, Wei.
Conducted experiments: Noh, Pietrasiewicz.
Performed data analysis: Noh.
Wrote or contributed to the writing of the manuscript: Noh, Liu, Wei.
Note Added in Proof—Some values of Sulpiride were not correctly cited in Tables 1 and 2 in the Fast Forward version published December 1, 2020. Tables 1 and 2 have now been corrected.
Footnotes
- Received September 6, 2020.
- Accepted November 10, 2020.
This work was funded and supported by Biogen.
↵
 This article has supplemental material available at dmd.aspetjournals.org.

Abbreviations
- AUC
- area under the plasma concentration-time curve
- BBB
- blood-brain barrier
- BSA
- bovine serum albumin
- CL
- clearance
- CNS
- central nervous system
- CSF
- cerebrospinal fluid
- fu,brain
- unbound fraction in the brain
- fu,p
- unbound fraction in plasma
- Kp,brain
- total brain-to-plasma ratio
- Kp,uu
- free brain/plasma concentration ratio
- Kp,uu,brain
- unbound brain-to-plasma ratio
- Kp,uu,CSF
- unbound CSF-to-plasma ratio
- NCA
- noncompartmental analysis
- NFPS
- N-[3-(4′-fluorophenyl)-3-(4′-phenylphenoxy)propyl]sarcosine
- PK
- pharmacokinetics
- t1/2,terminal
- terminal half-life
- t1/2,eff
- effective half-life
- Vss
- volume of distribution at steady state
- Copyright © 2021 by The American Society for Pharmacology and Experimental Therapeutics


