


Visual Overview

Abstract
Orally administered drugs are absorbed and metabolized in the intestine. To accurately predict pharmacokinetics in the intestine, it is essential to understand the intestinal expression profiles of the genes related to drug absorption, distribution, metabolism, and excretion (ADME). However, in many previous studies, gene expression analysis in the intestine has been carried out using specimens from patients with cancer. In this study, to obtain more accurate gene expression profiles, biopsy samples were collected under endoscopic observation from the noninflammatory regions of 14 patients with inflammatory bowel disease, and RNA-seq analysis was performed. Gene expression analysis of drug-metabolizing enzymes (cytochromes P450), non–cytochrome P450 enzymes, nuclear receptors, drug-conjugating enzymes (UDP-glucuronosyltransferases and sulfotransferases), and apical and basolateral drug transporters was performed in biopsy samples from the duodenum, ileum, colon, and rectum. The proportions of the cytochromes P450 expressed in the ileum were 25% (CYP3A4), 19% (CYP2C18), and 14% (CYP3A5). CYP3A4 and CYP2C19 were highly expressed in the duodenum and ileum, but not in the colon and rectum. In the ileum, apical transporters such as P-gp, peptide transporter 1, breast cancer resistance protein, MRP2, and ASBT were strongly expressed, and the expression levels of P-gp and ASBT in the ileum were higher than those in other regions. In the ileum, basolateral transporters such as OSTα, OSTβ, and MRP3 were strongly expressed. We succeeded in obtaining gene expression profiles of ADME-related genes in human intestinal epithelial cells in vivo. We expect that this information would be useful for accurate prediction of the pharmacokinetics of oral drugs.
SIGNIFICANCE STATEMENT To obtain gene expression profiles of ADME-related genes in human intestinal epithelial cells in vivo, biopsy samples were collected under endoscopic observation from the noninflammatory regions of 14 patients with inflammatory bowel disease, and RNA-seq analysis was performed. Gene expression profiles of drug-metabolizing enzymes (cytochromes P450), non–cytochrome P450 enzymes, nuclear receptors, drug-conjugating enzymes (UDP-glucuronosyltransferases and sulfotransferases), and apical and basolateral drug transporters in biopsy samples from the duodenum, ileum, colon, and rectum were obtained in this study.
Introduction
Most orally administered drugs are absorbed and metabolized in the intestine. The intestinal tract plays an important role in the pharmacokinetics of orally administered drugs because drug-metabolizing enzymes, drug-conjugating enzymes, and drug transporters are highly expressed in the intestine. Therefore, to accurately predict the efficacy and side effects of orally administered drugs, it is necessary to understand the expression of drug absorption, distribution, metabolism, and excretion (ADME)-related genes in the intestinal tract. Although analysis of the intestinal expression of ADME-related genes has been performed using mice, rats, and pigs, it is known that there are species differences in the expression profiles of ADME-related genes (Martignoni et al., 2006). Therefore, it is essential to analyze the expression of ADME-related genes using human cells and specimens, not model animals. Previously, gene expression analysis was performed using patients with cancer (Teubner et al., 2007). However, the gene expression profiles in patients with cancer may differ from those in healthy individuals. In addition, some studies have analyzed intestinal epithelial cells that were isolated from a surgically removed intestinal tract that was transported outside the hospital, but in these cases, the phenotype of the intestinal epithelial cells could have changed before analysis. Therefore, there is a need for analysis using human specimens that are closer to physiologic conditions. In this study, we collected intestinal biopsy samples from the noninflammatory regions of patients with inflammatory bowel disease (IBD) because it is difficult to obtain intestinal biopsy samples from healthy donors.
Until now, expression analysis of ADME-related genes using human specimens has mostly been based on semiquantitative PCR (Zhang et al., 1999), real-time PCR (Hruz et al., 2006), and immunologic analysis (Paine et al., 2006; Vaessen et al., 2017). Because ADME-related genes that were not intentionally selected may play an important role, it is important to perform not only an expression analysis of the intentionally selected genes but also a more unbiased comprehensive gene expression analysis. To the best of our knowledge, however, no studies have described the comprehensive gene expression profiles in each region of the human intestinal tract. RNA-seq is known to be an excellent method for comprehensive gene expression analysis. RNA-seq analysis not only enables detection of novel transcripts but also allows for higher resolution analysis over a wider dynamic range. Therefore, we performed RNA-seq analysis using a HiSEq 4000 system to obtain a comprehensive gene expression profile with high accuracy and abundant information.
In this study, we first obtained biopsy samples of the duodenum, ileum, colon, and rectum from patients, and then we performed RNA-seq analysis. Because the majority of the biopsy samples were composed of epithelial cells, the RNA-seq results are likely to reflect the gene expression profiles of intestinal epithelial cells. Because we were interested in the pharmacokinetics, we focused on the expression of drug-metabolizing enzymes (cytochromes P450), non–cytochrome P450 enzymes, nuclear receptors, drug-conjugating enzymes [UDP-glucuronosyltransferases (UGTs) and sulfotransferases (SULTs)], and drug transporters. We believe that the data obtained in this study will be an important resource in pharmacokinetics.
Materials and Methods
Human Intestinal Biopsy Samples.
This study was approved by the institutional review board at Sapporo Medical University and Osaka University. We obtained written informed consent from all participants. This study was performed in accordance with the Declaration of Helsinki and the Human Ethical Guidelines of the Ministry of Health, Labor, and Welfare of Japan. Eligibility criteria were 1) a confirmed diagnosis of Crohn disease or ulcerative colitis according to Japanese clinical guidelines (Matsuoka et al., 2018) and 2) ≥20 years old with adequate organ function. Exclusion criteria were 1) history of cancer and 2) patients with venous thromboembolism requiring anticoagulants. Intestinal biopsy samples were collected using cold biopsy forceps from the small intestine (duodenum and ileum) or large intestine during upper gastrointestinal endoscopy, small intestine endoscopy, and lower gastrointestinal endoscopy. Intestinal biopsy samples were collected once from each region of the intestinal tract described above from each individual. Each intestinal biopsy sample was immediately placed into RNA later reagent (QIAGEN) and stored at −80°C. Note that some samples were obtained from patients treated with prednisolone or budesonide. Samples exposed to prednisolone or budesonide are marked with a *1 or *2, respectively (Fig. 1E).
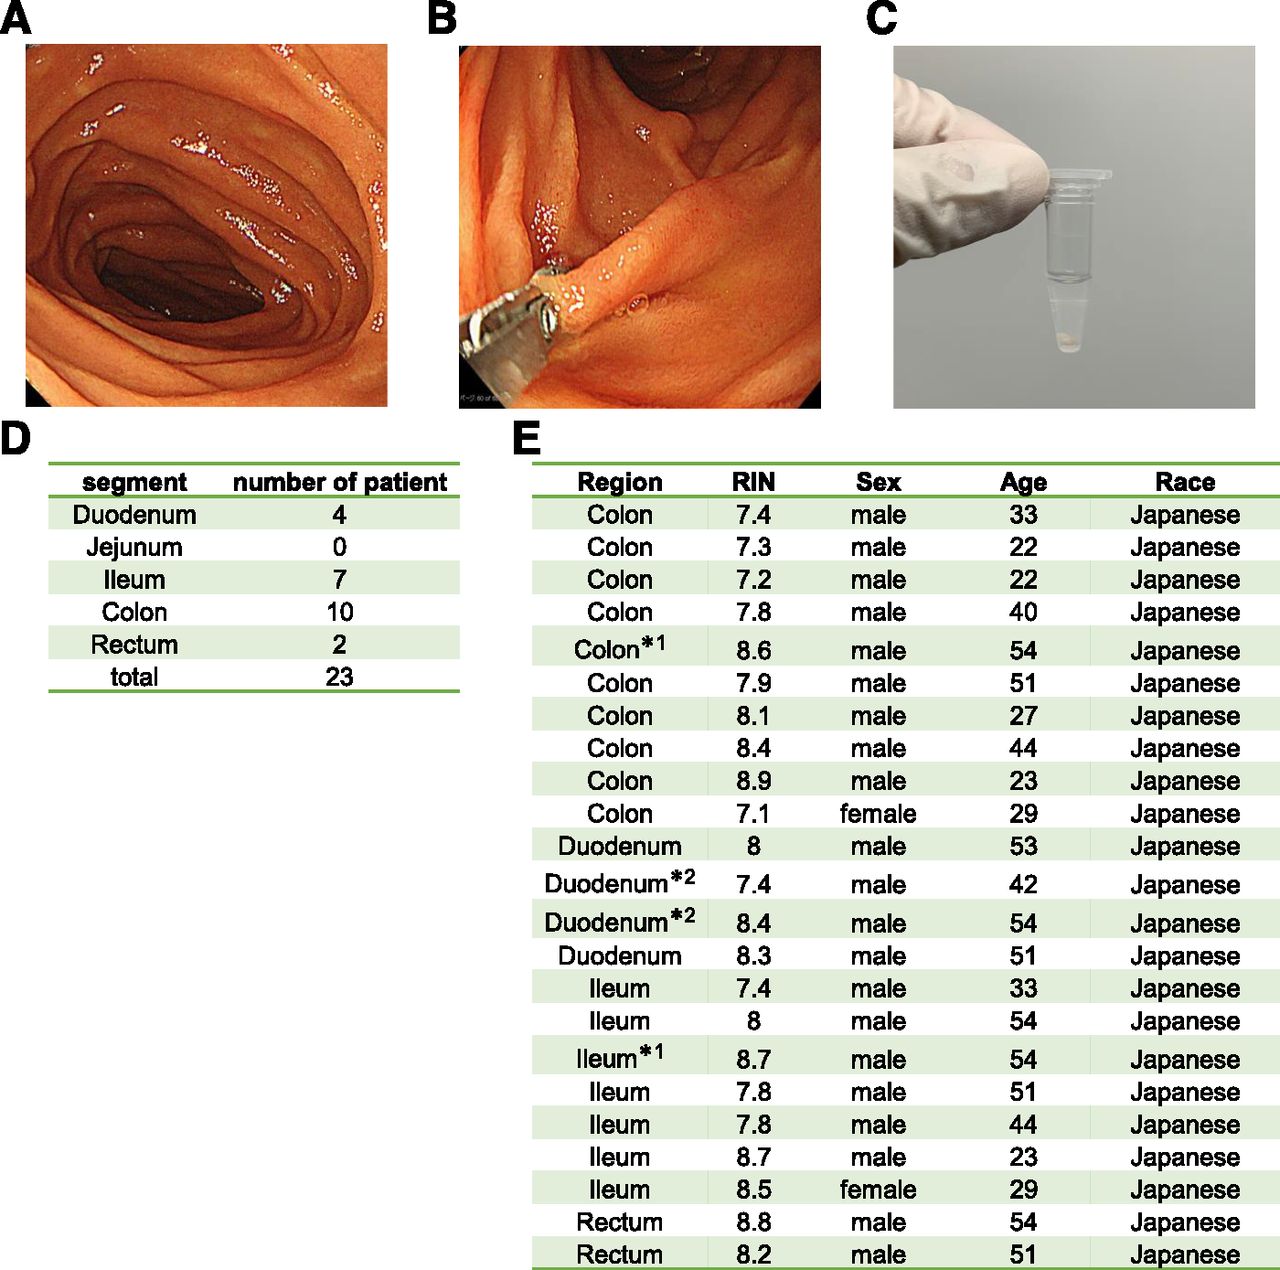
Acquisition of intestinal biopsy samples. (A) An image of the inside of the duodenum was taken using an endoscopic camera. (B) The duodenal epithelial layer was collected using forceps. (C) Three pieces of an intestinal biopsy sample were collected. (D) Acquisition regions and the numbers of patients providing intestinal biopsy samples from each. (E) Patient information (gender and race) for each intestinal biopsy sample. Some samples were obtained from patients treated with prednisolone or budesonide. Samples exposed to prednisolone or budesonide are marked with a *1 or *2, respectively. Note that 14 patients participated in this analysis and 23 samples were acquired. The analysis thus included cases in which samples from multiple sites were collected from the same patient.
RNA Preparation and RNA-seq Analysis.
Total RNA from 23 fresh-frozen biopsies was isolated by QIAzol (QIAGEN) extraction after removal of RNA later reagent. The RNA samples were purified using an RNeasy Mini kit (QIAGEN). For evaluation of RNA quality, a BioAnalyzer (Agilent Technologies) and RNA 6000 nanochip (Agilent Technologies) were used, and it was confirmed that all RNA samples had an RNA integrity number (RIN) higher than 7. Library construction for RNA sequencing was performed using a TruSeq Stranded Total RNA Library Prep kit (Illumina).
For sequencing, a HiSEq 4000 system (Illumina) was used to generate the FASTQ files. FastQC (http://www.bioinformatics.babraham.ac.uk/projects/fastqc), FASTX (http://hannonlab.cshl.edu/fastx_toolkit/index.html), and FastQ Screen (Wingett and Andrews, 2018) were used to check the quality of the FASTQ files. Single-end reads from FASTQ files were mapped against the Genome Reference Consortium Human Build 38 using the STAR aligner (Dobin et al., 2013). The quantification and normalization [trimmed mean of M-values (TMM) (Robinson and Oshlack, 2010) or transcripts per million (Wagner et al., 2012)] were done by using Strand NGS 3.4 (Strand Life Sciences). The TMM/transcripts per million normalization was performed on all sample sets, including in vivo human intestinal epithelial cells, human iPS cell–derived intestinal epithelial cells, and Caco-2 cells.
The data are available at Gene Expression Omnibus, and its accession number is GSE156453.
Caco-2 Cell Culture.
Caco-2 cells were obtained from the Leibniz Institute DSMZ-German Collection of Microorganisms and Cell Cultures, Germany. Caco-2 cells were maintained at 37°C, 8% CO2, and 95% relative humidity in a cell culture dish supplemented with DMEM + 3.7 g/l NaHCO3 (Biochrom AG), MEM-NEAA (Thermo Fisher Scientific), l-glutamine (Biochrom AG), penicillin-streptomycin (Thermo Fisher Scientific), and 10% FBS (Gibco; Themo Fisher Scientific). The passage number of the Caco-2 cells was between 60 and 90. Total RNA was extracted and purified by using an RNeasy Mini kit (QIAGEN) according to the manufacturer’s standard protocol. RNA quality was evaluated in the same way as the biopsy samples using the BioAnalyzer (Agilent Technologies).
Human iPS Cell Culture.
The human iPS cell line YOW-iPS cell (Takayama et al., 2014) was maintained on a feeder layer of mitomycin C–treated mouse embryonic fibroblasts (Millipore) with ReproStem medium (ReproCELL) supplemented with 10 ng/ml fibroblast growth factor 2 (KATAYAMA CHEMICAL INDUSTRIES).
Intestinal Differentiation of Human iPS Cells.
Intestinal differentiation of human iPS cells was performed according to our previous report (Takayama et al., 2019). Before the initiation of intestinal differentiation, human iPS cells were dissociated into clumps by using dispase (Roche) and plated onto the BD Matrigel Matrix Growth Factor Reduced–coated (BD Biosciences) apical chamber of BD Falcon cell culture inserts (six-well plate, 1.0-μm pore size, 1.6 × 10⁶ pores/cm, PET Membrane). These cells were cultured in the mouse embryonic fibroblast–conditioned medium for 2 to 3 days. For the definitive endoderm differentiation, human iPS cells were cultured for 4 days in RPMI 1640 medium (Sigma-Aldrich) containing 100 ng/ml activin A (R&D Systems), 1× GlutaMAX (Thermo Fisher Scientific), penicillin-streptomycin, and 1× B27 Supplement Minus Vitamin A (Thermo Fisher Scientific). During the definitive endoderm differentiation, the mesendoderm cells (day 2) were transduced with 3000 vector particles per cell of FOXA2-expressing adenovirus vector for 1.5 hours to promote definitive endoderm differentiation.
For the induction of intestinal progenitor cells, the definitive endoderm cells were cultured for 4 days in the intestinal differentiation medium [DMEM, high glucose (FUJIFILM Wako) containing 5 μM 6-bromoindirubin-3′-oxime (BIO; Calbiochem), 1× MEM Non-Essential Amino Acids Solution (Thermo Fisher Scientific), penicillin-streptomycin, 1× GlutaMAX, and 100 μM β-mercaptoethanol] supplemented with 10 μM N-[(3,5-difluorophenyl) acetyl]-l-alanyl-2-phenyl-1,1-dimethylethyl ester-glycine (DAPT; Peptide Institute) and 10% Knockout Serum Replacement (Thermo Fisher Scientific).
For the induction of intestinal epithelial cell monolayers, the intestinal progenitor cells were cultured for 11 days in intestinal differentiation medium supplemented with 1 μM BIO and 2.5 μM DAPT and then cultured for 15 days in the Wnt-3A–conditioned intestinal differentiation medium supplemented with 0.1 μM BIO, 1 μM DAPT, 250 ng/ml EGF, and 10 μM SB431542. During the intestinal differentiation, the intestinal progenitor cells (day 8) were transduced with 3000 vector particles per cell of Ad-CDX2 (caudal-related homeobox transcription factor 2) for 1.5 hours to promote intestinal differentiation.
Statistical Analysis.
For hierarchical clustering/heat map generation and three-dimensional principal component analysis (PCA) of human intestinal epithelial cells in vivo, TCC-GUI (Su et al., 2019) and GeneSpringGX software version 14.9 (Agilent Technologies) were used, respectively. For clustering metric, Spearman’s rank correlation coefficient value was used for assessing similarity among samples, and the unweighted pair group method with arithmetic mean was used for creating a dendrogram. In Figs. 3–8, statistical analyses were performed using GraphPad Prism software.
Results
Acquisition of In Vivo Human Intestinal Epithelial Cells.
To obtain a gene expression profile of human intestinal epithelial cells in vivo, intestinal biopsy samples were collected under endoscopic observation from the noninflammatory regions of 14 patients with IBD. In this study, biopsy samples of the duodenum, ileum, colon, and rectum were collected. Figure 1 presents images before and after collecting the biopsy sample from the duodenum: images of the inside of the duodenum (Fig. 1A), the collection of a biopsy sample using forceps (Fig. 1B), and a collected biopsy sample (Fig. 1C) are shown. Note that the intestinal biopsy samples were collected from endoscopically normal regions of the patients with IBD. Biopsy samples of the duodenum, ileum, colon, and rectum were obtained from 4, 7, 10, and 2 patients, respectively (Fig. 1D). The gender, age, and race of patients who provided the biopsy samples are shown in Fig. 1E. The RIN and label of RNA collected from biopsy samples are also shown in Fig. 1E. RNA-seq analysis was performed according to the procedure in Supplemental Fig. 1A. The equipment and analysis software used for the RNA-seq are shown in Supplemental Fig. 1B. The heat map in Fig. 2A and the PCA of Fig. 2B showed that the gene expression profiles of the duodenum, ileum, colon, and rectum biopsy samples could be divided into the respective regions. In addition, scatter and volcano plots are shown in Supplemental Figs. 2–4 (Supplemental Fig. 2: ileum vs. duodenum; Supplemental Fig. 3: ileum vs. colon; Supplemental Fig. 4: ileum vs. rectum). These plots suggest that the difference in the gene expression levels between the ileum and duodenum is smaller than the difference in the gene expression levels between the ileum and rectum.
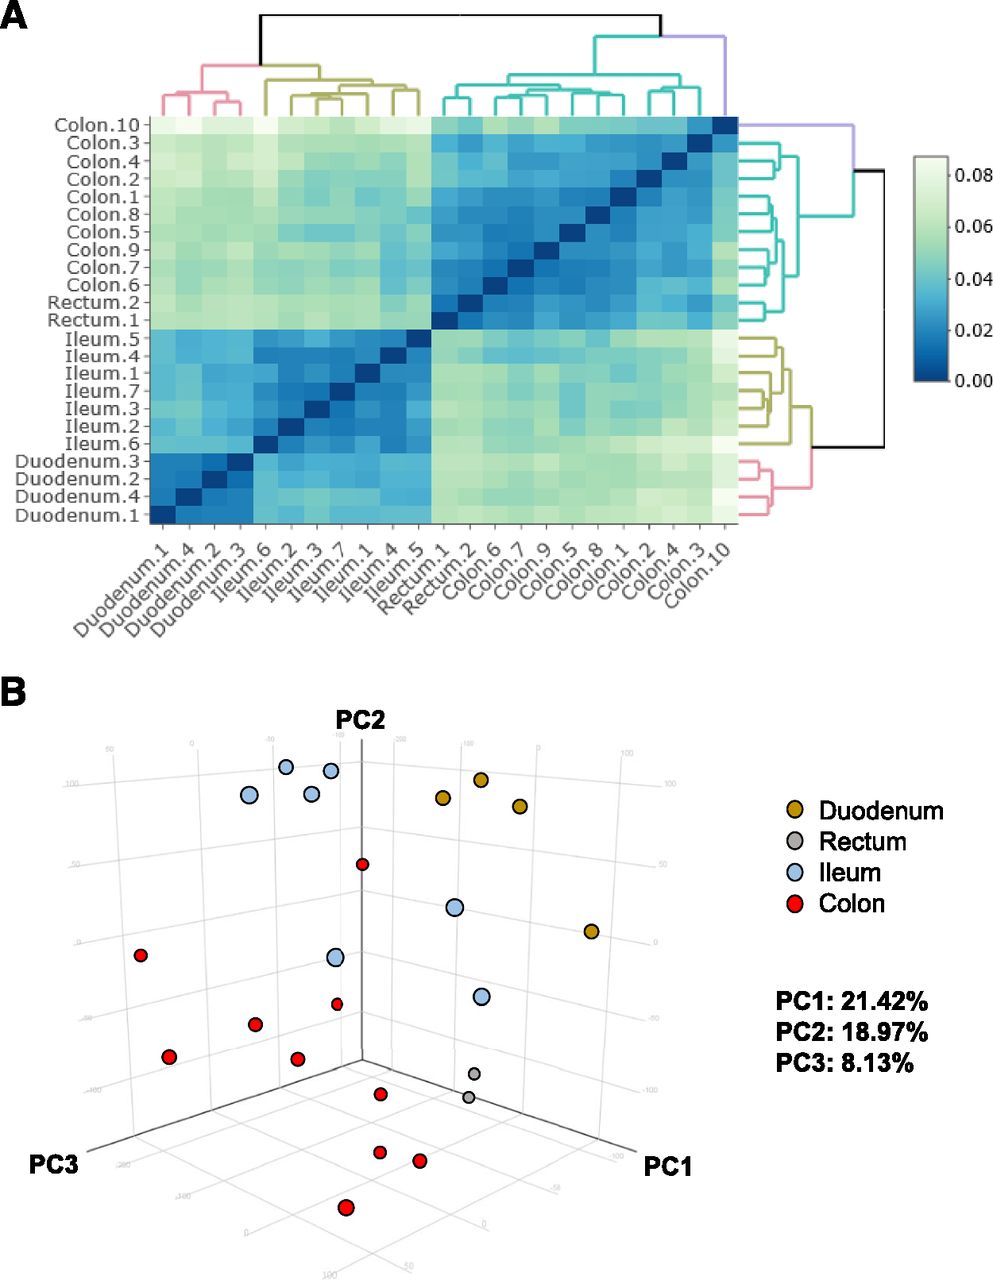
Global gene expression analysis of intestinal biopsy samples. (A) The hierarchical clustering and heat map are shown for each biopsy sample. (B) two-dimensional and three-dimensional PCA of transcription profiles was performed on biopsy samples. The ratio of the contribution of each component is shown. Duodenum, yellow; rectum, gray; ileum, blue; colon, red. PC1, principal component 1; PC2, principal component 2; PC3, principal component 3.
Expression Analysis of Cytochromes P450 in the Intestinal Tract.
Previous human studies showed that intestinal CYP3A contributes significantly to the first-pass metabolism of several drugs, such as cyclosporine, midazolam, and verapamil (Kolars et al., 1991; Paine et al., 1996; von Richter et al., 2001). In this study, we examined the expression profile of cytochromes P450 in human intestinal epithelial cells in vivo. The proportions of the cytochromes P450 expressed in the ileum were 25% (CYP3A4), 19% (CYP2C18), 14% (CYP3A5), 10% (CYP2J2), 9% (CYP27A1), and 6% (CYP4F12) (Fig. 3A). In contrast, Paine et al. (2006) reported that CYP3A was the most abundant cytochrome P450 (80%), followed by CYP2C9 (15%), CYP2C19 (2.9%), CYP2J2 (1.4%), and CYP2D6 (1%). This difference might have been due to differences in the sample state, acquisition region, and analysis methods used. Although previous studies observed that intestinal CYP3A expression was the highest in the proximal region and then declined sharply toward the distal ileum (De Waziers et al., 1990; Paine et al., 1997; Zhang et al., 1999; Paine et al., 2006), in our experiments, there were no differences in CYP3A4 and CYP3A5 expression levels between the duodenum and ileum (Fig. 3B). In addition, we observed few differences between CYP3A4 and CYP3A5 expression levels in the ileum, whereas Zhang et al. (1999) detected no CYP3A5 expression in human small intestine enterocytes. As mentioned above, because the present study used an RNA-seq approach in small intestinal epithelial cells in vivo, we were able to obtain cytochrome P450 expression profiles that were more detailed and comprehensive than those in previous reports.

Expression analysis of cytochromes P450 in various regions of the intestinal tract. (A) The expression profiles of cytochromes P450 in the ileum are shown. (B) The gene expression levels of CYP3A4, CYP2C19, CYP3A5, and CYP2C18 in the duodenum, ileum, colon, and rectum are examined.
Expression Analysis of Non–Cytochrome P450 Enzymes in the Intestinal Tract.
We next examined the expression profile of non–cytochrome P450 enzymes in human intestinal epithelial cells in vivo. The proportions of the non–cytochrome P450 enzymes expressed in the ileum were 20% (AKR1B10), 16% (MAOA), 14% (CES2), 14% (ALDH1A1), 8% (CBR1), and 7% (ALDH18A1) (Fig. 4A). CES belongs to the phase I drug-metabolizing enzymes. CES hydrolyzes a variety of drug esters, amides, carbamates, and similar structures. In the human small intestine, CES2, but not CES1, is predominantly expressed (Imai et al., 2006; Zhang et al., 2020). Taketani et al. (2007) have reported that there is a steep proximal-to-distal gradient of CES activity in the human small intestine. In agreement with a previous report (Imai et al., 2006), we found that CES2 accounted for the majority (94.6%) of CES expressed in the ileum in our subjects. We also found that CES2 expression levels in the duodenum and ileum were higher than those in the colon and rectum (Fig. 4B).
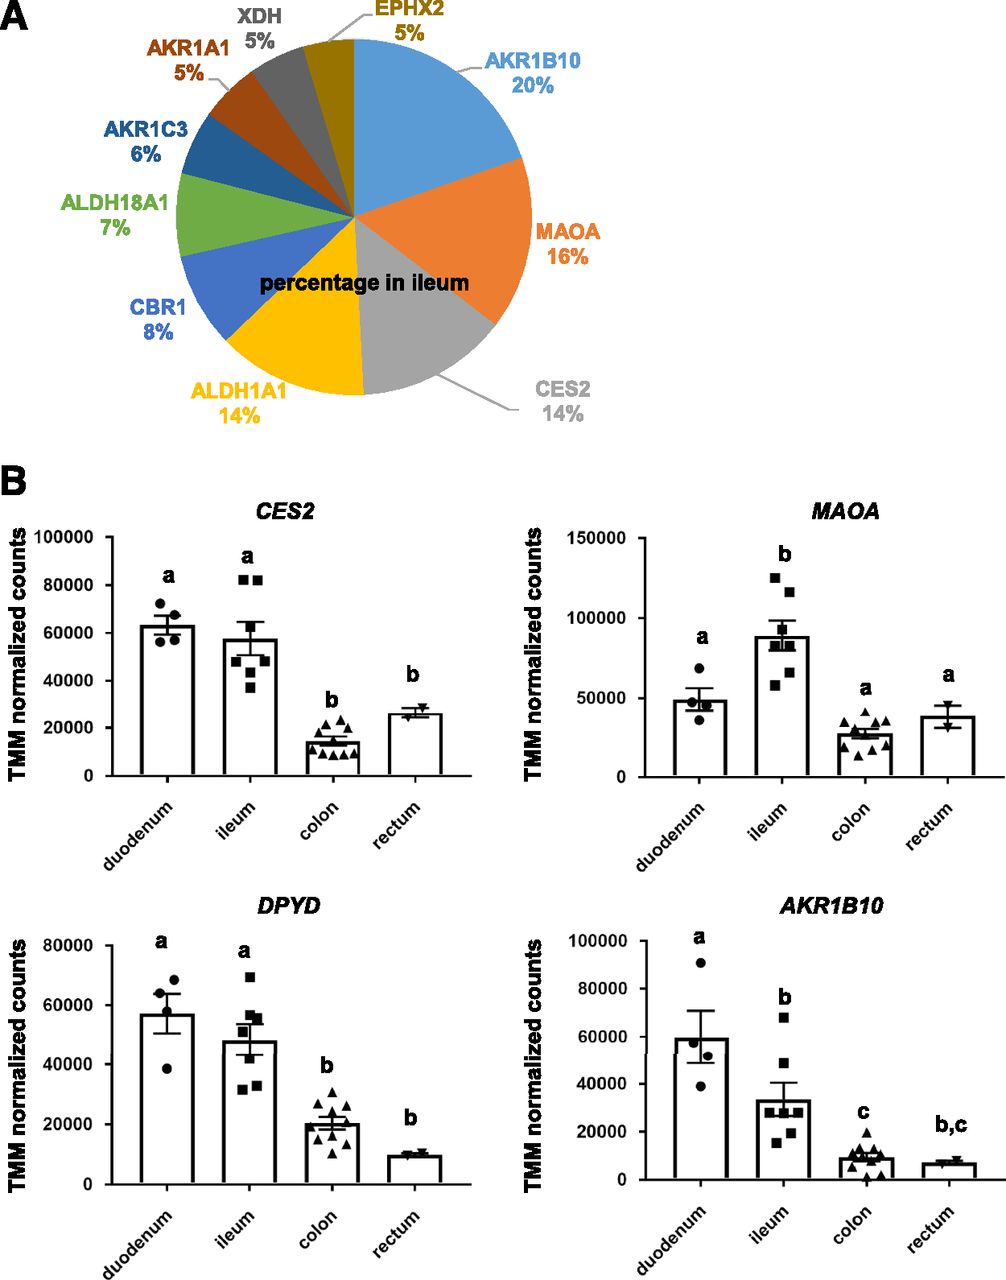
Expression analysis of non–cytochrome P450 enzymes in various regions of the intestinal tract. (A) The expression profiles of non–cytochrome P450 enzymes in the ileum are shown. (B) The gene expression levels of CES2, MAOA, DPYD, and AKR1B10 in the duodenum, ileum, colon, and rectum are examined.
Expression Analysis of Drug Transporters in the Intestinal Tract.
Several uptake transporters, including organic anion transporting polypeptide (OATP) family members, peptide transporter 1 (PEPT1; SLC15A1), and ileal apical sodium/bile acid cotransporter (ASBT; SLC10A2) are highly expressed at the apical membrane of small intestinal epithelial cells (Giacomini et al., 2010; Droździk et al., 2020). In addition, several efflux pumps, including breast cancer resistance protein (BCRP; ABCG2) and P-glycoprotein (P-gp; MDR1, ABCB1), are highly expressed at the apical membrane of small intestinal epithelial cells (Giacomini et al., 2010; Droździk et al., 2020). On the other hand, heteromeric organic solute transporter (OSTα–OSTβ) and multidrug resistance protein (MRP) 3 (ABCC3) are highly expressed at the basolateral membrane of small intestinal epithelial cells (Giacomini et al., 2010). However, the gene expression profiles of these transporters have not been fully elucidated in human intestinal epithelial cells in vivo. In addition, there have been no detailed examinations of the expression profiles of these transporters specific to each region of the intestinal tract. Therefore, we also investigated the expression profiles of apical and basolateral transporters in human intestinal epithelial cells in vivo. The proportions of the apical transporters expressed in the ileum were 28% (PEPT1), 26% (P-gp), 22% (BCRP), 7% (MRP2), and 6% (ASBT) (Fig. 5A, left). Consistent with our data, Harwood et al. (2019) showed that gene expression levels of PEPT1 in the human ileum were higher than those of other transporters. As for the basolateral transporters, the proportions in the ileum were 41% (OSTβ), 30% (OSTα), 10% (MRP3), 9% (MRP1), and 7% (MRP5) (Fig. 5A, right). The gene expression levels of P-gp, PEPT1, BCRP, and ASBT in the ileum were significantly higher than those in other regions (Fig. 5B). Hruz et al. (2006) analyzed human ASBT mRNA expression along the intestinal tract in biopsies of 14 control subjects and found that ASBT expression was higher in the ileum than in other intestinal regions. This result was consistent with our findings. In addition, we found that PEPT1 expression levels were approximately 37 times higher than PEPT2 expression levels in the ileum (data not shown).

Expression analysis of intestinal transporters in various regions of the intestinal tract. (A) The expression profiles of intestinal transporters in the ileum are shown (left: apical transporters, right: basolateral transporters). (B) The gene expression levels of ASBT, P-gp, BCRP, and PEPT1 in the duodenum, ileum, colon, and rectum are examined.
Expression Analysis of Nuclear Receptors in the Intestinal Tract.
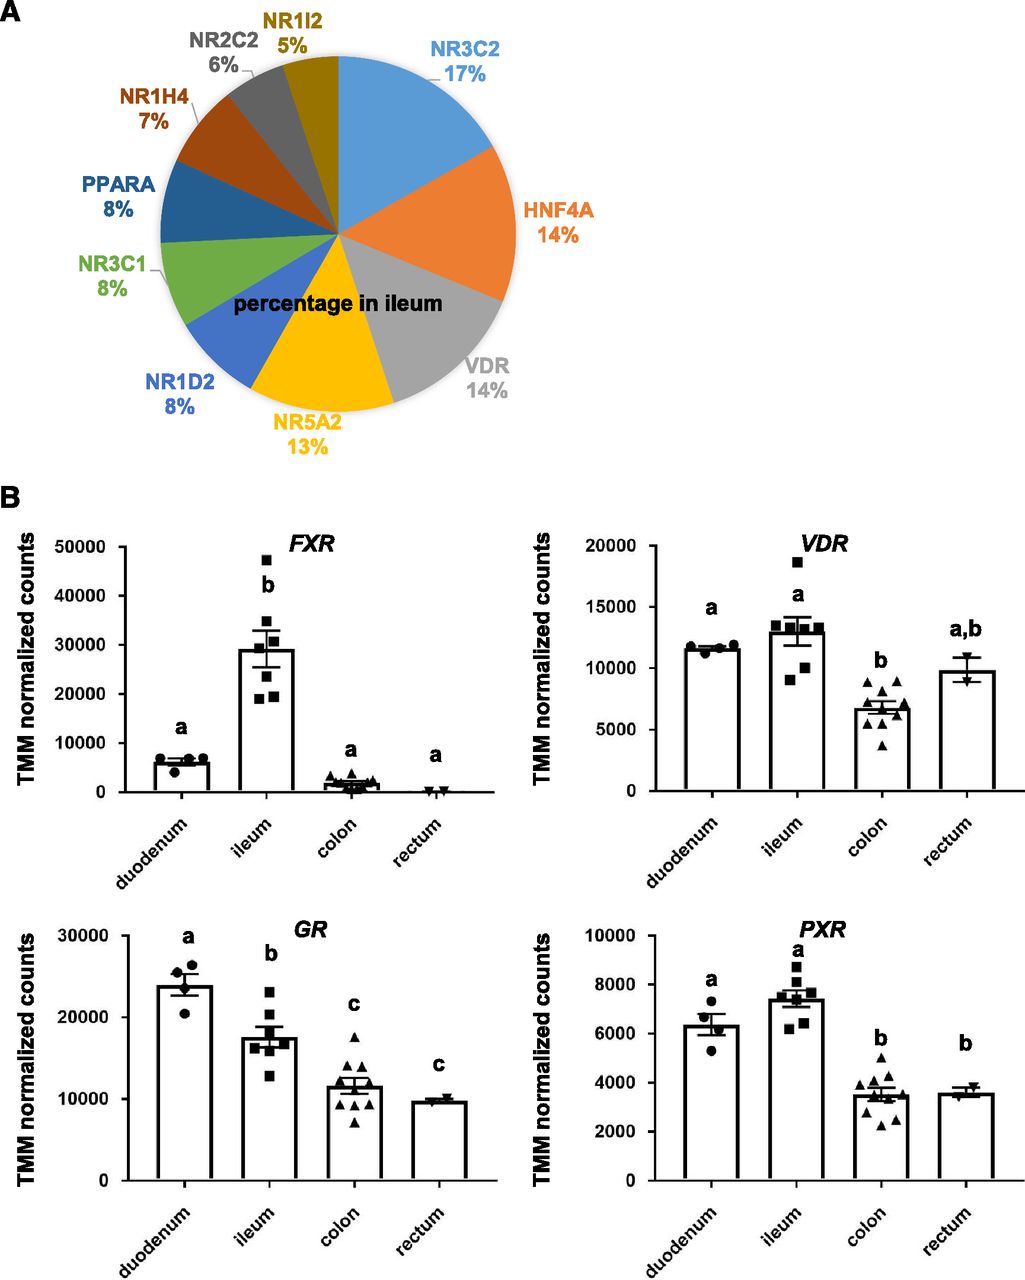
CYP3A4 expression in the human intestinal tract can be induced by various drugs, such as rifampicin and 1α,25-dihydroxyvitamin D3 (Theodoropoulos et al., 2003; van de Kerkhof et al., 2008). Nuclear receptors, such as vitamin D receptor (VDR) and pregnane X receptor (PXR), mediate the CYP3A4 induction. It is also known that VDR functions as a receptor for the secondary bile acid lithocholic acid, which is hepatotoxic and a potential enteric carcinogen (Makishima et al., 2002). Farnesoid X receptor (FXR), which is known as a nuclear receptor for bile acids, induces genes involved in enteroprotection and inhibits bacterial overgrowth and mucosal injury in the ileum (Inagaki et al., 2006). However, the gene expression profiles of nuclear receptors have not been sufficiently examined. Therefore, we next investigated the expression profiles of nuclear receptors in human intestinal epithelial cells in vivo. The proportions of the nuclear receptors expressed in the ileum were 17% (NR3C2), 14% (hepatocyte nuclear factor 4α), 14% (VDR), 13% (NR5A2), and 8% (NR1D2) (Fig. 6A). The RXRα, LXR, CAR, and SHP expression levels in the ileum were low. The gene expression levels of FXR in the ileum were significantly higher than those in other regions (Fig. 6B). In addition, the gene expression levels of GR and PXR in the duodenum and ileum were higher than those in the colon and rectum (Fig. 6B). On the other hand, VDR was highly expressed in all regions (Fig. 6B). These results suggest that CYP3A4 induction potency and bile acid metabolism might show different functional levels depending on the region of the intestinal tract.

Expression analysis of nuclear receptors in various regions of the intestinal tract. (A) The expression profiles of nuclear receptors in the ileum are shown. (B) The gene expression levels of FXR, VDR, GR, and PXR in the duodenum, ileum, colon, and rectum are examined.
Expression Analysis of UGTs in the Intestinal Tract.
It has been reported that intestinal glucuronidation metabolism may have a greater impact on oral bioavailability than hepatic glucuronidation metabolism in humans (Mizuma, 2009). It is also known that UGT1A8 and UGT1A10 mRNA expressions could be detected in both the small intestine and colon but not in the liver (Cheng et al., 1999). Accordingly, we also investigated the expression profile of UGTs in human intestinal epithelial cells in vivo. The proportions of the UGTs expressed in the ileum were 21% (UGT8), 18% (UGT1A10), 14% (UGT2B7), 12% (UGT2A3), and 9% (UGT1A1) (Fig. 7A). We found that the levels of intestinal UGT2A3, UGT1A8, UGT1A1, and UGT2B7 expression were highest in the proximal region and then gradually declined toward the distal region (Fig. 7B). Consistently, Fritz et al. (2019) showed that the levels of UGT1A and UGT2B7 expression were highest in the proximal region and then gradually declined toward the distal region. Strassburg et al. (2000) reported that UGT1A1, UGT1A3, UGT1A4, UGT1A6, UGT1A10, UGT2B4, UGT2B7, and UGT2B15 mRNA could be detected, whereas UGT1A5, UGT1A7, UGT1A8, UGT1A9, and UGT2B10 mRNA could not be detected in the small intestine. In their study, macroscopically and histologically normal intestinal tissue was obtained from 18 German patients. They collected large intestinal pieces (approximately 200 mg), whereas we collected small intestinal pieces (approximately 5 mg × three pieces). Therefore, the cell population composing the collected intestinal biopsy samples might have differed between the study of Strassburg et al. (2000) and our present study.

Expression analysis of UGTs in various regions of the intestinal tract. (A) The expression profiles of UGTs in the ileum are shown. (B) The gene expression levels of UGT2A3, UGT1A8, UGT1A1, and UGT2B7 in the duodenum, ileum, colon, and rectum are examined.
Expression Analysis of SULTs in the Intestinal Tract.
Soluble SULTs play an important role in the elimination of xenobiotics. SULT1A1, SULT1A3, and SULT1B1 have been found in all parts of the intestine (Teubner et al., 2007). In addition, SULT1E1 and SULT2A1 have been detected in the ileum (Teubner et al., 2007). However, the intestinal tissue samples in those experiments were obtained only from Caucasian patients with tumors (Teubner et al., 2007). In the present study, we examined the expression profile of SULTs in human intestinal epithelial cells that were obtained from patients without tumors. In agreement with the aforementioned study (Teubner et al., 2007), we found that SULT2A1, SULT1B1, SULT1A2, SULT1A1, and SULT1E1 were highly expressed in the ileum (Fig. 8A). Consistently, Zhang et al. (2020) reported that SULT1A1 and SULT2A1 were highly expressed in the ileum. We also found that the gene expression levels of SULT1A1, SULT1A3, and SULT1B1 in the colon were lower than those in other intestinal regions (Fig. 8B). It is known that there are large species differences in the expression profile of SULTs. Lin et al. (2004) reported that SULT1A1 was not expressed in pig small intestine. Meinl et al. (2009) reported that SULTs were not expressed in rat small intestine. Therefore, it is essential to use a human cell model when evaluating SULT-mediated drug conjugation.

Expression analysis of carboxylesterases and SULTs in various regions of the intestinal tract. (A) The expression profiles of carboxylesterases and SULTs in the ileum are shown. (B) The gene expression levels of SULT1A4, SULT1A3, SULT1A1, and SULT1B1 in the duodenum, ileum, colon, and rectum are examined.
Identification of Duodenum-, Ileum-, Colon-, and Rectum-Specific Markers.
Many intestinal region–specific markers have been reported so far. For example, GATA binding protein 4 is expressed in the proximal small intestine (Bosse et al., 2006). It is also known that duodenal cytochrome b reductase 1 is expressed only in the duodenum (McKie et al., 2001), lactase-phlorizin hydrolase is mainly expressed in the jejunum (Krasinski et al., 1997), and apical ASBT is mainly expressed in the ileum (Shneider, 2001). We tried to find new intestinal region–specific markers by analyzing the RNA-seq results obtained in this study. The genes shown in Fig. 9 were suggested to be duodenum-, ileum-, colon-, and rectum-specific markers. However, before these genes can be used as duodenum-, ileum-, colon-, and rectum-specific markers, their expression must be analyzed by Western blotting analysis or immunostaining analysis.

Duodenum-, ileum-, colon-, and rectum-specific markers. Duodenum-, ileum-, colon-, and rectum-specific markers are shown in this figure. ADA, adenosine deaminase; AQP10, aquaporin-10; CCK, cholecystokinin; CD177, CD177 molecule; CD177P1, CD177 molecule pseudogene 1; CLDN8, Claudin 8; CPO, carboxypeptidase O; C8A, complement C8 alpha chain; C8orf49, chromosome 8 open reading frame 49; EVX2, even-skipped homeobox 2; FOLH1, folate hydrolase 1; FOLH1B, folate hydrolase 1B; GATA4, GATA binding protein 4; GLDN, gliomedin; HOXC6, homeobox C6; HOXD10, homeobox D10; HOXB13, homeobox B13; HOXD11, homeobox D11; HOXD12, homeobox D12; HOXD13, homeobox D13; LINC01445, long intergenic non-protein coding RNA 1445; L1TD1, LINE1 type transposase domain containing 1; MLN, Motilin gene; NPC1L1, NPC1 like intracellular cholesterol transporter 1; NTS, neurotensin; ONECUT2, one cut homeobox 2; PRAC1, PRAC1 small nuclear protein; PWRN1, Prader-Willi region nonprotein coding RNA 1; RBM24, RNA binding motif protein 24; SLC5A12, solute carrier family 5 member 12; ST6GAL2, ST6 beta-galactoside alpha-2,6-sialyltransferase 2; ST8SIA3, ST8 alpha-N-acetyl-neuraminide alpha-2,8-sialyltransferase 3; SULT4A1, sulfotransferase family 4A member 1; TMPRSS15, transmembrane serine protease 15; TNNC1, troponin C1, slow skeletal and cardiac type.
Next, therefore, we examined the expression profile of miRNAs in human intestinal epithelial cells in vivo. The proportions of the miRNAs expressed in the ileum were 20% (miR1244-2), 18% (miR621), 16% (miR1244-3), 11% (miR194-1), and 7% (miR3936) (Supplemental Fig. 5).
Expression Analysis of Human iPS Cell–Derived Intestinal Epithelial Cells and Caco-2 Cells.
Recently, we succeeded in generating intestinal epithelial cells from human iPS cells (Ozawa et al., 2015; Negoro et al., 2016, 2018; Takayama et al., 2019). In the present study, therefore, we also compared the global gene expression profiles between in vivo intestinal epithelial cells and human iPS cell–derived intestinal epithelial cells. In addition, the global gene expression profile of Caco-2 cells was analyzed because Caco-2 cells are a widely used cell model of intestinal drug metabolism and absorption. PCA showed that the gene expression profiles of human iPS cell–derived intestinal epithelial cells and Caco-2 cells were very different from those of human intestinal epithelial cells in vivo (Fig. 10). The gene expression levels of some cytochromes P450 and transporters in human iPS cell–derived intestinal epithelial cells were significantly lower than those in human small intestine in vivo. To produce human iPS cell–derived intestinal epithelial cells with properties similar to human intestinal epithelial cells in vivo, it is necessary to improve the intestinal differentiation method.

Global gene expression analysis of human iPS cell–derived intestinal epithelial cells and Caco-2 cells. Principal component analysis of transcription profiles was performed on biopsy samples, human iPS cell–derived intestinal epithelial cells cultured in general cell culture dishes [human iPS-ELC (flat)], human iPS cell–derived intestinal epithelial cells cultured on cell culture inserts [human iPS-ELC (monolayer)], and Caco-2 cells. The ratio of the contribution of each component is shown. PC1, principal component 1; PC2, principal component 2; PC3, principal component 3.
Discussion
In this study, to obtain gene expression profiles in human intestinal epithelial cells in vivo, biopsy samples were collected and RNA-seq analysis was performed. The gene expression profiles of drug-metabolizing enzymes (cytochromes P450), non–cytochrome P450 enzymes, nuclear receptors, drug-conjugating enzymes (UGTs and SULTs), and drug transporters in biopsy samples from the duodenum, ileum, colon, and rectum were elucidated in this study.
We consider that the data obtained herein would be more reflective of physiologic conditions than the data obtained from intestinal epithelial cells isolated from a surgically removed intestinal tract that was transported outside the hospital (Ho et al., 2017; Li et al., 2018). Since the human intestinal biopsies were obtained from patients without cancer in this study, the gene expression profiles in endoscopically normal intestinal epithelial cells could be analyzed. Moreover, in this manner we were able to obtain gene expression profiles in intestinal epithelial cells that were not exposed to anticancer drugs. However, because the patients participating in this study suffered from IBD, their expression profiles of genes related to inflammation may have differed from those in healthy individuals. Note that some patients are treated with steroids, which might affect gene expression levels of drug-metabolizing enzymes. It may be possible to discover the cause of IBD by comparing the acquired data with the gene expression profile of healthy individuals.
Because the biopsy samples obtained in this study were 5 mg per piece, they did not contain much intestinal gland or muscular mucosa, and most of the constituent cells were intestinal epithelial cells. However, the proportion of intestinal epithelial cells in the obtained biopsy samples was not measured. To perform a more rigorous analysis of gene expression profiles in intestinal epithelial cells, it will be necessary to perform gene expression analysis in a cell population in which the positive rate of intestinal epithelial cell markers is almost 100%. Therefore, in the future, we would like to acquire gene expression profiles in specific cell populations by performing cell sorting and single-cell analysis.
In this study, we performed only RNA-seq analysis; we did not evaluate the protein expression level or activity of ADME-related genes. From the viewpoint of pharmacokinetics, it is important to evaluate the activity of ADME-related genes using each specific substrate. It is reported that the mRNA expression levels of ADME-related genes do not correlate with protein expression levels (Drozdzik et al., 2019; Couto et al., 2020). However, it was difficult to measure the activities of ADME-related genes on a sufficient scale and within an adequate time period using only the small amounts of intestinal biopsy samples obtained in this study. In the future, it is expected that various pharmacokinetic studies could be performed by establishing an amplifiable intestinal organoid from the obtained biopsy sample. The above studies can be sufficiently realized because there have been many reports on the establishment of small intestinal and large intestinal organoids (Sato et al., 2011; Fujii et al., 2018).
Because it is difficult to collect biopsy samples from the jejunum during upper gastrointestinal endoscopy, small intestine endoscopy, and lower gastrointestinal endoscopy, gene expression analysis in the jejunum was not performed in this study. However, it would be very useful if we could obtain the gene expression profiles of ADME-related genes in the jejunum in the future. We consider that it is necessary to carry out more accurate statistical analysis by obtaining samples of not only jejunum but also other parts from many patients.
We obtained a comprehensive gene expression profile of ADME-related genes in intestinal epithelial cells. In many cases published before, only the expression of specific ADME-related genes was examined. We expect that the comprehensive gene expression data obtained in this study will be a useful resource for future analyses because it contains the expression profiles of all genes in normal human intestinal epithelial cells. In this study, RNA-seq data were analyzed from a pharmacokinetic point of view, but analysis from other points of view would also be significant.
Acknowledgments
We thank Junko Tanba, Hideyuki Koide, Yasuko Hagihara, Natsumi Mimura, and Ayaka Sakamoto for their excellent technical support. We are also grateful to Dr. Christian Schultheis and Marlene Sakowski (Boehringer Ingelheim Pharma GmbH & Co. KG) for the cDNA library preparation and sequencing, to Dr. Ramona Schmid (Boehringer Ingelheim Pharma GmbH & Co. KG) and Dr. Janine Roy (Staburo GmbH) for bioinformatics support including primary processing of the data and QC, and to Naoko Ohtsu for Caco-2 cell RNA preparation.
Authorship Contributions
Participated in research design: Takayama, Kishimoto, Nakase, Mizuguchi.
Conducted experiments: Ito, Matsui, Kawakami, Hirayama.
Contributed new reagents or analytic tools: Kawakami, Hirayama.
Performed data analysis: Takayama, Ito, Matsui, Yamashita.
Wrote or contributed to the writing of the manuscript: Takayama, Kishimoto, Nakase, Mizuguchi.
Footnotes
- Received October 13, 2020.
- Accepted December 12, 2020.
This research is supported by the grants from JSPS KAKENHI [Grants 18H05033, 18H05373].
No author has an actual or perceived conflict of interest with the contents of this article.
↵
 This article has supplemental material available at dmd.aspetjournals.org.

Abbreviations
- ABC
- ATP-binding cassette transporter
- ADME
- absorption, distribution, metabolism, and excretion
- AKR
- aldo-keto reductase
- ALDH
- aldehyde dehydrogenase
- ASBT
- ileal apical sodium/bile acid cotransporter
- BCRP
- breast cancer resistance protein
- BIO
- 6-bromoindirubin-3′-oxime
- CES
- carboxylesterase
- DAPT
- N-[(3,5-difluorophenyl)acetyl]-L-alanyl-2-phenyl]glycine-1,1-dimethylethyl ester
- FXR
- farnesoid X receptor
- GR
- glucocorticoid receptor
- IBD
- inflammatory bowel disease
- iPS
- induced pluripotent stem
- MAOA
- monoamine oxidase A
- miR
- microRNA
- MRP
- multidrug resistance protein
- NR
- nuclear receptor
- OATP
- organic anion transporting polypeptide
- OST
- organic solute transporter
- PCA
- principal component analysis
- PEPT1
- peptide transporter 1
- P-gp
- P-glycoprotein
- PXR
- pregnane X receptor
- RIN
- RNA integrity number
- RNA-seq
- RNA sequencing
- SULT
- sulfotransferase
- TMM
- trimmed mean of M-values
- UGT
- UDP-glucuronosyltransferase
- VDR
- vitamin D receptor
- Copyright © 2021 by The American Society for Pharmacology and Experimental Therapeutics


