


Abstract
Tropifexor (NVP-LJN452) is a highly potent, selective, nonsteroidal, non–bile acid farnesoid X receptor agonist for the treatment of nonalcoholic steatohepatitis. Its absorption, metabolism, and excretion were studied after a 1-mg oral dose of [14C]tropifexor was given to four healthy male subjects. Mass balance was achieved with ∼94% of the administered dose recovered in excreta through a 312-hour collection period. Fecal excretion of tropifexor-related radioactivity played a major role (∼65% of the total dose). Tropifexor reached a maximum blood concentration (Cmax) of 33.5 ng/ml with a median time to reach Cmax of 4 hours and was eliminated with a plasma elimination half-life of 13.5 hours. Unchanged tropifexor was the principal drug-related component found in plasma (∼92% of total radioactivity). Two minor oxidative metabolites, M11.6 and M22.4, were observed in circulation. Tropifexor was eliminated predominantly via metabolism with >68% of the dose recovered as metabolites in excreta. Oxidative metabolism appeared to be the major clearance pathway of tropifexor. Metabolites containing multiple oxidative modifications and combined oxidation and glucuronidation were also observed in human excreta. The involvement of direct glucuronidation could not be ruled out based on previous in vitro and nonclinical in vivo studies indicating its contribution to tropifexor clearance. The relative contribution of the oxidation and glucuronidation pathways appeared to be dose-dependent upon further in vitro investigation. Because of these complexities and the instability of glucuronide metabolites in the gastrointestinal tract, the contribution of glucuronidation remained undefined in this study.
SIGNIFICANCE STATEMENT Tropifexor was found to be primarily cleared from the human body via oxidative metabolism. In vitro metabolism experiments revealed that the relative contribution of oxidation and glucuronidation was concentration-dependent, with glucuronidation as the predominant pathway at higher concentrations and the oxidative process becoming more important at lower concentrations near clinical exposure range. The body of work demonstrated the importance of carefully designed in vivo and in vitro experiments for better understanding of disposition processes during drug development.
Introduction
The farnesoid X receptor (FXR) is a bile acid (BA)-activated nuclear receptor, expressed predominantly in the liver, kidney, intestine, and adrenals (Parks et al., 1999). In the liver, the FXR is expressed primarily in parenchymal cells and to a lesser extent in Kupffer cells and stellate cells. It acts as a sensor of elevated BA levels (Meadows et al., 2020) and initiates homeostatic responses to control BA levels and modulate other metabolic processes such as gluconeogenesis and lipogenesis (Schaap et al., 2014). Elevated BA level is associated with inflammation and tumorigenesis, the diverse pathogeneses that are involved in different liver diseases (Zhu et al., 2016). Activation of the FXR reduces BA synthesis by increasing expression of BA transporters and modulating lipoprotein metabolism (Meadows et al., 2020). It also increases glucose disposal (even in patients with type 2 diabetes) decreases lipogenesis-associated inflammation and reduces fibrosis (Ratziu et al., 2019). Thus, activation of the FXR is proposed to be an effective treatment option for different liver diseases associated with BA dysregulation, such as intrahepatic cholestasis, nonalcoholic steatohepatitis (NASH), and BA malabsorption diarrhea (Schaap et al., 2014; Walters et al., 2015).
Activation of the FXR in the liver upregulates the small heterodimer partner (SHP) signaling cascade. This inhibits the transcription of CYP7A1 and CYP8B1 genes (Schaap et al., 2014; Chiang 2015, 2017; Tully et al., 2017; Chiang and Ferrell 2018) and activates the mitogen-activated protein kinase signaling pathway via inducing FGF-19, leading to downregulation of CYP7A1 and subsequent inhibition of BA synthesis (Schaap et al., 2014; Tully et al., 2017; Chiang and Ferrell 2018). Activation of the FXR-SHP cascade is also associated with anti-inflammatory, antifibrotic, and anticholestatic effects (Calkin and Tontonoz, 2012; Schaap et al., 2014).
Several FXR agonists are in clinical development for the treatment of NASH and hepatic fibrosis. Among them, obeticholic acid (OCA; 25 mg), a BA FXR agonist, was shown to improve fibrosis and histologic features of NASH in a multicenter, randomized, placebo-controlled phase III clinical trial (Younossi et al., 2019). Although OCA demonstrated favorable results in treating NASH, a high rate of pruritus and adverse effect on the lipid profile (increase in total cholesterol and low-density lipoprotein cholesterol) were observed in OCA-treated versus placebo-treated patients (Neuschwander-Tetri et al., 2015; Polyzos et al., 2020).
To address these limitations, the development of a novel FXR agonists with improved efficacy, safety, and tolerability than the current standard is necessary. Tully et al. (2017) discovered tropifexor, a highly potent non-BA FXR agonist. Tropifexor has been shown to induce FXR target genes (SHP, bile salt export pump, CYP8B1, and FGF-15) at very low doses and to provide systematic FXR exposure in rodents (Tully et al., 2017). In the liver, inductions of SHP, bile salt export pump, and CYP8B1 were observed at tropifexor doses of 0.01 mg/kg, 0.003 mg/kg, and 0.03 mg/kg, respectively. In the ileum, SHP and FGF-15 were induced at doses as low as 0.01 mg/kg. In addition, plasma FGF-15 protein concentration came down to the baseline at 24 hours after the final dose, suggesting that tropifexor administration does not lead to prolonged exposure to FXR activation (Tully et al., 2017).
In the preclinical NASH model, tropifexor showed marked reduction in steatohepatitis, fibrosis, and profibrogenic gene expression. The efficacy of tropifexor (at <1 mg/kg) was found to be superior to that of OCA (at 25 mg/kg) in the liver of insulin-resistant obese amylin liver NASH model mice (Hernandez et al., 2019). In the first-in-human study, tropifexor (single ascending dose: 0.01–3 mg; multiple ascending dose: 0.01–0.1 mg once daily for 14 days) was well tolerated in healthy volunteers with an acceptable safety profile. The pharmacokinetic (PK) profile was also found to be suitable for once-daily dosing (Badman et al., 2020).
Our study investigated the absorption, metabolism, and excretion (AME) of tropifexor in healthy humans. The rates and routes of excretion of [14C]tropifexor-related radioactivity were determined, including the mass balance of total drug-related radioactivity in excreta. Key biotransformation pathways and clearance mechanisms were elucidated in the study. To gain a better understanding of the disposition behavior of tropifexor in humans, additional in vitro studies were conducted to identify and characterize enzymes involved in the metabolism of tropifexor, assess the relative contributions of the different biotransformation pathways to total tropifexor metabolism, and evaluate the potential for concentration-dependent metabolism.
Materials and Methods
Human Study
Study Drug for Clinical Trial
Radiolabeled [14C]tropifexor for the clinical study was supplied as free form bulk dose container ([14C]tropifexor powder in bottle) by Novartis authorized contract manufacturing organization (Pharmaron, Inc.). When reconstituted and dispensed, the dosage form was an oral solution containing 1 mg [14C]tropifexor (free form) with a corresponding 60 µCi (2.22 MBq) radioactivity. Radiochemical purity of 14C-labeled drug substances for human study was ≥98%. Figure 1 illustrates the chemical structure, molecular formula, and specific radioactivity of [14C]tropifexor.

Chemical structure of [14C]tropifexor. Chemical formula (unlabeled): C29H25F4N3O5S. Specific activity: 60 μCi/mg (2.22 MBq/mg).
Study Design
The human AME study was an open-label, single-dose study conducted in four healthy male subjects aged between 18 and 45 years with a body mass index of 18–30 kg⋅m−2. The clinical study protocol was reviewed by the institutional review board, and the study was conducted according to the ethical principles of the 1964 Declaration of Helsinki and its later amendments. Informed consent was obtained from each subject in writing before enrollment.
Subjects were restricted to the clinical research unit (Covance, Madison, WI) under observation for around 24 hours before drug administration. After overnight fasting of 10 hours, the four qualified subjects received a single, oral, 1-mg dose of [14C]tropifexor (60 µCi). Recovery of radioactivity in excreta from each subject was monitored daily during the study. Subjects remained domiciled for a period of at least 7 days. From days 7 to 13, subjects were discharged if the cumulative recovery of radioactivity in excreta was ≥90% and the combined urinary and fecal excretion was ≤1% of the administered dose per 24 hours for 2 consecutive days. All subjects were released in the morning of day 14 irrespective of radioactivity recovery. Blood and plasma samples for PK, total radioactivity, and metabolite analysis were collected before administration of the dose and at 1, 2, 3, 4, 6, 8, 12, 24, 48, 72, 96, 120, 144, 168, 192, 216, 240, 264, 288, and 312 hours postdose. Each sample was collected into a precooled tube containing the anticoagulant, K2EDTA. Plasma samples were centrifuged, and the supernatants were isolated. Urine samples were collected at 0–6, 6–12, and 12–24 hours and in 24-hour intervals thereafter until release. Feces samples were collected as passed from the hour of dosing until release. All samples were stored at −70 ± 10°C until analysis.
Determination of Total Radioactivity in Human Blood, Plasma, Urine, and Feces
Investigation of total radioactivity in human blood, plasma, urine, and feces was performed by Covance Laboratories (Madison, WI) using liquid scintillation counting (LSC). Plasma and urine samples were analyzed by direct LSC after homogenizing each sample. Duplicate or triplicate aliquots were mixed with a scintillation cocktail before analyzing in a Packard liquid scintillation counter (Perkin Elmer Corporation, Waltham, MA). Blood samples were aliquoted and combusted in a model 307 Sample Oxidizer (Packard Instrument Company Inc., Meriden, CT). The resulting 14CO2, captured in Carbo-Sorb (Perkin Elmer Corporation, Waltham, MA), was analyzed using LSC after mixing with Permafluor (Perkin Elmer Corporation, Waltham, MA). All samples were aliquoted utilizing gravimetric measurement. Feces samples were combined at 24-hour intervals for each subject and weighed. A measured amount of water (approximately 2 to 3 times the sample weight) was added, and the sample was homogenized. Triplicate aliquots of fecal homogenate (roughly 0.2 g) were combusted and analyzed by LSC.
A conversion factor of 1 μCi per 2.22 × 10⁶ dpm was used to convert radioactivity from dpm to μCi. For blood and plasma, the radioactivity was converted to a concentration of drug-related material (nanogram equivalent per gram or picomole per milliliter) using the aliquot weight and the specific activity of the drug (35.7μCi/µmol or 59 μCi/mg). For urine and feces samples, the measured radioactivity was converted to a percentage of dose recovery using the aliquot weight, the total weight of the collected sample, and the known radioactivity of the dose. To determine the mass balance, the cumulative percentage dose recovered from all of the collected urine and feces was calculated.
Pharmacokinetic Analysis
Tropifexor concentration in plasma was determined using a validated liquid chromatography with tandem mass spectrometry (LC-MS/MS) method. The Cmax, Tmax, AUClast, AUCinf, t1/2, Vz/F, and CL/F were determined for tropifexor concentrations in plasma, and Cmax, Tmax, AUClast, and AUCinf were determined for the total radioactivity measurements of [14C]tropifexor in plasma and the whole blood. As aliquots of blood and plasma were weighed for total radioactivity analysis, results in nanogram equivalent per gram were converted to nanogram equivalent per milliliter using a conversion factor of 1 g = 1 ml. The PK parameters were determined by applying noncompartmental methods using Phoenix WinNonlin software (Certara, Princeton, NJ).
Sample Preparation for Metabolite Analysis
Plasma
For metabolite assessment, equal-volume aliquots of plasma samples were pooled across the four subjects at predose and at selected time points postdose. Pooled plasma samples (∼4 ml) were then processed for analysis by protein precipitation using a measured ratio of appropriate organic solvents. After vortex mixing, samples were centrifuged at 5580g for 10 minutes at 10°C, and the supernatants were collected. The organic portions of the supernatants were evaporated under a stream of nitrogen, and the resulting sample was frozen. The frozen sample was lyophilized to dryness, and the residue was subsequently reconstituted with aqueous and organic solvents at appropriate ratios to obtain an ∼20-fold concentration of the original sample.
Urine
A urine sample pool, representing >91% of the excreted radioactivity in urine, was prepared for each subject by taking equal percentages of volume excreted from each collection interval. An aliquot of the pooled urine sample was frozen and subsequently lyophilized to dryness. The resulting residue was reconstituted to one-tenth of the original volume with mobile phase A (5 mM ammonium formate with 0.1% formic acid) for LC-MS/MS analysis.
Feces
A cumulative fecal homogenate pool, representing >92% of the excreted radioactivity in feces, was prepared for each subject by taking an equal percentage (by weight) of the excreted sample in each 24-hour interval. In addition to the cumulative pool, some individual fecal samples at later time points (when the absorption process was likely to be completed) were also analyzed to evaluate the relative level of intact tropifexor in these samples. Aliquots of the pooled and selected individual fecal homogenate samples from each subject were extracted multiple times with appropriate organic solvents. After each extraction, the supernatants of the extract were collected by centrifugation and combined. The organic portions of the extract were evaporated under a stream of nitrogen, and the remaining aqueous part was frozen and lyophilized. Residue was reconstituted with mobile phase A (5 mM ammonium formate with 0.1% formic acid) to B (acetonitrile with 0.1% formic acid) in a 9:1 (v/v) ratio. The samples were further centrifuged to remove any particulate. The clear supernatant was analyzed for tropifexor and metabolites using LC-MS/MS. The final reconstituted sample represented 10-fold concentration from the fecal homogenate.
Liquid Chromatography and Mass Spectrometry Analysis of Metabolites
Chromatographic separation of tropifexor and its metabolites was performed using Acquity ultraperformance liquid chromatography (UPLC) systems (Waters, Milford, MA) equipped with a Mac-Mod ACE Excel 2 AQ UPLC column (3 mm × 150 mm, 2.1-μm particle size; Mac-Mod, Chadds Ford, PA). The column was maintained at 35°C, and the elution was achieved with a flow rate of 0.5 ml/min. The mobile phases consisted of solvent A (5 mM ammonium formate with 0.1% formic acid) and solvent B (acetonitrile with 0.1% formic acid). A linear gradient elution was used. The linear elution gradient started at 10% B and was increased to 90% B by 30 minutes, maintained at 90% B for 10 minutes, decreased to 10% B from 40 to 41 minutes, and then finally held at 10% B from 41 to 50 minutes. The LC eluent was split at 1:10 volume ratios with one part directed to the mass spectrometer and 10 parts for radioactivity detection (see Supplemental Appendix).
Structural elucidation of the metabolites was carried out using the LTQ Orbitrap Elite mass spectrometer (Thermo Fisher Scientific, Waltham, MA) interfaced with Acquity UPLC systems (Waters, Milford, MA). Source parameters were adjusted to optimize analyte response in the positive electrospray ionization mode for the MS system. Full-scan MS spectra were typically obtained in profile mode, whereas product ion (MS/MS) spectra were generated in centroid mode using either data-dependent acquisition MS/MS or dedicated MS/MS scans. The analytes were fragmented using high-energy collisional dissociation of the molecular ion. Metabolite structural elucidation and assignment were based on their high-performance liquid chromatography retention times, full-scan accurate MS spectral analysis with exact mass confirmation against theoretical elemental composition, and product ion (MS/MS) mass spectra.
Quantitative Assessment of Tropifexor and Metabolites
During LC-MS/MS analyses of samples for metabolite profiling, the majority of the LC eluent (10 parts) was collected via an HTC Collect PAL fraction collector (Leap Technologies, Carrboro, NC) into 96-well Luma plates for off-line radiochromatographic profiling. Luma plates were dried and subsequently counted on a TopCount NXT (Perkin Elmer, Shelton, CT). Laura software (LabLogic System Ltd., Sheffield, UK) was used for data processing and generation of radiochromatograms. The concentration or amount of each component peak was calculated as its fraction of radioactivity in a particular peak multiplied by the total concentration (in nanogram equivalent per gram) in plasma or the percentage of the dose in the excreta. Metabolite concentrations were reported in nanogram equivalent per milliliter. Details are provided in the Supplemental Appendix.
In Vitro Studies
Chemicals, Reagents, and Standards
Pooled human liver microsomes (HLM) (lot 38289, n = 150 donors, mixed gender) were purchased from Corning Gentest (Tewksbury, MA). Microsomal preparations from baculovirus-infected insect cells expressing individual recombinant human cytochrome P450 (rhCYP) or rhUGT enzymes, control microsomes, and NADPH regenerating system were also purchased from Corning Gentest (Tewksbury, MA). LiverPool 20-donor mixed-gender pooled cryopreserved human hepatocytes (lot OAP), InVitroGRO KHB (a modified Krebs-Henseleit buffer for hepatocyte incubation) and InVitroGRO Thawing Medium were purchased from BioreclamationIVT (Baltimore, MD). FBS was purchased from Invitrogen (Walkersville, MD). FBS (100%) was added to KHB to make 2% (v/v) FBS in KHB. Ammonium formate (10 mM) was purchased from Hampton Research (Aliso Viejo, CA). [14C]Tropifexor (specific activity of 42.4 or 53.3 mCi/mmol with radiochemical purity of >98%) and stable labeled [M+5]tropifexor was obtained from Novartis Isotope Laboratory (East Hanover, NJ). FlowLogic U was purchased from LabLogic System, Inc. (Brandon, FL). Opti-Fluor was from PerkinElmer Life and Analytical Sciences (Boston, MA). All other chemicals and solvents were of analytical grade and were obtained from commercial sources.
In Vitro Hepatic Metabolism of Tropifexor and Relative Contributions of Individual Cytochrome P450 or UGT Enzymes to Metabolic Clearance
The methods for in vitro metabolism of tropifexor in HLM and human hepatocytes (HH) including estimations of the relative contributions of individual cytochrome P450 or UGT enzymes to tropifexor hepatic metabolic clearance by oxidation or glucuronidation can be found in the Supplemental Appendix.
Estimation of Fractional Metabolism by Cytochrome P450 and UGT in Human Hepatocytes and Dose Dependence
The relative contribution of cytochrome P450 and UGT metabolism to total tropifexor metabolic clearance (and its dose dependence) in HH in vitro was determined by selective chemical inhibitors for each metabolic pathway using different tropifexor concentrations (method described later). In addition, relative contributions of these enzyme pathways to total tropifexor metabolism were evaluated by measuring the rate of specific metabolite formation in HH using different tropifexor concentrations (method described in the Supplemental Appendix).
To evaluate the contributions of cytochrome P450 and UGT to the overall metabolism of tropifexor in HH using chemical inhibition, the CLint of tropifexor with 1-aminobenzotriazole (3 μM ABT, cytochrome P450 inhibitor), or 0.5 μM borneol (UGT inhibitor) (Jinno et al., 2014) and/or 0.05 μM ATZ (inhibitor of UGT1A1/3) (Zhang et al., 2005) was determined and compared with the CLint without inhibitors. Cryopreserved hepatocytes were processed as described by the supplier (described in the Supplemental Appendix). In total, 500 μl (∼106 cells) of the final cell suspension was added to triplicate wells of a 12-well plate predispensed with 0.5 ml of KHB and tropifexor (0.005 or 0.1 µM, nominal concentration) with different inhibitors. Control wells contained no inhibitor. The plate was incubated at 37°C in a humidified cell culture incubator (5% CO2, 95% air) without shaking for 0, 0.5, 1, 2, 3, and 4 hours. At each time point, an aliquot (150 µl) of each incubation mixture was removed and quenched with an equal volume of cold acetonitrile with 30 ng/ml of internal standard. The precipitated pellet was removed by centrifugation, and an aliquot of each sample was analyzed using the LC-MS/MS multiple reaction monitoring method. Clearance calculations and estimation of relative contributions of cytochrome P450 and UGT enzymes to tropifexor metabolism can be found in the Supplemental Appendix.
Results
A single oral dose of 1 mg [14C]tropifexor was well tolerated in healthy male subjects. No serious adverse events or severe adverse events were reported during the study. All four subjects completed the study.
Pharmacokinetics Parameters and Total Radioactivity of Tropifexor in Plasma
After a 1-mg oral dose of [14C]tropifexor in human, plasma concentrations of both tropifexor and total radioactivity increased to mean peak levels of 33.5 (± 5.74) ng/ml and 37.9 (± 7.24) ng-eq/g, respectively, with a median Tmax of 4 hours (Table 1). Thereafter, the plasma concentrations decreased, with a mean elimination half-life of 13.5 (± 2.04) hours for tropifexor and 20.4 (± 4.49) hours for total radioactivity. Quantifiable concentrations of plasma tropifexor were observed for up to 120 hours postdose, and plasma total radioactivity concentrations were quantifiable for up to 96 hours postdose (Fig. 2). The mean plasma exposure of the tropifexor parent compound (AUCinf = 553 h*ng/ml) accounted for ∼82% of the total plasma radioactivity exposure (AUCinf = 674 h*ng-eq/g), indicating tropifexor as the major circulating component. The intersubject variability associated with Cmax and AUCinf for tropifexor and total radioactivity were ranging from 17% to 20%.

Arithmetic mean (± S.D.) of the plasma tropifexor and plasma total radioactivity concentration-time profiles.
Summary statistics of total radioactivity and tropifexor PK parameters in plasma
Statistics are arithmetic mean ± SD (CV%); CV% = S.D./mean*100; for Tmax, statistics are median (Min-Max) total radioactivity.
Mass Balance and Excretion of Tropifexor in Humans
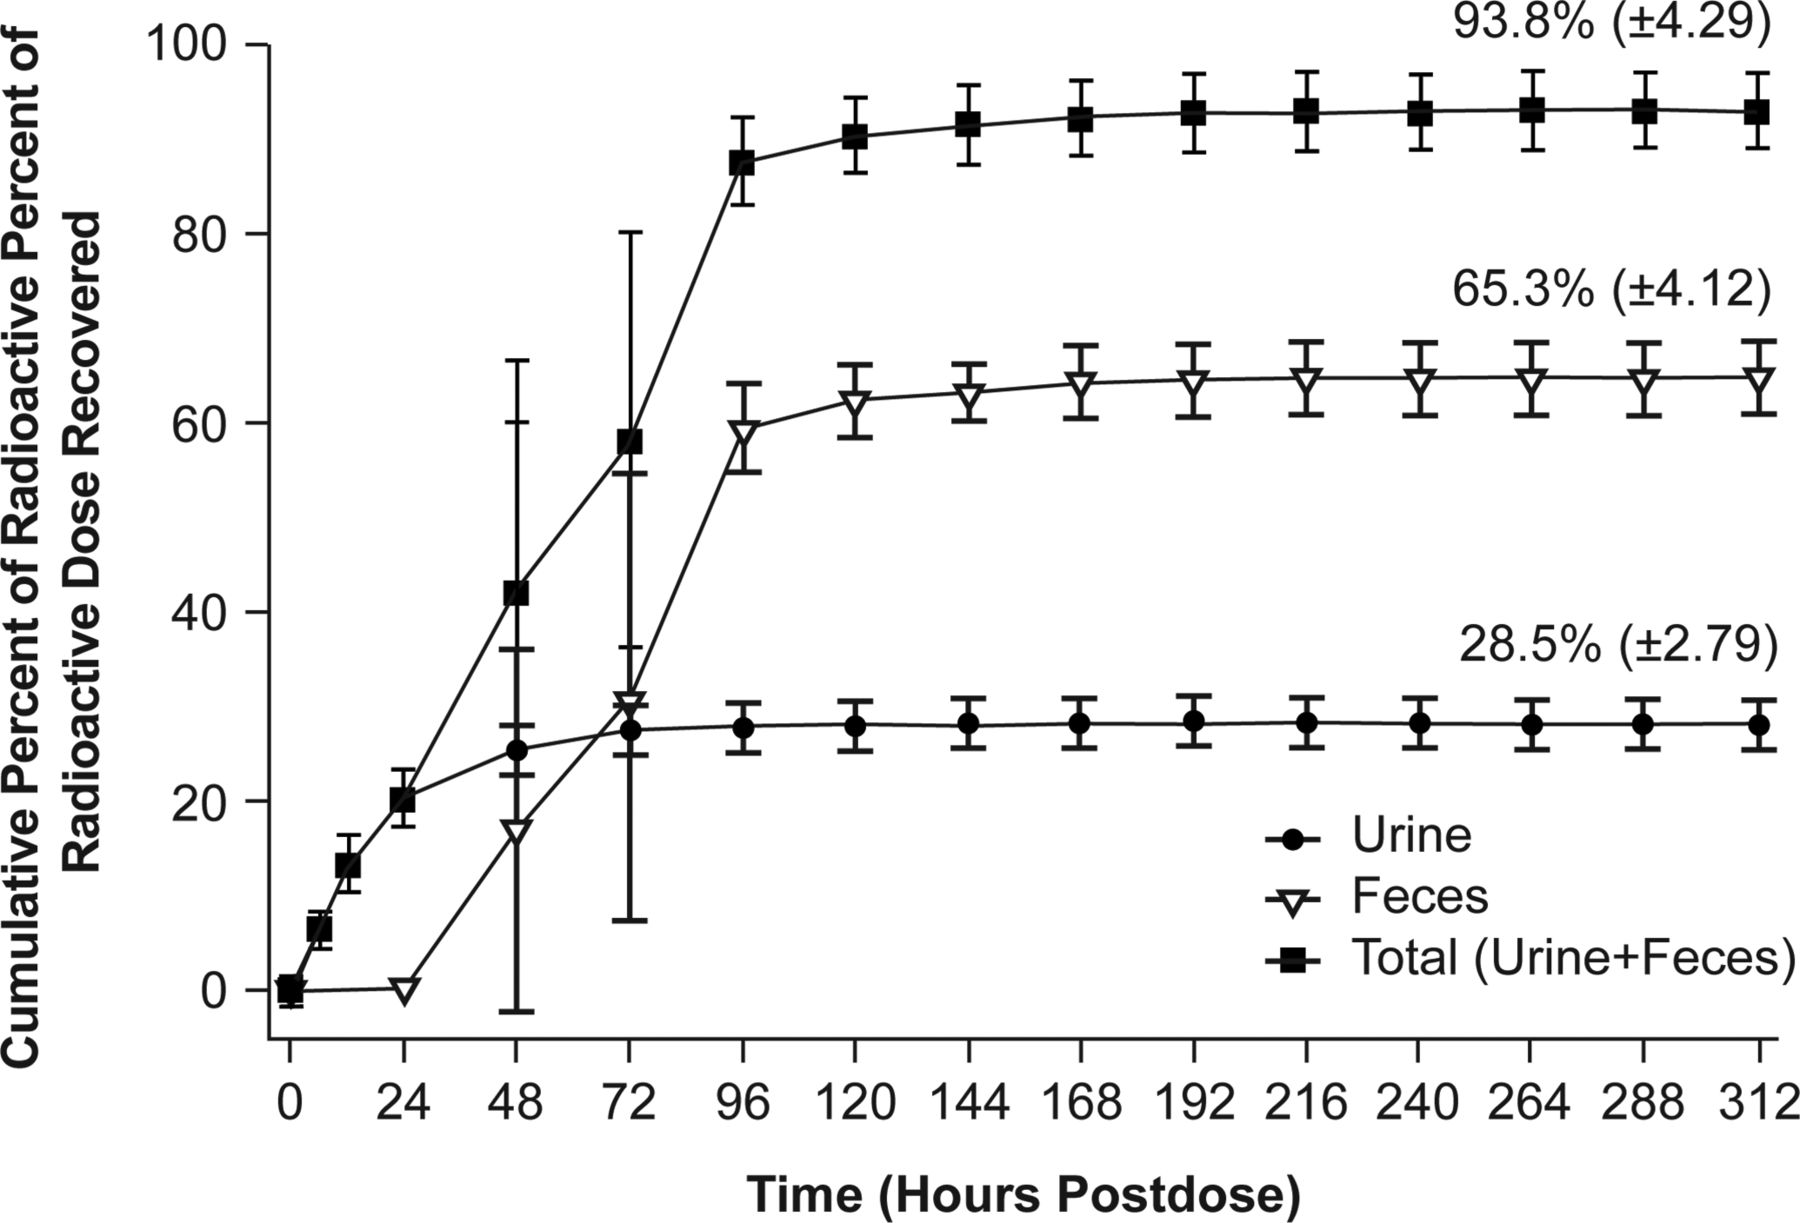
Adequate mass balance was achieved after a single oral dose of [14C]tropifexor to healthy human subjects. The cumulative recovery of radioactivity from human subjects through the last collection time point (312 hours) was an average of 93.8% (± 4.29%). The radioactive dose was excreted in both feces and urine, with fecal excretion playing a relatively more important role. The mean urinary excretion was 28.5% (± 2.79%), and the mean fecal excretion was 65.3% (± 4.12%). The excretion of radioactivity was rapid, with the majority of the dose excreted within 96 hours postdose in both urine and feces (Fig. 3).

Mean (± S.D.) cumulative excretion of radioactivity in urine and feces after a single oral dose of 1 mg [14C]tropifexor in healthy male subjects (N = 4).
Tropifexor Metabolism in Humans
Metabolite Profiles in Plasma
The representative tropifexor metabolite profiles in circulation at Tmax and 24 hours postdose are provided in Fig. 4. Plasma radioactivity was quantifiable up to 72 hours postdose using radiometric profiling; thus, calculations of metabolite and tropifexor exposure were based on total radioactivity exposure up to 72 hours postdose (AUC0–72h = 629 ng-eq/ml). The most prominent drug-related component in the plasma was tropifexor, accounting for ∼91.6% of total radioactivity AUC0–72h. Two minor circulating metabolites were observed. The O-dealkylation metabolite M11.6 accounted for ∼1.7% of the total radioactivity AUC0–72h, and the mono-oxy metabolite M22.4 accounted for 5.0% of the total radioactivity AUC0–72h. Plasma concentrations and PK parameters of tropifexor and its metabolites in circulation are presented in Table 2.

Representative tropifexor metabolite profiles in pooled plasma after a single oral dose of 1 mg [14C]tropifexor in healthy subjects. CPM, radioacivity in counts per minute.
Plasma concentrations and PK parameters of tropifexor and its metabolites after a single oral dose of 1 mg [14C]tropifexor to healthy subjects
Metabolite Profiles in Excreta
The metabolites observed in human excreta are expressed as a percentage of the administered dose (Table 3). Representative radiochromatograms showing metabolite profiles in human urine and feces are illustrated in Fig. 5. Metabolites observed in human urine were mainly results of oxidative O-dealkylation and further glucuronidation or oxidation. The main metabolite observed in the urine was M8.8, a metabolite combining glucuronidation and O-dealkylation, accounting for 10.8% of the dose on average. O-dealkylation of tropifexor led to two stereoisomers, M10.8 and M11.6, accounting for 3.7% and 4.9% of the dose in urine, respectively. Two other metabolites were observed at lower levels and included M6 (combination of mono-oxidation and O-dealkylation) and M6.7 (glucuronide of O-dealkylation). Tropifexor was not observed in the urine.

Representative metabolite profile in urine and feces after a single oral dose of 1 mg [14C] tropifexor in healthy subjects. (A) Urine, 0-72 h; (B) feces, 24-120 h cumulative; (C) feces, late time point 144-168 h. Total radioactivity is reported in counts per minute (CPM).
The total mean (± S.D.) recovery of tropifexor and its metabolites in human excreta (expressed as a percentage of the dose) after an oral dose of 1 mg [14C]tropifexor to healthy subjects (N = 4)
In contrast, intact tropifexor was the main component in feces, as an average of 25.4% (± 4.67%) of the dose. Metabolites observed in feces were as a result of oxidative metabolism. The main metabolite observed in feces was M6, a mono-oxidation of the O-dealkylation metabolite, accounting for 8.6% of the dose. M10.8 and M11.6 accounted for 3.3% and 6.5% of the dose, respectively. Mono-oxidation of tropifexor resulted in M24 (2.6% of the dose) and M22.4. M22.4 coeluted with a dioxidation metabolite, M19.5. The sum of the two contributed to a total of ∼8.0% of the dose. Other minor metabolites observed in human feces included M18.1 and M18.2, each accounting for 2% to 3% of the dose. Several minor peaks were observed in the urine and feces, but were unidentifiable, each contributing to <2% of the total dose. Accurate mass of the acyl glucuronide metabolite, M22 (m/z 782.1877), with 5 ppm tolerance was extracted from full-scan mass spectra of both urine and feces samples. However, no discernable peak was observed in human excreta, confirming the absence of M22.
Estimation of Tropifexor Absorption in Human
The fraction of the dose absorbed (Fa) was calculated as the sum of the fraction of the dose excreted in the urine (Furine) and the fraction of dose excreted as metabolites in feces (Fmetabolite in feces) as in the following equation:

Average absorption, estimated based on this equation, was 68.4% (range 63.0%–71.8%) in human subjects. This estimation assumes the amount of intact tropifexor in the feces is entirely unabsorbed dose. For cases in which the absorbed parent was metabolized to direct glucuronides and subsequently hydrolyzed back to the parent in the gastrointestinal tract, or the intact parent was absorbed and eliminated via direct intestinal or biliary excretion, the Fa would be better estimated by adding back the contribution from the aforementioned processes:
 where Fabsorbed parent in feces is the fraction of dose absorbed but appeared as the intact parent in feces. The Fabsorbed parent in feces was estimated from the late fecal profiles in which absorption was assumed to be completed, and the intact parent observed was presumably the result of unstable metabolites or the excreted parent (Figure 5C). We can also assume that the ratios of the absorbed parent-to-metabolite maintain constant over time in the feces, that is

The Fabsorbed parent in feces can then be estimated as follows:

Using these equations and assumptions, the fraction of the dose absorbed but appeared as the intact parent in feces was calculated to be ∼7.5% (± 1.6%) based on the late time point fecal profile. Therefore, the overall tropifexor absorption was calculated to be 75.9% (± 5.1%) on average.
Biotransformation Pathways of Tropifexor in Human
Structural assignments of metabolites in humans, carried out by LC-MS/MS analysis with off-line radioactivity detection, were based on their relative high-performance liquid chromatography retention times, full-scan MS spectral analysis with exact mass confirmation against theoretical elemental composition, and product ion mass spectra. All metabolites observed in the human AME study with their accurate mass data, the proposed structure, and fragmentation assignments are listed in Table 4. Metabolites detected at trace levels in human plasma by MS only were included and are noted as such. Product ion mass spectra of the parent and metabolites can be found in Supplemental Appendix (Supplemental Fig. 2).
Mass spectral analysis of tropifexor and its metabolites in human plasma, urine, and feces
Based on metabolites characterized in human plasma and excreta, the overall biotransformation pathways of tropifexor are proposed and summarized in Fig. 6. Overall, tropifexor appeared to be primarily metabolized via phase I oxidative pathways, as the majority of radioactivity observed in human excreta consisted of oxidative metabolites. The primary oxidative pathways included oxidative O-dealkylation, and oxidation at the phenyl cyclopropyl isoxazole moiety and/or at the benzothiazole and fused ring structure. Metabolites containing multiple oxidative modifications and/or glucuronidation to oxidative products were also observed. The extent of the contribution from oxidative pathways to total tropifexor metabolism was estimated to be 68.4% (sum of all metabolites containing oxidative modification in excreta) of the dose. No quantifiable direct glucuronide metabolites were detected in humans in vivo.

Proposed biotransformation pathways of tropifexor. Fc, feces; Gluc, glucuronide; Pl, plasma; Ur, urine.
Tropifexor Metabolism in Vitro
Tropifexor Metabolism in HLM and HH
In incubations of [14C]tropifexor (10 μM) with HLM, low levels of oxidative metabolites were formed (M11.6 and M22.4) in the presence of the cytochrome P450 enzyme cofactor NADPH. In the presence of both cofactors for cytochrome P450– and UGT-mediated metabolism, a predominance of the acyl glucuronide (M22) was observed in the incubations (Supplemental Appendix; Supplemental Fig. 1). In HH, at this same [14C]tropifexor concentration, the predominance of the M22 acyl glucuronide was also observed, in addition to a small proportion of the oxidative metabolites M10.8 and M11.6 (data not shown). Representative product ion spectra of oxidative and acyl glucuronide metabolites observed from in vitro incubations can be found in Supplemental Appendix (Supplemental Fig. 3) and were comparable to those observed in the human AME study.
Identity and Relative Contribution of Cytochrome P450 Enzymes to the Oxidative Metabolism of Tropifexor in the Human Liver
Among the rhCYP enzymes tested, appreciable metabolite formation above the control level was detectable in incubations with CYP1A1, CYP2C8, CYP2C9, and CYP3A4. Of particular note, the primary metabolite M11.6 was found to be formed by CYP3A4, M24 was formed by CYP2C9, and M22.4 was formed by CYP2C8.
The contributions of different cytochrome P450 enzymes to the oxidative metabolism of tropifexor were estimated based on the ability of selective inhibitors of specific cytochrome P450 enzymes to inhibit total oxidative metabolism of tropifexor in HLM. Tropifexor clearance in HLM with or without selective inhibition were compared and corrected with the reported inhibitor crossreactivity for individual cytochrome P450 enzymes and normalized to 100%. In HLM, selective inhibitors of CYP2C8 (montelukast), CYP2C9 (sulfaphenazole), or CYP3A (ketoconazole) inhibited total tropifexor metabolism by ∼35%, 6.1%, or 74%, respectively. These three inhibitors were selected based upon the results of the rhCYP metabolism screening experiment, in which these cytochrome P450 enzymes were most active for tropifexor hepatic metabolism. After applying the correction and normalization, the relative contribution of CYP2C8, CYP2C9, and CYP3A to total tropifexor metabolism was estimated to be 15%, <0.1%, and 85%, respectively (Table 5). These data indicated that tropifexor hepatic microsomal oxidative metabolism is mainly due to CYP3A.
Relative contributions of cytochrome P450 enzymes to tropifexor oxidative metabolism in HLM using cytochrome P450–selective chemical inhibition
Additionally, the relative contributions of CYP3A and CYP2C8 to the total oxidative metabolism of tropifexor in the human liver was estimated using rhCYP kinetics and scaling the rhCYP CLint,u to the HLM CLint,u using a relative activity factor (the ratio of a specific cytochrome P450’s activity in the recombinant expressed microsomes vs. the same specific cytochrome P450’s activity in the pooled HLM under substrate saturating conditions). The scaled CYP2C8 and CYP3A HLM CLint was estimated to be 5.30 and 94.3 ml/h per milligram microsomal protein, respectively (Table 6). This corresponded to a relative contribution of CYP2C8 and CYP3A to total tropifexor oxidative hepatic metabolism of approximately 5% and 95%, respectively. From the two methods described (chemical inhibition and rhCYP kinetics with scaling), it can be concluded that that the majority of tropifexor oxidative clearance is mediated by CYP3A4 (85%–95%) with a minor contribution by CYP2C8 (5%–15%) and negligible contribution by CYP2C9.
Contributions of cytochrome P450 enzymes to tropifexor oxidative metabolism in HLM determined by rhCYP kinetics and scaling using a relative activity factor
Identity and Relative Contributions of Individual UGT Enzymes to the Total Glucuronidation of Tropifexor in the Human Liver
Appreciable tropifexor metabolism above control levels was detectable in incubations with the rhUGT1A1, rhUGT1A3, rhUGT1A7, and rhUGT1A9 enzymes, leading to the formation of the acyl glucuronide metabolite M22. ATZ, a UGT1A1 and UGT1A3 inhibitor, was found to inhibit M22 formation in HLM by up to ∼77%, with an IC50 value of ∼4.9 μM, similar to that reported in the literature (data not shown). AZT showed a small inhibition effect of tropifexor metabolism by rhUGT1A9 (maximal inhibition of 37%), suggesting that ATZ is a more selective inhibitor of UGT1A1/3 than UGT1A9. Since UGT1A7 was mainly expressed in gastric tissues and not in the liver (Strassburg CP et al., 1999; Harbourt et al., 2012; Ohtsuki et al., 2012), the contribution of UGT1A7 to the hepatic metabolism of tropifexor was not investigated further. These data suggest that UGT1A1 and UGT1A3 likely contribute to the majority of the glucuronidation of tropifexor in HLM.
The relative contribution of UGT1A1 and UGT1A3 to total tropifexor glucuronidation in HLM was further assessed by determining the kinetics of individual rhUGT metabolism of tropifexor (formation of M22) and scaling the rhUGT CLint,u to HLM CLint,u using a relative expression factor (REF), defined as the ratio of the individual UGT abundance in the rhUGT microsomes relative to its expression in HLM. The CLint,u of individual UGT enzymes was calculated as the quotient of the effective Vmax/unbound Km obtained from the calculation based on the amount of UGT protein in the incubations (Table 7). The calculated REF values are shown in Table 8. The rhUGT CLint,u of tropifexor from incubations with individual UGT enzymes were then scaled to HLM CLint,u. The contribution of individual UGT enzymes to the overall HLM clearance (percentage of total glucuronidation activity) was then calculated. For the glucuronidation clearance of tropifexor, approximately 84% was estimated to be attributable to UGT1A1 and 16% to UGT1A3 (Table 8).
Kinetic parameters for tropifexor metabolism by rhUGT enzymes
Contribution of individual UGT enzymes to tropifexor clearance in HLM
Estimation of Fractional Metabolism by Cytochrome P450 and UGT in HH and Concentration Dependence
Two studies were conducted to assess the relative contributions of cytochrome P450 and UGT enzymes in HH: chemical inhibition of total cytochrome P450 or UGT CLint and measurement of individual tropifexor metabolites with time. In both cases, a range of tropifexor concentrations were evaluated. In the first study, the relative contribution of cytochrome P450 or UGT to the total tropifexor metabolism in the human liver was estimated based on the ability of ABT (a broad, nonspecific cytochrome P450 inhibitor) or borneol (with or without ATZ; UGT inhibitors) to inhibit the total metabolism of tropifexor in HH. Tropifexor intrinsic clearance values from HH in the presence of cytochrome P450 and UGT inhibitors were compared with the sum of intrinsic clearance values. The CLint of tropifexor, at 0.1 μM, in the presence of ABT or a mixture of (+)borneol and ATZ was calculated to be 0.148 or 0.0126 ml/h per million cells, respectively (Table 9). By applying the calculation and normalization methods as described earlier in the method section, the relative contributions of the cytochrome P450 and UGT enzymes to the total tropifexor metabolism were estimated to be 8% and 92%, respectively (Table 9). The data showed that tropifexor hepatic metabolic pathway is mainly through UGT in vitro at 0.1 μM of tropifexor concentration. However, at a concentration of 0.005 μM, the CLint of tropifexor in the presence of ABT or (−)borneol was calculated to be 0.0337 or 0.0658 ml/h per million cells, respectively (Table 9), with the relative contributions of cytochrome P450 and UGT enzymes to the total tropifexor metabolism estimated at approximately 66% and 34%, respectively.
Estimated fractional metabolism values of the tropifexor metabolism pathways in HH using cytochrome P450 or UGT inhibitors
Based upon in vitro metabolic profiles of tropifexor in HH, the contribution of glucuronidation versus oxidative metabolism appeared to vary quantitatively depending on the tropifexor concentration tested (Fig. 7; Supplemental Appendix; Supplemental Table 4). M22 was the predominant metabolite (∼20%–30% of the total radioactivity at 4 hours) observed at higher incubation concentrations. As the concentration decreased, the relative abundance of M22 reduced substantially, with a concurrent increase in the amounts of the O-dealkylation products. At a concentration of 0.1 µM, the amount of M22 (∼7.7% of total radioactivity) was similar to that of the O-dealkylation products M10.8 and M11.6 (∼7.5% of total radioactivity). At the lowest concentration tested (0.05 µM), the sum of all metabolites containing oxidative transformations (M6.7, M10.8, M11.6, and M18) accounted for ∼10.9% of radioactivity, exceeding the amount of M22 observed (∼7%).
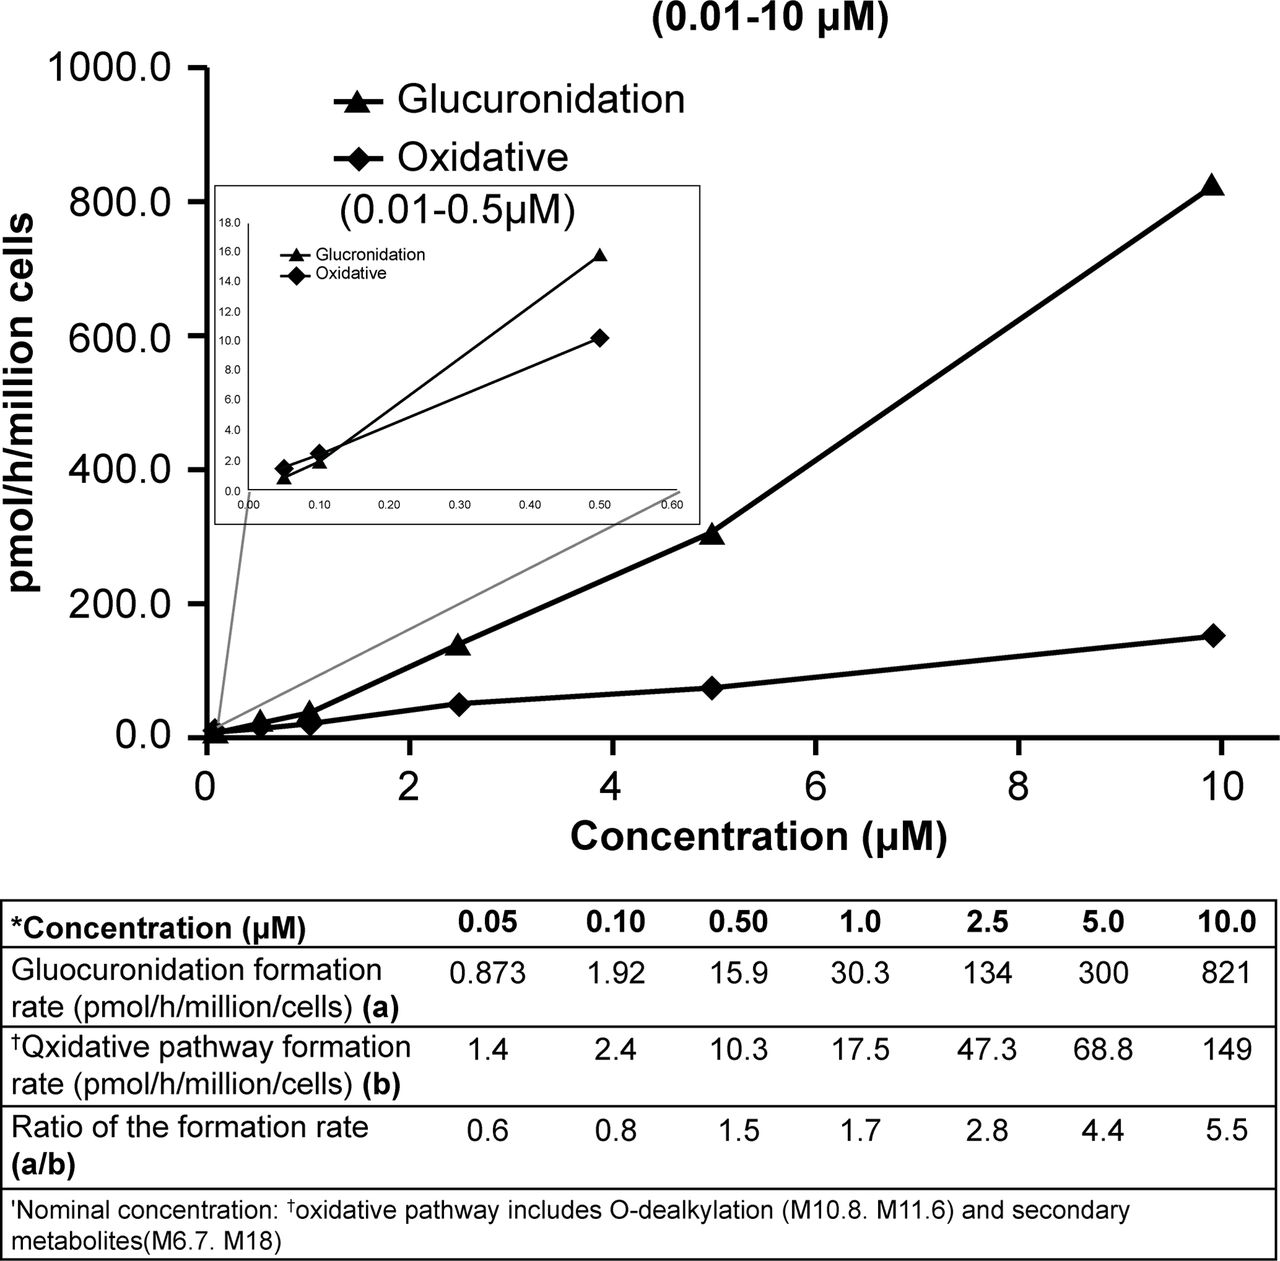
Rate of [14C]tropifexor glucuronidation and the oxidative pathway over concentration range.
Discussion
The current study was conducted to understand the overall disposition of tropifexor in healthy subjects. Additional in vitro experiments were performed to assess the relative contributions of the possible clearance mechanisms involved and to further evaluate the effects of drug concentration on tropifexor metabolism.
A moderate rate of absorption was achieved (with Cmax 33.5 ng/ml, Tmax 4 hours) after a single oral dose of 1 mg tropifexor. The elimination half-life (13.5 hours) and the overall extent of exposure (AUCinf of 553 h*ng/ml) were in general agreement with the observations from previous clinical studies (Badman et al., 2020) at a similar dose level.
Mass balance was achieved in all four subjects, as demonstrated by the mean total recovery of ∼94% (Fig. 3), indicating no retention of drug-related residue in humans. No intact tropifexor was observed in the urine from any of the subjects, indicating minimal contribution of renal clearance in tropifexor elimination. This is consistent with the findings in nonclinical species, in which no renal clearance of the intact tropifexor was observed. Tropifexor was predominantly eliminated via metabolism in humans, and metabolites of tropifexor were excreted in both feces and urine, with urinary excretion playing a minor role (∼28.5% in urine vs. ∼40% in feces).
Tropifexor was the most prominent drug-related component in plasma, accounting for ∼92% of the total radioactivity AUC0–72h. Only minor metabolites, including O-dealkylation metabolite M11.6 and the mono-oxidation metabolite M22.4, were found in circulation, contributing to 2%–5% of the total radioactivity AUC0–72h. The evaluation of metabolite exposures in human has important implications in drug development. The US Food and Drug Administration guidance on safety testing of drug metabolites (US Food and Drug Administration, 2020) defined the metabolites requiring further safety testing as those which form at greater than 10% of the total drug-related exposure at steady state. None of the circulating metabolites of tropifexor observed in our study met this criterion; thus, no further safety testing of nonclinical species is warranted. In addition, M11.6 was observed in rat plasma circulating at ∼38% of the total radioactivity AUC. M22.4, although not detected as a circulating metabolite in rats, was observed in dog feces (Supplemental Appendix; Supplemental Tables 5 and 6).
The major biotransformation processes involved in tropifexor metabolism in human appeared to be phase I oxidation, exemplified by metabolites containing at least one oxidative modification accounting for >68% of the radioactivity dose in human excreta. The direct glucuronidation metabolite, M22, was not observed at a quantifiable level in human AME study. Although an acyl glucuronide is prone to degradation back to the parent under alkaline conditions, a preliminary assessment of M22 stability in human plasma found M22 to be stable, with <5% hydrolyzed back to the parent by 5 hours during an incubation (Supplemental Appendix; Supplemental Table 9). Furthermore, no additional mass spectral peak corresponding to M22 molecular ion was observed during the course of incubation, suggesting the absence or low rate of intramolecular acyl migration under the incubation conditions (Supplemental Appendix; Supplemental Fig. 5). To stabilize acyl glucuronide in sample matrices, a portion of the human plasma and urine samples were also acidified with formic acid to pH ∼4 and processed and analyzed. No quantifiable M22 was observed in these acidified samples. The lack of M22 in human in vivo study was likely not due to metabolite instability in the sample matrices.
Initial in vitro investigations in HLM and HH indicated that glucuronidation was the main contributor to tropifexor metabolism, particularly at the higher tested concentrations of tropifexor. Based on these in vitro results prior to conducting the human AME study, efforts had been focused on identifying the major UGT isozymes responsible for M22 formation and on the drug-drug interaction potential of tropifexor with UGT inhibitors. Consequently, UGT1A1 and UGT1A3 had been identified as the major contributors to tropifexor glucuronidation.
The lack of any quantifiable direct acyl glucuronide metabolites in human in vivo experiments is not surprising given that the acyl glucuronides were likely eliminated via biliary excretion into the gut and subsequently hydrolyzed to the parent tropifexor by microflora. Evidence of biliary elimination of the glucuronide, M22, was apparent from rat absorption, distribution, metabolism and excretion (ADME) studies conducted in intact and bile duct–cannulated animals, where M22 was the major metabolite identified in the bile in bile duct–cannulated animals but was absent in intact animals (see Supplemental Appendix; Supplemental Tables 7 and 8). The labile nature of glucuronide metabolites is not only well documented in the literature (Pellock and Redinbo, 2017) but was also confirmed during an ex vivo assessment in rat and human feces in which M22 was found to convert back to tropifexor almost completely after 20 hours of incubation under anaerobic conditions (Supplemental Appendix; Supplemental Table 10). It is conceivable that M22 could have been formed in the liver, excreted in the bile, and passed back into the intestinal tract, where it was deconjugated by β-glucuronidase expressed in microflora to tropifexor and was then finally observed as intact tropifexor in feces. It has also been reported that the clearance of a compound in humans via oxidative pathways can be overestimated in the absence of bile collection when the compound undergoes direct glucuronidation and where the glucuronides are mainly eliminated via biliary excretion (Wang et al., 2006). In the case of tropifexor, the contribution of oxidative metabolism to the overall tropifexor clearance could have been overestimated in this study as a result of the lack of information of metabolites in the bile.
Nonetheless, the dominance of the oxidative metabolites in humans (∼68% of the dose) appeared to question the translatability of in vitro and nonclinical data. Because of its high potency, tropifexor was given at low doses (0.01–3 mg) in the first-in-human study (Badman et al., 2020), with corresponding exposures in the nanomolar range, which were much lower than the micromolar concentrations used in the initial in vitro studies. One possible explanation of this discrepancy in the in vitro and in vivo studies could be the concentration difference. Tropifexor metabolism at the concentration in which initial in vitro assessment was conducted may be qualitatively different than that at lower concentrations. To test the hypothesis, additional in vitro experiments covering a wide range of concentrations (0.05–10 µM) were conducted. The lower end of this concentration range in HH, 0.05 µM, was chosen to approximate the total Cmax observed in the clinic at the single dose of 1–3 mg (Cmax 22.1–54.2 ng/ml or 0.04–0.09 μM), assuming similar levels of protein binding in the in vitro assay as in vivo, and would likely provide a clinically relevant approximation of the relative contributions of the oxidative and glucuronidation pathways. The results in HH showed that the relative contributions of enzymes (oxidation vs. glucuronidation) to tropifexor metabolism indeed appeared to be concentration-dependent (Fig. 7). At higher incubation concentrations, direct glucuronidation was undoubtedly the predominant pathway involved. However, when tropifexor concentration was reduced to approach therapeutic exposure levels, although the rates of formation of both glucuronide and oxidative metabolites slowed, the rate of oxidation was higher than that of glucuronidation and became the more important process of the two. This switch of the relative dominance of the two pathways was only apparent when tropifexor concentration was reduced to ≤0.1 μM. This concentration dependence of tropifexor metabolism was further confirmed during the in vitro assessment of fractional contributions of cytochrome P450 and UGT to overall tropifexor metabolism in which tropifexor CLint was estimated in the presence and absence of broad specificity UGT or cytochrome P450 inhibitors. The relative contributions of UGT (fmUGT) and cytochrome P450 (fmCYP) to tropifexor metabolism at 1 µM were estimated to be 92% and 8%, respectively. This was similar to those observed in previous in vitro studies but shifted to 34% (fmUGT) and 66% (fmCYP) at 0.05 µM, in line with the predominance of oxidative metabolism observed in this human AME study at similar exposure levels. These in vitro data suggest that tropifexor would be more efficiently metabolized via oxidative pathways than by glucuronidation at clinically relevant concentrations, possibly as a result of the different affinities and capacities of the cytochrome P450 and UGT enzymes involved in the metabolism of tropifexor at different doses.
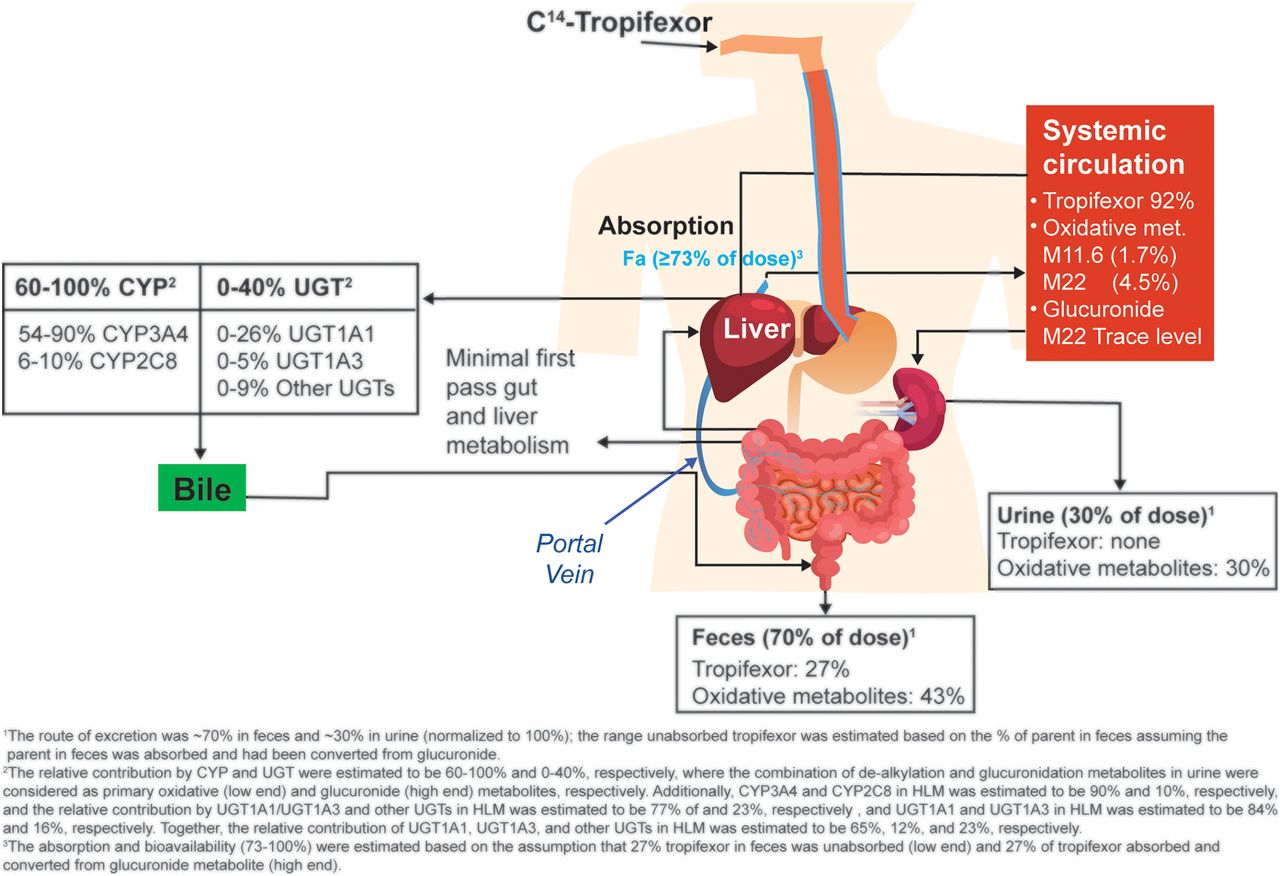
By combining in vitro and in vivo data from various investigations, we now have an understanding of the overall tropifexor disposition in humans (Fig. 8). Tropifexor was well absorbed, with the absorption estimated at ≥73% (normalized to 100% recovery). The major circulating component after an oral dose of tropifexor was the unchanged parent. No circulating metabolite was observed at >10% of the total AUC. Tropifexor was mainly cleared via metabolism. Phase I oxidation was the predominant tropifexor metabolism pathway, with O-dealkylation being the main oxidative process. Although direct glucuronidation was not observed in vivo, its contribution to tropifexor metabolism cannot be ruled out because the glucuronide metabolite was likely to be eliminated via biliary excretion and converted back to tropifexor in the gastrointestinal tract. The relative contribution of oxidation was estimated to be 60%–100%, and that of glucuronidation was potentially up to 40%. Tropifexor oxidation was catalyzed mainly by CYP3A4 and CYP2C8 (85%–95% and 5%–15% relative contribution, respectively), and glucuronidation was catalyzed mainly by UGT1A1 (84%) followed by UGT1A3 (16%). Consequently, there is a potential for tropifexor to undergo drug-drug interaction with comedications that are inhibitors or inducers of UGT1A1 and CYP3A. The in vitro metabolism of tropifexor appeared to be concentration-dependent, with glucuronidation as the predominant pathway at higher concentrations and the oxidative process becoming more important at lower concentrations near clinical exposure range.

Disposition of tropifexor in humans. Fa, fraction absorbed; met, metabolites.
In conclusion, this study demonstrated the importance of carefully designed in vivo and in vitro experiments for better understanding of disposition processes during drug development. The interplay among the different metabolic pathways in the human body can be complex and variable depending on an array of internal and external factors, with concentration being one of the external factors that can be controlled. Therefore, while dealing with compounds of extreme high potency and low doses, as is the case with tropifexor, relevant therapeutic exposure levels must be taken into consideration in the design of in vitro experiments to enable a more accurate assessment reflecting clinically relevant conditions.
Acknowledgments
The authors would like to thank Alexandra Vargas, Dr. Elina Siirola, and Fabian Eggimann for assessing the stability of tropifexor and its glucuronide metabolite M22 in feces and their support for the in vitro production of metabolite standards and Dr. Tapan Ray for his analytical guidance on the chemical synthesis of radiolabeled tropifexor for clinical use. The authors thank Twarita Chakraborty and Aparajita Mandal, Novartis Healthcare Pvt. Ltd., for medical writing support and editorial assistance. The authors also acknowledge the clinical research unit of Covance for conducting the in-life part of the clinical study as well as its DMPK laboratory for radioactivity analysis of clinical samples.
Authorship Contributions
Participated in research design: Wang-Lakshman, Miao, H. Gu, J. Gu, McNamara, Camenisch, Einolf, Chen.
Conducted experiments: Wang-Lakshman, Miao, Wang, H. Gu.
Performed data analysis: Wang-Lakshman, Miao, Wang, H. Gu, Kagan, Camenisch, Einolf, Chen.
Wrote or contributed to the writing of the manuscript: Wang-Lakshman, H. Gu, Kagan, Walles, Woessner, Camenisch, Einolf, Chen.
Footnotes
- Received December 29, 2020.
- Accepted April 6, 2021.
Novartis Institute of BioMedical Research funded this work.
All the authors, except Z.M. and L.W., are employees of Novartis. Z.M. and L.W. were employed by Novartis during the time when the study was conducted.
↵
 This article has supplemental material available at dmd.aspetjournals.org..

Abbreviations
- AME
- absorption, metabolism, and excretion
- AUCinf
- area under the plasma concentration-time curve from time 0 to infinity
- AUClast
- area under the plasma concentration-time curve from time 0 to time of last measurable concentration
- BA
- bile acid
- CLint
- intrinsic clearance
- CLint,u
- unbound intrinsic clearance
- CL/F
- apparent oral clearance
- FGF
- fibroblast growth factor
- fm
- fraction metabolized
- FXR
- farnesoid X receptor
- HH
- human hepatocyte
- HLM
- human liver microsome
- KHB
- Krebs-Henseleit Buffer
- Km
- Michaelis Menten constant
- LC-MS/MS
- liquid chromatography with tandem mass spectrometry
- LSC
- liquid scintillation counting
- MS
- mass spectrometry
- MS/MS
- tandem mass spectrometry
- NASH
- nonalcoholic steatohepatitis
- OCA
- obeticholic acid
- PK
- pharmacokinetic
- REF
- relative expression factor
- rhCYP
- recombinant human cytochrome P450
- rhUGT
- recombinant human UGT
- SHP
- small heterodimer partner
- t1/2
- half-life
- Tmax
- time to reach Cmax
- UGT
- UDP-glucuronosyltransferase
- UPLC
- ultraperformance liquid chromatography
- Vmax
- maximum velocity
- Vz/F
- apparent volume of distribution during terminal phase after oral administration
- Copyright © 2021 by The American Society for Pharmacology and Experimental Therapeutics


