


Abstract
For drug development, species differences in drug-metabolism reactions present obstacles for predicting pharmacokinetics in humans. We characterized the species differences in hydrolases among humans and mice, rats, dogs, and cynomolgus monkeys. In this study, to expand the series of such studies, we attempted to characterize marmoset hydrolases. We measured hydrolase activities for 24 compounds using marmoset liver and intestinal microsomes, as well as recombinant marmoset carboxylesterase (CES) 1, CES2, and arylacetamide deacetylase (AADAC). The contributions of CES1, CES2, and AADAC to hydrolysis in marmoset liver microsomes were estimated by correcting the activities by using the ratios of hydrolase protein levels in the liver microsomes and those in recombinant systems. For six out of eight human CES1 substrates, the activities in marmoset liver microsomes were lower than those in human liver microsomes. For two human CES2 substrates and three out of seven human AADAC substrates, the activities in marmoset liver microsomes were higher than those in human liver microsomes. Notably, among the three rifamycins, only rifabutin was hydrolyzed by marmoset tissue microsomes and recombinant AADAC. The activities for all substrates in marmoset intestinal microsomes tended to be lower than those in liver microsomes, which suggests that the first-pass effects of the CES and AADAC substrates are due to hepatic hydrolysis. In most cases, the sums of the values of the contributions of CES1, CES2, and AADAC were below 100%, which indicated the involvement of other hydrolases in marmosets. In conclusion, we clarified the substrate preferences of hydrolases in marmosets.
SIGNIFICANCE STATEMENT This study confirmed that there are large differences in hydrolase activities between humans and marmosets by characterizing marmoset hydrolase activities for compounds that are substrates of human CES1, CES2, or arylacetamide deacetylase. The data obtained in this study may be useful for considering whether marmosets are appropriate for examining the pharmacokinetics and efficacies of new chemical entities in preclinical studies.
Introduction
Drug-metabolizing enzymes are involved in the detoxification of drugs, activation of prodrugs, and sometimes the production of reactive metabolites that cause toxicity. Among the drug-metabolizing enzymes, cytochrome P450 enzymes (P450s) are responsible for the metabolism of approximately 50% of clinical drugs (Cerny, 2016). The accumulated studies of P450s have helped to predict drug-drug interactions and interindividual variations in drug efficacy. Drug-metabolizing enzymes other than P450s (non-P450s) participate in approximately 25% of drug-metabolism reactions (Cerny, 2016). Among the non-P450 enzymes, hydrolases that catalyze the hydrolysis reactions of compounds containing esters, amides, or thioesters contribute to the metabolism of 10.8% of clinical drugs and 86.4% of prodrugs (Cerny, 2016). In human tissues, carboxylesterase (CES) 1, CES2, and arylacetamide deacetylase (AADAC) are the main enzymes that catalyze the hydrolysis of various drugs (Fukami and Yokoi, 2012). CES1, CES2, and AADAC are expressed in the liver, and CES2 and AADAC are also expressed in the gastrointestinal tract at comparable or higher levels than in the liver (Watanabe et al., 2009). In humans, CES1 prefers compounds that contain a large acyl group, CES2 prefers compounds that contain a moderate acyl group (Imai et al., 2006), and AADAC prefers compounds that contain a small acyl group (Fukami et al., 2015).
Since there are species differences in tissue distributions, numbers of isoforms, and substrate preferences of drug-metabolizing enzymes, it is not easy to extrapolate animal data to humans. To provide an improved understanding of species differences in drug hydrolases, our laboratory has characterized the hydrolase activities of various compounds in mice (Kisui et al., 2020), rats (Kisui et al., 2020), dogs (Yoshida et al., 2018), and cynomolgus monkeys (Honda et al., 2021). Notable examples of species differences are as follows: 1) In rats, Ces2a, one of multiple Ces2 isoforms, can hydrolyze diltiazem, whereas human CES2 cannot (Kurokawa et al., 2015). 2) In dogs, the CES2 protein is not functional as a result of its instability (Yoshida et al., 2018), although CES2 mRNA is substantially expressed in the liver (Taketani et al., 2007). 3) In cynomolgus monkeys, CES1A, an abundant CES1 isoform in the liver, cannot hydrolyze some human CES1 substrates, including imidapril and temocapril, even though cynomolgus monkey liver microsomes can hydrolyze them (Honda et al., 2021). 4) Rifamycins, which are substrates of human AADAC, were not hydrolyzed in the above experimental animals (Yoshida et al., 2018; Kisui et al., 2020; Honda et al., 2021).
Common marmosets (Callithrix jacchus) have attracted attention as an alternative primate model in biomedical research because of their reproductive traits and relatively small body sizes (Sasaki et al., 2009). Three CES1 isoforms, four CES2 isoforms, and a single AADAC isoform in marmosets are registered in the National Center for Biotechnology Information database (https://www.ncbi.nlm.nih.gov/). These CES1 and CES2 isoforms are produced by alternative splicing from single genes. Compared with CES1 isoform 1, CES1 isoform 2 lacks the 18th amino acid residue, alanine, which is encoded by 5′-terminal sequences in exon 2, and the CES1 isoform 3 lacks 13 amino acids that are encoded in exon 8. The amino acid homologies between marmoset CES1 isoforms 1 or 2 and human CES1 are 88%. Compared with CES2 isoform 1, CES2 isoforms 2 and 3 lack 49 and 55 amino acids at the C terminus, respectively, which suggests a lack of KDEL-like sequences, which are critical for retention to the endoplasmic reticulum (ER) membrane (Robbi and Beaufay, 1991). CES2 isoform 4 lacks 106 amino acids at the N terminus, which suggests a lack of signal peptide to be retained in the ER. Thus, CES2 isoforms 2, 3, and 4 may not be localized in the ER. The amino acid homology between marmoset CES2 isoform 1, with one fewer amino acid than human CES2, and human CES2 is 86%. For AADAC, the amino acid homology between marmosets and humans is 89%. In marmoset CES1, CES2, and AADAC, the critical amino acids that form catalytic triads and oxyanion holes (Hosokawa, 2008) are conserved.
Characterization of the species differences in hydrolase activities between marmosets and humans would be helpful for extrapolating marmoset pharmacokinetics data to humans. In this study, the hydrolase activities of 24 compounds in marmosets were compared with those in humans.
Materials and Methods
Chemicals and Reagents.
Marmoset liver microsomes [pooled, n = 14 (male) or n = 4 (female)], human liver microsomes (pooled, n = 50), and human intestinal microsomes (pooled, n = 7) were purchased from Corning (Corning, NY). Male marmoset intestinal microsomes (n = 1) were previously prepared (Uehara et al., 2019). The substrates for hydrolases and their metabolites were the same as those described in our previous report (Kisui et al., 2020). The primers were commercially synthesized at Integrated DNA Technologies (Coralville, IA). Other chemicals used were of the highest commercially available grade.
cDNA Cloning.
Reverse transcription was performed using SuperScript III RT reverse transcriptase (Thermo Fisher Scientific, Carlsbad, CA), oligo(dT) primers, and marmoset liver total RNA. Polymerase chain reactions (PCR) were carried out using KOD-Plus-Neo DNA polymerase (Toyobo, Osaka, Japan) and the primers [Callithrix jacchus CES1(5rt1) 5′-TGAGTTGCACGGAGACCTC-3′ and Callithrix jacchus CES1(3rt1) 5′-CCCAGCCACAATAAGATGCC-3′; Callithrix jacchus CES2(5rt2) 5′-TCTGTATGGGGAGGTAATGCA-3′ and Callithrix jacchus CES2(3rt2) 5′-CCTCAGTGGGTGTATGTGGA-3′; Callithrix jacchus AADAC(5rt1) 5′- TGTTTCTGAAGACCAAGAAGCA-3′ and Callithrix jacchus AADAC(3rt1) 5′- AACGAGACCAATTTCTGATGC-3′] under the following conditions: predenaturation at 94°C for 2 minutes, 25 cycles of denaturation at 98°C for 10 seconds, annealing at 60°C for 30 seconds, and extension at 68°C for 3 minutes. The PCR products were separated on 1.0% agarose gel. A fragment with approximately 1800 bp was purified and cloned into pGEM-T Easy vectors (Promega, Madison, WI).
Construction of Recombinant Marmoset CES1, CES2, and AADAC.
Recombinant marmoset CES1 that was expressed in African green monkey kidney-derived COS-7 cells was constructed as follows. By using the pGEM-T Easy plasmid containing marmoset CES1 cDNA that was isolated from livers as a template, CES1 cDNA was amplified by PCR using the primers [sense 5′-GAAGCGCGCGGAATTATGTGGCTCTGTGCTCTTG-3′ and antisense 5′-TAGTGAGCTCGTCGATCACAGCTCAATGTGTTCTG-3′], and the PCR products were subcloned into the pTargeT Mammalian Expression vector (Promega, Madison, WI). Transfection of the pTargeT plasmid containing marmoset CES1 cDNA into COS-7 cells was performed according to a previously reported method (Watanabe et al., 2009). It was confirmed that the nucleotide sequence was identical to the reference sequence of marmoset CES1 isoform 2 (accession number XM_035281689.1) by DNA sequence analysis (FASMAC, Kanagawa, Japan).
Recombinant marmoset CES2 and AADAC were constructed by using the Bac-to-Bac Baculovirus Expression System (Invitrogen) according to the manufacturer’s protocol. Marmoset CES2 or AADAC cDNA was amplified from the pGEM-T Easy plasmid containing marmoset CES2 or AADAC cDNA (isolated from livers) by PCR using the primers [CES2: sense 5′-GAAGCGCGCGGAATTATGCCAAAGGGGCCCTC-3′ and antisense 5′-TAGTGAGCTCGTCGACTACAGCTCTGTGTGTCTC-3′; AADAC: sense 5′-GAAGCGCGCGGAATTATTGGAAGAAAATCGCTGTA-3′ and antisense 5′-TAGTGAGCTCGTCGACTAAAGATTTTCCTTTAGCCA-3′] and was transferred into the pFastBac1 vector using an In-Fusion HD Cloning Kit (Takara, Shiga, Japan). The nucleotide sequences obtained were identical to the reference sequences (e.g., accession numbers XM_035282769.1 and XM_002759483.5 for marmoset CES2 isoform 1 and AADAC, respectively). The pFastBac1 vector containing marmoset CES2 or AADAC cDNA was transformed into DH10Bac competent cells, and the subsequent steps were conducted referring to previously described methods (Kurokawa et al., 2016). Protein concentrations were measured using Coomassie Brilliant Blue Solution for Protein Assay with γ-globulin as a standard (Nacalai Tesque, Kyoto, Japan). The marmoset CES1, CES2, and AADAC cDNA sequences were submitted to GenBank under accession numbers MW922531, MW922532, and MF457781, respectively.
Immunoblot Analysis of CES1, CES2, and AADAC Proteins.
Immunoblot analyses were performed according to previously reported methods (Honda et al., 2021). In this study, human liver microsomes, marmoset liver microsomes, and recombinant marmoset hydrolases (CES1: 1 µg, CES2 and AADAC: 20 µg) were separated on polyacrylamide gels (CES1 and CES2: 7.5%, AADAC: 10%). An Odyssey infrared imaging system (LI-COR Biosciences, Lincoln, NE) was used for quantifying the band intensities. The samples were deglycosylated by Endo H by following a previously reported method (Muta et al., 2014) and were also subjected to SDS-PAGE and immunoblot analysis.
Measurements of Hydrolase Activities for 24 Compounds.
The hydrolase activities for 24 compounds were measured using liquid chromatography–tandem mass spectrometry or high-performance liquid chromatography according to previously reported methods (Table 1). The assay conditions for some compounds were partially modified as follows: the incubation time in the assay for ketoconazole hydrolysis was set to 45 minutes. The protein concentrations in the assays for hydrolysis reactions of prasugrel, clofibrate, fluorescein diacetate, and ketoconazole were set to 0.002, 0.01, 0.001, and 0.05 mg/ml, respectively. If activity was detected in the homogenates from mock COS-7 (for CES1) or Sf21 cells (for CES2 and AADAC), the values were subtracted from the activity of recombinant hydrolases.
Substrates used in this study
Contribution of CES1, CES2, or AADAC to the Hydrolysis Reactions in Marmoset Liver Microsomes.
The contribution of CES1, CES2, or AADAC to the hydrolysis of the compounds in the marmoset liver microsomes was calculated according to previously reported methods by considering the expression levels in liver microsomes and expression systems (Honda et al., 2021).
Statistical Analysis.
Statistical significance between multiple groups was determined by one-way ANOVA followed by Tukey’s test with Instat 2.00 from GraphPad Instat (San Diego, CA). A value of P < 0.05 was considered to be statistically significant.
Results
Preparation of Recombinant Marmoset CES1, CES2, and AADAC.
To investigate the catalytic potencies of marmoset CES1, CES2, and AADAC, expression systems for these hydrolases were constructed. Similar to the case of cynomolgus monkey hydrolases (Honda et al., 2021), we constructed baculovirus expression systems. However, since the marmoset CES1 expression levels were too low to measure hydrolase activities (data not shown), a recombinant marmoset CES1 that is expressed in COS-7 cells was alternatively constructed and used for subsequent studies. To confirm the protein expressions, immunoblot analyses were performed within a linear range of band intensities (Fig. 1, A–C). By using anti-CES1 or CES2 antibodies, a clear band was observed in both the expression system and marmoset liver microsomes with the same mobility (Fig. 1, A and B). By using an anti-human AADAC antibody, a single band was observed in marmoset liver microsomes, whereas three bands were observed in the expression system (Fig. 1C). Marmoset AADAC was predicted to have two N-glycosylation sites (asparagine residues at 78 and 282) by NetNGlyc 1.0 Server (http://www.cbs.dtu.dk/services/NetNGlyc/). Deglycosylation by Endo H resulted in the bands shifting to higher mobility (Fig. 1D), which suggested that the bands with higher mobility corresponded to non- or partially glycosylated AADAC. Glycosylation is critical for AADAC function in humans (Muta et al., 2014); therefore, only the density of the upper band was used to calculate the expression ratios with liver microsomes. The expression ratios of CES1, CES2, and AADAC in marmoset liver microsomes to those in the expression systems were 1.56, 2.10, and 2.00, respectively. These values were used to calculate the contribution of each hydrolase to the hydrolysis reactions in subsequent sections.
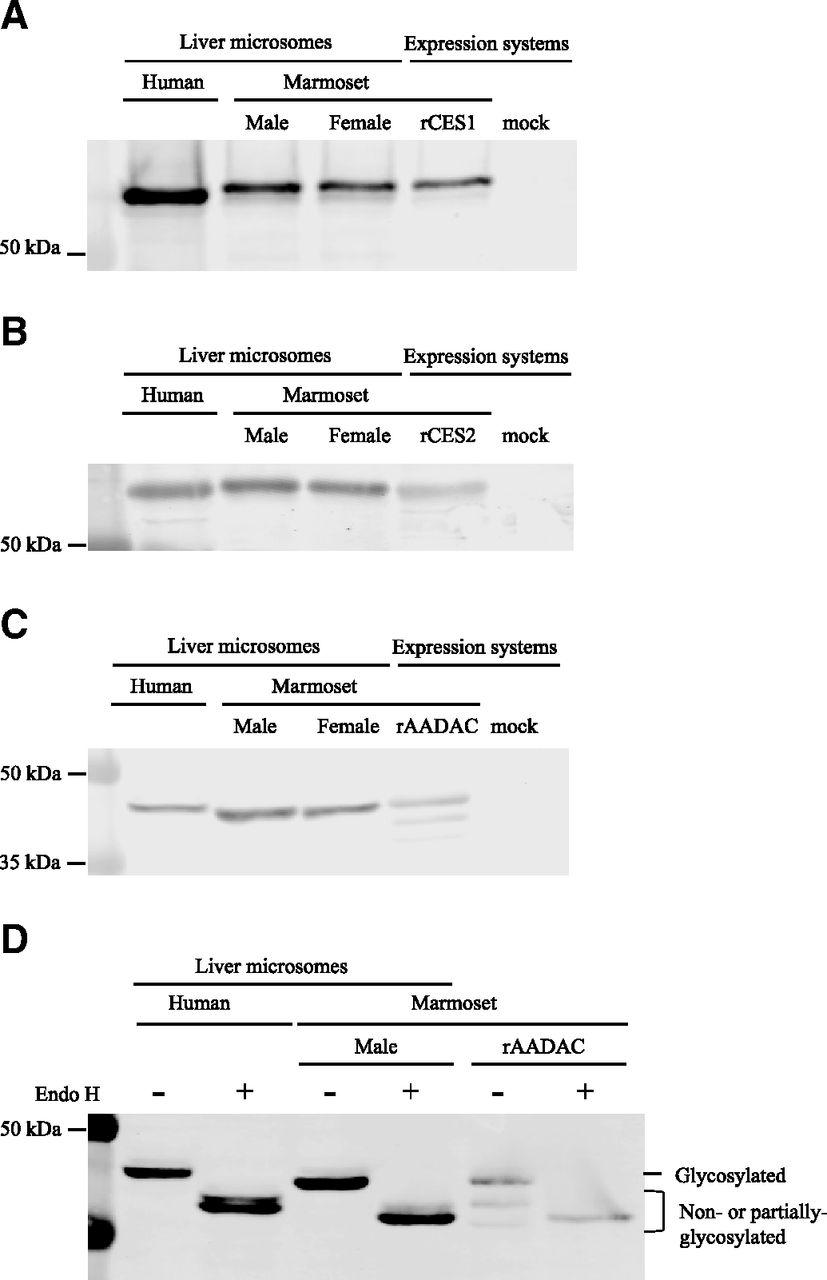
Immunoblot analyses for (A) CES1, (B) CES2, and (C) AADAC. (A) Human and marmoset liver microsomes and homogenates of COS-7 cells expressing marmoset CES1 and mock (1 µg) were subjected to 7.5% SDS-polyacrylamide gel electrophoresis. rCES1: recombinant CES1. (B) Human and marmoset liver microsomes and homogenates of Sf21 cells expressing marmoset CES2 and mock (20 µg) were subjected to 7.5% SDS-polyacrylamide gel electrophoresis. rCES2: recombinant CES2. (C) Human (30 µg) and marmoset liver microsomes (20 µg) and homogenates of Sf21 cells expressing marmoset AADAC and mock (5 µg) were subjected to 10% SDS-polyacrylamide gel electrophoresis. rAADAC: recombinant AADAC. (D) The effects of deglycosylation on the AADAC mobility were determined with Endo H.
Hydrolase Activities for Compounds Hydrolyzed by All Human CES1, CES2, and AADAC by Marmoset Tissue Microsomes and Expression Systems.
For PNPA, prasugrel, and propanil, the hydrolase activities were measured using marmoset liver and intestinal microsomes and expression systems of marmoset hydrolases (Fig. 2). For PNPA, marmoset liver microsomes showed significantly higher activity (male and female: 3.60 ± 0.14 and 3.01 ± 0.09 µmol/min per milligram, respectively) compared with human liver microsomes (1.17 ± 0.03 µmol/min per milligram), and males showed significantly higher activity than females (Fig. 2A). In humans, intestinal microsomes showed significantly higher activity (1.61 ± 0.05 µmol/min per milligram ) than liver microsomes, whereas in marmosets, intestinal microsomes showed significantly lower activity (1.33 ± 0.08 µmol/min per milligram ) than liver microsomes. All recombinant marmoset hydrolases showed PNPA hydrolase activity, and the CES1, CES2, and AADAC contributions in marmoset liver microsomes were 9.5%, 9.9%, and 35.0%, respectively (Fig. 2A).
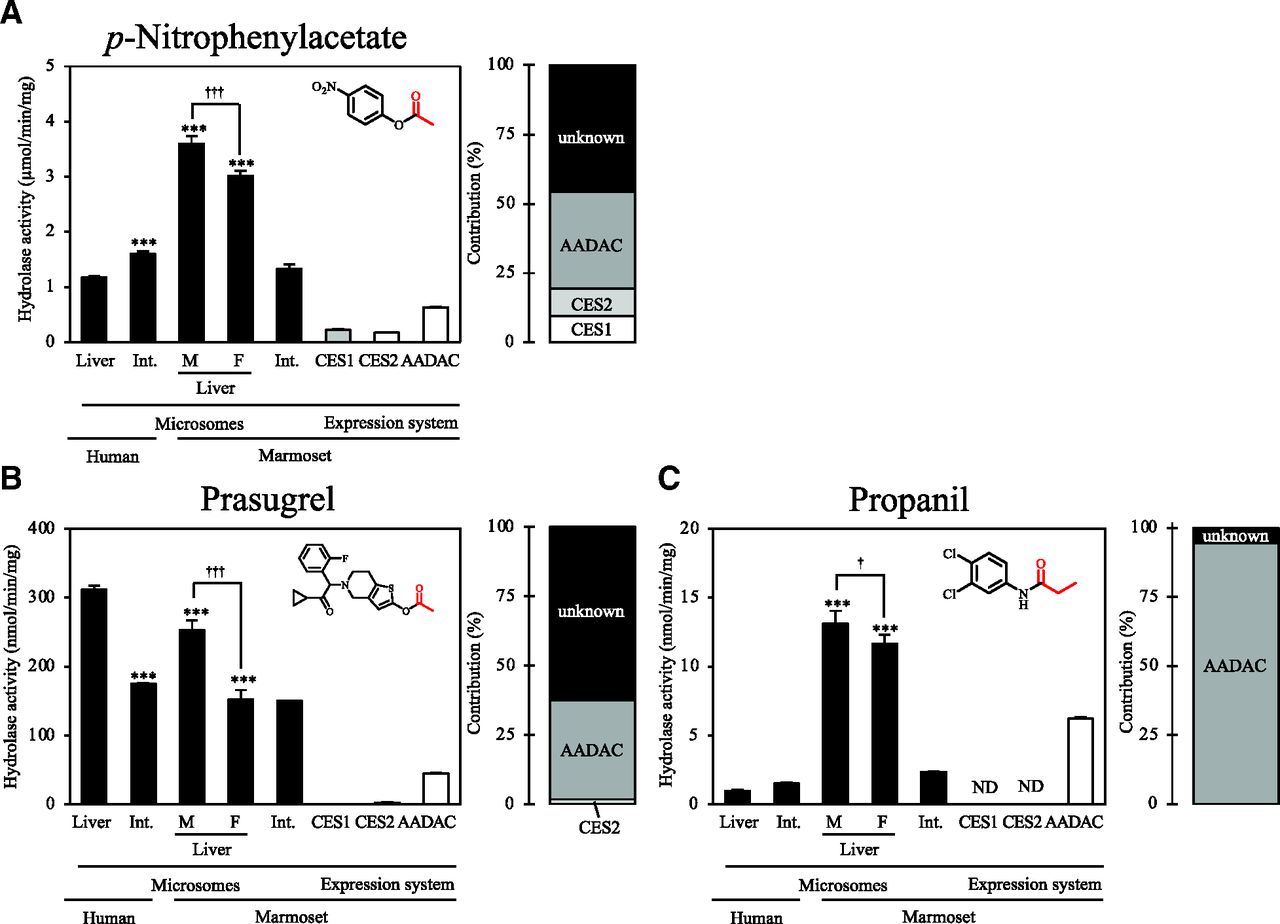
Hydrolase activities for compounds hydrolyzed by all human CES1, CES2, and AADAC by marmoset liver and intestinal microsomes and expression systems. The investigated compounds are (A) p-nitrophenyl acetate, (B) prasugrel, and (C) propanil. Each column shows the mean ± S.D. of three independent experiments. *P < 0.05 and ***P < 0.001, compared with human liver microsomes. †P < 0.05 and †††P < 0.001. Int., Intestine; F, female; M, male; ND, not detected.
For prasugrel, marmoset liver microsomes showed significantly lower activity (male: 252.5 ± 14.9 nmol/min per milligram, female: 152.0 ± 13.8 nmol/min per milligram) compared with human liver microsomes (311.9 ± 5.7 nmol/min per milligram) (Fig. 2B). In both humans and marmosets, intestinal microsomes showed significantly lower activities (174.7 ± 1.2 nmol/min per milligram and 150.1 ± 0.03 nmol/min per milligram, respectively) than liver microsomes, although marmoset female liver microsomes showed activity that was close to that of marmoset intestinal microsomes. Recombinant CES2 and AADAC showed prasugrel hydrolase activities, and their contributions in marmoset liver microsomes were 1.8% and 35.7%, respectively.
For propanil, marmoset liver microsomes showed significantly higher activity (male and female: 13.14 ± 0.90 and 11.65 ± 0.64 nmol/min per milligram, respectively) compared with human liver microsomes (0.97 ± 0.09 nmol/min per milligram) (Fig. 2C). In humans, intestinal microsomes showed activity that was close (1.53 ± 0.04 nmol/min per milligram) to that of liver microsomes, whereas in marmosets, intestinal microsomes showed significantly lower activity (2.34 ± 0.03 nmol/min per milligram) than liver microsomes. Among the recombinant hydrolases, only AADAC showed any activity, and its contribution in marmoset liver microsomes was 94.5%.
Hydrolase Activities for Compounds Specifically Hydrolyzed by Human CES1 by Marmoset Tissue Microsomes and Expression Systems.
For clofibrate, oseltamivir, fenofibrate, mycophenolate mofetil, temocapril, imidapril, clopidogrel, and lidocaine, the hydrolase activities were measured using marmoset liver and intestinal microsomes and expression systems of marmoset hydrolases (Fig. 3). For clofibrate, oseltamivir, fenofibrate, temocapril, mycophenolate mofetil, and imidapril, marmoset liver microsomes showed significantly lower activities than human liver microsomes, and males showed higher activities than females except for temocapril (Fig. 3, A–F). For clopidogrel and lidocaine, marmoset liver microsomes showed significantly higher activities than human liver microsomes. Although these hydrolase activities were barely detected in human intestinal microsomes, marmoset intestinal microsomes showed substantial hydrolase activities for these compounds. Among the recombinant hydrolases, only CES1 showed activities for all compounds except for imidapril. The contribution percentages of CES1 to hydrolase activities for clofibrate, oseltamivir, and lidocaine in marmoset liver microsomes were 85.2%–141.2%, and those for fenofibrate, temocapril, mycophenolate mofetil, and clopidogrel were 5.5%–38.1%. Recombinant AADAC showed activity for fenofibrate hydrolysis, and its contribution was 7.4%.

Hydrolase activities for compounds specifically hydrolyzed by human CES1 by marmoset liver and intestinal microsomes and expression systems. The investigated compounds are (A) clofibrate, (B) oseltamivir, (C) fenofibrate, (D) temocapril, (E) mycophenolate mofetil, (F) imidapril, (G) clopidogrel, and (H) lidocaine. Each column shows the mean ± S.D. of three independent experiments. ***P < 0.001, compared with human liver microsomes. †P < 0.05 and †††P < 0.001. Int., Intestine; F, female; M, male; ND, not detected.
Hydrolase Activities for Compounds Hydrolyzed by Both Human CES1 and CES2 by Marmoset Tissue Microsomes and Expression Systems.
For oxybutynin and prilocaine, the hydrolase activities were measured using marmoset liver and intestinal microsomes and expression systems of marmoset hydrolases (Fig. 4). For oxybutynin, hydrolase activities were barely detected in marmoset liver and intestinal microsomes and recombinant hydrolases (Fig. 4A). For prilocaine, marmoset liver microsomes showed significantly higher activities (male and female: 2.00 ± 0.08 and 1.11 ± 0.02 nmol/min per milligram, respectively) compared with human liver microsomes (0.62 ± 0.003 nmol/min per milligram) (Fig. 4B). In humans, intestinal microsomes showed activities (0.5 ± 0.01 nmol/min per milligram) that were close to those of liver microsomes, whereas in marmosets, intestinal microsomes showed significantly lower activity (0.2 ± 0.003 nmol/min per milligram) than liver microsomes. Recombinant marmoset CES1 and CES2 showed activities for prilocaine hydrolysis, and their contributions in marmoset liver microsomes were 15.6% and 22.1%, respectively.
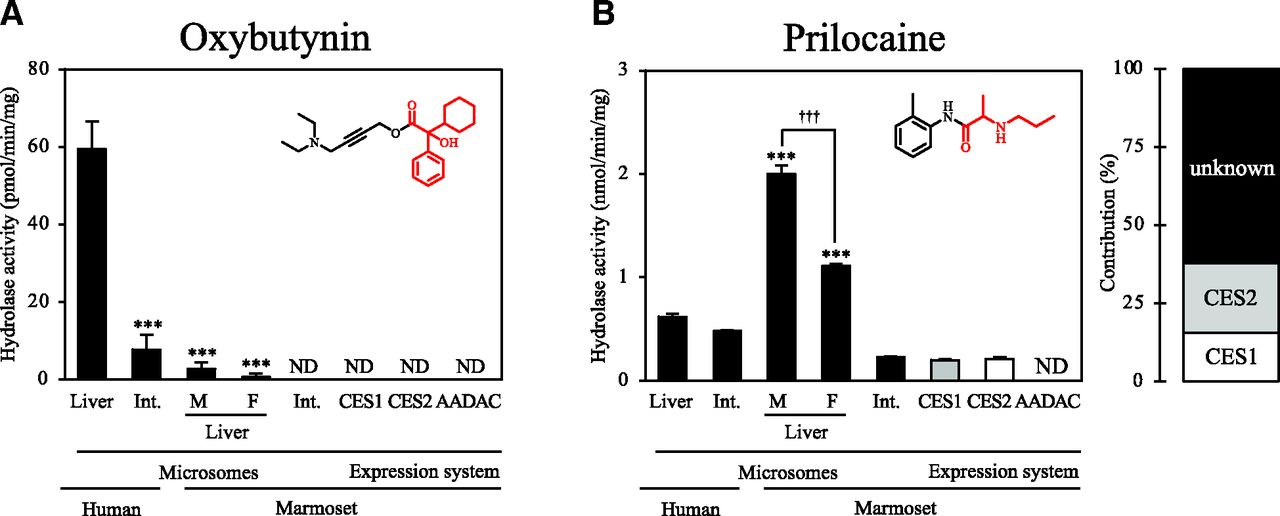
Hydrolase activities for compounds hydrolyzed by both human CES1 and CES2 by marmoset liver and intestinal microsomes and expression systems. The investigated compounds are (A) oxybutynin and (B) prilocaine. Each column shows the mean ± S.D. of three independent experiments. ***P < 0.001, compared with human liver microsomes. †††P < 0.001. Int., Intestine; F, female; M, male; ND, not detected.
Hydrolase Activities for Compounds Specifically Hydrolyzed by Human CES2 by Marmoset Tissue Microsomes and Expression Systems.
For irinotecan and procaine, the hydrolase activities were measured using marmoset liver and intestinal microsomes and expression systems of marmoset hydrolases (Fig. 5). For both compounds, marmoset liver microsomes showed significantly higher activities than human liver microsomes. In humans, intestinal microsomes showed significantly higher activities than liver microsomes, whereas in marmosets, intestinal microsomes showed significantly lower activities than liver microsomes. Recombinant CES2 showed hydrolase activities for irinotecan and procaine, and its contribution to marmoset liver microsomes was at most 15%.

Hydrolase activities for compounds specifically hydrolyzed by human CES2 by marmoset liver and intestinal microsomes and expression systems. The investigated compounds are (A) irinotecan and (B) procaine. Each column shows the mean ± S.D. of three independent experiments. ***P < 0.001, compared with human liver microsomes. ††P < 0.01 and †††P < 0.001. Int., Intestine; F, female; M, male; ND, not detected.
Hydrolase Activities for Compounds Hydrolyzed by Both Human CES2 and AADAC by Marmoset Tissue Microsomes and Expression Systems.
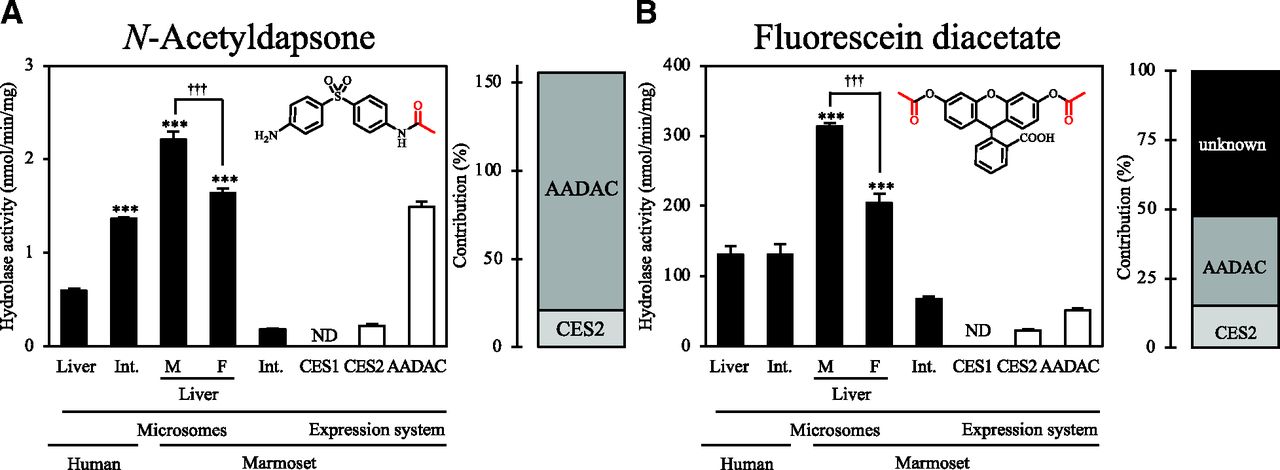
For N-acetyldapsone and fluorescein diacetate, the hydrolase activities were measured using marmoset liver and intestinal microsomes and expression systems of marmoset hydrolases (Fig. 6). For both compounds, marmoset liver microsomes showed significantly higher activities than human liver microsomes. In humans, for N-acetyldapsone, intestinal microsomes showed significantly higher activities (1.37 ± 0.02 nmol/min per milligram) than liver microsomes, whereas in marmosets, intestinal microsomes showed significantly lower activities (0.18 ± 0.11 nmol/min per milligram) than liver microsomes. For fluorescein diacetate, human intestinal microsomes showed activity (130.6 ± 15.3 nmol/min per milligram) that was close to that of human liver microsomes, whereas marmoset intestinal microsomes showed significantly lower activity (67.11 ± 3.78 nmol/min per milligram) than marmoset liver microsomes. Recombinant CES2 and AADAC showed N-acetyldapsone hydrolase activities, and their contributions were 20.9% and 134.8%, respectively. For fluorescein diacetate hydrolysis, the sum of the contributions of CES2 and AADAC in marmoset liver microsomes was 47.6%, which suggested involvement of other enzymes.

Hydrolase activities for compounds hydrolyzed by both human CES2 and AADAC by marmoset liver and intestinal microsomes and expression systems. The investigated compounds are (A) N-acetyldapsone and (B) fluorescein diacetate. Each column shows the mean ± S.D. of three independent experiments. ***P < 0.001, compared with human liver microsomes. †††P < 0.001. Int., Intestine; F, female; M, male; ND, not detected.
Hydrolase Activities for Compounds Specifically Hydrolyzed by Human AADAC by Marmoset Tissue Microsomes and Expression Systems.
For flutamide, phenacetin, ketoconazole, indiplon, rifabutin, rifampicin, and rifapentine, the hydrolase activities were measured using marmoset liver and intestinal microsomes and expression systems of marmoset hydrolase (Fig. 7). For flutamide and phenacetin, marmoset liver microsomes showed significantly higher activities than human liver microsomes (Fig. 7, A and B). In humans, intestinal microsomes showed activities that were close to those of liver microsomes, whereas in marmosets, liver microsomes showed significantly higher activities than intestinal microsomes. Recombinant AADAC showed flutamide and phenacetin hydrolase activities, and its contribution was approximately 100%. For ketoconazole, marmoset liver microsomes showed significantly higher activity (male and female: 300.3 ± 53.3 and 270.8 ± 38.5 pmol/min per milligram, respectively) compared with human liver microsomes (8.9 ± 1.27 pmol/min per milligram) (Fig. 7C). In humans, intestinal microsomes showed activity (25.3 ± 0.7 pmol/min per milligram) that was close to that of liver microsomes, whereas in marmosets, intestinal microsomes showed significantly lower activity (34.5 ± 1.4 pmol/min per milligram) than liver microsomes. Recombinant AADAC showed ketoconazole hydrolase activity, and its contribution to marmoset liver microsomes was 20.0%. For indiplon, marmoset liver microsomes showed significantly lower activity (male and female: 145.0 ± 1.2 and 122.0 ± 3.0 pmol/min per milligram, respectively) compared with human liver microsomes (226.0 ± 0.5 pmol/min per milligram) (Fig. 7D). In both humans and marmosets, intestinal microsomes showed significantly lower activities (141.7 ± 13.3 and 16.1 ± 4.6 pmol/min per milligram, respectively) than liver microsomes. Indiplon was not hydrolyzed by any marmoset recombinant hydrolase. For rifabutin, male marmoset liver microsomes showed activity (30.0 ± 0.7 pmol/min per milligram) that was close to that of human liver microsomes (31.7 ± 1.6 pmol/min per milligram), whereas female marmoset liver microsomes showed significantly lower activity (18.7 ± 0.3 pmol/min per milligram) than human liver microsomes (Fig. 7E). In both humans and marmosets, intestinal microsomes (22.3 ± 2.1 and 9.7 ± 3.2 pmol/min per milligram, respectively) showed significantly lower activities than liver microsomes. Recombinant AADAC showed rifabutin hydrolase activity, and its contribution to marmoset liver microsomes was 64.7%. For rifampicin and rifapentine, marmoset liver and intestinal microsomes and recombinant hydrolases did not show any activity (Fig. 7, F and G).

Hydrolase activities for compounds specifically hydrolyzed by human AADAC by marmoset liver and intestinal microsomes and expression systems. The investigated compounds were (A) flutamide, (B) phenacetin, (C) ketoconazole, (D) indiplon, (E) rifabutin, (F) rifampicin, and (G) rifapentine. Each column shows the mean ± S.D. of three independent experiments. ***P < 0.001, compared with human liver microsomes. †††P < 0.001. Int., Intestine; F, female; M, male; ND, not detected.
Discussion
In preclinical studies, species differences in the activities or substrate preferences of drug-metabolizing enzymes often hamper the extrapolation of animal data to humans. In recent years, marmosets have received attention as novel experimental animals for drug development due to their advantages, such as small body size and high fertility. In this study, we aimed to elucidate the differences in substrate preferences of CES and AADAC in marmosets and humans.
According to the National Center for Biotechnology Information database, three CES1 isoforms (isoforms 1, 2, and 3) and four CES2 isoforms (isoforms 1, 2, 3, and 4) are likely generated from the CES1 and CES2 genes, respectively, in marmosets. In the human CES1 family, three isoforms, namely, CES1a, CES1b, and CES1c, are generated from a single CES1 gene. CES1b appears to be the main isoform that is expressed in the human liver (Wang et al., 2011). CES1b lacks the 18th amino acid (alanine) that is included in CES1a, as does the marmoset CES1 isoform 2. The marmoset CES2 isoform 1 possesses the predicted signal peptides to the ER membrane and KDEL-like sequence, as does human CES2. Accordingly, we selected CES1 isoform 2 and CES2 isoform 1 to construct the expression systems of CES1 and CES2. The sequence of AADAC cDNA, which was isolated from marmoset liver, corresponded to that registered on the National Center for Biotechnology Information database. The amino acid homologies of CES1 (isoform 2), CES2 (isoform 1), and AADAC between marmosets and humans are 88%, 86%, and 89%, respectively.
Among the compounds that are hydrolyzed by CES1, CES2, and AADAC in humans, as shown in Fig. 2, PNPA was hydrolyzed by CES1, CES2, and AADAC (Fig. 2A), whereas prasugrel and propanil were mainly hydrolyzed by AADAC in marmosets (Fig. 2, B and C). In humans, the contributions of CES1, CES2, and AADAC to prasugrel hydrolase activities in human liver microsomes were 31.6%, 7.1%, and 57.3%, respectively (Kurokawa et al., 2016). Although the contributions of each hydrolase to propanil hydrolysis have been determined, recombinant human CES1, CES2, and AADAC showed activity (Fukami et al., 2015). Interestingly, marmoset CES1 and CES2 did not show propanil hydrolase activity, and AADAC was responsible for more than 90% of this activity.
For hydrolysis of clofibrate, oseltamivir, and lidocaine, which are specifically hydrolyzed by human CES1, the contribution of marmoset CES1 to their activities in marmoset liver microsomes was approximately 100% (Fig. 3, A, B, and H). However, the contribution of marmoset CES1 to fenofibrate, temocapril, and lidocaine hydrolase activities in marmoset liver microsomes was 5%–35% (Fig. 3, C–E, G), which suggested the involvement of other enzymes, including CES1 isoform 1 and isoform 3. In humans, compounds that are hydrolyzed by CES1, as shown in Fig. 3, were barely hydrolyzed by intestinal microsomes because CES1 is not expressed in the human intestine (Watanabe et al., 2009). However, they were substantially hydrolyzed by marmoset intestinal microsomes. This is consistent with the fact that CES1 mRNA is detected in marmoset intestine at a level of two-thirds that in the liver (unpublished data). The tissue distribution differences of CES1 between marmosets and humans should be kept in mind when considering the pharmacokinetics of CES1 substrates in marmosets.
Among the compounds that are hydrolyzed by human CES1 and CES2, as shown in Fig. 4, oxybutynin was barely hydrolyzed in marmoset tissue microsomes and recombinant hydrolases (Fig. 4A). We previously found that oxybutynin was not hydrolyzed in rat, mouse, or cynomolgus monkey liver microsomes, whereas it was hydrolyzed in human and dog liver microsomes (Yoshida et al., 2018; Kisui et al., 2020; Honda et al., 2021). The amino acid residue, which is conserved in human and dog CES1, but not in other species’ CES1, is only Leu at position 358, where the others have Ile. This residue is close to Glu at position 354, which is one of the residues consisting of the catalytic triad. However, similar structure and properties of Leu and Ile imply that the difference of these residues is unlikely to affect the enzyme activity. To further clarify the species differences in substrate specificity, molecular modeling studies would provide useful information.
Among the compounds that are specifically hydrolyzed by human CES2, as shown in Fig. 5, irinotecan and procaine were hydrolyzed by marmoset CES2. However, the contributions of CES2 to their activities in marmoset liver microsomes were less than 25%, which suggested involvement of other enzymes. In contrast to human cases (Imai, 2006), the hydrolase activities for irinotecan and procaine in intestinal microsomes were lower than those in liver microsomes in marmosets. This is consistent with the fact that the expression level of CES2 in the marmoset intestine is approximately half of that in the marmoset liver at the mRNA level (unpublished data).
Among the compounds that are hydrolyzed by human AADAC, as shown in Fig. 7, flutamide and phenacetin are efficiently hydrolyzed by AADAC in marmosets (Fig. 7, A and B), and the contribution of AADAC to their activities in marmoset liver microsomes was approximately 100%. Ketoconazole was hydrolyzed by AADAC in marmosets, but the contribution of AADAC in marmoset liver microsomes was approximately 25% (Fig. 7C). Indiplon is hydrolyzed by human AADAC, but it was not hydrolyzed by marmoset AADAC (Fig. 7D). Dog and cynomolgus monkey AADAC are partly involved in the hydrolysis of indiplon (Yoshida et al., 2018; Honda et al., 2021). In contrast to humans, enzyme(s) other than AADAC may be involved in the hydrolysis of indiplon in other species. Our laboratory has determined that the hydrolase activities for rifamycins, including rifabutin, rifampicin, and rifapentine, are barely observed in mouse, rat, dog, and cynomolgus monkey liver microsomes (Nakajima et al., 2011; Yoshida et al., 2018; Kisui et al., 2020; Honda et al., 2021). Interestingly, marmoset liver microsomes and recombinant marmoset AADAC showed hydrolase activity only for rifabutin (Fig. 7E). Rifampicin and rifapentine have a piperazine ring with a methyl group or cyclopentane, whereas rifabutin does not contain the piperazine ring. Such structural differences might be recognized by marmoset AADAC. The hydrolase activities for compounds that are hydrolyzed by human AADAC were observed at similar levels in both human liver and intestine microsomes (Watanabe et al., 2009), whereas in marmosets, the hydrolase activities for these compounds in the intestine were considerably lower than those in the liver because of a 2-fold lower expression level of AADAC in the intestine than in the liver at the mRNA level (unpublished data). In marmosets, hydrolase activities that were catalyzed by CES and AADAC were commonly lower in the intestine than in the liver. The hydrolase activities in marmoset intestine were measured using microsomes from a male individual; therefore, it should be noted that interindividual and sex differences were not considered.
In this study, recombinant marmoset CES1 was expressed in COS-7 mammalian cells, whereas recombinant marmoset CES2 and AADAC were expressed in Sf21 insect cells. Marmoset CES1, CES2, and AADAC are predicted to be N-glycosylated at sites 1, 1, and 2 by NetNGlyc 1.0 Server (http://www.cbs.dtu.dk/services/NetNGlyc/), respectively. It is well known that mammalian cells produce compositionally more complex N-glycans containing terminal sialic acids, whereas insect cells produce simpler N-glycans with terminal mannose residues (Altmann et al., 1999). For some compounds that are hydrolyzed by CES2 or AADAC in humans, the sum of the hydrolase contributions did not reach 100%. Therefore, in addition to the possibility that enzymes other than CES2 and AADAC may also be involved in such reactions, it is possible that the structural differences between insect and mammalian N-glycans affect the differences in specific activities of marmoset CES2 and AADAC, which may lead to underestimations of their contributions.
This study used a microsomal fraction as an enzyme source because both CES and AADAC are localized in ER. Although CESs are also present in cytosol, their levels were one-tenth in the microsomal fractions (Sato et al., 2012b). The ratio of microsomal and cytosolic protein levels is 1:5 (Tabata et al., 2004); therefore, microsomal CESs would explain two-thirds of the total CES activity. If considering the cytosolic expression level of CESs, their contribution to drug hydrolysis in tissues might be slightly increased.
In conclusion, this study characterized marmoset hydrolase activities for compounds that are substrates of human CES1, CES2, or AADAC (Fig. 8). We revealed basic data helpful for understanding pharmacokinetics of new chemical entities in marmosets.

Summary of the contributions of CES1, CES2, and AADAC to the hydrolysis reactions of the test compounds in marmosets. Each axis shows the contribution of CES1, CES2, and AADAC in marmosets. The balls represent each test compound, with different colors showing the hydrolases that are involved in hydrolysis in humans: black, all CES1, CES2, and AADAC; blue, CES1; cyan, CES1 and CES2; green, CES2; yellow, CES2 and AADAC; red, AADAC.
Acknowledgments
The authors 1 sincerely thank Drs. Erika Sasaki and Takashi Inoue for their support of this study.
Authorship Contributions
Participated in research design: Honda, Fukami, Nakajima.
Conducted experiments: Honda, Hirosawa, Tsujiguchi, Uehara, Uno.
Contributed new reagents or analytic tools: Honda, Tsujiguchi, Uehara, Uno.
Performed data analysis: Honda, Fukami, Zhang, Nakano.
Wrote or contributed to the writing of the manuscript: Honda, Fukami, Uehara, Uno, Yamazaki, Nakajima.
Footnotes
- Received April 21, 2021.
- Accepted June 11, 2021.
This work resulted from the Construction of System for Spread of Primate Model Animals initiative under the Strategic Research Program for Brain Sciences of the Japan Agency for Medical Research and Development.
The authors declare that there are no conflicts of interest.
Abbreviations
- AADAC
- arylacetamide deacetylase
- CES
- carboxylesterase
- Endo H
- endoglycosidase H
- ER
- endoplasmic reticulum
- P450
- cytochrome P450
- PCR
- polymerase chain reaction
- PNPA
- p-nitrophenyl acetate
- Copyright © 2021 by The American Society for Pharmacology and Experimental Therapeutics


