


Abstract
Aldehyde oxidase (AOX) is a soluble, cytosolic enzyme that metabolizes various N-heterocyclic compounds and organic aldehydes. It has wide tissue distribution with highest levels found in liver, kidney, and lung. Human clearance projections of AOX substrates by in vitro assessments in isolated liver fractions (cytosol, S9) and even hepatocytes have been largely underpredictive of clinical outcomes. Various hypotheses have been suggested as to why this is the case. One explanation is that extrahepatic AOX expression contributes measurably to AOX clearance and is at least partially responsible for the often observed underpredictions. Although AOX expression has been confirmed in several extrahepatic tissues, activities therein and potential contribution to overall human clearance have not been thoroughly studied. In this work, the AOX enzyme activity using the S9 fractions of select extrahepatic human tissues (kidney, lung, vasculature, and intestine) were measured using carbazeran as a probe substrate. Measured activities were scaled to a whole-body clearance using best-available parameters and compared with liver S9 fractions. Here, the combined scaled AOX clearance obtained from the kidney, lung, vasculature, and intestine is very low and amounted to <1% of liver. This work suggests that AOX metabolism from extrahepatic sources plays little role in the underprediction of activity in human. One of the notable outcomes of this work has been the first direct demonstration of AOX activity in human vasculature.
SIGNIFICANCE STATEMENT This work demonstrates aldehyde oxidase (AOX) activity is measurable in a variety of extrahepatic human tissues, including vasculature, yet activities and potential contributions to human clearance are relatively low and insignificant when compared with the liver. Additionally, the modeling of the tissue-specific in vitro kinetic data suggests that AOX may be influenced by the tissue it resides in and thus show different affinity, activity, and modified activity over time.
Introduction
Aldehyde oxidase is a molybdenum cofactor-containing cytosolic enzyme recognized for its potential to oxidize various nitrogen-containing heterocyclic compounds and organic aldehydes (Beedham, 2001; Kitamura et al., 2006; Garattini et al., 2008; Pryde et al., 2010; Terao et al., 2016; Rashidi and Soltani, 2017). Catalytically, the mechanism involves nucleophilic attack at an electron-deficient carbon and insertion of oxygen from water. Apart from oxidation reactions, research shows that aldehyde oxidase (AOX) could also act as a reductase toward N-oxides, sulfoxides, and heterocycles under hypoxic conditions (Kitamura and Tatsumi, 1984a,b). It has also been demonstrated more recently that AOX can catalyze the hydrolysis of amide bonds (Sodhi et al., 2015).
Interest in AOX has increased considerably in recent years, and drug metabolism and pharmacokinetics laboratories have implemented assays to screen for its activity. This interest primarily stems from changing chemical-derivation or synthesis trends that, although they improve drug properties, may result in clearance by non-P450 pathways. Thus, although introduction of groups, such as azaheterocycles, may improve log P, solubility, and overall P450 liabilities, it may also increase potential for AOX-mediated metabolism. Carbazeran (Kaye et al., 1984), zoniporide (Dalvie et al., 2010), SGX523 (Diamond et al., 2010), and Lu AF09535 (Jensen et al., 2017) are examples of drug candidates that failed clinically as a result of unexpected poor pharmacokinetics or toxic metabolite formation due in part to aldehyde oxidase.
AOX-mediated metabolism can be readily captured in vitro through the use of human cytosolic and S9 liver fractions. When AOX activity is suspected, confidence can be increased through coincubation of test substrates with an AOX-specific inhibitor, such as hydralazine (Strelevitz et al., 2012). Though AOX-mediated metabolism can be correctly identified preclinically, the clearance in human has generally been underpredicted by in vitro assays and sometimes quite substantially. A number of estimates suggest the in vitro–to–in vivo correlation underprediction of in vivo intrinsic clearance could be as much as 10-fold on average for AOX substrates when plasma protein binding is taken into account (Zientek et al., 2010; Akabane et al., 2012; Hutzler et al., 2013; De Sousa Mendes et al., 2020). Various explanations have been offered in the literature as to why this may be the case, and these include possible loss of enzyme activity during tissue collection and preservation and a loss of enzyme activity over the time course of an in vitro assay. Regarding the latter, it has recently been proposed that regeneration of the AOX enzyme in vitro may be rate-limited by flow of electrons from the molybdenum pterin cofactor to the flavin adenine dinucleotide for the reduction of oxygen (Abbasi et al., 2019). In that work, the authors proposed a modulated activity model to capture the early fast rate of the enzyme to improve clearance predictions. However, even with this model, some residual underprediction persists. Another possibility often speculated in the literature is that contributions to AOX metabolism from extrahepatic tissue could be a key factor in the underpredictions. Immunohistochemical studies have shown that AOX is broadly distributed throughout the human body (Moriwaki et al., 2001). The kidneys, adrenal glands, lungs, and reproductive tissue are rich sources among other tissues. A more recent study has confirmed the presence and activity of AOX in human skin (Manevski et al., 2014). Although there is no current evidence suggesting that AOX metabolism at any one organ or tissue bed could rival that occurring at the liver, it cannot be ruled out that the collective contributions of many compartments could be significant.
Our objective in this current work was to measure the rates of AOX activity in the S9 fractions from various extrahepatic tissues known or suspected to express the AOX enzyme and to use best-available physiologic parameters to estimate potential contributions to total human AOX clearance. Studies were conducted using carbazeran as a probe substrate, a classic example of a compound with human clearance that is significantly underpredicted by liver tissue fractions. In this work, carbazeran is an ideal tool because of its high intrinsic activity, and although it has been observed to undergo glucuronidation in hepatocytes (Sharma et al., 2012), it is metabolized exclusively by AOX to a single product, 4-oxo-carbazeran in human cytosol or S9 without cofactors (Kaye et al., 1985; Xie et al., 2019) (Fig. 1).

Metabolism of carbazeran to 4-oxo-carbazeran by AOX.
Although we cannot capture AOX activity in every extrahepatic tissue compartment, the exercise does reveal the potential significance of extrahepatic contribution to the overall human AOX clearance of a drug and the collective role AOX containing extrahepatic tissue may play in the often-observed underprediction phenomenon.
Materials and Methods
Materials
The human vasculature S9 fractions obtained as a gift from BioIVT (Baltimore, MD) were prepared from the interior linings of iliac arteries collected during standard liver harvesting. The yield of vascular S9 per weight of tissue was calculated from the total protein yielded from the preparation as measured by the BCA protein assay (Thermo Fisher Scientific, Rockford, IL) divided by the weight of tissue used in the preparation, and this is represented as the average of three donors (one male and two females). The human kidney (whole kidney, mixed sex, pool of 8), lung (nonsmoker, mixed sex, pool of 4), and intestinal (duodenal and jejunal, prepared by elution, mixed sex, pool of 15) S9 fractions were procured from XenoTech (Kansas City, KS). Human liver S9 fractions were procured from BioIVT (mixed sex, pool of 150). Carbazeran and 4-oxo-carbazeran were procured from Toronto Research Chemicals (Ontario, Canada), and hydralazine was procured from Sigma Aldrich (St. Louis, MO). Dialysis membranes (6–8 kDa molecular mass cut-off) for protein binding were procured from HTDialysis (Gales Ferry, CT). Water and acetonitrile were of HPLC grade and were procured from Fisher Scientific (Fair Lawn, NJ). All other reagents used in the study were of extrapure grade.
Methods
Tissue S9 Incubations.
Each tissue-specific extrahepatic S9 fraction (kidney, lung, vasculature, intestinal) was incubated at a final protein concentration of 1 mg/ml in phosphate buffer (100 mM, pH 7.4) with 1, 3, 10, and 30 µM carbazeran. Liver S9 fraction was incubated at a final protein concentration of 0.1 mg/ml in an identical manner. The lower end of the carbazeran concentration range (1 µM) was chosen specifically to represent concentrations lower than the Michaelis-Menten constant (KM) values reported in the literature (3–6 µM) and assumed to provide the highest rate of metabolite formation (Chen et al., 2019; Tan et al., 2020; Uehara et al., 2020). Thus, the lower end of the concentrations range is assumed to provide an accurate account of maximum intrinsic clearance (CLint) (∼Vmax/KM). Pooled S9 products were incubated in duplicate (lung, kidney, intestinal) or triplicate (liver) at each substrate concentration. For vasculature S9, each individual donor was tested separately at each test concentration. No cofactors were added to any incubations. Incubations (300 µl starting volume) were conducted in 96 deep well plates (Thomson Instruments, Oceanside, CA) using a Thermomixer (Eppendorf, Hamburg, Germany) at 37°C with a shaking speed of 600 rpm. Aliquots (30 µl) were removed at 0, 3, 7, 15, 30, 60, and 90 minutes postincubation and quenched with 200 µl of chilled acetonitrile containing a proprietary internal standard. Parallel incubations were conducted in the presence of hydralazine (100 µM final concentration), a known AOX inhibitor. All collected samples were centrifuged at 4000 × g for 10 minutes, and supernatants were diluted 3-fold in water prior to liquid chromatography–tandem mass spectrometry (LC/MS/MS) injection. Authentic standards of 4-oxo-carbazeran were prepared in the nonfortified S9 tissue matrices and processed in an identical manner.
Protein Binding.
The protein binding assay for extrahepatic S9 fractions was conducted using equilibrium dialysis. Tissue-specific S9 fractions (1 mg/ml protein) fortified with 1 µM compound and blank 100 mM phosphate buffer, pH 7.4, were placed on opposite sides of a divided 96-well dialysis membrane device. Samples (triplicates) were dialyzed against buffer for a total of 6 hours at 37°C and 5% CO2 on an oscillating platform inside a standard cell culture incubator. At the end of the incubation period, donor and receiver samples were matrix-matched (10 µl of S9 study sample and 40 µl of blank assay buffer or 40 µl of buffer study sample and 10 µl of nonfortified S9 matrix) and were quenched with 200 µl of chilled acetonitrile containing a proprietary internal standard. Quenched samples were centrifuged at 4000 × g for 10 minutes, and supernatants were diluted 3-fold in water prior to LC/MS/MS injection.
LC/MS/MS Analysis.
Analysis was conducted with an API4500 triple quadrupole mass spectrometer (AB Sciex, Ontario, Canada). Samples were analyzed with electrospray ionization in the positive mode with a source temperature of 500°C. The parent > daughter transition monitored for carbazeran was 361.2 > 218.1 atomic mass unit, and the collision energy was set at 38 V. The parent > daughter transition monitored for 4-oxo-carbazeran was 377.1 > 288.1 atomic mass unit, and the collision energy was set at 23 V. The HPLC column (Kinetex C18-XB, 50 × 2.1 mm, 5-µm particles) was procured from Phenomenex (Torrance, CA). The mobile phase consisted of HPLC-grade water with 0.1% formic acid and acetonitrile with 0.1% formic acid for components A and B, respectively. The mobile phase was held at 5% B and ramped to 95% B over 1.3 minutes at a flow rate of 0.6 ml/min. The total run time was 1.5 minutes. LC/MS/MS chromatograms were collected and integrated with Analyst software (version 1.6). A standard curve (1–500 nM) was used to quantify 4-oxo-carbazeran formation in all extrahepatic S9 study samples (kidney, lung, vasculature, intestinal). For liver S9 study samples, the standard curve range was shifted up to 8-fold higher (8–4000 nM) depending on substrate incubation concentration to capture the higher amounts of metabolite formed in these incubations. Assay performance was accepted based on linearity throughout the dynamic range of the curve (R > 0.99 with 1/x2 weighting) and back calculation of standards to within 20% of the nominal value.
Data Analysis.
Consistent with supporting data acquired during the studies presented within this manuscript, the AOX pathway was presumed to be the only pathway contributing to carbazeran clearance utilizing S9 tissue fractions, with 4-oxo-carbazeran being the sole metabolite formed. As such, carbazeran CLint in each tissue was estimated based on 4-oxo-carbazeran time-course data obtained in the various S9 incubations and calculated according to

In eq. 1, AOX maximum 4-oxo-carbazeran formation rate ( ) and Michaelis-Menten constant (
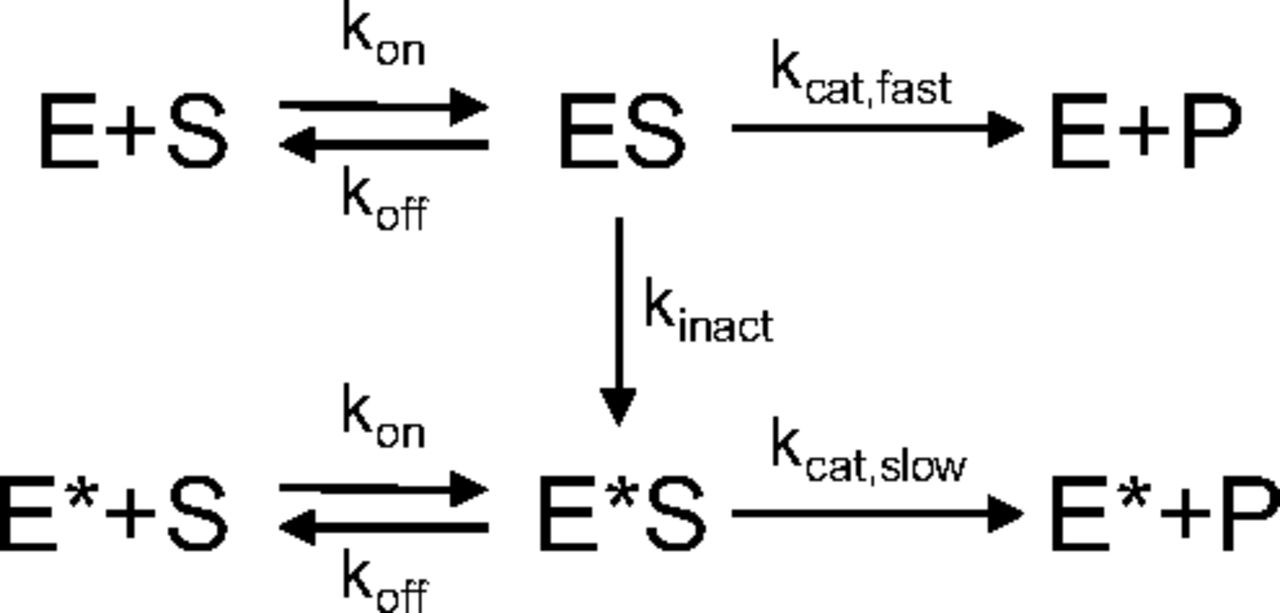
 ) were calculated using parameters of AOX-modulated activity model (Abbasi et al., 2019), which were estimated by fitting the model (Fig. 2) to the 4-oxo-carbazeran time-course data. In the model,
  is the initial fast AOX catalytic rate constant,
  is the initial active AOX concentration in each of the tissues,
  is the binding rate constant, and
  is the tissue-specific unbinding rate constant. The model was implemented in MATLAB R2019 (MathWorks, Natick, MA) and simultaneously fit to 4-oxo-carbazeran mean concentration time-course data from all tissue S9 incubations using default fitnlm algorithm settings with a proportional error model and all model parameters assumed to be log-normally distributed. Description of the full model characterization can be found in the Supplemental Material.

The AOX-modulated activity model describes product P formation from substrate S by enzyme E through the formation of the enzyme-substrate complex (ES), which also leads to the formation (kinact) of a less catalytically active version of the enzyme E* (kcat,slow < kcat,fast). The substrate and enzyme binding (kon) and dissociation (koff) rate constants are unaffected by the change in the enzyme’s catalytic activity.
The CLint values were scaled to in vivo (CLint,scaled) for each tissue according to

Total AOX clearance (CLAOX) contributions from liver, kidney, lung, and intestinal compartments were estimated by the well stirred model as follows:
 in which Qb is blood flow to the tissue compartment, fu,plasma is unbound free fraction in plasma, RBP is the blood-to-plasma concentration distribution, and fu,S9 is the free fraction in the S9 incubations. For vasculature, it was considered that there is continuous exposure to the blood throughout the body, and the blood flow restriction was removed. Furthermore, it was assumed that the iliac arterial tissue was representative of the entirety of the human vasculature. CLAOX from the vasculature was estimated as follows:

All physiologic parameter values used in the above equations are recorded in Table 1. The fu,plasma and RBP values for carbazeran, 0.08 and 0.7, respectively, were taken from a previous publication (Zientek et al., 2010). Carbazeran fu,S9 was measured by equilibrium dialysis and determined to be 0.72, 0.82, 0.72, and 0.74 for kidney, lung, vasculature, and intestinal S9 fractions (1 mg/ml), respectively. For the liver S9 fraction (0.1 mg/ml), carbazeran consumption by AOX is too extensive to measure binding by equilibrium dialysis. Here, liver fu,S9 was calculated as 0.97 per the nonspecific binding model (Austin et al., 2002) as follows:
 in which [P]extra-hepaticS9 is 1 mg/ml, [P]liverS9 is 0.1 mg/ml, and fu,extra-hepaticS9 is 0.75, which is the average fu measured across all extrahepatic tissues (kidney, lung, vasculature, intestinal) studied.
Physiologic parameters used for scaling CLint and estimating CLAOX contributions
Results
After the in vitro incubations with carbazeran, nonlinear formation of 4-oxo-carbazeran metabolite was observed and quantified against authentic standards in the liver, kidney, lung, and vasculature S9 fractions at all incubation concentrations (Fig. 3, A–E, respectively). Across all incubations, initial faster rate of 4-oxo-carbazeran formation was quickly followed by a slower rate of formation. Only negligible amounts of metabolite were detected in the intestinal S9 fractions and specifically only observed at the higher incubation concentrations (Fig. 3F) and associated with the slower rate of formation. Although the extent of carbazeran elimination was too low to be accurately measured in extrahepatic S9 fractions, it was easily observed in liver S9 fractions, and there was an approximate mass balance between substrate consumption and metabolite formation. A representative plot of carbazeran consumption versus 4-oxo-carbazeran formation for 1 µM incubations in liver S9 fraction is shown in Fig. 3A. Coincubation of carbazeran with 100 µM hydralazine, a selective mechanism-based inhibitor of AOX, significantly blocked metabolite formation in all incubations. In liver S9, there was a 93% decrease in metabolite formation at the highest test concentration (30 µM) of carbazeran. Similarly, all extrahepatic tissues showed at least 81% decrease in metabolite formation at the same conditions. Relative concentrations of 4-oxo-carbazeran quantified at the end of the incubation period (90 minutes) for all carbazeran test concentrations, with and without presence of hydralazine, are presented in Fig. 4 for each tissue S9 fraction tested. Taken together, observed data in human S9 fractions without cofactors suggest that carbazeran is metabolized to a single product, 4-oxo-carbazeran, and this is mediated by the AOX pathway.

Time course of carbazeran depletion and 4-oxo-carbazeran formation in liver S9 fraction after incubation with 1 µM carbazeran (A). Time course of 4-oxo-carbazeran formation after incubation with 1 µM (blue), 3 µM (red), 10 µM (yellow), and 30 µM (purple) carbazeran in liver (B), kidney (C), lung (D), vasculature (E), and intestinal (F) S9 fractions. Points represent average data with error bars representing standard errors associated with technical and biologic (vasculature only) replicates. The curves show AOX modulated activity model simulations based on simultaneous fit to 4-oxo-carbazeran time-course data from all tissue S9 fractions.
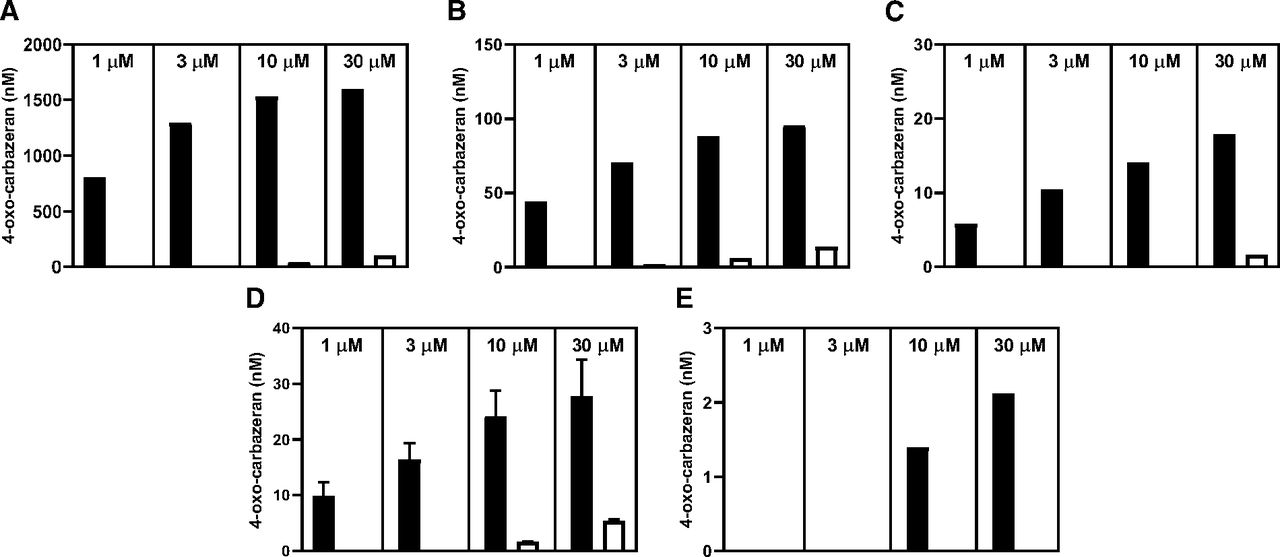
Formation of 4-oxo-carbazeran in liver (A), kidney (B), lung (C), vasculature (D), and intestinal (E) S9 fractions after 90 minutes of incubation with 1, 3, 10, and 30 µM carbazeran in absence (■) and presence (□) of 100 µM hydralazine.
Despite minimal consumption of carbazeran by the various extrahepatic tissue S9 samples, 4-oxo-carbazeran metabolite formation quickly followed nonlinear kinetics that can be described by the AOX-modulated activity model (Abbasi et al., 2019). This model was able to accurately capture (adjusted R2 = 0.99) 4-oxo-carbazeran formation time-course data in all tissue S9 incubations (Fig. 3), with estimated parameter values captured in Table 2. In the final model, liver and kidney were found to have a lower Michaelis-Menten constant value (5.2 µM) relative to the other tissues (21 µM) as well as different enzyme inactivation and slow catalytic rate constant values (Table 3). To estimate intestinal S9 CLint (0.038 µl/min/mg S9) despite minimal 4-oxo-carbazeran formation, it was necessary to assume that the intestinal AOX enzyme rate constants were the same as in other tissue’s S9 fractions (lung and vasculature). Similarly, to estimate active AOX enzyme level in each tissue ( ), it was assumed that the AOX fast catalytic rate constant was the same across all tissues. Thus, we determined that the liver has the highest estimated AOX enzyme concentration level at 21 pmol/mg S9 protein (Table 2). AOX intrinsic clearance estimates calculated according to eq. 1 were 670, 1.2, 0.35, 0.58, and 0.038 µl/min/mg, respectively, for liver, kidney, lung, vasculature, and intestine S9 fractions incubated with carbazeran (Table 3). The CLint,scaled and CLAOX, the values estimated in various extra-hepatic tissues, were very low relative to the liver (Table 3). Collectively, CLAOX estimates in the extrahepatic tissues sampled in this current work represent <1% compared with that of the liver.
Modulated activity model parameter estimates
Values in brackets represent 95% confidence intervals.
Calculated parameters and scaled AOX clearance contributions
Discussion
Although the human liver is the richest source of AOX, the current study has demonstrated that AOX activity is clearly present and measurable in a variety of extrahepatic human tissues. Significantly, we demonstrate for the first time that AOX activity is measurable in the human vasculature, as represented by S9 fractions prepared from iliac arteries. Given that AOX has been found to be expressed in a variety of extrahepatic human tissues beyond the scope of this current work (adrenal glands, reproductive tissue, adipose), it can be fully expected that measurable extrahepatic AOX activity can be found throughout the human body, which would further contribute to the metabolism of AOX substrates.
Given this backdrop, it seems plausible that the collective contributions to AOX metabolism by extrahepatic sources could at a minimum partially explain the underprediction of human clearance scaled from in vitro assays conducted with pooled hepatic S9 or cytosolic fractions. Admittedly, various assumptions were made in the current study when estimating a potential CLAOX contribution from a particular tissue compartment, and physiologic parameters may not be as accurate as those commonly used for liver tissue scaling. Regardless, these assumptions likely have little impact on the overall findings presented in this study, in which the extrahepatic tissues only provide a minor contribution to overall systemic clearance. Here, the collective estimated CLAOX of kidney, lung, vasculature, and intestinal compartments together contribute <1% of that predicted by the liver.
The tissue fractions tested were chosen because of the identified expression levels of AOX in the tissue (Basit et al., 2020), the volume of tissue of the organ (Davies and Morris, 1993), and the lack of blood flow restriction pertaining to the tissue. Although it would have been desirable to study additional human tissues beyond the scope of this work, it is unlikely based on these criteria that any would contribute significantly to whole-body AOX clearance. For example, the adrenal glands are often cited as having rich AOX expression (Moriwaki et al., 2001; Gomez-Sanchez, 2007). However, adrenal glands are very small, and the combined weight of adult human adrenal glands is only roughly 10 g (Kreiner, 1982). Although adrenal glands may have a rich blood supply on a per-gram basis, total blood flow has been estimated at roughly 0.14% of cardiac output (Gomez-Sanchez, 2007) or what would amount to approximately 0.1 ml/min/kg. Similarly, contribution of human skin, which was demonstrated to have limited AOX activity (Manevski et al., 2014), to whole-body AOX clearance would also be insignificant when compared with liver.
Carbazeran, a phosphodiesterase inhibitor-1 inhibitor that produces concentration-dependent positive inotropic responses and is known for its greater than or equal to hepatic blood flow systemic clearance (≥21 ml/min/kg) and being extensively metabolized to the 4-oxo-metabolite in vivo, was chosen as an ideal probe substrate to identify AOX activity in tissue S9 fractions. Carbazeran is also known for its specificity for AOX versus other enzymes in S9 fractions, especially since enzymes that require cofactors in vitro (i.e., uridine 5'-diphospho-glucuronosyltransferases and P450s) are of little consequence without addition of cofactors, which were excluded from the protocol. Additionally and perhaps most importantly to these experiments, carbazeran exhibits a rapid turnover rate providing its sensitivity as a marker even with very low AOX expression levels in tissue. Because of this fact, the number of potential substrates available to assess extrahepatic AOX activity was limited. In addition to carbazeran, zoniporide was tested during the course of these experiments using all of the aforementioned tissues. With protein concentrations up to 1 mg/ml, zoniporide did not result in adequate substrate turnover even at enzyme-saturating substrate concentrations (30 µM) and failed to provide measurable metabolite formation rates, thus disqualifying it as an applicable substrate (Supplemental Fig. 3).
The analysis of the data and scaling of organ-specific AOX clearance used the well stirred model. This particular model, as opposed to the dispersion model or parallel-tube model, was used because it presents the highest possible in vivo clearance estimate for each tissue’s contribution to the overall systemic clearance in humans. For vasculature, the blood-flow restriction was removed entirely. Therefore, the possibility of an underprediction based on the scaling method has been minimized. An interesting observation of this work is that in all extrahepatic tissues studied the initial rate of 4-oxo-carbazeran production was followed by a rapid deceleration in product formation despite minimal consumption of carbazeran. It has been hypothesized by Abbasi and coworkers (2019) that AOX is likely slow to reduce oxygen in vitro, resulting in enzyme reduction that leads to the decelerated substrate turnover. We employed an AOX modulated activity model (Abbasi et al., 2019) to accurately capture the early rapid rate of AOX activity characterized by the fast catalytic rate constant. Since the early rapid rate of AOX activity in vitro is believed to most accurately represent in vivo AOX activity, the application of the AOX-modulated activity model provided us with a more accurate estimate of intrinsic clearance. Despite the more accurate estimate of the initial faster rate of substrate turnover, extrahepatic AOX contribution estimates were found to be very low.
By assuming that the AOX fast catalytic rate constant is the same across all tissues, the difference in AOX activity between various tissues, as determined by the early rapid rate of 4-oxo-carbazeran formation, can be attributed to the abundance of active AOX enzyme in S9 fractions. Thus, using the AOX modulated activity model, estimates of active AOX enzyme abundance in each tissue’s S9 fraction were obtained. It was found that the active AOX abundance in the liver (21 pmol/mg S9 protein) is in general agreement with measured liver AOX abundance (11.96 ± 4.46 pmol/mg S9 protein) described by Basit and colleagues (2020). In addition, the published extrahepatic AOX abundance levels for the heart and intestine were below the limit of quantification, which agrees with much lower estimated active AOX levels that we obtained using AOX activity (Table 2). In contrast, Basit et al. (2020) showed only an 8-fold difference in AOX abundance between kidney (1.53 ± 0.79 pmol/mg S9 protein) and liver, whereas our analysis of AOX activity data showed greater than 500-fold reduction in active kidney AOX abundance (0.038 pmol/mg S9 protein) relative to liver. Since enzyme abundance does not always correlate with activity, it is possible that our assumption of tissue-independent enzyme fast catalytic rate is incorrect, which could explain the observed disconnect. Tissue sample preparation differences among suppliers and laboratories, and perhaps between tissues, could also impact the resulting AOX activity and thus the model-derived active AOX enzyme tissue abundance estimates.
In support of potential differences in enzyme activity between tissues, it was necessary to introduce tissue-specific differences in several of the model’s enzyme rate constants to accurately describe the full 4-oxo-carbazeran time-course data in kidney and liver S9 fractions (Supplemental Material). This observation suggests that it is possible that AOX enzyme activity could be different in various tissues and thus complicates the total metabolic clearance extrapolation based on a recombinant protein enzyme activity and tissue enzyme abundance levels as proposed by Basit et al. (2020). It is possible that sample differences between liver, kidney, and other tissues could have affected observed 4-oxo-carbazeran formation, which would impact interpretation of model-derived active AOX enzyme tissue abundance estimates.
This work suggests that future efforts may be best directed toward understanding aspects of tissue isolation and fraction preparation that may negatively impact AOX activity. Sanoh and coworkers (2012), who isolated human hepatocytes from humanized PhoenixBio mice and then used them to predict human in vivo intrinsic clearance, showed a 3-fold or greater underprediction from the line of unity. This direct comparison of in vivo clearance in humanized mice and the scaled hepatic clearance from hepatocytes isolated from the same animal suggests that the loss in AOX activity during preparation of liver cells and fractions may impact our ability to predict human in vivo AOX clearance. Furthermore, despite accounting for the lack of the active AOX enzyme regeneration during the experiment through the modulated activity model, unaccounted factors may affect the level of active AOX enzyme prior to the incubation. Perhaps additional systematic work pertaining to the complexity of enzyme activation may shed more light on the limited enzymatic activity of tissue isolates and ways to correct for it.
In conclusion, this work advances the narrative that AOX is active and measurable in a variety of extrahepatic human tissues, including the vasculature. However, the collective contribution of the tissues tested in these experiments to whole-body clearance of AOX substrates is very low compared with the liver, and they are unlikely to contribute significantly toward the often-observed underprediction of human AOX clearance.
Authorship Contributions
Participated in research design: Kozminski, Zientek.
Conducted experiments: Kozminski.
Performed data analysis: Kozminski, Selimkhanov.
Wrote or contributed to the writing of the manuscript: Kozminski, Selimkhanov, Heyward, Zientek.
Footnotes
- Received November 14, 2020.
- Accepted June 10, 2021.
This work received no external funding.
The authors report no conflicts of interest.
↵
 This article has supplemental material available at dmd.aspetjournals.org.

Abbreviations
- AOX
- aldehyde oxidase
- CLAOX
- total AOX clearance
- CLint
- intrinsic clearance
- CLint,scaled
- scaled CLint
- fu
- fraction unbound
- HPLC
- high-performance liquid chromatography
- KM
- Michaelis-Menten constant
- LC/MS/MS
- liquid chromatography–tandem mass spectrometry
- P450
- cytochrome P450
- Copyright © 2021 by The Author(s)
This is an open access article distributed under the CC BY Attribution 4.0 International license.


