


Abstract
Screening for cytochrome P450 (CYP) induction potential is routine in drug development. Induction results in a net increase in CYP protein and is assessed typically by measuring indirect endpoints, i.e., enzyme activity and mRNA in vitro. Recent methodological advancements have made CYP protein quantification by liquid chromatography-mass spectrometry in vitro induction studies more accessible and amenable to routine testing. In this study, we evaluated CYP3A4 concentration dependence of induction response for 11 compounds (rifampin, rifabutin, carbamazepine, efavirenz, nitrendipine, flumazenil, pioglitazone, rosiglitazone, troglitazone, pazopanib, and ticagrelor) in plated hepatocytes from two or three donors incorporating in the assessment all three endpoints. In addition, the time-dependence of the induction was examined over 1, 2, or 3 days of treatment. For most compounds, mRNA, enzyme activity, and protein endpoints exhibited similarity in induction responses. Pazopanib and ticagrelor were notable exceptions as neither protein nor enzyme activity were induced despite mRNA induction of a magnitude similar to efavirenz, pioglitazone, or rosiglitazone, which clearly induced in all three endpoints. Static modeling of clinical induction responses supported a role for protein as a predictive endpoint. These data highlight the value of including CYP protein quantification as an induction assay endpoint to provide a more comprehensive assessment of induction liability.
SIGNIFICANCE STATEMENT Direct, liquid chromatography-mass spectrometry (LC-MS)-based quantification of cytochrome P450 (CYP) protein is a desirable induction assay endpoint; however such application has been limited due to inefficient workflows. Here, we incorporate recent advancements in protein quantitation methods to efficiently quantify CYP3A4 protein in in vitro induction assays with 11 compounds in up to 3 donors. The data indicate induction responses from mRNA do not always align with those of protein suggesting assessment of induction liability is more complex than thought previously.
Introduction
A recent analysis of approximately 150 drugs approved by the U.S. Food and Drug Administration (FDA) between 2013 and 2017 indicated that 65% were substrates of cytochrome P450 (CYP) 3A (Hakkola et al., 2020). Accordingly, in vitro evaluation of new drug candidates for CYP3A4 induction potential to elucidate drug-drug interaction potential is routinely conducted in drug discovery/development programs (EMA, 2012; FDA, 2020). Induction occurs as a result of an increase in rate of protein synthesis or decrease in rate of protein degradation (Hollenberg, 2002). For example, whereas rifampin causes de novo increase in rate of protein synthesis, erythromycin and troleandomycin may induce by decreasing the CYP3A protein degradation rate (Watkins et al., 1986). To evaluate CYP induction in vitro, quantifying relative changes in mRNA, and/or enzyme activity, is recommended (EMA, 2012; FDA, 2020). An assumption with mRNA analysis is that it is presumed to be a faithful proxy of induced protein, whereas a drawback to measurements using enzyme activity is that it can be subject to inhibition by the test compound, potentially resulting in a masking of induction response (Hewitt et al., 2007). In principle, quantifying CYP protein changes directly would be preferable, but historical approaches (e.g., Western blotting) are considered only semiquantitative and have been largely abandoned in the context of this assay.
In recent years, methods to quantify protein by liquid chromatography-mass spectrometry (LC-MS) across broad applications has become commonplace. Adoption of LC-MS quantitation of protein in CYP induction studies has been hampered by inadequate analytical sensitivity, such that microsomal protein enrichment steps are required (Jenkins et al., 2006; Langenfeld et al., 2009; Kawakami et al., 2011; Sakamoto et al., 2011; Williamson et al., 2011; Xu et al., 2014). Recently, MacLean et al. applied immunoprecipitation to enrich CYP proteins to enable LC-MS protein quantification to complement the mRNA and activity endpoints in induction assays (MacLean et al., 2017). The value of quantifying protein was evident: in the example with the experimental compound BI-X, CYP3A4 mRNA was induced to a similar extent as it was with rifampin; however, the rise in CYP3A4 protein levels were only up to ∼2-fold with BI-X compared with ∼8- to 10-fold with rifampin across the three donors. Enzyme activity exhibited a similar, but more variable, trend to that of protein. By monitoring all three endpoints, the authors suggested that mRNA alone was insufficient to fully evaluate induction potential of BI-X (MacLean et al., 2017). Despite the clear value of including protein quantitation as an endpoint, the efficiency of the immunoprecipitation step may not be sufficient to enable widespread adoption.
We recently developed an efficient, enrichment-free methodology for LC-MRM quantification of CYP3A4, CYP2B6, and CYP1A2 protein compatible with typical 96-well induction assay formats (Savaryn et al., 2020). Using this method, we sought to evaluate, on a wider scale, the CYP3A4 induction responses with all three endpoints with 11 different compounds using up to three hepatocyte donors. Compounds potentially expected to exhibit a variety of induction responses in vitro or in vivo were selected for our evaluation. To gain a full understanding of potential temporal differences in response among the endpoints, we also performed a time-course analysis of 24, 48, and 72 total hour incubation periods. Collectively, our data provide strong correlation in induction response among the three endpoints, but also identify empirical examples where CYP mRNA and protein induction relationship profiles differ markedly. These data suggest that addition of protein as an endpoint, coupled with mRNA and enzyme activity, may provide a more holistic assessment of in vivo induction response.
Materials and Methods
Test compounds and midazolam were obtained from MilliporeSigma (St. Louis, MO). 1’-Hydroxymidazolam-[13C3] was obtained from Corning Life Sciences.
Cell Culture and Drug Treatment
Cryopreserved primary human hepatocytes were purchased from BioIVT, USA. Briefly, hepatocytes were thawed and seeded directly onto collagen-coated 96-well culture plates (∼55,000 cells/well) and overlaid with GelTrex extracellular matrix after 4–6 hours. Cells were cultured overnight, then treated with test compounds or vehicle control (0.1% DMSO) for 24, 48, and 72 hours with daily change of treatment media; a 0-hour time-point plate was also included, which was from hepatocytes plated and recovered overnight and without treatment. For concentration response testing, six to eight concentrations were evaluated with concentrations chosen to achieve highest soluble concentrations and/or bracketing the total Cmax in humans. A minimum of five concentrations were used to determine EC50 and maximum fold increase (or induction) minus baseline of 1-fold (Emax) values; some values at high concentrations were excluded in curve fits due to apparent cytotoxicity.
RNA Isolation
The RNA was isolated using MagMAX Express 96 RNA Isolation System from ThermoFisher with RNA extraction kits (ThermoFisher, cat. no. AM1830). Hepatocytes were washed once with 1X PBS, followed by addition of 140 µL of RNA lysis buffer to each well and mixed to achieve lysis. The lysate was transferred to a well of the 96-well binding plate. The samples were then mixed with 20 µL magnetic bead solution according to the manufacturer’s instruction. The beads with adhered RNA were captured on a 96-well magnetic tip manifold. The RNA sample beads were then washed and treated with TURBO DNase, followed by two buffer washes. The beads were then dried, and RNA was eluted with 50 µL elution buffer.
cDNA Synthesis and RT-PCR
cDNA synthesis was conducted following the protocol for SuperScript VILO™ Master Mix (ThermoFisher, cat. no. 11755250). Briefly, 4 µL of Master Mix were mixed with 16 µL of RNA followed by thermocycler incubation as follows: 25°C for 10 minutes, 42°C for 60 minutes, and terminated at 85°C for 5 minutes. RT-PCR was performed on ABI QuantStudio 7, with the following parameters: 2.5 µL of each cDNA sample was pipetted into a 96-well optical reaction plate (ThermoFisher/Applied Biosystems, cat. no. 4306737). Reagent mix was made using the TaqMan™ Fast Advanced Master Mix RT-PCR kit (ThermoFisher/Applied Biosystems, part no. 4444602). Seventeen and half microliters of each reagent mix was added to each well with 40 cycles of RT-PCR using TaqMan® Gene Expression Assay (ThermoFisher) with the following primer and probes:
Human CYP3A4, Cat. 4331182 Assay ID: Hs00604506_m1; GAPDH (control to account for any variability in RNA levels), Cat. 4351368 Assay ID: Hs02758991_g1.
CYP3A4 Enzyme Activity Assay
After a 1- to 3-day treatment with test compounds, the hepatocytes were washed with incubation medium, then incubated in 100 µL of medium containing 30 μM midazolam (Millipore Sigma) for 30 minutes. The CYP3A4 enzyme activity was quantified by LC-MS by measuring the formation of 1’-hydroxymidazolam using stable labeled internal standard C13-1’-hydroxymidazolam to control for signal fluctuation. For one of the five experiments, carbutamide was used as an internal standard with no apparent loss in data quality.
Liquid Chromatography-Tandem Mass Spectrometry Protein Quantification
CYP3A4 protein was quantified using a surrogate peptide LC-MRM approach as described previously (Savaryn et al., 2020). In some cases, LC-MS run times were shortened to 1 minute per injection by using conventional high performance liquid chromatography at higher flow rates as follows: column = Kinetex 5µm, C18, 100 Å, 30 × 2.1 mm (Phenomenex), flow rate = 1500 uL/min, Mobile Phase A (MPA) = water + 0.1% formic acid, Mobile Phase B (MPB) = acetonitrile + 0.1% formic acid, gradient program = 0–0.2 minute hold MPB at 3%, 0.2–0.75 minute ramp MPB to 50%, 0.75–0.76 minute ramp MPB to 95%, 0.76–0.86 minute hold MPB at 95%, 0.86–0.87 minute decrease MPB to 3%, 0.87–1.0 minute hold MPB at 3%. This shortened run time using HPLC methodology is a significant improvement over our previous publication in terms of analytical throughput which used ∼10 minute per injection and UPLC conditions. After in-plate processing and LC-MRM data acquisition, peak areas for three CYP3A4 surrogate tryptic peptides were determined using Skyline software (MacLean et al., 2010). Peak areas for each peptide were averaged across the replicate vehicle treated (0.1% DMSO) wells to serve as the denominator in calculating fold-change, to which peak areas from individual wells were normalized. The mean and standard deviation from triplicate samples were then calculated. Unless otherwise noted, the CYP3A4 protein data presented throughout this manuscript are from the LSLGGLLQPEKPVVLK peptide only, which we previously demonstrated as having the greatest magnitude of induction (Savaryn et al., 2020). Other surrogate peptides were examined in some cases and protein responses were similar, although slightly less sensitive (Supplemental Fig. 2). Quantification of basal CYP3A4 protein levels across an entire 96-well plate of untreated hepatocytes validated the ability of this method to detect even subtle changes in relative protein abundance, with an overall coefficient of variance of less than 15% across the plate (Supplemental Fig. 3).
Statistical Analysis
Linear Regression.
To verify the presence of induction responses, linear regression was performed with GraphPad PRISM using the mean of triplicate measurements per concentration per donor as single Y-value entries in XY table format. Drug concentrations used in common across the three hepatocyte donors (ACB, VJX, and QIE) and less than or equal to the Emax concentration (thereby analyzing initial slopes) in at least two of the three donors by mRNA were entered as X-values. Each replicate Y value (N = 3, 1 mean value per donor × 3 donors) was considered as an individual point, and auto settings were used for where to start and end the regression line. In the case of flumazenil, a negative control, data from two donors was used, but was otherwise as described above. Correlation analyses of mRNA, enzyme activity, and protein within and across each treatment period (e.g., 24, 48, and 72 hours) was performed in PRISM using Pearson’s correlation coefficient. A P value <0.01 was deemed as statistically significant.
EC50/Indmax curve fitting.
The EC50 and maximum induction (Indmax) values were generated by nonlinear curve-fitting using a 4-parameter model, Y = Bottom + (X ^ Hillslope) * (Top-Bottom) / (X ^ HillSlope + EC50 ^ HillSlope) with the bottom usually constrained to 1. Top values were constrained to the maximum response where indicated (see Supplemental Table 2). Unless initial fits exhibited Hill Slopes <2, the Hill Slope was constrained to <2. We considered 1.7-fold induction coupled with evidence of concentration dependence as criteria to attempt curve fitting. Using 1.7-fold was an empirical choice in comparison with FDA-guidance of 2-fold, but we also sought to be more conservative in assigning presence or absence of induction response. Some values were excluded from curve fitting analysis, usually because they were >20% lower than the maximum response and were at concentrations exceeding that giving the maximum response (e.g., exhibited a bell-shaped response).
R3 calculations
R3 = 1/[1 + d × ((Emax × 10 × Imax,u)/(EC50 + 10 × Imax,u))]
R3 is the predicted ratio of intrinsic clearance values of a probe substrate for an enzymatic pathway in the absence and presence of an inducer. d is the scaling factor and was assumed to be 1. Emax is the maximum induction effect determined in vitro, equal to maximum induction fold-induction minus 1, or the span from the baseline to the maximum for sigmoidal fits not constrained to a baseline of 1. Imax,u is the maximal unbound plasma concentration of the interacting drug at steady state, which considering uncertainties in the protein binding measurements, the unbound fraction was set to 1% if experimentally determined to be <1% (see Supplemental Table 1 for actual parameters). EC50 is the concentration causing half-maximal effect determined in vitro.
Results
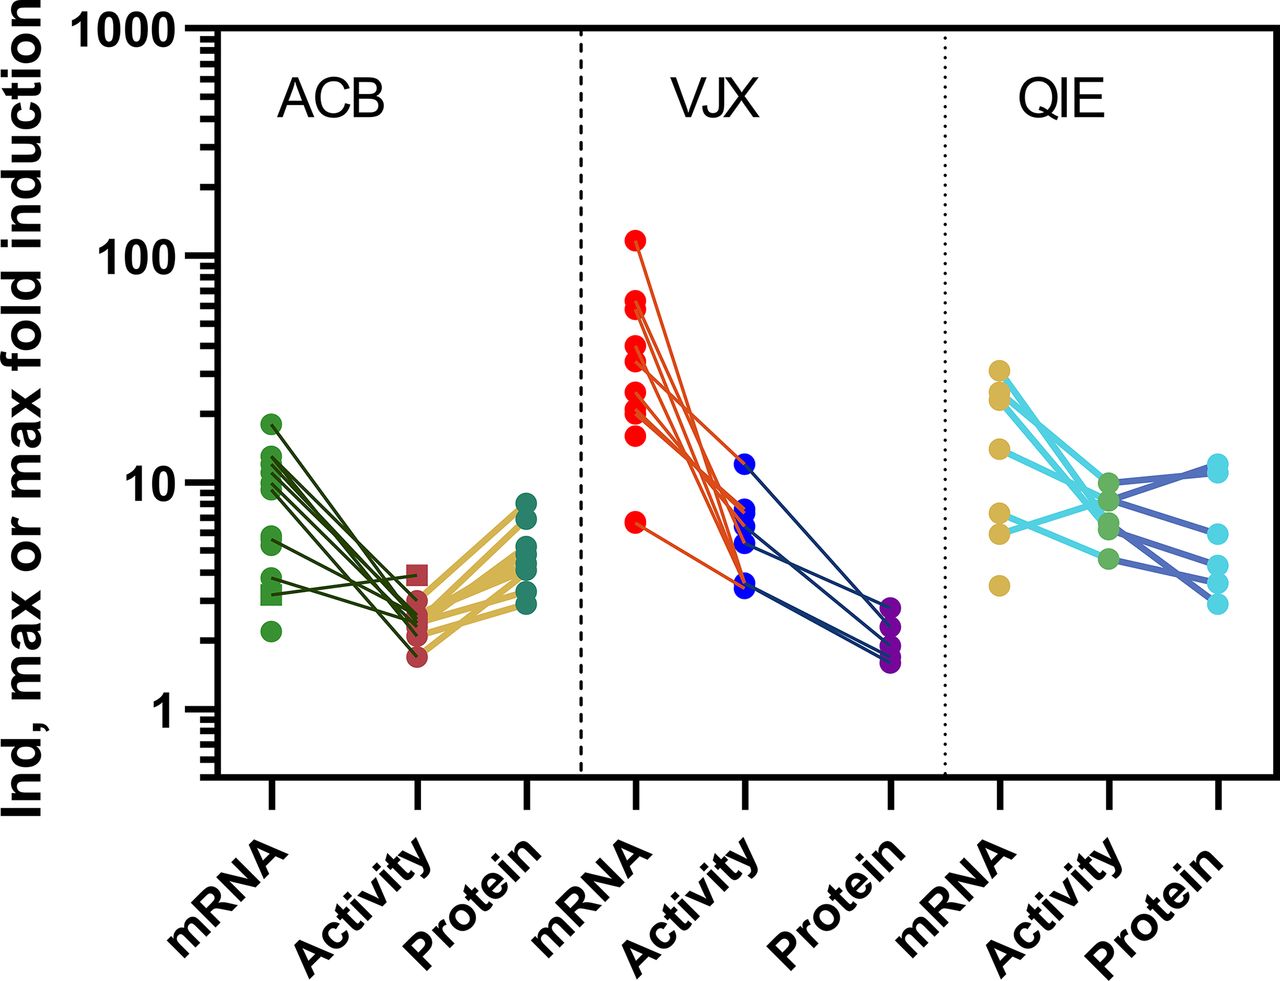
Concentration-response curves for CYP3A4 mRNA, enzyme activity, and protein were generated for 11 compounds in hepatocytes from three donors (denoted ACB, VJX, and QIE), with the exception that carbamazepine, efavirenz, nitrendipine, and flumazenil were not evaluated in donor QIE. Rifampin (Fig. 1) served as a reference strong inducer, whereas flumazenil served as a noninducing control. Among compounds exhibiting an induction response, mRNA was typically the most sensitive endpoint (Table 1). The three donors exhibited marked differences in the magnitude of mRNA fold induction; VJX exhibited maximum fold-induction that was 2- to 6-fold higher than in donors ACB and QIE, depending on the compound. Protein fold induction also varied across donors, but in contrast to the response with mRNA, donor VJX usually exhibited lowest fold induction of protein, in some cases undetectable when it was readily observed in the other two donors (e.g., rosiglitazone). The maximal induction response for enzyme activity, when present, was consistently greater than that for protein with donor VJX, similar with QIE, but consistently lower in donor ACB. Figure 2 depicts the marked interdonor differences in magnitude and rank order of maximum fold induction for each of the three endpoints. In contrast to the variability in maximum fold induction, EC50 values were more similar across donors (Table 1).
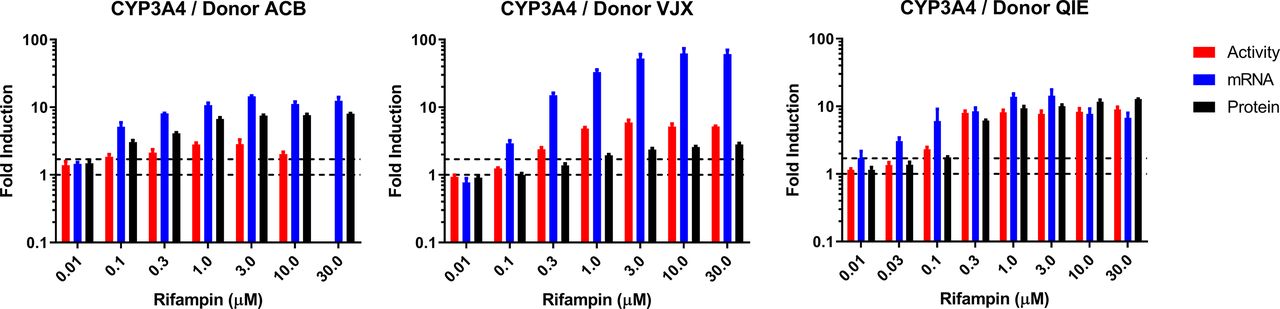
Donor-to-donor variability in CYP3A4 induction profiles by rifampin. Human hepatocytes from three donors were cultured in 96-well plates and treated for 48 hours (2 × 24 hour treatments) with increasing concentrations of rifampin. CYP3A4 induction was assessed using activity (red), mRNA (blue), and protein (black) endpoint assays. For each endpoint, data are presented as fold induction compared with vehicle treated control. Data are the mean and standard deviation of triplicate wells. Levels in vehicle control wells (1-fold) and 1.7-fold induction are indicated by dashed lines. Activity data were excluded for Donor ACB at 30 µM due to aberrant LC-MS/MS internal standard behavior.

Induction max (or when fit was not possible for ticagrelor mRNA and activity, indicated by square symbols, maximum fold-induction) for the 11 compounds tested across the donors shown, for each endpoint. Data are from Table 1. Connector lines indicate responses with same compound. Absence of connector lines indicates any induction response was below 1.7-fold threshold value. Note: donor QIE did not have data for carbamazepine, efavirenz, nitrendipine, or flumazenil and therefore fewer data points are available for this donor.
EC50 and Indmax values, 48-hour single time-point assays in plated human hepatocyte donor ACB, VJX, and QIE
Figure 3, A–C shows the 48h concentration-response profile for pioglitazone, rosiglitazone, and troglitazone, which have been well studied as potential inducers in vitro (Sahi et al., 2000; Sahi et al., 2003). With these compounds, mRNA, activity, and protein induction responses broadly track together and all yield statistically significant increases in slope for each endpoint with concentration when aggregated across the three donors (Fig. 3D). Rifampin, rifabutin, pioglitazone, carbamazepine, efavirenz, and nitrendipine showed similar trends (Table 1). Flumazenil, a noninducing control, did not show a statistically significant nonzero slope for any of the three endpoints when aggregated across the two donors tested (Supplemental Fig. 1). By contrast, pazopanib and ticagrelor exhibited induction of CYP3A4 mRNA only; enzyme activity and protein were not detectably induced (Fig. 4). After 48 hours of treatment, pazopanib induced mRNA in all three donors with max induction ranging from 5- to 15-fold (Fig. 4A). Enzyme activity was either unchanged, as in donor VJX, or reduced as in donors ACB and QIE (Fig. 4A). Protein was not induced in any of the three donors (Fig. 4A). Ticagrelor showed similar results as pazopanib for mRNA, albeit to a lesser degree (maximum induction 7-fold); activity was mostly unchanged with a slight decrease in activity in donor VJX, and protein was also unchanged (Fig. 4A). At 30 µM in donor ACB, ticagrelor exhibited a 3- to 4-fold induction in mRNA and activity, but was approximately 1-fold at 20 µM and not reproduced in a follow-up time-course experiment with this donor or in other donors, suggesting this result was spurious (for a more detailed comparison of response within a compound across donors and endpoints, all 132 concentration-response figures generated in this study are shown in Supplemental Fig. 1). Statistical analysis permitted a more objective comparison among the three endpoints for pazopanib and ticagrelor. This assessment showed that both compounds significantly induced mRNA, but not protein or activity (Fig. 4B). Pazopanib produced a statistically significant decrease in activity, as demonstrated by a negative slope (Fig. 4B), and this is consistent with its previously described role as a CYP3A4 time-dependent inhibitor (Mao et al., 2016). Use of 48-hour incubation with 10 µM rifampin as an in-study positive control demonstrated sensitivity of the CYP3A4 protein induction endpoint in the pazopanib and ticagrelor studies across the three donors (Fig. 4C).

Effect of thiazolidinedione family compounds on CYP3A4 induction determined by enzyme activity, mRNA, or protein. Human hepatocytes from three donors were cultured in 96-well plates and treated for 48 hours (2 × 24 hour treatments) with increasing concentrations of pioglitazone, rosiglitazone, or troglitazone. CYP3A4 induction was assessed using activity (red), mRNA (blue), and protein (black) endpoint assays. (A) Donor ACB; (B) Donor VJX; (C) Donor QIE. For each endpoint, data are presented as fold induction compared with vehicle treated control. Data are the mean and standard deviation of triplicate wells. Levels in vehicle control wells (1-fold) and 1.7-fold induction are indicated by dashed lines. (D) Linear regression of the data from all three donors (A–C). For regression analysis, triplicate means per concentration per donor were treated as single values. Thus, regression was performed with N = 3 per concentration, one value per concentration per donor × 3 donors. The datapoints in (D) represent the mean of the N = 3 values per concentration. The dashed line represents baseline (1-fold) CYP3A4 levels in vehicle control. The 30 µM troglitazone data were omitted for linear regression due to saturation of response.

Effect of pazopanib and ticagrelor on CYP3A4 induction determined by enzyme activity, mRNA, or protein. (A) Human hepatocytes from three donors were cultured in 96-well plates and treated for 48 hours (2 × 24 hour treatments) with increasing concentrations of pazopanib (top) or ticagrelor (bottom). CYP3A4 induction was assessed using activity (red), mRNA (blue), and protein (black) endpoint assays. Data are the mean and standard deviation of triplicate wells, except for the activity data in the 30 µM ticagrelor treatment in Donor ACB, which is N = 2 wells due to an analytical error. Levels in vehicle control wells (1-fold) and 1.7-fold induction are indicated by dashed lines. (B) Linear regression of the data from all three donors in (A) above. For regression analysis, triplicate means per concentration per donor were treated as single values. Thus, regression was performed with N = 3 per concentration, one value per concentration per donor × 3 donors. The datapoints in (B) represent the mean of the N = 3 values per concentration. (C) CYP3A4 protein levels after 48 hours (2 × 24 hour treatments) incubation with 10 µM rifampin across the three donors and same studies as in (A) and (B) above. Data are the mean and standard deviation of six replicate wells for vehicle (0.1% DMSO) and triplicate wells for rifampin treatment. Levels in vehicle control wells (1-fold) and 1.7-fold induction are indicated by dashed lines.
To further compare the temporal relationship of mRNA with activity and protein, we determined EC50 and Indmax after 24-, 48-, and 72-hour exposures for rifampin, pazopanib, ticagrelor, and rifabutin (Table 2, Supplemental Fig. 1). In general, maximum fold-induction was observed at 72 hours regardless of endpoint, whereas EC50 values were generally unaffected by total exposure time. Despite the longer (and shorter) exposure times, pazopanib and ticagrelor again failed to exhibit meaningful induction responses for enzyme activity and protein (concentration dependence and ≥1.7-fold). Using this data set, we examined correlation coefficients across the three endpoints at each concentration (except concentrations exhibiting evidence of cytotoxicity). This analysis supported our conclusions, with pazopanib and ticagrelor showing no meaningful induction of activity or protein, although with some analyses statistically significant correlation (P < 0.01) was attained with mRNA versus protein and activity, despite fold induction well below 1.7-fold for the latter endpoints (Supplemental Fig. 4).
EC50 and Indmax values, time-course assays from plated human hepatocytes in donor ACB
Discussion
Using a “plate-to-peaks” LC-MS method for CYP protein quantification (Savaryn et al., 2020), we profiled CYP3A4 induction of protein as well as mRNA and enzyme activity for 11 compounds in three human hepatocyte donors. The efficiency of the method used here enabled a broad investigation of the relationship among the three induction endpoints, to our knowledge, for the first time. Although the use of mRNA as an endpoint has gained considerable popularity in the past 15 years (Fahmi et al., 2010; Zhang et al., 2014) and indeed is advocated by regulatory agencies, it is hampered by the need for assuming that mRNA translates in a predictable way into functional protein, and that this process is compound independent. Our findings suggest this is not always the case. As expected, induction responses differed between donors. One key finding was that the magnitude of response could differ greatly by endpoint. In a striking example, the most sensitive donor by mRNA was the least sensitive by protein (Table 1, Fig. 2). Nevertheless, for most compounds in our test set, directional responses irrespective of magnitude, as well as EC50 values, among the three endpoints were largely similar (Table 1). However, ticagrelor and pazopanib were exceptions, with the three endpoints failing to correlate—mRNA was induced but not protein or enzyme activity. One explanation for these observations is that, unlike the more sensitive mRNA endpoint, induced protein and enzyme activity failed to meet a detection threshold. We believe this scenario to be unlikely, since the induction of mRNA by ticagrelor and pazopanib were of a similar or greater magnitude as efavirenz, pioglitazone, or rosiglitazone in two or three donors (Table 1). The absence of protein or activity induction was not due to insufficient exposure time, since 72-hour exposures still failed to yield induced protein or activity. These data strongly suggest a post-transcriptional phenomenon, whereby P450 protein fails to be sufficiently translated or is degraded at a more rapid rate. Pazopanib exhibits CYP3A inactivation in HLM and plated hepatocytes (Mao et al., 2016). This may readily explain the absence of induction and the concentration-dependent decline in activity (Fig. 4). However, one might expect induction of protein to be detectable, despite enzyme inactivation, as observed with ritonavir (Luo et al., 2002). On the other hand, adducted and/or damaged CYP3A4 protein may be targeted for a faster degradation rate, as occurs after exposure to grapefruit constituents (Schmiedlin-Ren et al., 1997). Interestingly, Moscovitz et al., (2018) recently used RNA arrays to show the induction signature for pazopanib is distinct from pregnane-X receptor, constitutive androstane receptor, or aryl hydrocarbon receptor pathways, suggesting alternative pathways are operative (Moscovitz et al., 2018). Considering the present data, it is tempting to speculate that activation of such alternative pathways does not always lead to increased protein levels. With ticagrelor, an explanation for the absence of in vitro CYP3A4 protein or activity induction concurrently with induction of mRNA is less apparent. Zhou et al. observed no evidence of time-dependent inhibition of CYP3A4 but demonstrated activation and inhibition of midazolam 1’-hydroxylation and 4-hydroxylation (IC50 value, 8.2 µM), respectively (Zhou et al., 2011). Direct inhibition of midazolam catalysis by ticagrelor would not be anticipated in our catalytic activity assay as it should be sufficiently diluted by the media wash step prior to introduction of midazolam substrate. Unfortunately, we do not have an explanation why protein or activity was not induced despite relatively robust induction of mRNA.
Regulatory agencies provide a number of algorithms to assess induction responses in vivo from in vitro data (EMA, 2012; FDA, 2020). The R3 equation in the FDA guidance for in vitro drug-drug interaction studies (FDA, 2020) incorporates EC50, Emax, and the observed or expected maximum unbound drug plasma concentration in vivo at a steady state. We calculated R3 values for our test set using mRNA (per guidance) but also using activity and protein data inputs. For rifampin and thiazolidinedione compounds, all endpoints predicted reasonably well the correct direction and magnitude of area under the curve (AUC) change in vivo of the CYP3A4 probe used (Table 3). However, for pazopanib, the clinical data show an increase in CYP3A4 substrate AUC of 30%, in contrast to the 85% decrease in AUC predicted by R3. The observed data are consistent with the net effect of enzyme inhibition predominating over induction with pazopanib (Center for Drug Evaluation and Research, 2008; Goh et al., 2010). In this case, the in vitro induction assay with protein as the R3 endpoint would be more consistent with the observed data than the mRNA R3 prediction. For ticagrelor, the modest in vitro mRNA induction coupled with unbound exposure levels indicated a 22% change in AUC, whereas no effect was indicated with activity and protein (Table 3). Although a 28% decrease in AUC was observed with midazolam, this outcome was attributed to a very unusual instance of in vivo activation of CYP3A4 by ticagrelor, rather than an induction response (Teng and Butler, 2013). Considering this mechanism, R3 calculations from all three in vitro endpoints were not contrary to the in vivo response. Despite some exceptions in this limited analysis, our data support the continued use of mRNA as a conservative, accessible, and robust endpoint. However, concurrently our results suggest that acquiring all three endpoints has potential for a more informed assessment of the likely in vivo response and may eventually aid in supporting the deferral or elimination of unnecessary clinical drug-drug interaction studies.
R3 predictions versus observed clinical data
As indicated earlier, the dynamic range of the protein quantification is lower than that of mRNA across donors and with one (e.g., VJX), dramatically so. This would place more scrutiny on the precision of the protein measurement to make inferences about the induction response. Indeed, the modest increases in CYP3A4 protein in donor VJX barely rises above twofold, the threshold often used to conclude induction of mRNA (EMA, 2012; FDA, 2020). Only in response to rifampin treatment did CYP3A4 protein rise above twofold induction for donor VJX. Fortunately, the precision of the method enables robust quantitation (e.g., <15% CV, Supplemental Fig. 3) which is evident upon inspection of fitted curves of triplicate data (Supplemental Fig. 1). Still, larger dynamic range would be desirable. Further, the observation that a large dynamic range in one endpoint for a given donor does not always equate with the others (e.g., VJX) poses challenges for donor qualification. If protein is to be included as an endpoint, the induction response as measured by fold-induction in protein should be evaluated prior to acquisition. All three of the donors in the current study were selected and acquired from the vendor primarily on the basis of post-thaw viability, morphology, and mRNA-fold induction. However, with the present data set, we would conclude donor QIE emerges as a preferred donor for investigations requiring all three endpoints.
In principle, fold-induction of enzyme activity should not exceed that of protein. Therefore, it was interesting to observe enzyme activity Indmax values exceed that of protein by ∼2- to 5-fold (e.g., Table 1 and Fig. 2) for donor VJX. This phenomenon also occurred with some compounds in donor QIE (up to 2.3-fold), but never with donor ACB. One explanation for the marked incongruity observed with donor VJX is that fold-induction of CYP3A4 protein was underestimated. We do not believe this is the case because the same methodology and surrogate peptides were used with all donors, yet the observation was most peculiar to donor VJX. In addition, when we compared three different peptides selective for CYP3A4, we observed a similar protein induction response (see Supplemental Fig. 2). Another potential explanation for our observations is that proteins potentially affecting P450 catalytic efficiency (e.g., NADPH cytochrome P450 reductase or cytochrome b5) or the pool of heme (e.g., aminolevulinic acid synthase 1) available for incorporation into holoenzyme, are induced to the extent that they augment catalytic activity in the induced state, but are rate-limiting for the basal, uninduced state (Maglich et al., 2002). Supplementation of exogenous cytochrome b5 was observed to attenuate substrate inhibition of 1’-hydroxylation of triazolam, a compound structurally similar to midazolam (Schrag and Wienkers, 2001). In the event midazolam was exhibiting substrate inhibition in hepatocytes, as has been shown in human liver microsomes (Podoll, 1996), induction of cytochrome b5 synthesis may stimulate midazolam activity without proportional induction of CYP3A4 protein. Disproportionate expression or induction of CYP3A5, another midazolam 1’-hydroxyase (Tseng et al., 2014), or P450-P450 isoform interactions affecting activity (Davydov and Prasad, 2021) also merit further investigation.
The recent and extensive body of work from the Innovation and Quality Consortium Induction Working Group (Kenny et al., 2018; Wong et al., 2021) has been impressive, providing recommendations on a number of questions pertaining to in vitro induction studies and drug-drug interaction risk-assessment. These investigations have focused on mRNA and enzyme activity as endpoints. With the wider adoption of protein quantitation methods including the present one, we anticipate a broader interrogation of the value of including protein measurements. The results with pazopanib, ticagrelor, and BI-X (MacLean et al., 2017) suggest these investigations are warranted and may be useful in helping to augment induction risk assessment paradigms.
Acknowledgments
The authors would like to thank Hardikkumar Patel and Yueting Wang for bioanalytical support quantifying metabolite production in the CYP3A4 enzyme activity assays. The authors would also like to thank Xiazi Qiu for helpful discussion.
Authorship Contributions
Participated in research design: Savaryn, Sun, Jenkins, Stresser.
Conducted experiments: Savaryn, Sun, Ma.
Performed data analysis: Savaryn, Sun, Ma, Stresser.
Wrote or contributed to the writing of the manuscript: Savaryn, Sun, Stresser.
Footnotes
- Received August 12, 2021.
- Accepted November 30, 2021.
AbbVie sponsored and funded the study; contributed to the design; participated in the collection, analysis, and interpretation of data, and in writing, reviewing, and approval of the final publication.
All authors are or were employees of AbbVie at the time the work was conducted and may own AbbVie stock.
↵1 J.P.S. and J.S. contributed equally to this work.
↵
 This article has supplemental material available at dmd.aspetjournals.org.

Abbreviations
- AUC
- area under the curve
- CYP
- cytochrome P450
- Emax
- maximum fold increase (or induction) minus baseline of 1-fold
- FDA
- Food and Drug Administration
- Indmax
- maximum induction
- LC-MS
- liquid chromatography-mass spectrometry
- MPB
- Mobile Phase B
- MRM
- multiple reaction monitoring
- Copyright © 2022 by The American Society for Pharmacology and Experimental Therapeutics


