


Article Figures & Data
Figures
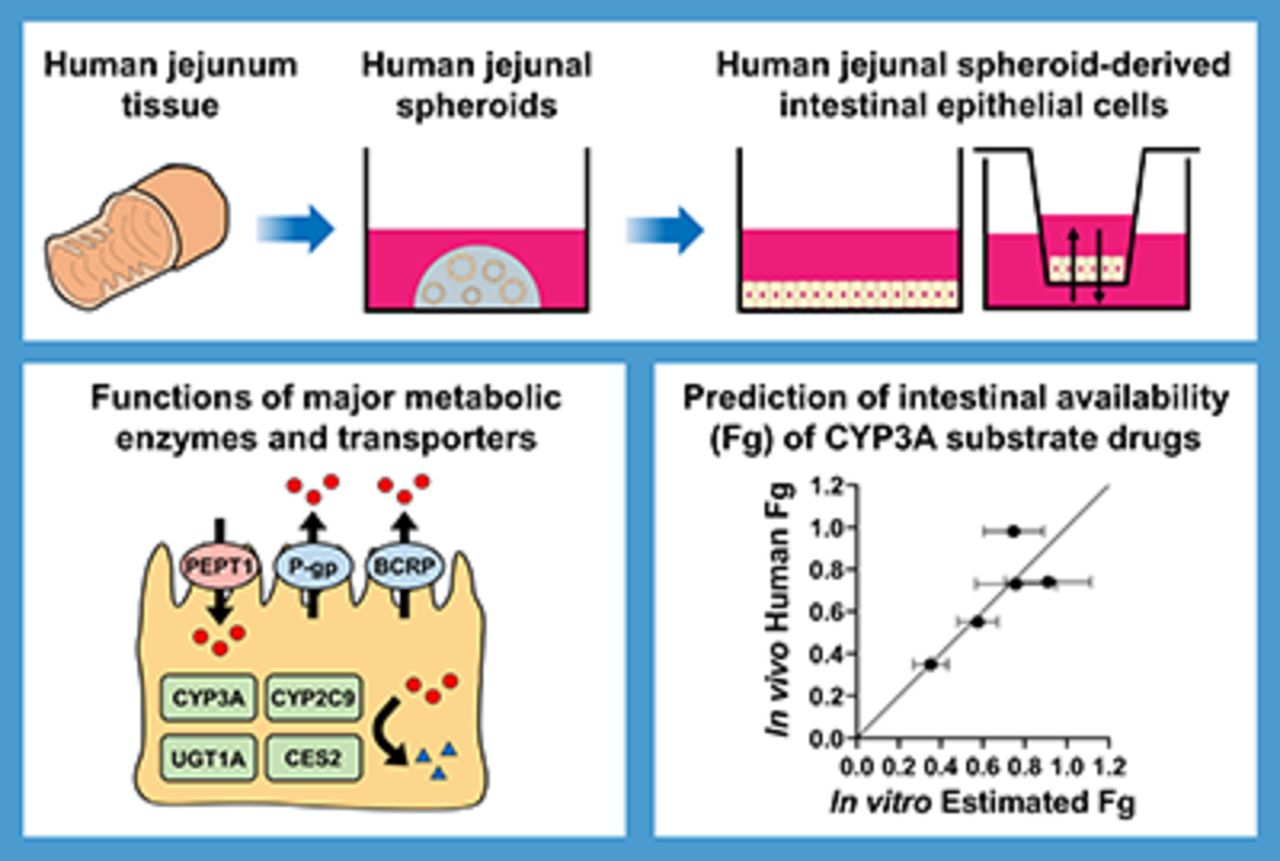
- Fig. 1.
Establishment of human intestinal spheroids and generation of 2D cultures from 3D spheroid cultures. (A) Images of the human jejunal sample and the procedure for the establishment of human intestinal spheroids from isolated crypts. (B) Images of human jejunal spheroids after several passages and the procedure for the generation of 2D cultures from 3D spheroid cultures. (C) Timeline for the generation of 2D cultures.
- Fig. 2.
The relative mRNA expression levels of P-gp, PEPT1, CYP3A4, and SI and TEER values depending on the culture period. The mRNA expression levels of (A) ABCB1 (P-gp), (B) SLC15A1 (PEPT1), (C) CYP3A4, and (D) SI in human jejunal spheroids at 6 days after passage (black column, Day 0) and human jejunal spheroid-derived differentiated intestinal epithelial cells seeded into 24-well plates (gray column; Days 3, 5, 7, 9, 11, and 13) are presented as fold change relative to their expression levels in human jejunal tissue sections. Each bar and error bar represent the mean value and SD, respectively (n = 3). (E) TEER values depending on the culture period in human jejunal spheroid-derived differentiated intestinal epithelial cells. Each symbol and error bar represent the mean value and SD, respectively (n = 3).
- Fig. 3.
Bidirectional transport of P-gp and BCRP substrate drugs in the presence or absence of a cocktail of P-gp/BCRP inhibitors. Bidirectional transport of (A) digoxin and (B) fexofenadine (5 μM each; P-gp substrate drugs), (C) sulfasalazine and (D) rosuvastatin (5 μM each; BCRP substrate drugs), (E) antipyrine (1 μM; a passive transcellular transport marker), and (F) lucifer yellow (10 μM; a paracellular transport marker) across human jejunal spheroid-derived differentiated intestinal epithelial cells in the presence (open symbol) or absence (closed symbol) of a mixture of PSC833 (5 μM; a P-gp inhibitor) and Ko143 (5 μM; a BCRP inhibitor). Square and triangle symbols represent the transport in the apical-to-basolateral direction (A to B) and in the basolateral-to-apical direction (B to A), respectively. Each symbol and error bar represent the mean value and SD, respectively (n = 3). The apparent permeability coefficient (Papp) of (G) digoxin, (H) fexofenadine, (I) sulfasalazine, (J) rosuvastatin, (K) antipyrine, and (L) lucifer yellow across human jejunal spheroid-derived differentiated intestinal epithelial cells in the presence (open column) or absence (closed column) of a mixture of PSC833 and Ko143. Each bar and error bar represent the mean value and SD, respectively (n = 3). * indicates significant difference in the transport or Papp in the presence of a mixture of PSC833 and Ko143 compared with that of control (*p < 0.05, **p < 0.01). # indicates significant difference in the transport or Papp in the basolateral-to-apical direction compared with that in the apical-to-basolateral direction (#p < 0.05, ##p < 0.01).
- Fig. 4.
Apical-to-basolateral transport of cefadroxil in the presence or absence of PEPT1 inhibitor (Gly-Sar). Apical-to-basolateral (A to B) transport of (A) cefadroxil (10 μM; a PEPT1 substrate), (B) antipyrine (1 μM; a passive transcellular transport marker), and (C) lucifer yellow (10 μM; a paracellular transport marker) across human jejunal spheroid-derived differentiated intestinal epithelial cells in the presence (open square) or absence (closed square) of Gly-Sar (10 mM; a PEPT1 inhibitor). Each symbol and error bar represent the mean value and SD, respectively (n = 3). The Papp values in the apical-to-basolateral direction of (D) cefadroxil, (E) antipyrine, and (F) lucifer yellow across human jejunal spheroid-derived differentiated intestinal epithelial cells in the presence (open column) or absence (closed column) of Gly-Sar. Each bar and error bar represent the mean value and SD, respectively (n = 3). *p < 0.05, **p < 0.01.
- Fig. 5.
Metabolism of CYP3A4/5, CYP2C9, UGT1As, and CES2 substrate drugs in the presence or absence of the corresponding inhibitors. Metabolic activities of (A) CYP3A4/5 (5 μM midazolam; midazolam 1′-hydroxylation), (B) CYP2C9 (10 μM diclofenac; diclofenac 4′-hydroxylation), (C) UGT1As (5 μM raloxifene; raloxifene 4′-glucuronidation), and (D) CES2 (50 μM irinotecan; irinotecan hydrolysis) in human jejunal spheroid-derived differentiated intestinal epithelial cells in the presence (open column) or absence (closed column) of ketoconazole (10 μM; a CYP3A4/5 inhibitor), sulfaphenazole (50 μM; a CYP2C9 inhibitor), zafirlukast (50 μM; an UGT inhibitor), or loperamide (20 μM; a CES inhibitor). Each bar and error bar represent the mean value and SD, respectively (n = 3). *p < 0.05, **p < 0.01.
- Fig. 6.
Apical-to-basolateral transport of CYP3A substrate drugs in the presence or absence of a CYP3A inhibitor (ketoconazole) and/or CYP3A inducer (1,25-(OH)2D3). Apical-to-basolateral (A to B) transport of (A) midazolam, (B) triazolam, (C) alprazolam, (D) felodipine, and (E) nifedipine (1 μM each; CYP3A substrates) across human jejunal spheroid-derived differentiated intestinal epithelial cells in the presence (open symbol) or absence (closed symbol) of ketoconazole (10 μM; a CYP3A inhibitor) with (circle symbol) or without (square symbol) 1,25-(OH)2D3 (10 nM for 96 h; a CYP3A inducer). Each symbol and error bar represent the mean value and SD, respectively (n = 3). The Papp values of (F) midazolam, (J) triazolam, (H) alprazolam, (I) felodipine, and (J) nifedipine in the apical-to-basolateral direction across human jejunal spheroid-derived differentiated intestinal epithelial cells in the presence (open column) or absence (closed column) of ketoconazole with or without 1,25-(OH)2D3. Each bar and error bar represent the mean value and SD, respectively (n = 3). The production clearance of (K) 1′-hydroxy midazolam, (L) α-hydroxy triazolam, (M) α-hydroxy alprazolam, (N) dehydro-felodipine, and (O) dehydro-nifedipine (metabolites of CYP3A substrates) in human jejunal spheroid-derived differentiated intestinal epithelial cells in the presence (open column) or absence (closed column) of ketoconazole with or without 1,25-(OH)2D3. Each bar and error bar represent the mean value and SD, respectively (n = 3). * indicates significant difference in the apical-to-basolateral transport, Papp in the apical-to-basolateral direction, or production clearance of metabolites in the presence of ketoconazole compared with that of control (*p < 0.05, **p < 0.01). # indicates significant difference in the apical-to-basolateral transport, Papp in the apical-to-basolateral direction, or production clearance of metabolites with 1,25-(OH)2D3 compared with that of control (#p < 0.05, ##p < 0.01). ND; not detected.
- Fig. 7.
Correlation between the estimated and in vivo human intestinal availability (Fg) values of CYP3A substrate drugs. Comparisons of the estimated Fg values of midazolam, triazolam, alprazolam, felodipine, and nifedipine calculated using eqs. 3–6 in the presence (open circle) or absence (closed circle) of 1,25-(OH)2D3 (a CYP3A inducer) and their corresponding in vivo human Fg values. The solid line represents an identity line. Each symbol and error bar represent the mean value and SD, respectively (n = 3).


Tables
- TABLE 1.
Summary of estimated Fg values for CYP3A substrates
Data are presented as the mean ±standard deviation (n = 3).
Compound CLAtoB (μL/120 min) Estimated Fg Value Control +1,25-(OH)2D3 Control +KCZ Control +KCZ Control +1,25(OH)2D3 In Vivo Human Fg Valuea Felodipine 5.18 ± 0.78 10.1 ± 0.2 2.71 ± 0.62 7.81 ± 1.51 0.35 ± 0.08 0.25 ± 0.14 0.35 Midazolam 73.1 ± 4.7 101 ± 5 50.4 ± 4.3 96.6 ± 4.8 0.58 ± 0.10 0.36 ± 0.05 0.55 Nifedipine 87.6 ± 5.5 104 ± 7 54.9 ± 4.7 95.9 ± 6.3 0.76 ± 0.19 0.41 ± 0.09 0.73 Triazolam 91.3 ± 5.2 97.6 ± 5.7 82.5 ± 5.5 96.6 ± 6.3 0.91 ± 0.20 0.76 ± 0.12 0.74 Alprazolam 85.6 ± 4.1 101 ± 6 79.6 ± 5.7 97.1 ± 5.2 0.75 ± 0.14 0.71 ± 0.12 0.98 KCZ, ketoconazole.
aVarma et al. (2010).
Data Supplement
- Supplemental Data -
Supplemental Methods
Supplementary Figure 1. The relative mRNA expression levels of intestinal drug transporters and drug-metabolizing enzymes in human jejunal spheroid-derived cells and human jejunal tissue sections originating from 3 different subject (#1–#3).
Supplementary Figure 2. Simple mathematical modeling of intestinal absorption of drugs.
Supplementary Figure 3. Theoretical consideration of the relationship between CLA to B and FaFg.
Supplementary Figure 4. Correlation between in vitro estimated Fg values and in vivo human Fg values of CYP3A substrate drugs based on the two different estimation methods.
Supplementary Figure 5. Comparison of the metabolic activity mediated by CYP3A4/5 in the four independent experiments.
Supplementary Table 1. Source of chemicals used in this study.
Supplementary Table 2. Sequences of primers for mRNA quantification.
Supplementary Table 3. Analytical conditions for quantification of test compounds with LC–MS/MS.
Supplementary Table 4. MRM conditions for quantification of test compounds with LC–MS/MS.
Supplementary Table 5. Summary of the estimated intestinal availability (Fg) for CYP3A substrates based on Eq. (7).
- Supplemental Data -


