


Abstract
Tizanidine, a centrally acting skeletal muscle relaxant, is predominantly metabolized by CYP1A2 and undergoes extensive hepatic first-pass metabolism after oral administration. As a highly extracted drug, the systemic exposure to tizanidine exhibits considerable interindividual variability and is altered substantially when coadministered with CYP1A2 inhibitors or inducers. The aim of the current study was to compare the performance of a permeability-limited multicompartment liver (PerMCL) model, which operates as an approximation of the dispersion model, and the well stirred model (WSM) for predicting tizanidine drug-drug interactions (DDIs). Physiologically based pharmacokinetic models were developed for tizanidine, incorporating the PerMCL model and the WSM, respectively, to simulate the interaction of tizanidine with a range of CYP1A2 inhibitors and inducers. Whereas the WSM showed a tendency to underpredict the fold change of tizanidine area under the plasma concentration-time curve (AUC ratio) in the presence of perpetrators, the use of PerMCL model increased precision (absolute average-fold error: 1.32–1.42 versus 1.58) and decreased bias (average-fold error: 0.97–1.25 versus 0.63) for the predictions of mean AUC ratios as compared with the WSM. The PerMCL model captured the observed range of individual AUC ratios of tizanidine as well as the correlation between individual AUC ratios and CYP1A2 activities without interactions, whereas the WSM was not able to capture these. The results demonstrate the advantage of using the PerMCL model over the WSM in predicting the magnitude and interindividual variability of DDIs for a highly extracted sensitive substrate tizanidine.
SIGNIFICANCE STATEMENT This study demonstrates the advantages of the PerMCL model, which operates as an approximation of the dispersion model, in mitigating the tendency of the WSM to underpredict the magnitude and variability of DDIs of a highly extracted CYP1A2 substrate tizanidine when it is administered with CYP1A2 inhibitors or inducers. The physiologically based pharmacokinetic modeling approach described herein is valuable to the understanding of drug interactions of highly extracted substrates and the source of its interindividual variability.
Introduction
Tizanidine is an alpha-adrenergic agonist used in the treatment of spasticity due to spinal cord injury or multiple sclerosis (Wagstaff and Bryson, 1997). Orally administered tizanidine undergoes extensive presystemic metabolism via CYP1A2 in the liver, which leads to highly variable pharmacokinetics (PK) and susceptibility to drug-drug interactions (DDIs) in the population (Wagstaff and Bryson, 1997; Granfors et al., 2004a, 2004b; Backman et al., 2006a, 2006b, 2008; Henney 3rd and Runyan, 2008). It has been shown that CYP1A2 inhibitors, such as fluvoxamine and ciprofloxacin, significantly increase the exposure of tizanidine to a level where adverse drug reactions, including excessive sedation and severe hypotension, may occur (Granfors et al., 2004a, 2004b). The change in tizanidine exposure, when coadministered with CYP1A2 inhibitors, varies significantly between subjects. This can be partly explained by the interindividual variability of CYP1A2 activity, i.e., subjects with a high CYP1A2 activity, and low AUC of tizanidine without inhibitors tend to have a larger increase in tizanidine AUC when taking CYP1A2 inhibitors (Granfors et al., 2004a, 2004b).
Application of physiologically based pharmacokinetic (PBPK) modeling has become increasingly important in drug development over the past decade, particularly in the area of DDI predictions (Rowland et al., 2015; Luzon et al., 2017; Sato et al., 2017; Grimstein et al., 2019; Zhang et al., 2020). A key advantage of PBPK modeling is the ability to incorporate interindividual variability in physiologic and biochemical parameters (system parameters) so that it can predict PK in a population of individuals, rather than just making predictions for an average individual. Such population based PBPK modeling is particularly useful in assessing the impact of covariates on DDIs and identifying individuals with certain characteristics who are at greater risk of severe DDIs (Jamei et al., 2009; Yeo et al., 2013).
Alongside the variability in system parameters, the choice of the hepatic clearance model may also affect the predicted systemic exposure of substrate drugs and its interindividual variability. The most well characterized hepatic clearance models are the well stirred model (WSM, also known as the venous equilibration model), the parallel tube model, and the dispersion model (DM). Although the majority of PBPK models published in the literature or submitted to regulatory agencies have adopted the WSM, which has shown adequate predictive performance of metabolic DDIs in many cases, the DM is believed to better resemble the liver clearance function and has been shown to better describe hepatic clearance of highly extracted compounds than the WSM in preclinical species (Roberts and Rowland, 1986). However, the clinical advantage of the DM over the WSM in describing hepatic drug clearance remains unclear, partly because of the scarcity of clinical data on highly extracted probe substrates to discriminate between the DM and the WSM. Furthermore, it is mathematically cumbersome to incorporate the DM into an ordinary differential equation based PBPK framework to simulate DDIs. As a simplification, the tank-in-series structure has been proposed to be a reasonable approximation of the DM (Roberts et al., 1989; Anissimov and Roberts, 2002) and has been successfully applied in PBPK modeling for making predictions of the average magnitude of DDIs for a selection of compounds (Watanabe et al., 2009; Asaumi et al., 2018). Within this study, we have developed a permeability-limited multicompartment liver (PerMCL) model based on the tank-in-series structure and incorporated the PerMCL model in a population based PBPK framework to simulate the PK and DDI of tizanidine in a population of virtual individuals. The results are compared with those obtained using the WSM in the same PBPK model framework.
Materials and Methods
Clinical Data for the Assessment of PBPK Models
Clinical PK and DDI data of tizanidine were collated from the literature (Shellenberger et al., 1999; Granfors et al., 2004a, 2004b; Backman et al., 2006a, 2006b, 2008; Lilja et al., 2007; Karjalainen et al., 2008). The trial design information for the clinical studies used for performance verification is summarized in Supplemental Table 1. In cases where tizanidine data were presented in figures without exact numerical values (mean concentration-time profiles, AUC and AUC ratio for each individual), data were extracted using GetData Graph Digitizer (version 2.22, http://getdata- graph-digitizer.com).
Baseline Tizanidine PBPK Model Using the WSM
The population based PBPK Simulator (Simcyp Simulator Version 21 Release 1, Sheffield, UK) was used for the PBPK model development. The input parameters for the baseline PBPK model of tizanidine are summarized in Table 1. For the baseline model, the hepatic clearance of tizanidine was described using the inbuilt WSM as part of a whole body PBPK model. Simulations were performed to demonstrate that the baseline tizanidine model (with the WSM) was able to generate concentration-time profiles that were consistent with observed data before the model was used to predict clinical DDIs.
Input parameters for the initial tizanidine PBPK model with the well stirred model
Refinement of the Baseline Tizanidine PBPK Model Using the PerMCL Model
The baseline tizanidine PBPK model was then modified to substitute the PerMCL model for the WSM. A guidance is provided in Supplemental Methods to show how to switch between different liver models in the user interface of Simcyp human simulator (Supplemental Fig. 1). The model structure of the PerMCL model is shown in Fig. 1, and the differential equations are provided in Supplemental Methods. Briefly, the PerMCL model adopts the tank-in-series structure, which is commonly used as a compartmental approximation of the DM in PBPK models (Anissimov and Roberts, 2002; Asaumi et al., 2018). The liver is described by six segments of equal volume sequentially connected by hepatic blood flow. Drug metabolizing enzymes are assumed to be equally distributed across the six segments, i.e., all the segments contain the same amount of enzymes. Each segment is divided into three compartments representing the vascular space, the extracellular water (EW) compartment and the intracellular water (IW) compartment. The passive diffusion of drug molecules between the EW and IW compartments is described using a passive diffusion clearance (CLPD). Metabolic clearance of the compound is considered to occur in the IW compartment. Sensitivity analysis of the impact of the number of liver segments on the predicted oral clearance (CLpo) was performed to determine the optimal number of segments in the PerMCL model. More details are provided in the Supplemental Methods (Supplemental Figs. 2 and 3).

Structure of the Permeability-limited Multicompartment Liver (PerMCL) embedded within the Simcyp full PBPK model. Qha, Qpv, and Qh are hepatic artery, hepatic portal vein, and total hepatic blood flows, respectively. The liver is equally divided into six segments along the hepatic blood flow. Each segment contains three compartments representing the vascular space (VERSUS), extracellular water (EW) compartment, and intracellular water (IW) compartment. Instantaneous equilibrium is assumed between the VERSUS and EW compartments. For completeness, transporters are shown on the sinusoidal and canalicular membrane of the hepatocyte, although in the PBPK models for tizanidine no active transport was considered.
The tizanidine specific parameters for the PerMCL model are provided in Table 2. It should be noted that, although in principle CLPD,in vitro describes the passive diffusion of the drug across the sinusoidal membrane of hepatocytes and can be measured in vitro using human hepatocytes or predicted for some compounds based on a correlation with LogD7.4 (De Bruyn et al., 2018), in vivo mass balance data show that orally administered tizanidine is rapidly and almost completely absorbed (Tse et al., 1987), suggesting a reasonable passive permeability of the drug. Therefore, it was assumed that the passive diffusion of tizanidine across sinusoidal membrane was not limited by its permeability, and the CLPD,in vitro input for the tizanidine model was used as a means to more closely approximate the behavior of the DM rather than representing any actual permeability restriction that was measured in vitro. The behavioral similarity of the PerMCL model and the DM were evaluated based on predicted CLPO and fold change of AUC (AUC ratio) using these models over a range of hepatic intrinsic clearance (CLint,H) values. For AUC ratio predictions, CLint,H was reduced by 2-, 10-, and 50-fold from the baseline, respectively, to reflect the range of fold reductions of CYP1A2 CLint,H in the presence of the inhibitors investigated in this study. The dispersion number (DN) of the DM, which characterizes the degree of mixing within the liver, was chosen to be 0.2, 0.3, and 0.4, respectively, as these values reflected the typical range of the DN estimated using indicator dilution rat liver perfusion studies (Pang et al., 2019). To approximate the DM with each of the DN values, the CLPD,in vitro input of the PerMCL model was varied over a range of values and the values that replicated the behavior of the DM were identified.
Input parameters for the PerMCL of the refined tizanidine PBPK model
fuEW and fuIW are the unbound fractions of the drug in extracellular and intracellular compartments, respectively. For the tizanidine-ciprofloxacin DDI, study specific CYP1A2 CLint values of 5.5, 5.2, and 4.7 μl/min/pmol were used in the simulation to recover observed tizanidine AUC in the control arm of the clinical study when CLPD,in vitro was 0.2, 0.25, and 0.5, respectively. The simulations for DDI with the other perpetrators were performed using the global (default) CYP1A2 CLint.
Simulations were performed to demonstrate that the refined tizanidine model (with the PerMCL model) was able to generate concentration-time profiles in the absence of inhibitors or inducers that were consistent with the observed data.
Simulating DDIs between Tizanidine and CYP1A2 Inhibitors or Inducers
DDIs between tizanidine and three CYP1A2 inhibitors (ciprofloxacin, rofecoxib, and fluvoxamine) or two inducers (smoking and rifampicin) were simulated according to the trial designs of the published clinical studies (Granfors et al., 2004a, 2004b; Backman et al., 2006a, 2006b, 2008). For each simulation, 10 separate trials were generated to assess the variability of PK in the population. The age range, proportion of females and males, and the number of subjects in each simulated trial were matched to the published information on the corresponding clinical trial. The PBPK models for ciprofloxacin, fluvoxamine, and rifampicin were the default library files within the Simcyp Simulator. The PBPK model for rofecoxib was adopted from the literature (Jogiraju et al., 2021). In this study, all of the perpetrator PBPK models were developed using the WSM, and the effect of using the PerMCL model for the perpetrators on the predicted DDIs, if any, was anticipated to be minimal. This was because these perpetrators were low to moderate extraction drugs, and the driving concentration of enzyme inhibition would be similar between the WSM (unbound drug concentration in the emergent blood) and the PerMCL model (unbound intracellular concentration) for these drugs. Such similarity was demonstrated in a simulation performed for ciprofloxacin (Supplemental Fig. 4).
The induction effect of smoking on CYP1A2 expression was accounted for by increasing the CYP1A2 abundance by 1.62-fold based on the reported fold increase in caffeine clearance in smokers who smoke between 10 and 19 cigarettes/day (Plowchalk and Rowland Yeo, 2012).
A Generalized Comparison of the WSM and the DM for AUC Ratios Calculated Using Static Equations
To enable a generalized comparison between the WSM and the DM for their behavioral differences in predicting DDIs and to demonstrate the hepatic clearance characteristics that differentiate the models, AUC ratios of orally administered substrates in the presence and absence of enzyme inhibition were calculated using the static equations of the WSM and DM. Briefly, a range of baseline hepatic intrinsic clearances (CLint,H) were incorporated into the static equations for the WSM and the DM to simulate substrates with hepatic extraction ratios (EH) ranging from 0.01 to 0.95. Since hepatic metabolism was considered as the only elimination route of the substrates in this analysis, the fraction of the substrate CLint,H mediated by the inhibited enzyme was equal to fm, which was varied between 0 to 1 at each level of EH. The baseline CLint,H mediated by the enzyme being inhibited (CLint,H × fm) were reduced by 2-fold and 20-fold, to account for the effect of enzyme inhibition using the static equations. Oral clearances (CLPO) were calculated using the baseline CLint,H and inhibited CLint,H, assuming complete absorption and no extrahepatic elimination. AUC ratio was calculated as the ratio of baseline CLPO to inhibited CLPO using the WSM (AUC RatioWSM) and DM (AUC RatioDM). The effect of varying EH (0.01–0.95) and fm (0–1) on the ratio of AUC RatioDM to AUC RatioWSM was visualized using MATLAB 2019b (Mathworks Inc.; Natick, MA). The ratios of AUC RatioDM to AUC RatioWSM were also calculated for alprazolam, midazolam, and tizanidine, representing low, moderate, and high extraction compounds. The DN for the DM was set to 0.3 in this analysis. The EH and fm values for alprazolam and midazolam were adopted from Simcyp library models (EH = 0.04, fmCYP3A4 = 0.70 for alprazolam, EH = 0.44, fmCYP3A4 = 0.88 for midazolam), whereas those for tizanidine were from the PBPK model described herein (EH = 0.84, fmCYP1A2 = 0.96). The static equations for the DM are provided in the Supplemental Methods, whereas those for WSM were adopted from the literature (Pang et al., 2019).
Data Analysis
For the DDI simulations using PBPK models, the ratio of the substrate AUC in the absence and the presence of an inhibitor or an inducer (AUC0–∞, interaction/AUC0–∞, control) is used to determine the DDI level. In this study, the means of AUC ratios and Cmax ratios from the 10 simulated trials using PBPK models were compared against the means of AUC ratios and Cmax ratios from each clinical DDI study. The predictive performance of the models was evaluated using the average-fold error (AFE) and absolute average-fold error (AAFE) as measures of bias and precision, respectively, using the following equations.

 where obs is observed AUC ratio or Cmax ratio and pred is predicted AUC ratio or Cmax ratio. In addition, the acceptance criteria proposed by Guest et al. (2011) was also used. This is a more sensitive measure of concordance in reflecting absolute changes in AUC, especially when these are small (Guest et al., 2011).
In addition, simulated range of AUC ratios in the virtual population was compared with the observed range when the range was available in the literature. Spearman correlation coefficient between AUC ratio and AUC of tizanidine in the control arm was calculated using the R software (https://www.R-project.org/).
Results
Approximation of the DM Using the PerMCL Model
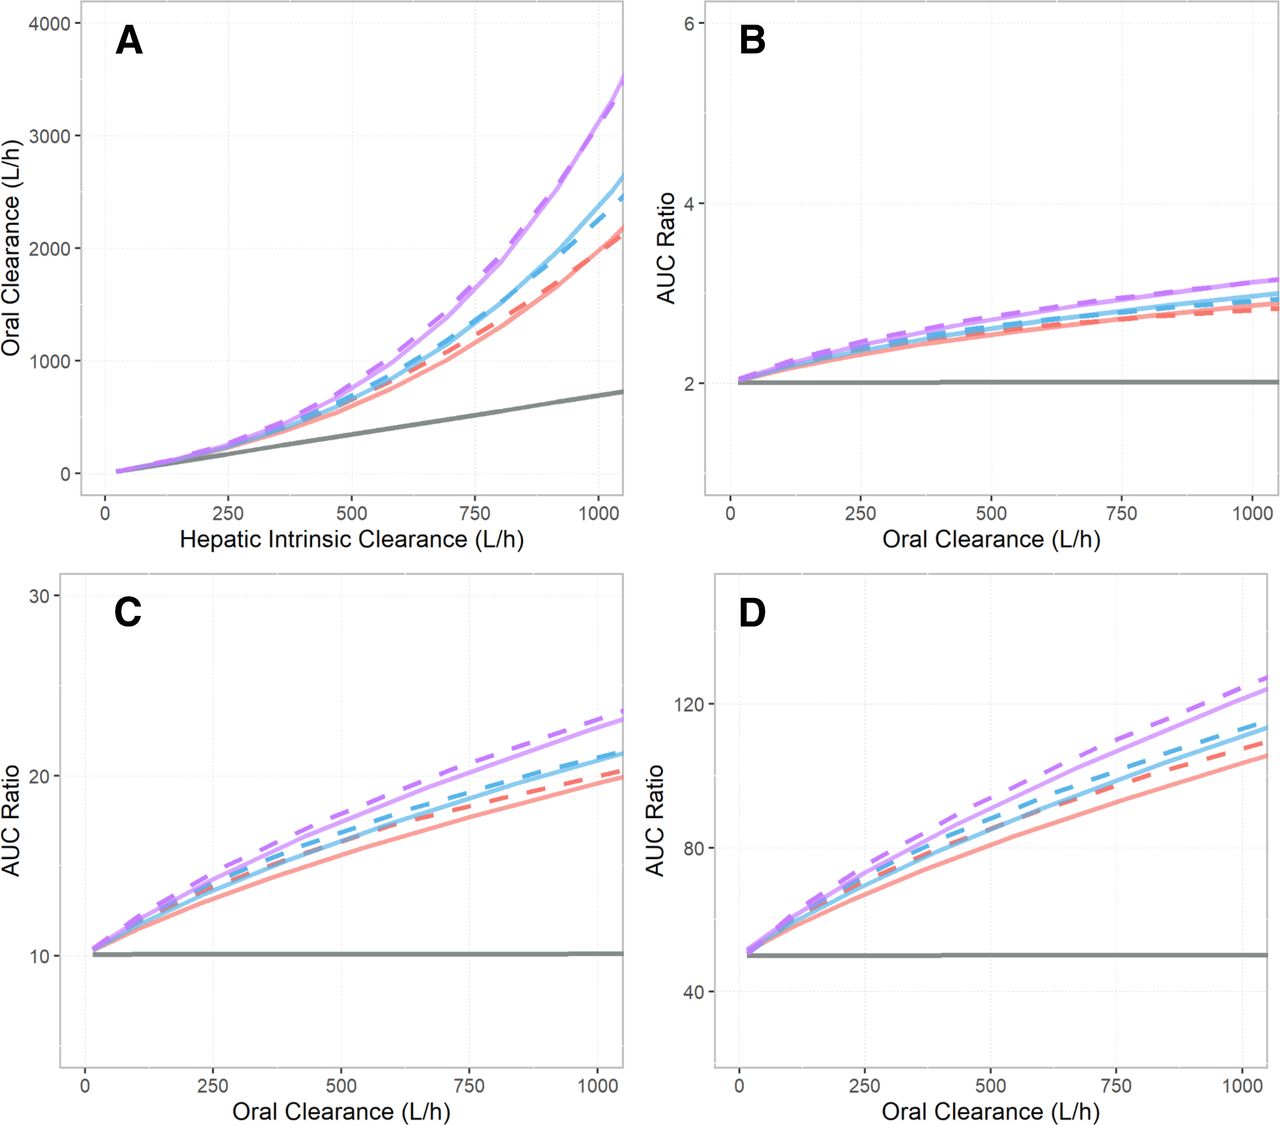
The oral clearance (CLPO) predictions for tizanidine using the WSM, the DM, and the PerMCL model over a range of baseline hepatic intrinsic clearances (CLint,H) are shown in Fig. 2A. The relationships between the predicted AUC ratio and baseline CLPO using the WSM, the DM, and the PerMCL model with 2-fold, 10-fold, and 50-fold reductions of baseline CLint,H are shown in Fig. 2, B–D. The predicted CLPO using the WSM exhibited a linear relationship with baseline CLint,H. As a result, for the WSM model, the AUC ratio was predicted to be constant with respect to baseline CLPO. By contrast, the predicted CLPO using the DM showed a nonlinear relationship with baseline CLint,H, which gradually deviated from the WSM predictions with higher baseline CLint,H. As a result, the DM model predicted higher AUC ratio compared with the WSM for higher baseline CLPO.

Comparison of model behavior between the well stirred model (WSM) (gray solid line), the dispersion model (DM) (red, blue, and purple solid lines), and the Permeability-limited Multicompartment Liver (PerMCL) model (red, blue, and purple dashed lines). (A) Oral clearances predicted by the WSM, the DM, and the PerMCL model over a range of hepatic intrinsic clearance (CLint,H) inputs. (B–D) The relationship between fold increases in AUC (AUC ratio) and baseline oral clearance predicted using the WSM, the DM, and the PerMCL model. AUC ratios were calculated when CLint,H was reduced by (B) 2-fold, (C) 10-fold, and (D) 50-fold from the baseline CLint,H, respectively. The PerMCL model predictions are shown for in vitro passive diffusion clearance (CLPD,in vitro) of 0.2 (red dashed line), 0.25 (blue dashed line), and 0.5 (purple dashed line) ml/min/million hepatocytes, respectively. The DM predictions are shown for dispersion number (DN) of 0.4 (red solid line), 0.3 (blue solid line), and 0.2 (purple solid line), respectively.
The PerMCL model was used to approximate the DM for describing hepatic clearance of tizanidine. To identify the closest approximation, the passive diffusion clearance between the EW and IW compartments (CLPD,in vitro) of the PerMCL model was varied to adjust the operating concentration of hepatic metabolism (unbound drug concentration in the IW compartment), and consequently, the predicted hepatic clearance, CLPO and AUC ratio. As CLPD,in vitro was varied from 0.5 to 0.2 ml/min/million hepatocytes, the PerMCL model provided reasonable approximation of the DM with DN ranging from 0.2 to 0.4. Hence, CLPD,in vitro values of 0.2, 0.25, and 0.5 ml/min/million hepatocytes were incorporated into the refined tizanidine model as approximations of the DM with a DN of 0.4, 0.3, and 0.2, respectively, for subsequent simulations.
Simulated Plasma Exposure of Tizanidine
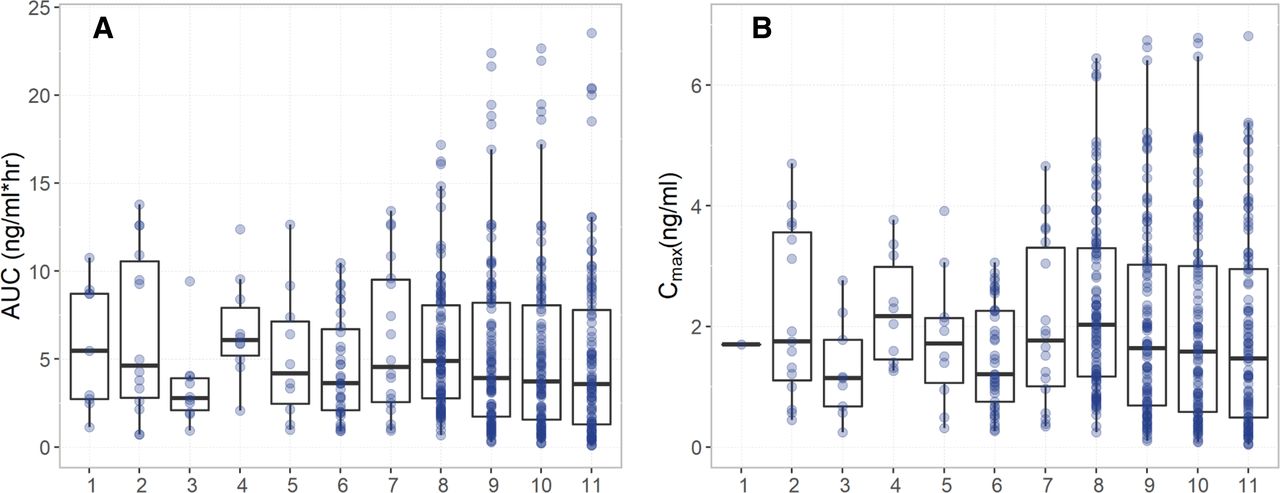
The performance of the tizanidine PBPK models developed using the WSM and the PerMCL model in Simcyp Simulator was evaluated by comparing simulated plasma concentrations of tizanidine to the observed data from a number of clinical studies (Shellenberger et al., 1999; Granfors et al., 2004a, 2004b, 2005; Backman et al., 2006a, 2006b, 2008; Lilja et al., 2007; Karjalainen et al., 2008). For the tizanidine model developed using the PerMCL model with a CLPD,in vitro of 0.25 ml/min/million hepatocytes, the simulated plasma concentration-time profiles after single oral doses of 1, 2, and 4 mg tizanidine and multiple oral doses of 4 mg tizanidine (once every 8 hours) were in good agreement with clinically observed concentration-time profiles (Fig. 3). The WSM as well as the PerMCL model with a CLPD,in vitro of 0.2 and 0.5 ml/min/million hepatocytes showed comparable performance with the PerMCL model with a CLPD,in vitro of 0.25 ml/min/million hepatocytes in predicting plasma concentration-time profiles of tizanidine without drug interactions (Supplemental Fig. 5). Both the WSM and the PerMCL model recovered the observed ranges of AUC and Cmax after a single oral dose of 4 mg tizanidine, and the PerMCL model simulated larger variabilities in AUC and Cmax than the WSM (Fig. 4). The means of AUC and Cmax predicted using the WSM and the PerMCL model were within 2-fold of the observed mean data for all of the seven study arms and within 1.5-fold for six of the seven study arms (Supplemental Tables 2 and 3).

Simulated (black line) and observed (data points) mean plasma concentration-time profiles of tizanidine after a single oral dose of (A–B) 1 mg, (C–D) 2 mg, (E–F) 4 mg, and (G–H) multiple oral doses of 4 mg tizanidine (once every 8 hours). Simulations were performed using the refined tizanidine model developed with the PerMCL model with a CLPD,in vitro of 0.25 ml/min/million hepatocytes. Gray shaded areas represent 5th to 95th percentile of the total virtual population (10 trials of 10 subjects). The right hand panel shows the data with the y-axis on a logarithmic scale. Observed data were compiled from literature (Shellenberger et al., 1999; Granfors et al., 2004a, 2004b, 2005; Backman et al., 2006a, 2006b, 2008; Lilja et al., 2007; Karjalainen et al., 2008).

Observed (1–7) and simulated (8–11) (A) AUC and (B) Cmax values of each individual after a single oral dose of 4 mg tizanidine. Observed data were compiled from literature: (1) (Backman et al., 2006b); (2) (Granfors et al., 2005); (3) (Granfors et al., 2004b); (4) (Granfors et al., 2004a); (5) (Backman et al., 2006a); (6) (Backman et al., 2008), Male nonsmokers; (7) (Backman et al., 2008), Female nonsmokers. Simulated data were from (8) WSM and (9–11) PerMCL model with a CLPD,in vitro of 0.2, 0.25, and 0.5 ml/min/million hepatocytes, respectively.
Simulated DDIs between Tizanidine and CYP1A2 Inhibitors or Inducers
The DDIs between tizanidine and a range of CYP1A2 inhibitors or inducers were predicted using the WSM and the PerMCL model. For the tizanidine-ciprofloxacin DDI study, it was observed that the subjects in this study were associated with stronger CYP1A2 activity and lower AUC of tizanidine in the control arm (AUC control) than those from the other studies (mean AUC of 3.4 versus 4.5–6.6 ng×h/ml). As a result, both the WSM and the PerMCL model overpredicted AUC control for this study. The reason for this was unclear as none of the subjects were smokers or used any continuous medication that could induce CYP1A2 activity. A possible explanation was that the CYP1A2 status of the subjects enrolled in this study was not representative of that of the general population; therefore, study specific CYP1A2 CLint values were used in the models to ensure that the simulations well reflected the CYP1A2 status of the subjects from this particular study so that any effect of CYP1A2 status on the predicted AUC ratio could be accounted for in the simulations. Hence, additional simulations were performed using study specific CYP1A2 CLint to capture the observed mean AUC control in the tizanidine-ciprofloxacin DDI study. In these simulations, CYP1A2 CLint was 11.4 μl/min/pmol for the WSM and was 5.5, 5.2, and 4.7 μl/min/pmol for the PerMCL model with a CLPD,in vitro of 0.2, 0.25, and 0.5 ml/min/million hepatocytes, respectively. Predicted versus observed mean AUC and Cmax ratios of tizanidine in the presence of a range of CYP1A2 inhibitors and inducers are shown in Fig. 5.

A comparison of the observed and predicted mean ratios for (A–C) AUC and (D–F) Cmax of tizanidine with fluvoxamine (diamonds), rofecoxib (squares), ciprofloxacin (circles), smoking (crosses), and rifampicin (triangles). The predictions using the global and study specific CYP1A2 CLint inputs for the tizanidine-ciprofloxacin DDI are shown with closed circles and open circles, respectively. The ratios simulated using well stirred model (WSM) and the permeability-limited multicompartment liver (PerMCL) model are represented by blue and red symbols, respectively. The input values for CLPD,in vitro of the PerMCL model were (A and D) 0.2, (B and E) 0.25, and (C and F) 0.5 ml/min/million hepatocytes, respectively. The lines of unity (black line) and 0.5- to 2.0-fold error (gray dashed line) as well as the acceptance criteria proposed by Guest et al. (2011) (gray-shaded area) are shown.
The AFE and AAFE, as measures of bias and precision, respectively, are shown in Table 3. Use of the PerMCL model resulted in increased precision (AAFE 1.32–1.42 versus 1.58) and decreased bias (AFE 0.97–1.25 versus 0.63) for the prediction of AUC ratios compared with the WSM. In addition, when CLPD,in vitro values were 0.2 and 0.25 ml/min/million hepatocytes, the PerMCL model showed slightly increased precision for the prediction of Cmax ratio (AAFE 1.20–1.22 versus 1.31) and predicted less biased Cmax ratios compared with the WSM (AFE 1.07–1.16 versus 0.78). However, when CLPD,in vitro was 0.5 ml/min/million hepatocytes, the PerMCL model showed a tendency to overpredict Cmax ratios (AFE 1.41).
Summary of the bias and precision of DDI predictions using the WSM and the PerMCL model with different settings
When study specific CYP1A2 CLint was considered in the simulations for the tizanidine-ciprofloxacin DDI, the PerMCL model showed further increased precision (AAFE 1.27–1.35) with comparable AFE (1.00–1.31) for AUC ratio predictions, whereas the WSM showed no improvement in precision (AAFE 1.62) and bias (AFE 0.62) as compared with the predictions using the global CYP1A2 CLint. However, for Cmax ratio predictions, both the WSM and PerMCL model showed limited or no improvement in AAFE and AFE with study specific CYP1A2 CLint compared with the global CYP1A2 CLint.
The means of AUC in the presence of perpetrators were predicted within 2.0-fold of the observed data for all of the five DDI studies and within 1.5-fold for only two of the five DDI studies when using the WSM. The use of the PerMCL model improved the predictions with the means of AUC in the presence of perpetrators predicted within 1.5-fold for all of the five DDI studies. Similarly, both the WSM and the PerMCL model predicted the means of Cmax in the presence of perpetrators within 2.0-fold of the observed data for all of the five DDI studies, three of the five DDI studies were predicted within 1.5-fold using the WSM and four of the five DDI studies were predicted within 1.5-fold using the PerMCL model (Supplemental Tables 2 and 3).
Simulated Interindividual Variability of AUC Ratio
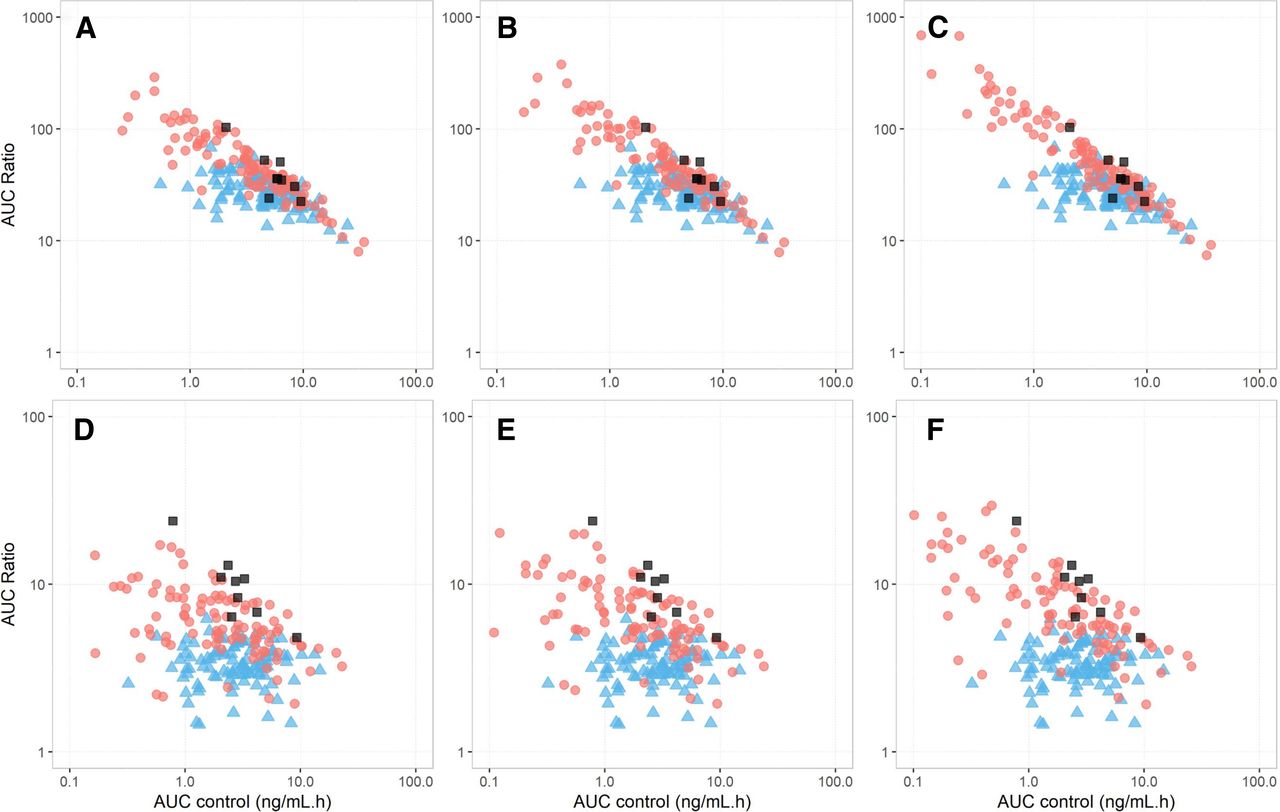
The observed and predicted individual AUC ratios versus AUC without interaction (AUC control) for the tizanidine-ciprofloxacin and tizanidine-fluvoxamine interaction studies are shown in Fig. 6. The observed tizanidine AUC ratios varied substantially between individuals, ranging from 5.63 to 23.9 and 13.7 to 103 with concomitant ciprofloxacin and fluvoxamine, respectively. Although the WSM reasonably predicted the mean AUC ratio of tizanidine for the tizanidine-fluvoxamine DDI (predicted mean 30.9 versus observed mean 40.5), it was unable to recover the range of AUC ratios (predicted range 12.8–66.5 versus observed range 13.7–103). By contrast, the PerMCL model recovered the observed mean and range of AUC ratios for the tizanidine-fluvoxamine DDI when a CLPD,in vitro of 0.2 ml/min/million hepatocytes was considered in the simulation (predicted mean 64.00 versus observed mean 40.5; predicted range 12.9–299 versus observed range 13.7–103). For the tizanidine-ciprofloxacin DDI, the WSM underpredicted the mean AUC ratio by more than 3-fold and failed to recover the observed range of AUC ratios irrespective of whether global or study specific CYP1A2 CLint was used in the simulation (predicted range 2.27–5.95 or 1.45–6.21 versus observed range 5.63–23.9). The PerMCL model, on the other hand, reasonably recovered the magnitude of DDIs with all model settings as compared with the WSM, with predicted mean AUC ratios within 1.4–1.8- and 1.1–1.5-fold deviation from the observed data when global and study specific CYP1A2 CLint inputs were used in the simulation, respectively. When a CLPD,in vitro of 0.5 ml/min/million hepatocytes and a study specific CYP1A2 CLint were considered in the simulation, the PerMCL model successfully recovered the observed mean AUC ratios (predicted mean 9.20 versus observed mean 9.76), and covered the observed range of AUC ratios (predicted range 1.92–43.5 versus observed range 5.63–23.9).

Observed and predicted individual AUC ratios versus AUC values in the control arm (AUC control) when tizanidine was coadministered with (A–C) fluvoxamine and (D–F) ciprofloxacin. The individual data simulated using the well stirred model (WSM) and the Permeability-limited Multicompartment Liver (PerMCL) are represented by blue triangles and red circles, respectively. Observed individual data are shown with dark gray squares. The input values for CLPD,in vitro of the PerMCL model were (A and D) 0.2, (B and E) 0.25, and (C and F) 0.5 ml/min/million hepatocytes, respectively.
The observed AUC ratios exhibited a strong correlation with tizanidine AUC control (Spearman’s correlation coefficient of -0.77 for both DDI studies); however, the WSM predicted no or weak correlation between AUC ratios and AUC control (Spearman’s correlation coefficient of 0.03 and -0.54 for the DDIs with ciprofloxacin and fluvoxamine, respectively). By contrast, the PerMCL model captured the strong correlations between the AUC ratios and the AUC control with all model settings investigated herein, predicting Spearman’s rho values from −0.59 to -0.74 and from -0.90 to -0.95 for the DDIs with ciprofloxacin and fluvoxamine, respectively.
A Generalized Comparison of the WSM and the DM for the Effect of Fm and Hepatic Extraction Ratio on AUC Ratios Calculated Using Static Equations
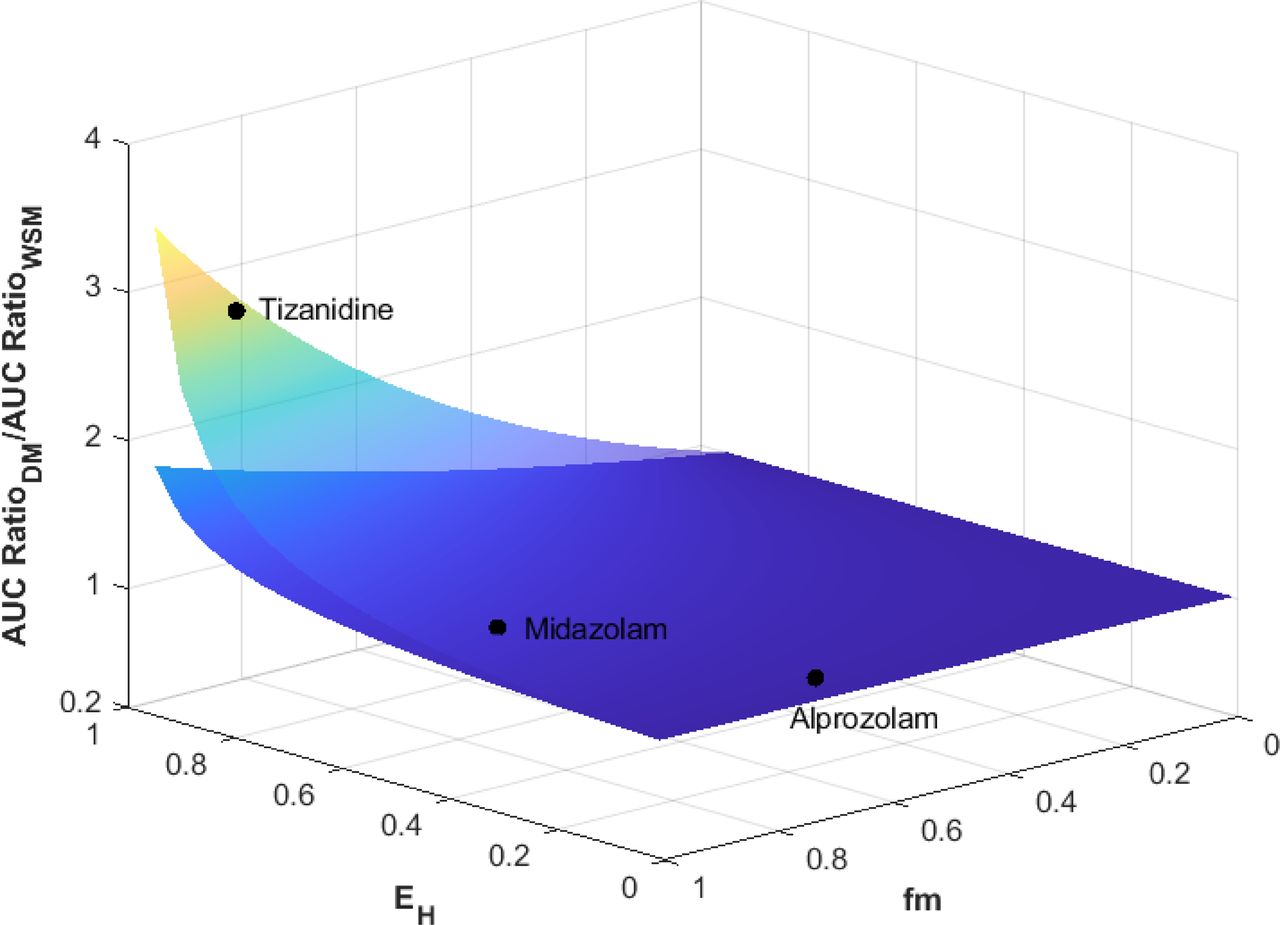
The comparison of AUC ratios predicted using the DM (AUC RatioDM) and the WSM (AUC RatioWSM) with varying fm and extraction ratio (EH) is shown in Fig. 7. When a 20-fold reduction of CLint,H was considered, the AUC ratios of low extraction substrates (EH < 0.3) predicted by the WSM and DM only showed up to 11% difference regardless of the fm of the inhibited enzyme. For moderate extraction substrates (0.3 < EH < 0.7), AUC RatioDM was up to 1.5-fold higher than AUC RatioWSM when fm = 1 and EH = 0.7. In the extreme case of a highly extracted (EH = 0.95) and highly sensitive (fm = 1) substrate, AUC RatioDM was 3.5-fold higher than AUC RatioWSM. In general, for a substrate with EH and fm both below 0.8, the use of DM only showed marginal difference from WSM in DDI prediction (< 1.5-fold), even when a 20-fold reduction in CLint,H was considered. When a twofold reduction in CLint,H was considered, AUC RatioDM was within twofold of AUC RatioWSM even in the extreme cases of highly extracted and highly sensitive substrates.

Comparison of AUC ratios predicted by dispersion model (AUC RatioDM) and well stirred model (AUC RatioWSM) with varying fm and extraction ratio (EH). The lower and upper surfaces represent 2-fold and 20-fold reductions in the hepatic intrinsic clearance mediated by the inhibited pathway.
Discussion
In the present study, the performance of the PerMCL model, which operates as an approximation of the DM, was investigated and compared with that of the WSM. When the PerMCL model was used to simulate the DDIs between tizanidine and a range of CYP1A2 inhibitors and inducers, there was a decrease in bias and an increase in precision compared with the predictions of the WSM. Furthermore, the PerMCL model successfully captured the observed range of AUC ratios and the covariate effect of baseline CYP1A2 activity on the magnitude of DDIs, both of which the WSM failed to recover.
In addition to the improved predictive accuracy that favored the PerMCL over the WSM as the hepatic clearance model for tizanidine, the data from the DDI between ciprofloxacin and tizanidine showed the limitations of the WSM, whereby the mean AUC ratio of tizanidine when coadministered with ciprofloxacin was underpredicted by more than threefold. To confirm the role of hepatic clearance model in the underprediction, other possible sources of inaccuracy were excluded through a systematic evaluation. On the substrate side, underestimation of the fm for the enzymes being inhibited is a common cause of underestimation of DDIs. In the case of tizanidine, the CYP1A2 fm was predicted to be 96% while the only other elimination pathway is renal, which only accounted for a minor portion of the in vivo clearance of tizanidine. In a what-if analysis, increasing the CYP1A2 fm to 100% had negligible effect on the predicted AUC ratio. Hence, fmCYP1A2 is unlikely to be the reason for the underpredicted DDI. On the inhibitor side, the simulated exposure of ciprofloxacin was reasonably consistent with the observed data from the ciprofloxacin-tizanidine DDI study (predicted AUC of 11.4 mg×h/l versus observed AUC of 7.8 mg×h/l). The ciprofloxacin model, as a CYP1A2 competitive inhibitor, was previously verified using independent clinical DDIs with a range of other CYP1A2 substrates (Jogiraju et al., 2021). Taken together, the evaluation showed that the underprediction of AUC ratios by the WSM was not due to the aforementioned common sources of predictive error. Furthermore, based on the simulation in a population of 100 virtual individuals, the WSM failed to capture the observed correlation between baseline CYP1A2 activity and AUC ratio. In summary, the discrepancies between the observations and the predictions by the WSM showed the need of an alternative hepatic clearance model for tizanidine.
The DM, as an alternative hepatic drug clearance model, assumes a dispersive internal vascular flow in the liver as compared with the WSM that assumes a bulk vascular flow. The different assumptions associated with these models lead to different degrees of mixing and unbound drug concentration within the liver (Pang et al., 2019), and consequently different behaviors in predicting CLPO and DDIs. As has been shown in the literature (Chiba et al., 2009) as well as in the present study, the CLPO predicted using the WSM exhibits a linear relationship with CLint,H. This is due to the well established feature of the WSM that the plasma CLPO is the product of fraction unbound in plasma (fu,p) and CLint,H when fa×Fg = 1 and extrahepatic elimination is negligible. As a result, the WSM model always predicts the same fold change in CLPO as the fold change in CLint,H irrespective of the level of baseline CLint,H. Therefore, the AUC ratio, which is the reciprocal of the fold change in CLPO, is independent of the baseline CLint,H and CLPO. Such model behavior coincides with the fact that increasing the variability of CYP1A2 expression for the WSM did not improve the predicted range of AUC ratios for the fluvoxamine-tizanidine DDI study (Supplemental Table 4). By contrast, the DM predicts a nonlinear relationship between CLPO and CLint,H, whereby CLPO increases disproportionately to the change of CLint,H, especially for high clearance substrates. As a result, when the same fold change in CLint,H is considered, the DM predicts greater fold changes in CLPO and AUC than the WSM, especially when the baseline CLPO is high (Fig. 2, B–D). Based on the preclinical evidence (Roberts and Rowland, 1986), the DM is considered to be a more appropriate hepatic clearance model for highly extracted compounds. In this study, the PerMCL model, which operates as a reasonable approximation of the DM, was used as an alternative model to predict the DDIs of tizanidine. A comparison between the WSM and the PerMCL showed that the mean data of tizanidine AUC and Cmax simulated using both models were broadly consistent with observed data when tizanidine was administered alone. However, the AUC and Cmax simulated using the PerMCL exhibited higher variabilities than the WSM, reflecting the model behavior demonstrated in Fig. 2A that the same range of CLint,H on the x-axis tends to lead to a wider range of CLPO on the y-axis with the PerMCL model than with the WSM. In addition, due to the behavioral differences between the WSM and the PerMCL model, the PerMCL model mitigated the tendency of the WSM to underpredict DDIs of tizanidine, and successfully captured the correlation between the AUC ratio and the baseline CYP1A2 activity in the population. These findings indicate that, for the DDI assessment of a highly extracted substrate, PerMCL may mitigate the risk of underestimating DDIs and is useful to identify individuals who are at greater risk of severe DDIs taking into account their baseline enzyme activity as a covariate of DDI susceptibility.
To select appropriate hepatic clearance models for DDI predictions, the elimination characteristics of the substrate should be taken into consideration. Although the results in the present study show that the DM (PerMCL model) is more appropriate than the WSM for a highly extracted (EH > 0.7) sensitive CYP1A2 substrate, the use of the DM (PerMCL model) for low (EH < 0.3) and moderately (0.3 < EH < 0.7) extracted substrates will most likely lead to limited difference to the WSM. In fact, for a substrate that is predominantly metabolized in the liver, EH and fm of the enzyme being inhibited are the main factors that differentiate the PerMCL model and the DM from the WSM, with appreciable difference shown for highly extracted sensitive substrates only. Hence, the WSM still appears to be an appropriate model for the majority of the substrates and should be considered in the first instance when using PBPK models for DDI assessment.
Although the present study is focused on a compound that is predominantly cleared through hepatic metabolism, further investigation is required to demonstrate the utility of the PerMCL for handling other scenarios. In the case of active transport in the liver, biliary clearance mediated by canalicular efflux transporters such as P-gp can be handled the same way as metabolism with the PerMCL model, as both processes remove drug from the liver. For sinusoidal uptake transporters, it is important that reliable data on passive diffusion, active uptake, and metabolism are incorporated into the model. Further expansion of the PerMCL model to allow variable number of segments may provide flexibility for handling active transport, where the number of segments can be adjusted as an alternative to CLPD,in vitro to approximate the DM, whereas CLPD,in vitro can be related to the actual passive permeability of the drug. Finally, if a substrate undergoes both hepatic and extrahepatic elimination, although the approach described herein still applies, it is important to differentiate the contributions of hepatic and extrahepatic pathways so that the in vivo fm of the enzyme being inhibited is accurately captured in the model. In all of the aforementioned scenarios, it is anticipated that the PerMCL tends to predict greater magnitude of DDIs for high liver extraction substrates than the WSM or a single-segment permeability-limited liver model. Additional case studies should be collated with a view to demonstrating the utility of the PerMCL model in handling these substrates with various disposition mechanisms.
In this study, the PerMCL model was used to approximate the DM with a DN of 0.2, 0.3, and 0.4, respectively. The range of the DN investigated herein (0.2–0.4) was informed by those estimated using indicator dilution rat liver perfusion studies (Pang et al., 2019). Given the importance of DN in simulation outcomes, more mechanistic understanding of DN and its variability will benefit the assessment of DDIs for highly extracted substrates. In addition, the results presented for tizanidine indicate the need of a systematic evaluation of the performance of the PerMCL model using more substrate drugs that are highly extracted.
In summary, the results show the PerMCL model, which operates as an approximation of the DM, is important for capturing the magnitude and population variability of DDIs for tizanidine as compared with the WSM. The PerMCL model is a more appropriate hepatic drug clearance model than the WSM for assessing DDI risks of highly extracted sensitive substrates that are predominantly cleared in the liver and for identifying individuals who are likely to be exposed to severe DDIs in the population.
Acknowledgments
The authors thank Eleanor Savill for her assistance in the preparation and submission of the article.
Authorship Contributions
Participated in research design: Zhang, Fisher, Gardner, Pan, Kilford, Bois, Jamei.
Conducted Experiments: Zhang, Fisher, Gardner, Pan, Kilford, Bois, Jamei.
Performed data analysis: Zhang, Fisher, Gardner, Pan, Kilford, Bois, Jamei.
Wrote or contributed to the writing of the manuscript: Zhang, Fisher, Gardner, Pan, Kilford, Bois, Jamei.
Footnotes
- Received December 15, 2021.
- Accepted April 5, 2022.
All authors were employees of Certara UK Limited at the time the work was conducted and may hold shares in Certara. The activities of Certara UK, Simcyp Division are supported by the Simcyp Consortium of pharmaceutical companies.
This project has received funding from the European Union's Horizon 2020 Research and Innovation Programme [Grant 681002] (Eu-ToxRisk).
↵
 This article has supplemental material available at dmd.aspetjournals.org.

Abbreviations
- AAFE
- absolute average-fold error
- AFE
- average-fold error
- AUC
- area under the plasma concentration-time curve
- CLint
- intrinsic clearance
- CLint, H
- hepatic intrinsic clearance
- CLPD
- passive diffusion clearance
- CLPD, in vitro
- passive diffusion clearance measured in vitro
- CLPO
- oral clearance
- DDI
- drug-drug interaction
- DM
- dispersion model
- DN
- dispersion number
- EH
- hepatic extraction ratio
- EW
- extracellular water
- fm
- fraction of the systemic clearance of a drug mediated by a given enzyme
- IW
- intracellular water
- PBPK
- physiologically based pharmacokinetic
- PerMCL
- permeability-limited multicompartment liver
- PK
- pharmacokinetics
- WSM
- well stirred model
- Copyright © 2022 by The Author(s)
This is an open access article distributed under the CC BY-NC Attribution 4.0 International license.


