


Visual Overview

Abstract
We report herein an in-depth analysis of the metabolism of the novel myeloperoxidase inhibitor AZD4831 ((R)-1-(2-(1-aminoethyl)-4-chlorobenzyl)-2-thioxo-2,3-dihydro-1H-pyrrolo[3,2-d]pyrimidin-4(5H)-one) in animals and human. Quantitative and qualitative metabolite profiling were performed on samples collected from mass balance studies in rats and humans. Exposure of circulating human metabolites with comparable levels in animal species used in safety assessment were also included. Structural characterization of 20 metabolites was performed by liquid chromatography high-resolution mass spectrometry, and quantification was performed by either 14C analysis using solid phase scintillation counting or accelerator mass spectrometry and, where available, authentication with synthesized metabolite standards. A complete mass balance study in rats is presented, while data from dogs and human are limited to metabolite profiling and characterization. The metabolism of AZD4831 is mainly comprised of reactions at the primary amine nitrogen and the thiourea sulfur, resulting in several conjugated metabolites with or without desulfurization. A carbamoyl glucuronide metabolite of AZD4831 (M7) was the most abundant plasma metabolite in both human healthy volunteers and heart failure patients after single and repeated dose administration of AZD4831, accounting for 75%–80% of the total drug-related exposure. Exposures to M7 and other human circulating metabolites were covered in rats and/or dogs, the two models most frequently used in the toxicology studies, and were also highly abundant in the mouse, the second model other than rat used in carcinogenicity studies. The carbamoyl glucuronide M7 was the main metabolite in rat bile, while a desulfurized and cyclized metabolite (M5) was abundant in rat plasma and excreta.
SIGNIFICANCE STATEMENT The biotransformation of AZD4831, a novel myeloperoxidase inhibitor inhibiting xanthine derivative bearing thiourea and primary aliphatic amine functions, is described. Twenty characterized metabolites demonstrate the involvement of carbamoylation with glucuronidation, desulfurization, and cyclization as main biotransformation reactions. The carbamoyl glucuronide was the main metabolite in human plasma, likely governed by a significant species difference in plasma protein binding for this metabolite, but this and other human plasma metabolites were covered in animals used in the toxicity studies.
Introduction
AZD4831 ((R)-1-(2-(1-aminoethyl)-4-chlorobenzyl)-2-thioxo-2,3-dihydro-1H-pyrrolo[3,2-d]pyrimidin-4(5H)-one) is a novel, potent, and selective myeloperoxidase (MPO) inhibitor in clinical development for cardiovascular, renal, and metabolic diseases. A battery of preclinical in vitro and in vivo tests were conducted to study the efficacy and safety of AZD4831 during its advancement through the early discovery phase, which is comprehensively described elsewhere (Inghardt et al., 2022). AZD4831 was selected as a development candidate primarily because of high potency toward MPO (IC50, 1.5 nM in vitro) and selectivity (>450-fold versus thyroid peroxidase, in vitro), the mechanism of irreversible inhibition, and a favorable safety profile. In addition, AZD4831 has good physicochemical properties with logD of 1.2, high permeability, and solubility at pH 7.4 (270 µmol/L). AZD4831 displayed favorable pharmacokinetics in rats and dogs (good bioavailability and moderate clearance), the species used in toxicity studies. Several phase I clinical studies were completed in which AZD4831 was generally well tolerated (Gan et al., 2019; Nelander et al., 2021).
The structure of AZD4831, shown in Fig. 1, is characterized by a thiourea moiety and a side chain bearing a primary aliphatic amine expected to undergo challenging but equally interesting biotransformations related to these moieties. Interpretation of data acquired by high-resolution mass spectrometry (HRMS) and elucidation of the mass spectral fragmentation pathways of metabolites, some of which were strengthened with synthesized reference standards, facilitated the characterization of the metabolite pathways of AZD4831. Special attention was given to metabolites in safety testing (MIST) analysis, based on the recommendation from the International Council for Harmonization and MIST guidance documents that metabolite safety in human be adequately assessed prior to commencing large-scale clinical trials (i.e., phase III studies) (ICH, 2012; U.S. Department of Health and Human Services, 2020). In the spirit of current strategies, this report includes an assessment of the plasma metabolite exposure comparisons between human and animal species used in safety assessment during phase I, commonly based on non-radiolabeled drug candidate administration in the clinical multiple ascending dose (MAD) study and animal toxicity studies of 1–3 months’ duration (Luffer-Atlas and Atrakchi, 2017; Schadt et al., 2018). Data acquired in these studies are later, and typically before, the end of phase II, complemented with studies in one or more animal species and human using the radiolabeled candidate to confirm the absence of human unique or disproportionate metabolites. Plasma and excreta samples collected in these studies are analyzed for quantitative metabolite profiles and structural characterization of metabolites to cover the majority of the disposition of the administered drug.
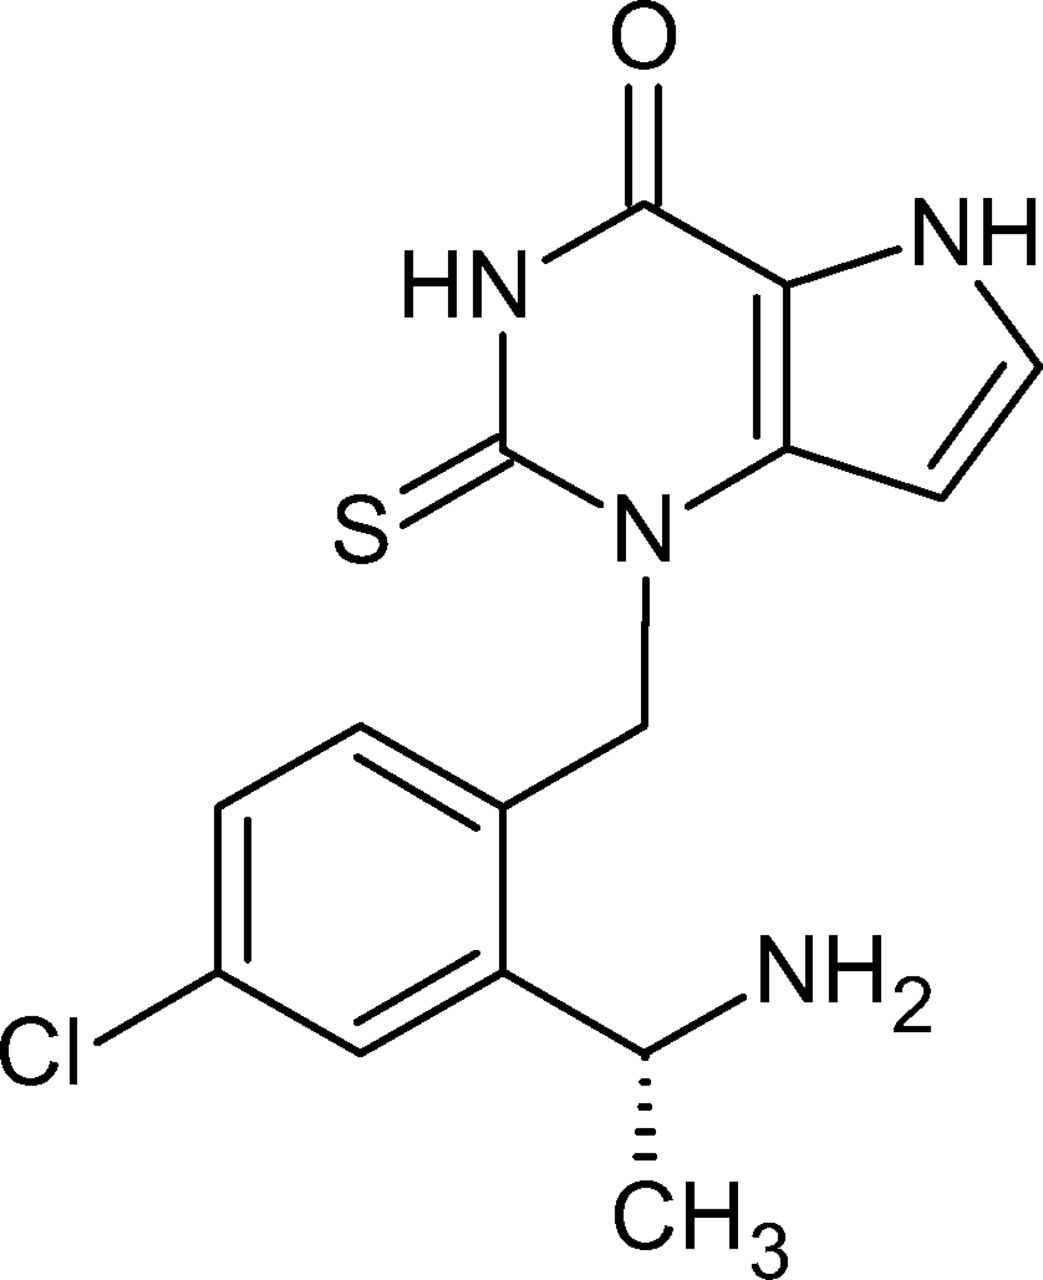
Chemical structure of AZD4831.
Therefore, this article emphasizes the significance of metabolism studies conducted with AZD4831, and focuses on the in vivo qualitative and quantitative metabolite profiling and its impact on the development of the drug. To that end, we report here the compilation of chromatographic and mass spectral results from the analyses of samples collected during pharmacokinetic, toxicological, and clinical studies to delineate the metabolism profile of AZD4831 in preclinical species, healthy human participants, and patients with heart failure with preserved ejection fraction (HFpEF). In addition, we report the assessment of in vitro protein binding of AZD4831 and its major metabolite across preclinical species and humans to better understand its impact on the metabolism of AZD4831. Results of the human absorption, distribution, metabolism and excretion (ADME) study are reported and discussed in detail separately (Bhattacharya et al., 2022).
Materials and Methods
AZD4831 and Metabolite Standards
AZD4831 was synthesized at AstraZeneca R&D Gothenburg, as previously described (Inghardt et al., 2022). The 14C-labeled isotopolog (sp. act. 2.2 MBq/µmol; radiochemical purity >99%; 14C-labeled thiocarbonyl carbon) was prepared at AstraZeneca R&D Gothenburg (Inghardt et al., 2022). Metabolite standards (M3, M5, M7, M9, M10, M11, M12, and M13) were synthesized at AstraZeneca R&D Gothenburg. The position of 14C and structures of metabolite standards confirmed by liquid chromatography-mass spectrometry (LC-MS) and nuclear magnetic resonance are presented in Fig. 2. Descriptions of metabolite standard synthesis are provided in the Supplemental Material. The synthesis of the stable labeled internal standard [13C3,15N2] AZD4831 was performed at Pharmaron Beijing Co., Ltd (Beijing, China).

Proposed structures of metabolites seen in animals and human.
Gray and blue shading indicate sites of metabolic transformations.
The asterisk (*) marks the position of the 14C label in AZD4831.
Other Chemicals
Methanol (MeOH) and acetonitrile (MeCN) (LC-MS grade) were obtained from Fisher Scientific (Loughborough, UK). Formic acid (99.5+) was obtained from Merck KGaA (Darmstadt, Germany). Ultra-pure water was prepared by an in-house water purification system (Milli-Q, Integral 3, Millipore Co., USA). Ultima Gold liquid scintillation counting (LSC)-cocktail was obtained from PerkinElmer (Waltham, MA, USA). All other chemicals and solvents were of the highest quality commercially available.
Specific chemicals used for analysis by accelerator mass spectrometry (AMS) included Australian National University sucrose with a certified 12C/14C ratio purchased from the National Institute of Standards and Technology (Gaithersburg, MD, USA), and acetanilide and paracetamol from Sigma-Aldrich (St. Louis, MO, USA).
Declarations
The original studies in animals have been carried out in accordance with the Guide for the Care and Use of Laboratory Animals as adopted and promulgated by the U.S. National Institutes of Health, and were approved by the Institution’s Animal Care and Use Committee or local equivalent.
Clinical studies were performed in accordance with the ethical principles that have their origin in the Declaration of Helsinki and that were consistent with International Council for Harmonization, Good Clinical Practice, and applicable regulatory requirements. All participants provided written informed consent before any study-related procedures were performed.
Preclinical and Human Studies
Summary of In-Life Studies
All in-life studies conducted are listed and their relevant details are summarized in Table 1. We present additional and relevant details pertaining to the analysis of samples in the following.
Summary of in-life studies, sample collection, and pooling of samples for metabolite analysis
Summary of Analytical Methods
For all studies listed in Table 1, metabolite profiling and identification were performed using ultra-high-performance liquid chromatography (UHPLC) HRMS analysis. For the rat ADME study, fractional collection and off-line radioactivity detection was used to generate metabolite profiles, while LSC analysis was used to measure total radioactivity. Details of the human ADME study are presented separately (Bhattacharya et al., 2022).
Structural Characterization of Metabolites
In general, proposals of metabolite structures were based on observed ions from HRMS and tandem mass spectrometry (MS-MS) data acquisition. HRMS data were used to propose the molecular composition, and tentative structures of metabolites were proposed based on a detailed analysis of their MS-MS spectra and in comparison with the fragment spectra of AZD4831 and several synthetic metabolite references. Software Metabolynx 4.1 (Waters, Milford, MA, USA), Compound Discoverer 3.2.0.421 (Thermo Fisher Scientific, Waltham, MA, USA), and WebMetabase ONIRO release 1.1.1 (Molecular Discovery Ltd, Borehamwood, UK) were used to assist metabolite identification data processing. Unambiguous metabolite identification of M3, M5, M7, M9, M10, M11, M12, and M13 was achieved by comparison of LC retention times and HRMS spectra with synthesized metabolite standards.
Rat ADME Study
An extensive description of the rat ADME study is presented next, while we have chosen to keep the experimental sections for the other studies brief and with details in the Supplemental Material.
The in-life phase, sample collection, and pooling of samples for metabolite profiling and metabolite identification are summarized in Table 1. The dose fractions represented in the pooled samples are presented in Supplemental Table 1, while the dose recoveries in the full study [intact animals, 0–168 hours; bile duct cannulated (BDC) animals, 0–72 hours] are given in Supplemental Tables 2, 3, and 4. The same fractions of the total amounts of excreta produced in each collection interval were pooled. On average, the pools represented 88% of the total radioactivity recovered via each excretion route during the total sampling time (168 hours for intact rats and 72 hours for BDC rats).
Total radioactivity was measured using static LSC analysis [TriCarb 4910TR (PerkinElmer) with automatic quench correction]. Metabolite profiling and identification were performed using UHPLC (Acquity UPLC, Waters, Milford, MA, USA) combined with radioactivity detection (RAD) and HRMS [Xevo G2-S quadrupole time of flight (Q-TOF) mass spectrometer with an electrospray ionization (ESI) interface; Waters].
Chromatography
Chromatographic separations were performed on an Acquity UPLC HSS T3 column (2.1 × 100 mm, 1.8 µm; Waters). The column oven was set to 45°C, and the sample manager was set at 10°C. Mobile phase A was 0.1% formic acid in water and mobile phase B was acetonitrile. Aliquots of 10 or 2x10 µL sample were injected for fraction collection and sample analysis. The LC gradient used at a flow rate of 0.5 mL/min was: 0 to 1 minute at 5%B, 1 to 13 minutes increasing from 5% to 17%B, 13 to 22 minutes increasing from 17% to 37%B, 22 to 23 minutes increasing from 37% to 90%B with a hold at 90%B between 23 and 28 minutes, followed by a decrease during 0.1 minute from 90% to 5%B. The system was equilibrated for 6 minutes at 5%B before the injection of the next sample. The LC eluate was split with ∼0.4 mL/min transferred for fraction collection and ∼0.1 mL/min directed for MS detection. For detailed MS and MS-MS analysis, further sample dilution was made using 30% MeOH in water prior to analysis without LC splitting.
Radioactivity Monitoring
Approximately 0.4 mL/min of the LC eluate was transferred for fraction collection into 96-well Deep-Well LumaPlate Microplates (PerkinElmer) using a fraction collector (FC204, Gilson Inc., Middleton, WI, USA). The fraction collection time was 0.1 minute/well. The microplates were allowed to dry in a ventilated area at room temperature or using a GeneVac HT-4X benchtop evaporator (SP Industries, Ipswich, UK), closed with sealing film (TopSeal-A Plus, PerkinElmer, Waltham, MA, USA) and placed in a microplate scintillation counter (TopCount NXT, PerkinElmer) with 12 detectors. The microplates were counted for 5 minutes per well preceded by an equilibration time of 1 minute per plate. The counting results of the samples were stored as ASCII files, which were exported to the software Laura (version 4, LabLogic Systems Ltd., Broomhill, UK) for peak integration after background subtraction.
LC Column Recovery
The recovery of radioactivity from the LC column during a gradient run was determined for representative urine, feces, bile, and plasma samples by comparison of the radioactivity in the eluate pre- and post-column following sample injections. The recovery was quantitative (>90%) for all analyzed matrices indicating minimal retention of radioactivity in the column.
Q-TOF Mass Spectrometry
Approximately 0.1 mL/min of the LC eluate was introduced into a Xevo G2-S Q-TOF mass spectrometer with an ESI interface (Waters). MS data were acquired using Q-TOF MSE (i.e., two serial functions where the low energy function generated full scan spectra and the high energy function generated fragment ion spectra). Mass spectra were acquired under the positive and negative ESI modes separately. MS-MS data were acquired on selected metabolites to produce product ion spectra for structural elucidation. The MS source settings were as follows: the capillary voltage was set to 0.5 kV and the sample cone voltage to 25. The source and desolvation temperatures were set to 150°C and 550°C, respectively. For the low energy MSE acquisition, the collision energy was turned off, while for the high energy MSE acquisition, the collision energy was ramped from 15 to 35 V. MS-MS acquisition was performed with the collision energy ramped from 15 to 35 V, with the quadrupole mass window generally set to 4 Da for precursor-ion selection. Some MS-MS data were acquired using a narrower precursor-ion mass window, 1 Da, to isolate the individual monoisotopic mass of the molecular ion and eliminate isotope peaks from the product ion spectra. All data were acquired in centroid mode with a mass range of 100 to 1200 m/z. The MS resolving power was 20,000. Leucine-enkephalin was used as an internal calibrant for the accurate mass measurements. The software MassLynx (version 4.1; Waters) was used for instrument control and data acquisition. MassLynx and Metabolynx were used for data processing and analysis, and metabolite identification.
Sample Preparation
Plasma.
Pooled plasma samples (200 µL) were protein precipitated with three volumes of the mixture of MeCN/MeOH (1:1, v/v). After vortex mixing for 10 seconds, the samples were centrifuged at 10,000 g, 4°C for 10 minutes. Each supernatant, 650 µL, was transferred to a new sample vial and concentrated to dryness under a steady flow of nitrogen gas. Aliquots of 25 µL of 60% MeOH in water and 25 µL of H2O were added to the vials to dissolve the residue, followed by vortex mixing for 1 minute and centrifugation at 10,000 g, 4°C, for 10 minutes. The supernatants were transferred to new sample vials, and the recovery of total radioactivity as determined by LSC was 100%. Aliquots of 10 µL were injected twice for each sample with eluate fractions collected into the same plate for LC-RAD analysis. Samples were further diluted three times with 30% MeOH in water, and aliquots of 10 µL were analyzed by LC-HRMS.
Urine.
The urine pools were diluted with one volume of 60% MeOH in water and centrifuged at 10,000 g, 4°C, for 10 minutes. The supernatants were transferred to new sample vials, and the recovery of total radioactivity as determined by LSC was 100%. Aliquots of 10 µL were analyzed by liquid chromatography combined with off-line radioactivity detection (LC-RAD) and on-line HRMS.
Feces.
Feces samples were homogenized in water (1:1, w:w). Pooled fecal homogenate samples (0.2 g) were then weighed and placed in Precellys 2-mL reinforced tubes (Bertin Corp., Rockville, MD, USA). Six 3-mm diameter ceramic balls were added to each tube and extracted with a mixture of MeCN/MeOH (1:1, v/v) in a ratio of 4:1 of organic solvent to fecal homogenate weight. The samples were homogenized and extracted using a Precellys24 homogenizer (Bertin Corp.) at 5500 rpm for 2 × 20 seconds, with a 20-second pause between the intervals. The homogenized samples were then horizontally mixed for 5 minutes in a Mixer Mill MM301 (25 rotations per second; RETSCH GmbH, Haan, Germany). The mixtures were then centrifuged at 10,000 g, 4°C, for 10 minutes. Aliquots of 600 µL supernatant were transferred to new vials and evaporated under a steady flow of nitrogen gas until 300 µL remained. The remaining 300 µL of supernatants were then diluted with 300 µL of water, followed by vortex mixing for 1 minute and centrifugation at 10,000 g, 4°C, for 10 minutes. The final supernatants were transferred to new sample vials, and the recovery of total radioactivity as determined by LSC was 70%. Aliquots of 10 µL were analyzed by LC-RAD and HRMS.
Bile.
One volume of each pooled bile sample was diluted with three volumes of MeCN/MeOH (1:1, v/v) and centrifuged at 10,000 g, 4°C, for 10 minutes. Aliquots of 280 µL of each supernatant were transferred to new vials and evaporated under a steady flow of nitrogen gas until ∼25 µL remained. The remaining 25 µL of supernatants were diluted with 50 µL of 60% MeOH in water and further diluted with 25 µL water and mixed thoroughly. The final supernatants were transferred to new sample vials, and the recovery of total radioactivity as determined by LSC was 92%. Aliquots of 10 µL were analyzed by LC-RAD and HRMS.
Quantification of Metabolites by Solid Phase Scintillation Counting
Peaks of the radiochromatogram from each sample were integrated. Peak areas of parent compound and metabolites were quantified as percent of the eluted radioactivity. The limit of quantification of metabolites in the radiochromatogram was set to 2% of the detected radioactivity for urine, bile, and feces, and 1.5% for plasma. The minimum peak area was set to 9 cpm. These data and the fractions of the dose recovered were used to calculate the abundance of AZD4831 and metabolites in urine, feces, and bile, and expressed as percent of the administered dose. The abundance of AZD4831 and metabolites in plasma was calculated using the concentration of total radioactivity (µmol equiv/L) in plasma.
Mouse Metabolism Study
The in-life phase, sample collection, and pooling of samples for metabolite profiling and metabolite identification are summarized in Table 1.
Preparation of plasma samples and analytical conditions were similar to the rat ADME. Details are given in the Supplemental Material.
Human Metabolism Studies
Human ADME Study
Experimental details from the human ADME study, including the methodology of the AMS analysis, are reported separately (Bhattacharya et al., 2022). The in-life phase, sample collection, and pooling of samples for metabolite profiling and characterization are summarized in Table 1.
Patient Phase IIa Study
Metabolism of AZD4831 was studied in trough plasma samples (C0SS) collected in HFpEF patients in a phase IIa study (Table 1). Plasma samples were pooled equal-volumetrically across six participants at the selected day of visit, followed by sample preparation using protein precipitation method. In brief, to one volume of plasma, two volumes of MeCN/MeOH (1:1, v/v) was added. The quenched sample was centrifuged at 10,000 g, 4°C, for 10 minutes, and the supernatant was evaporated to dryness under nitrogen flow. The residue was dissolved in 50% MeOH and analyzed by LC-HRMS using the same settings as in the MIST analysis (Supplemental Material).
Comparison of Plasma Metabolite Exposures Across Species for MIST Analysis
Source of Study Samples Investigated for MIST
Plasma samples for evaluation of exposures of human plasma metabolites across species (MIST) were obtained from the following studies: a randomized, single-blind, placebo-controlled, phase I MAD study to evaluate the safety and tolerability of AZD4831 in healthy male volunteers (NCT03136991) (Nelander et al., 2021); a 3-month repeated-dose toxicity good laboratory practice (GLP) in dogs; and a 3-month repeated-dose GLP toxicity study in rats. Samples that were used for MIST evaluation are described in Table 1.
Human Plasma Samples
Human plasma samples were collected from three once-daily dose groups in the MAD study: 5 mg (sampling on day 10, n = 8), 10 mg (sampling on day 14, n = 8), and 15 mg (sampling on day 10, n = 7). Plasma samples were pooled across participants to obtain one area under the curve (AUC) for the first 24 hours (AUC0–24h) pool at each dose group for MIST evaluation.
Dog Plasma Samples
Plasma from three male and three female dogs receiving repeated oral doses of 100 mg/kg/d, the highest no observed adverse event level (NOAEL) of AZD4831 was used. Plasma samples (week 13) were pooled across sex to obtain one AUC0–24h pool for MIST evaluation.
Rat Plasma Samples
Plasma from 10 males and 10 female rats receiving repeated oral doses of 125 mg/kg/d (highest NOAEL) of AZD4831 were used. Plasma samples (week 13) collected using a microsampling technique were completely washed out from the microcapillary using 0.1 M phosphate buffer pH 7.4 with a dilution factor of 12. The diluted plasma samples were pooled by sex to obtain one AUC0–24h pool for male and female, respectively, for MIST evaluation.
Sample Pooling, Preparation, and Analysis
Plasma samples were pooled according to Hamilton et al. (Hamilton et al., 1981) to obtain time proportional AUC0–24h pools. To minimize differences in MS response of AZD4831 and the metabolites originating from different matrices, the samples used for the estimation of exposure ratios were matrix matched, i.e., pre-dose plasma from one species was mixed with incurred plasma from the other species, and vice versa, followed by protein precipitation before being subjected to LC-HRMS analysis. Further details about sample pooling, preparation, and LC-HRMS analytical conditions are given in the Supplemental Material.
Supporting In Vitro Studies
Fraction Unbound in Plasma of AZD4831 and Metabolite M7 Across Species
Equilibrium dialysis was used to assess the fraction unbound in plasma. Frozen plasma (pools of n>3) from human (mixed sex), rat (male Han Wistar), mouse (male CD1), and dog (male beagle), generated using K2-EDTA anticoagulant, were purchased from Bioreclamation, LLC (Westbury, NY, USA). The equilibrium dialysis device (RED, Thermo Fisher Scientific, Rockford, IL, USA) was used for dialysis of plasma containing 0.1, 1.0, or 10 µmol/L test compound against phosphate buffer pH 7.4 for 16 hours at 37°C. Calibration curves ranging from 0.001 to 5 µmol/L were made from spiked plasma and serial dilutions with blank plasma. Verapamil was used as internal standard. Warfarin, propranolol, and metoprolol were used as reference compounds in each run. Calibration curve samples and dialysis samples were precipitated with four volumes of MeCN. After vortex mixing and centrifugation, supernatants were removed and analyzed using LC-MS/MS (API 4000, AB Sciex). Fraction unbound in the incubation was calculated as the concentration in the media buffer sample divided by the concentration in the plasma sample.
In Vitro Incubation of AZD4831 With Human MPO
Human MPO was produced in house by purification from HL60 promyelocytic cells that spontaneously express and secrete MPO. Incubation mixtures (total volume 200 µL) containing 0.2 µmol/L MPO and 2 µmol/L AZD4831 (final concentrations) in 10 mmol/L NaPO4 buffer, pH 7.4, supplemented with 140 mmol/L NaCl, were pre-incubated at 37°C for 5 minutes. The enzymatic reaction was initiated by addition of H2O2 to a final concentration of 49 µmol/L. Following incubation for 30 minutes at 37°C, 600 µL MeCN was added to quench the reaction. The samples were vortex mixed for 10 seconds and then centrifuged for 20 minutes at 4°C, 4000 rpm (∼2750 g). The supernatants were stored at −18°C until analysis by LC-HRMS using the same settings as described in the MIST analysis (Supplemental Material). Control incubations were conducted in the absence of NaCl and in the absence of H2O2.
Results
Rat ADME Study
Metabolism studies on AZD4831 were initiated during the mass balance study conducted in rats. A summary of the results of the study is presented here. The study revealed that the mean total recovery of radioactivity was quantitative (91%–94%) in orally and intravenously dosed intact male and female rats, as well as orally dosed BDC rats, over the collection period. The excretion of the administered radioactivity in the intact rat was rapid, with the majority of the administered dose recovered in the first 24 and 48 hours post-dose in both males and females. The routes and rates of excretion were similar in male and female rats (Supplemental Tables 2, 3, and 4).
Following both oral and intravenous administration to intact male and female rats, the major route of elimination was via feces with means of 51.9% (oral) and 46.9% (intravenous) of the administered dose recovered. Urinary excretion accounted for means of 32.0% (oral) and 37.7% (intravenous) of the administered dose. In orally dosed BDC male rats, means of 21.4% of the radioactivity was recovered in bile, 27.5% in feces, and 37.3% in urine. In orally dosed BDC female rats, means of 10.4% of the radioactivity was recovered in bile, 23.2% in feces, and 54.7% in urine.
Following oral administration, the highest mean concentration of total radioactivity in plasma was noted at 1 hour and 3 hours post-dose in male and female rats, respectively. The mean values were 23.4 µmol equiv/L (male) at 1 hour and 15.9 µmol equiv/L (female) at 3 hours. In both sexes, the mean concentration of total radioactivity in plasma decreased over the sampling period to 16.9 µmol equiv/L (male) and 13.4 µmol equiv/L (female) at 8 hours post-dose. Blood-to-plasma ratios of total radioactivity were between 0.87 and 1.04 following oral administration, indicating that 14C-related material was distributed equally between the plasma fraction and the red blood cells, and did not change over time.
The samples collected from this rat ADME study initiated the characterization of metabolites of AZD4831. We present next the metabolites identified and characterized in human and animals followed by the MIST evaluation.
Structural Characterization of Metabolites of AZD4831 in Animals and Humans
The presence of AZD4831 in samples was confirmed by MS detection. Pseudo-molecular ions of metabolites monitored in positive and negative ionization modes were identified at retention times that agreed with the corresponding radio- or AMS chromatograms. HRMS data were used to propose molecular composition and product ion spectra (MSE and/or MS-MS) were used to propose metabolite structures. Eight synthesized metabolite standards representing metabolites M3, M5, M7, and M9 to M13 (structures in Fig. 2) were available and supported the identification of metabolites by comparing LC retention times and MS data. Confirmation of metabolite structures was based on a detailed analysis of the product ion spectrum of AZD4831 (Fig. 3), and proposed structures of fragment ions a through j as shown in Fig. 4. Pathways proposed for the formation of fragment ions are given in Supplemental Figs. 1–6. These pathways and those of synthesized metabolite standards were applied in the interpretation of MS data of metabolites for which no standards were available. The interpretation of MS data is presented collectively for rat and human, followed by a summary of metabolites seen in each species. Data on metabolites for which synthesized standards were available have been omitted from the interpretation.

MS-MS spectrum of protonated AZD4831 in positive ionization high-resolution MS-MS mode, with fragment ions and their nomenclature indicated.
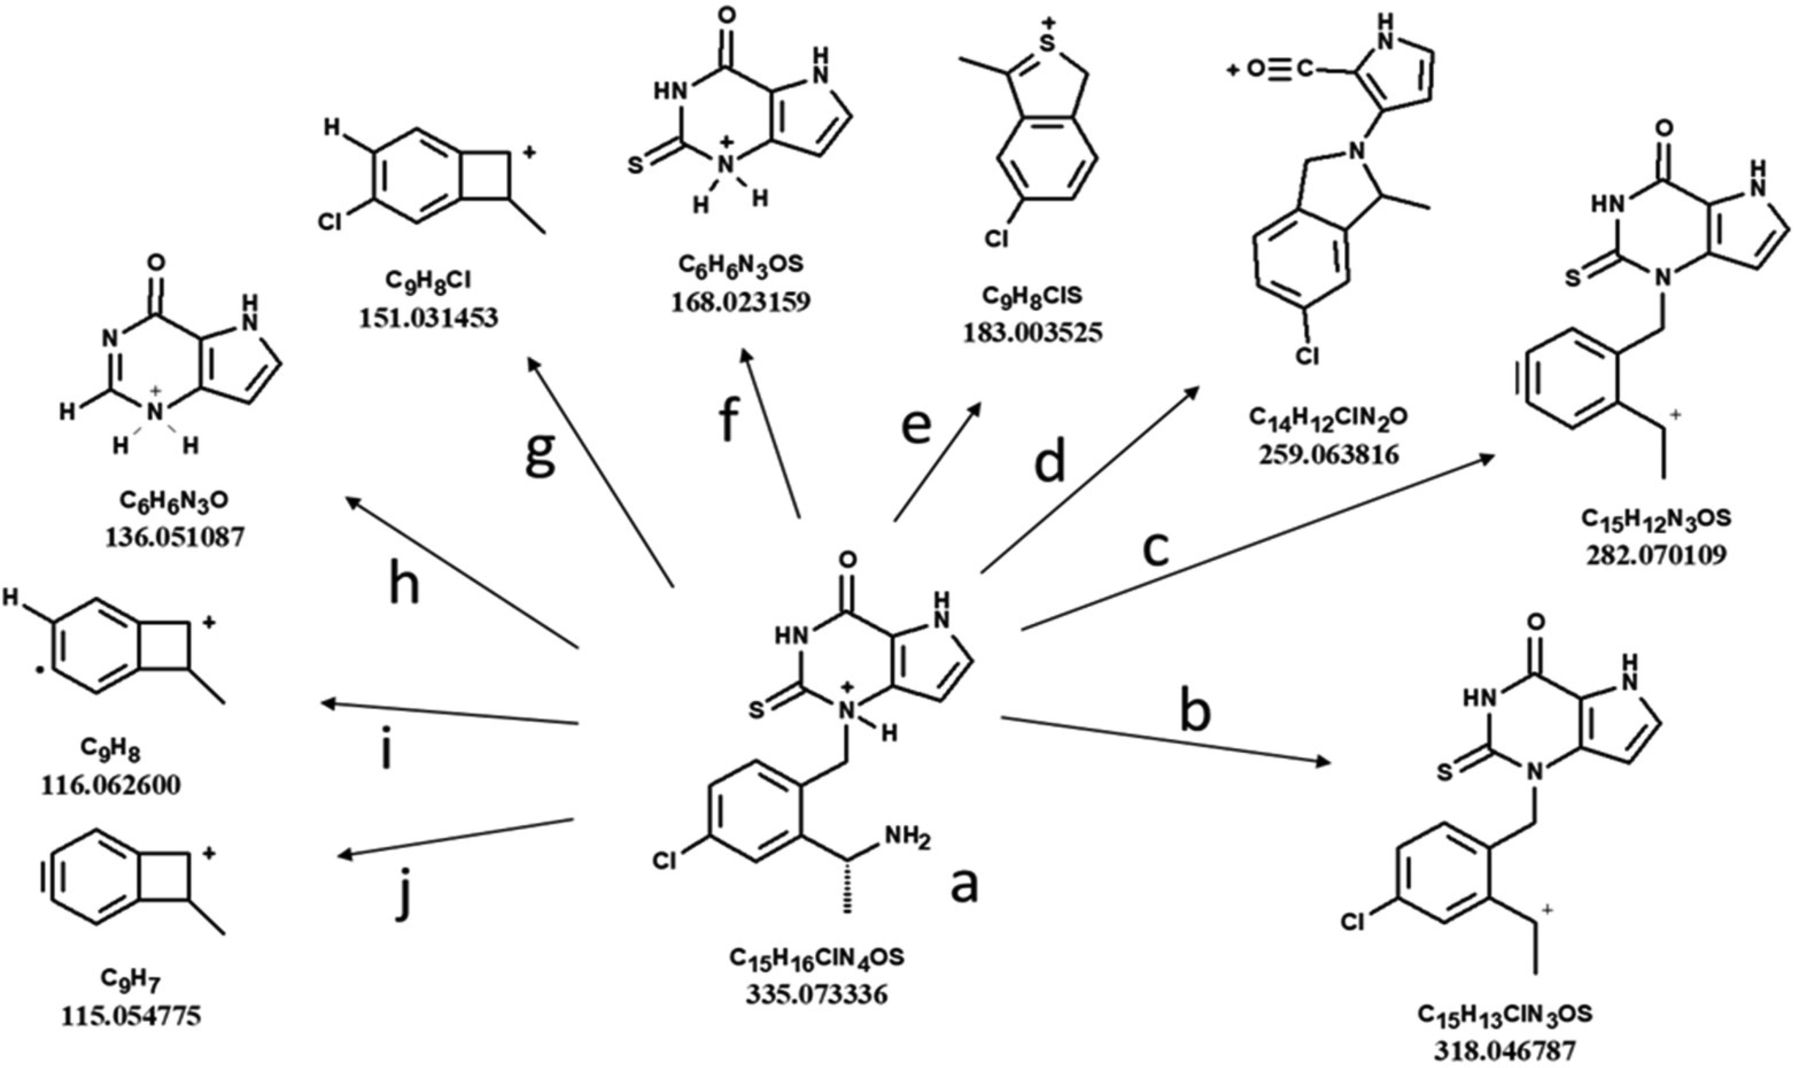
Proposed fragment ions formed from protonated AZD4831.
Proposed fragmentation pathways are given in the Supplemental Material. The mass-to-charge ratios shown are calculated and not observed.
Proposed metabolite structures are shown in Fig. 2, while tabulated fragment ions are listed in Supplemental Tables 5, 6, and 7.
M1 and M15
Both metabolites are glucuronic acid conjugates of hydroxylated AZD4831, as indicated by [M+H]+ m/z 527.10. The neutral loss of 176 Da, loss of the glucuronyl fragment, forms the aglycone at m/z 351.07, followed by a neutral loss of NH3 to m/z 334.04. The corresponding fragment ion of AZD4831, at 318.05 is 16 Da lower, clearly indicating that the oxygenation has not occurred on the amine nitrogen. The fragment ion m/z 184.02 is 16 Da higher than fragment ion of AZD4831 (m/z 168.02) and indicates oxygenation on the deazathioxanthine moiety, likely on one of the two pyrrole carbons. This is further supported by m/z 151.03, representing the chlorobenzyl group, of the same mass as fragment ion g of AZD4831, again indicating that the oxygenation occurs in the deazathioxanthine part. Thus, metabolites M1 and M15 are proposed to be two isomers of hydroxylated and glucuronidated AZD4831 modified in the pyrrole ring.
M2 and M14
The [M+H]+ of both metabolites is m/z 351.07 (i.e., oxygenated AZD4831). They display the same MS spectral differences to AZD4831 as described for metabolites M1 and M15, apart from not being conjugated with glucuronic acid. Thus, fragment ions m/z 334.04 and 184.02 indicate oxygenation in the pyrrole ring of the deazathioxanthine moiety, and m/z 151.03 indicates the intact chlorobenzyl group as argued previously. Thus, metabolites M2 and M14 are proposed to be two isomers of hydroxylated AZD4831 modified in the pyrrole ring.
M4
[M+H]+ at m/z 317.08 and MS-MS spectra indicated that M4 is an oxygenated analog of the cyclized and desulfurized metabolite M5 ([M+H]+ at m/z 301.09). Fragment ions at m/z 167.03 and 132.06 indicate the addition of oxygen to the chlorobenzylic part of the molecule to produce oxygenated fragment ions g and i observed for AZD4831 at m/z 151.03 and 116.06, respectively. The latter fragment ions were also observed in the MS-MS spectrum of M5, the non-oxygenated analog of M4. Three possible sites of oxygenation are shown by the shaded Markush representation in Fig. 2.
M6
[M+H]+ at m/z 528.08 suggests an odd number of N atoms in the structure, as opposed to an even number for AZD4831. The neutral loss of 176 Da indicates a glucuronic acid conjugate with the aglycone appearing at m/z 352.05. The following neutral loss of 18 Da to form the same fragment ion as formed via loss of NH3 from metabolites M1, M2, M14, and M15 (i.e., m/z 334.04) shows that this is an alcohol losing water and not an amine losing ammonia. Thus, the aglycone is proposed to be an oxygenated form of metabolite M11, which is formed via oxidative deamination and carbonyl reduction to the alcohol. The position of the additional oxygen is, again, proposed to be in the pyrrole ring of the deazathioxanthine, as supported by the presence of fragment ions m/z 184.02 and m/z 151.03. MS data will not reveal, however, whether glucuronidation is on a pyrrole oxygen or that of the alcohol formed via deamination.
M8
MS data on M8 were potentially confounded by fragment ions from a co-eluting metabolite that made the proposal uncertain. Nonetheless, a [M+H]+ at m/z 527.10 suggests a glucuronic acid conjugate of oxygenated AZD4831. Data indicate that the fragment ion formed via neutral losses of a glucuronyl fragment and the amine function appears at m/z 318.04 (i.e., the same as that formed from loss of NH3 from AZD4831 and other metabolites modified on the amine function only). Fragment ions m/z 168.02 and m/z 151.03 indicate that oxygenation has occurred in neither the deazathioxanthine nor the chlorobenzyl group, although a weak m/z 184.02 may indicate oxygenation of the deazathioxanthine. Thus, there is some support to propose that M8 is an N-O-glucuronic acid conjugate formed from AZD4831, although oxygenation of the pyrrole ring cannot be excluded.
M16
The proposed structure of M16 is based on the comparison of its MS and MS-MS spectra with those of the carbamoyl glucuronide metabolite M7 ([M+H]+ at m/z 555.10). Thus, [M+H]+ of M16 (m/z 523.12) is 31.98 Da lower than that of M7, indicating a desulfurized analog of M7. Neutral loss of a glucuronyl fragment generates the protonated carbamic acid analog at m/z 347.09. Rearrangement according to Supplemental Fig. 1 forms fragment ion n at m/z 212.05, analogous to the formation of fragment ion k formed from AZD4831. In comparison with the fragments of AZD4831 as shown in Fig. 3, M16 does not form fragment ion f at m/z 168.02, whereas its desulfurized analog at m/z 136.05 is prominent (i.e., identical to fragment ion h in Fig. 4).
M17
This is also proposed to be an analog of the carbamoyl glucuronide metabolite M7. [M+H]+ of M17 (m/z 571.09) is 15.99 Da higher than that of M7 ([M+H]+ at m/z 555.10), indicating an oxygenated analog of M7. Neutral loss of the glucuronide fragment results in the protonated carbamic acid at m/z 395.06 and the intact aglycone at m/z 351.07 following neutral loss of CO2. The subsequent neutral loss of NH3 to produce the fragment ion at m/z 334.04 is analogous to the diagnostic fragment ion p observed for the parent AZD4831 at m/z 318.05 presented as fragment ion b1 in Supplemental Fig. 2. Rearrangement according to Supplemental Fig. 1 forms fragment ion n at 212.05, analogous to fragment ion k formed from AZD4831. Finally, the oxygenation is assigned to the pyrrole ring as fragment ion f is seen at m/z 184.02 for M17 compared with m/z 168.02 for AZD4831. Further support of the oxygen position in the deazathioxanthine moiety is that fragment ions g and j representing the chlorobenzyl part of the molecule are unchanged compared with AZD4831, at m/z 151.03 and 115.05, respectively.
M18
The MS spectral features of metabolite M18 are the same as those of metabolite M16 discussed earlier. The [M+H]+ is 523.12 and neutral loss of 176 Da produces the carbamoylated aglycone at m/z 347.08. Further neutral loss of CO2 and ammonia shows as fragment ion m/z 286.07 (i.e., 32 Da less than fragment ion m/z 318.05 from AZD4831); therefore, detected fragment ions indicate that M18 is a desulphurized carbamoyl glucuronide of AZD4831.
M19
In the positive ionization mode, the MS-MS spectrum of metabolite M19 was identical to that of AZD4831. The [M+H]+ appeared to be m/z 335.07, and the diagnostic ions at m/z 168.02 and m/z 151.03 indicated no metabolic change to the structure. However, in the negative ionization mode, the [M-H]− now appeared at m/z 413.02 undergoing a neutral loss of 80.0 Da, likely SO3, to 333.06. In the negative ionization mode, further fragment ions support that the deazathioxanthine moiety is intact (m/z 165.00) whereas the fragment ion m/z 246.00 is suggested to be the chlorobenzyl group with the ethylamine side chain intact, corresponding to fragment ion k of AZD4831 (Supplemental Fig. 1), with the added weight of SO3. Thus, metabolite M19 is proposed to be the primary amine sulfamate of AZD4831.
M20
This metabolite is proposed to be the desulfurized analog of metabolite M9 (i.e., the N-acetyl conjugate). The [M+H]+ of M20 (m/z 345.11) is 31.97 Da less than that of M9 ([M+H]+ at m/z 377.08). Fragment ions m at m/z 210.07 and k at m/z 168.06 are similar to those observed for AZD4831 as shown in Supplemental Fig. 1. Fragment ion f (m/z 168.02) is not present, whereas fragment ion h (m/z 136.05) is evident, indicating the desulfurized deazathioxanthine moiety. Diagnostic fragment ions observed for M20 and AZD4831 (g, i, j, and k) at m/z 151.03, 116.06, 115.05, and 168.06 further support the intact chlorobenzyl part of the molecule.
Metabolite Profiling in Animals
Metabolites Identified in the Rat
Phase I metabolites.
Nine metabolites formed by functionalization (phase I metabolism) of AZD4831 were characterized in rat samples: M2 and M14 (hydroxylation), M3 (thiourea oxidation to urea), M4 (intramolecular cyclization with desulfurization in combination with hydroxylation), M5 (intramolecular cyclization with desulfurization), M10 (oxidative deamination to ketone), M11 (oxidative deamination and reduction of ketone to alcohol), M12 (intramolecular cyclization), and M13 (elimination of sulfur) (Table 2). The presence of metabolites in each matrix is also presented in Table 2.
Observed pseudo-molecular ions and proposed compositions of AZD4831 and metabolites in rats and human
Phase II metabolites and metabolites of phase I and phase II combined.
Ten of the metabolites characterized in rats are formed by conjugation (phase II) or a combination of functionalization and conjugation (phase I + II): M1, M8, and M15 (hydroxylated glucuronide conjugates), M6 (hydroxylated glucuronide conjugate in combination with oxidative deamination and reduction of ketone to alcohol), M7 (N-carbamoyl glucuronide conjugate), M9 (N-acetyl conjugate), M16 and M18 (sulfur elimination and N-carbamoyl glucuronide conjugate), M17 (hydroxylated N-carbamoyl glucuronide conjugate), and M19 (primary amine sulfamate conjugate) (Table 2). The presence of metabolites in each matrix is also presented in Table 2.
Metabolite fractions MX1 to MX4.
The metabolite fractions MX1 (female, bile, oral) and MX2 to MX4 (male, feces, intravenous) were observed in the RAD chromatograms (Supplemental Figs. 8 and 9), but no data could be identified at their respective retention time by MS. All of the MX-fractions corresponded to <2.3% of the dose each.
Metabolite profiles and quantification in intact and BDC rats.
Metabolite profiles recorded by LC-RAD and LC-MS of pooled urine, feces, bile, and plasma samples revealed altogether 23 metabolites or metabolite fractions. Quantitative percent estimates of radioactivity and dose in intact orally dosed male and female rats are presented in Table 3; metabolite plasma concentrations in Table 4; and metabolite profiles in plasma, urine, feces, and bile from intact and BDC male rats are shown in Fig. 5. Quantitative data on intact rats dosed intravenously and BDC rats dosed orally are given in Supplemental Tables 8 and 9, with metabolite profiles in all dose groups in Supplemental Figs. 7–10. The metabolite profiles in excreta of male and female rats were generally qualitatively similar, indicating that metabolism is independent of route of administration or sex following oral and intravenous administration of [14C]AZD4831.

Metabolite profiles of [14C]AZD4831 and metabolites in rat plasma, urine, feces, and bile.
For the sake of clarity, metabolite peaks have only been labeled in representative profiles.
aCo-eluting metabolites.
Quantitative estimates of AZD4831 and metabolites in samples collected after a single oral administration of 40 mg/kg (10 MBq/kg) [14C]AZD4831 to intact rats
Concentrations of AZD4831 and metabolites in plasma collected after a single oral administration of 40 mg/kg (10 MBq/kg) [14C]AZD4831 to intact rats
Metabolites in Urine and Feces Following Oral Administration of [14C]AZD4831 to Intact Rats
Quantitative estimates (percent of dose) of AZD4831 and metabolites in samples collected after a single oral administration 40 mg/kg (10 MBq/kg) of [14C]AZD4831 to intact rats are presented in Table 3. Metabolite profiles in plasma, urine, feces, and bile are presented in Fig. 5.
The radioactivity in the pooled urine and feces samples (0–48 hours) represents 28% (male) and 34% (female) of the administered dose in urine, and 59% (male) and 43% (female) of the dose in feces. AZD4831 was the major component and accounted for 20% (male) and 30% (female) of the dose in urine, and 40% (male) and 31% (female) in feces. The urinary and fecal metabolite profiles were qualitatively similar. RAD and MS chromatograms indicated the formation of 10 metabolite fractions. The most abundant metabolite in both feces and urine was M5, accounting for 5.3% and 2.4% of the administered dose in male and female rats, respectively. The sum of all other detected metabolites accounted for ≤3% of the administered dose.
Metabolites in Urine, Feces, and Bile Following Oral Administration of [14C]AZD4831 to BDC Rats
Quantitative estimates (percent of dose) of AZD4831 and metabolites in pooled samples (0–24 hours) collected after a single oral administration of 40 mg/kg (10 MBq/kg) of [14C]AZD4831 to BDC rats are presented in Supplemental Table 9. Metabolite profiles in urine, feces, and bile are presented in Supplemental Figs. 7, 8, and 9, respectively.
The dose fractions excreted in bile within 0–24 hours were 21% (male) and 10% (female) of the total dose. Unchanged parent compound AZD4831 accounted for <0.1% (male) and 0.2% (female) of the administered dose in bile. In feces and urine, parent AZD4831 accounted for 26%–49% (urine) and 20%–17% (feces) of the dose in male and female rats. The metabolite profiles in urine and feces following oral administration of [14C]AZD4831 to BDC rats were similar to the profiles in excreta from oral administration to intact rats. Of the dose fractions excreted in bile within 0–24 hours, parent compound was a minor component, with metabolites above the lower limit of quantitation (2%), accounting for 13% (male) and 7.5% (female) of the dose. In pooled bile samples, RAD and MS chromatograms indicated the formation of 20 metabolite fractions. The major metabolite detected in bile was M7, accounting for 6.9% (male) and 4.7% (female) of the dose administered. All other metabolites each accounted for ≤2% of the administered dose in urine, feces, and bile.
Metabolites in Plasma Following Oral Administration of [14C]AZD4831 to Intact Rats
Quantitative estimates (expressed as percent of total radioactivity and µmol equiv/L) of AZD4831 and metabolites in plasma collected 1, 3, and 8 hours after a single oral administration to intact rats at a target dose level of 40 mg/kg (10 MBq/kg) are presented in Table 4. The metabolite profile of plasma in male rats at 3 hours is shown in Fig. 5, while all profiles are presented in Supplemental Fig. 10. AZD4831 accounted for the majority of the radioactivity (>67%) in plasma at all time points. The majority of the remaining radioactivity was distributed over metabolites M1, M2, M4, M5, M7, and M10, each accounting for ≤5.4% of the integrated radiochromatographic peaks.
Levels of M10 were higher in male rats compared with the female rats. Otherwise, no general sex-specific differences were observed.
The plasma profiles in rats are similar to those observed in excreta to the extent that the exposure to AZD4831 is high, while metabolites observed at low levels mainly represent oxidized metabolites, such as M1 and M2, as well as the cyclized M5 and in male rats also M10, the carbonyl metabolite formed via deamination, although M7 is also present at low levels.
Metabolites Identified in the Mouse
AZD4831 was detected in all plasma samples. Eleven metabolites (M1, M2, M3, M4, M5, M7, M9, M10, M11, M12, and M14) were detected in the plasma samples. The metabolite profiles were similar between male and female mice. The levels of AZD4831 and the detected metabolites increased with increasing dose. No new metabolites (i.e., not reported earlier in rats, dogs, or humans) were detected in any of the plasma samples. The total drug-related exposure (DRE, percent) of AZD4831 ranged from 57%–78% (highest to lowest dose) in the investigated dose groups. The DRE of the metabolites ranged from not detected to 19% in the investigated dose groups (Table 5).
Total drug-related exposure of AZD4831 and the detected metabolites in the AUC0–24h pools of plasma in mouse
Metabolite Profiling in Human Studies
Metabolites Identified in Human ADME Study
Nine metabolites were structurally assigned based on HRMS and MS-MS data (Table 2 and Fig. 2). The structures of M5, M7, M9, M11, and M12 were confirmed by comparison with authentic standards. Structures of M4, M16, M17, and M20 are tentative assignments based on interpretation of MS-MS data.
Human Metabolism: Patient Phase IIa Study
After repeated oral doses of AZD4831 (5 mg once daily) to HFpEF patients, four metabolites (M5, M7, M9, and M11) were identified in pooled trough plasma samples. In comparison with the synthesized metabolite standards, the metabolite profiles in patient plasma were similar to those of healthy participants, with M7 being the most abundant drug-related component.
Human Plasma Metabolite Exposure Comparison Across Animal Species (MIST)
Five metabolites of AZD4831 were found in plasma pools (AUC0–24h) following repeated once-daily administration of 5, 10, or 15 mg of the non-radiolabeled compound to healthy participants: M5, M7, M9, M11, and M12 (Fig. 2) (Nelander et al., 2021).
At the time, synthesized standards of AZD4831, M5, M7, M9, and M11 were available and facilitated calculation of their concentrations. The concentrations of M12 were estimated by using the calibration curve of M7, which gave the highest estimate of the concentration of M12.
The major circulating metabolite in human plasma AUC0–24h pools was M7, which accounted for 75%–80% of DRE. AZD4831 accounted for 7%–8%, M5 for <1%, M9 for 3%–7%, M11 for 6%–7%, and M12 for ≤4% of DRE. The concentrations of AZD4831 ranged between 28–86 nmol/L, while the concentrations of M7 were between 268–981 nmol/L. Absolute concentrations and the relative systemic exposures of AZD4831, M5, M7, M9, M11, and estimations of M12 in the different AUC0–24h pools of plasma from human are shown in Table 6.
Concentrations of AZD4831 and metabolites in the human AUC0–24h plasma pool collected from the 5, 10, and 15 mg oral dose groups (nmol/L) and their relative exposure (MAD study)
Human Plasma Metabolite Exposure Comparison with Rat and Dog
Data from the MAD study showed that metabolite M7 was the only metabolite exposed to >10% of DRE in human. Other metabolites identified were ≤7% of DRE but compared nonetheless with respect to animal exposure because the exposures were in the same range as for AZD4831 (7%–8% of DRE).
Exposure ratios of the five human metabolites were calculated by dividing the MS peak area of the respective metabolite found in the animal AUC0–24h matrix matched pools from the high NOAEL dose levels from dog and rat 3-month toxicity studies with the MS peak area found in human AUC0–24h matrix matched pools from all doses. A decrease in exposure ratio was seen for the major metabolite M7 with increasing human dose for all animal samples. The ratios were ≥1.4 for all animals except for dog, in which it was 0.7 at the highest human dose of 15 mg. For M9, the ratios were ≥1.0 in rats and ≤0.7 in dogs at all clinical dose levels. Metabolite M11 could not be detected in dogs, while exposure ratios were 1.6 or higher in rats. Metabolites M5 and M12 were only detectable in the human AUC0–24h matrix matched pools from the highest dose, giving exposure ratios of 8.6 in dogs and ≥33 in rats for M5, and ratios of 10 in dogs and ≥36 in rats for M12, respectively. The exposure ratios of all metabolites and AZD4831 at all clinical doses are presented in Table 7.
MIST evaluation: Exposure ratios of AZD4831 and metabolites in the AUC0–24h matrix matched plasma pools from dogs and rats compared with those in human
In Vitro Studies
Plasma Protein Binding
The plasma exposure to metabolite M7 was about 10-fold higher than parent AZD4831 itself in human but detected at only low levels in circulation in rat and dog. A plausible explanation for this is the unexpected species difference in plasma protein binding for M7 (Table 8). In human, the bulk of the formed carbamoyl glucuronide is confined to mainly plasma with a free fraction below 0.2%, compared with ∼20% in rats and 33% in dogs. For comparison, the free fraction of AZD4831 is well above 20% in all species studied (Table 8). Noteworthy is that the recovery in the assay after 16-hour dialysis was >84% for M7 in all three species, indicating that M7 is very stable in plasma from human, rat, and dog.
Plasma protein binding results of AZD4831 and M7 following in vitro dialysis of human, rat, and dog plasma at 37°C for 16 h at 0.1, 1.0, and 10 µmol/L (n = 3)
Values are percentage free drug in plasma, expressed as mean ± S.D.
MPO Incubation: In Vitro Formation of M12 by MPO
In an in vitro incubation with AZD4831, purified human MPO, and addition of H2O2 and Cl−, the formation of M12 was seen, with no other stable metabolites detected (data on file).
Discussion
We have herein elucidated the metabolic disposition of AZD4831 from nonclinical and clinical studies. Our studies of the metabolism of AZD4831 are aligned with the strategies of the guidance documents issued by the FDA (U.S. Department of Health and Human Services, 2020) and ICH (2012), as well as subsequent reports published on MIST assessment (summarized in, e.g., Luffer-Atlas and Atrakchi, 2017; Schadt et al., 2018). This article describes the biotransformation of AZD4831 in preclinical species, healthy volunteers, and HFpEF patients, and complements the human mass balance and pharmacokinetic studies, which are reported separately (Bhattacharya et al., 2022). In total, 20 metabolites were identified in mice, rats, dogs, and humans. We also conclude that rats and dogs are adequate animal species for the safety assessment regarding human metabolites.
A distinct feature of the biotransformation of AZD4831 is that metabolic modification occurs primarily at its primary aliphatic amine and thiourea moieties. Of the 20 characterized metabolites, six minor metabolites seen only in rats had the primary amine function intact (M1 to M3, and M13 to M15), indicating the propensity of this moiety to be subjected to both functional and conjugation metabolism.
The characterization of most metabolites was supported by the use of LC-HRMS technology and availability of synthesized metabolite standards, as well as dosing with a radiolabeled compound. We conclude that metabolites formed in human are also formed in the animals studied, and provided adequate coverage to their exposure using these technologies. To elucidate the structures of metabolites, we have emphasized the characterization of the fragmentation pathways of product ions under collisional activation conditions. As a result, a thorough investigation of the mass spectrum of AZD4831 and the synthesized metabolites provided confidence in delineating the structural assignment of metabolites for which standards were not available. For example, the protonated molecular ion ([M+H]+) of AZD4831 characterized at m/z 335.07 produces two diagnostic fragment ions for AZD4831 at m/z 183.00 and 136.05, as shown in Fig. 6. The explanation for their formation was only possible by invoking a fragmentation pathway that transfers the sulfur atom from the deazathioxanthine moiety to the chlorobenzyl substituent.

MS-MS fragmentation pathways for protonated AZD4831: proposed formation of m/z 183.0035 (fragment e) and 136.0511 (fragment h).
The mass-to-charge ratios shown are calculated and not observed.
Two metabolites of particular interest were those formed via intramolecular cyclization: M5 and M12. Our proposal for the formation of M5 is that the (enol) imine-thiol form of the thiourea group would be oxygenated in one or more steps to form the corresponding sulphenic, sulphinic, or sulphonic acids. The two latter products would govern cyclization by internal nucleophilic attack by the nitrogen lone electron pair on the thiol-carbon, with SO2 or SO3 as stable and efficient leaving groups. This mechanism is consistent with that reported for desulfurization of thiourea derivatives (Samuelsson et al., 2011; Eng et al., 2016). The formation of M12 implicates the formation of a covalent bond between N and S, producing the corresponding cyclic sulfenamide. A possible explanation would be that this metabolite is formed via activation of AZD4831 by MPO itself (i.e., production of HOCl) by chlorination of either sulfur or nitrogen, as shown in Fig. 7. In both cases, a nucleophilic attack by the nitrogen lone pair on S-Cl, or vice versa, would form the N–S bond with elimination of HCl. MPO is known to chlorinate both N and S (Villamena, 2017; Guo et al., 2019; Ulfig et al., 2019; Siraki, 2021), supporting our results from the in vitro incubations of AZD4831 with purified human MPO where the formation of M12 was seen at a high rate, with no other metabolites formed (data on file). An alternative pathway for the formation of the sulfenamide (M12) could be via nucleophilic attack of the amine nitrogen on the initially formed sulfenic acid. However, M12 was not observed in early hepatocyte incubations (data on file) and was the only metabolite seen in the MPO incubations, indicating that oxidative metabolism was not involved in the formation of the sulfenamide. Several other desulphurized metabolites (M13, M16, M18, and M20) were seen in vivo where no cyclization occurred. An explanation for why not all metabolites cyclize upon sulfur oxygenation similar to M5 may be that, of those four metabolites, three were N-adducts on the primary amine, which would have prevented nucleophilic attack by N on the thiocarbonyl carbon to cyclize. As illustrated for metabolite M13 in Fig. 7, the elimination of sulfur would also involve sulfur oxygenation and elimination of SOx.

Tentative mechanisms for the formation of metabolites M5 and M12.
For the mechanism leading to formation of M12, chlorination on the thiol is shown, but chlorination on the primary amine is also possible.
The formation of M9, the N-acetylated metabolite, in rats and human is also of note, as most N-acetylated metabolites are formed from arylamines by N-arylamine transferases and commonly not observed for aliphatic amines (Loureiro et al., 2013; Sim et al., 2014; Miyatake et al., 2018; Conway et al., 2020).
The most striking observation regarding species differences, however, is that of the plasma exposure to metabolite M7, which is about 10-fold higher than AZD4831 itself in human but was detected at only low levels in rats comparatively. A plausible explanation for this is the unexpected species difference in plasma protein binding for M7, for which the free fraction in human is only 0.2%, while ∼20% in rats and 33% in dogs (Table 8). This difference between a drug and its carbamoyl glucuronide metabolite in human has been reported previously [e.g., vabicaserin with 60-fold higher exposure of the carbamoyl glucuronide metabolite than its parent (Tong et al., 2010)]. The plasma stability of M7 was high in all three species as indicated by the high recovery in the plasma protein binding experiment (>84% after 16-hour dialysis). This is consistent with published reports on the stability of carbamoyl glucuronide metabolites, which are substrates of β-glucuronidase and do not undergo migration to form reactive species (Tremaine et al., 1989; Schaefer, 2006; Gunduz et al., 2010; Tong et al., 2010; Zheng et al., 2013; Yu, 2020). Carbamoyl glucuronides are generally formed from primary and secondary amines by non-enzymatic adduction of CO2 and rapid glucuronidation of the carbamic acid. Two other metabolites observed in rat bile, for example, and characterized as carbamoyl glucuronide analogs of the desulfurized metabolite M13 (i.e., M16 and M18), displayed the same MS fragment ion pattern, but were separated by ∼3 minutes chromatographically. Since carbamoyl glucuronides are not subject to acyl migration, our suggestion to their structures is that they represent two carbamoyl glucuronide isomers of the desulfurized metabolite M13, in which the carbamoyl glucuronide is linked to either the primary amine or the pyrrole nitrogen atom. The significantly different retention times are then consistent with the primary amine nitrogen being free and ionized for one of the isomers but not the other in the acidic LC system. Assessed altogether, M7 does not give cause for concern as a glucuronide conjugate.
Another important species comparison relates to the metabolite profiles in plasma and the link to safety assessment of human plasma metabolite exposures. Here, the 14C studies add confirmation that the early studies on the non-radiolabeled compound used in the cross-species metabolite exposure comparison is relevant, with no new significant metabolites, unique or disproportionate to human, discovered. The human plasma metabolites observed in the early studies were M5, M7, M9, M11, and M12. Apart from M7, none of those metabolites exceeded 10% DRE (i.e., the sum of AZD4831 and those five metabolites). However, with M7 representing 75%–80% of total DRE, the other metabolites were also included to assess their exposure ratios in relation to the animal species used in the toxicity studies on AZD4831 (i.e., rats and dogs). The exposure to those metabolites, including M7, were covered to at least a 1:1 ratio in rats and/or dogs at the highest NOAEL dose, in comparison with the three dose levels of the MAD study, thus fulfilling recommendations of regulatory guidance documents with respect to exposure coverage (ICH, 2012; U.S. Department of Health and Human Services, 2020). In the 14C studies, the same metabolites were observed in rat plasma, although in human plasma, two additional minor metabolites were detected, M16 and M17, representing the desulfurized or hydroxylated carbamoyl glucuronides, respectively (Bhattacharya et al., 2022). As far as safety of those metabolites concerns, M16 and M17 were observed at levels <6% of DRE in human plasma, and both represent stable carbamoyl glucuronides that would generally be regarded to be of no safety concern. Nonetheless, M16 and M17 would not be defined as unique human metabolites because they were indeed excreted via bile in rats.
In conclusion, studies on the metabolism of AZD4831 in animals and human has led to several interesting observations of the metabolism of the primary aliphatic amine and thiourea motifs of this drug candidate. Metabolism of those groups included formation of carbamoyl glucuronide, acetyl, and sulfamate conjugates; desulfurization with or without cyclization; and oxidative desulfurization. The most notable result is the high plasma exposure to the carbamoyl glucuronide M7 in human, likely explained by the significantly higher plasma protein binding compared with animal species studied. Human plasma metabolites were adequately exposed to rats and/or dogs in the general toxicity program as per MIST guidance and should not be human metabolites of safety concern. Metabolite profiles in mouse were similar to those of rat, and the metabolite profiles of HFpEF patients and healthy volunteers were also similar.
Acknowledgments
The authors thank Oxford PharmaGenesis for editorial support during the finalization of the manuscript and Prime Global for support with submission, supported by AstraZeneca according to Good Publication Practice guidelines.
Authorship Contributions
Participated in research design: Jurva, Weidolf, Sandinge, Leandersson, Ekdahl, Amilon, Gopaul.
Conducted experiments: Sandinge, Leandersson, Ekdahl, Li, Antonsson, Sundell, Westerlund.
Contributed new reagents or analytic tools: Antonsson, Sundell, Westerlund, Inghardt.
Performed data analysis: Jurva, Weidolf, Sandinge, Leandersson, Ekdahl, Li, Sundell, Amilon, Inghardt, Gopaul.
Wrote or contributed to the writing of the manuscript: Jurva, Weidolf, Sandinge, Leandersson, Ekdahl, Li, Antonsson, Sundell, Westerlund, Amilon, Inghardt, Gopaul.
Footnotes
- Received August 30, 2022.
- Accepted December 15, 2022.
This study was funded by AstraZeneca.
U.J., A.-S.S., C.L., A.E., X.L., T.A., J.S., K.W., T.I., and V.S.G. are employees of AstraZeneca and may hold stock in the company. L.W. and C.A. are former employees of AstraZeneca and may hold stock in the company.
↵1These authors contributed equally to the work presented.
↵
 This article has supplemental material available at jpet.aspetjournals.org.

Abbreviations
- ADME
- absorption, distribution, metabolism and excretion
- AMS
- accelerator mass spectrometry
- AUC
- area under the curve
- BDC
- bile duct cannulated
- DRE
- drug-related exposure
- ESI
- electrospray ionization
- FDA
- Food and Drug Administration
- GLP
- good laboratory practices
- H2O2
- hydrogen peroxide
- HFpEF
- heart failure with preserved ejection fraction
- HRMS
- high-resolution mass spectrometry
- LC
- liquid chromatography
- LC-MS
- liquid chromatography-mass spectrometry
- LC-RAD
- liquid chromatography-radioactivity detection
- LSC
- liquid scintillation counting
- MAD
- multiple ascending dose
- MeCN
- acetonitrile
- MeOH
- methanol
- MIST
- metabolites in safety testing
- MPO
- myeloperoxidase
- MS
- mass spectrometry
- MS-MS
- tandem mass spectrometry
- NaCl
- sodium chloride
- NaPO4
- sodium phosphate
- NOAEL
- no observed adverse event level
- Q-TOF
- quadrupole time of flight
- RAD
- radioactivity detection
- UHPLC
- ultra-high-performance liquid chromatography
- Copyright © 2023 by The Author(s)
This is an open access article distributed under the CC BY-NC Attribution 4.0 International license.


