
Abstract
This review encompasses the most important advances in liver functions and hepatotoxicity and analyzes which mechanisms can be studied in vitro. In a complex architecture of nested, zonated lobules, the liver consists of approximately 80 % hepatocytes and 20 % non-parenchymal cells, the latter being involved in a secondary phase that may dramatically aggravate the initial damage. Hepatotoxicity, as well as hepatic metabolism, is controlled by a set of nuclear receptors (including PXR, CAR, HNF-4α, FXR, LXR, SHP, VDR and PPAR) and signaling pathways. When isolating liver cells, some pathways are activated, e.g., the RAS/MEK/ERK pathway, whereas others are silenced (e.g. HNF-4α), resulting in up- and downregulation of hundreds of genes. An understanding of these changes is crucial for a correct interpretation of in vitro data. The possibilities and limitations of the most useful liver in vitro systems are summarized, including three-dimensional culture techniques, co-cultures with non-parenchymal cells, hepatospheres, precision cut liver slices and the isolated perfused liver. Also discussed is how closely hepatoma, stem cell and iPS cell–derived hepatocyte-like-cells resemble real hepatocytes. Finally, a summary is given of the state of the art of liver in vitro and mathematical modeling systems that are currently used in the pharmaceutical industry with an emphasis on drug metabolism, prediction of clearance, drug interaction, transporter studies and hepatotoxicity. One key message is that despite our enthusiasm for in vitro systems, we must never lose sight of the in vivo situation. Although hepatocytes have been isolated for decades, the hunt for relevant alternative systems has only just begun.
1 Introduction
In 2007, a review on the “current understanding of the regulation of metabolic enzymes and transporter proteins, and pharmaceutical practice for the use of hepatocytes in metabolism, enzyme induction, transporter, clearance, and hepatotoxicity studies” was published (Hewitt et al. 2007). This review was the result of a symposium dedicated to the characterization and use of hepatocytes (organized by the “Medicon Valley Hepatocyte User Forum”) and written by presenters at the meeting. Since this time, there have been a number of advances in the understanding of hepatocyte functions, cell signaling, and mechanisms in liver toxicity, as well as culture techniques such as 3D cultures and co-culture with non-parenchymal cells (NPCs). More recently, great advances have also been made in the generation of hepatocyte alternative models from iPS cells, embryonic stem cells, etc. This prompted a number of original authors to collaborate with other experts in the fields of hepatocytes, NPCs, toxicology and drug metabolism to compile an update of research since 2007—there have been many developments, reflected quite magnificently in the size of this tome! Most sections include a list of key questions and “take home messages” so that the reader can select topics accordingly. The result is a comprehensive overview of “all that is hepatic,” from the structure of the liver to cell isolation tips (including a supplementary section with detailed protocols for the isolation and culture of human and rodent hepatocytes) and to mechanisms involved in hepatocyte differentiation and function, metabolism, disease and drug-related liver injury.
2 Structure and cellular components of the liver


2.1 Cell composition and organization
The cellular composition of the liver is summarized in Fig. 1a, b and Table S1 (see ESM). The liver lobule is the histologically well-defined structural unit of the liver (Fig. 2). A lobule has a hexagonal shape, a diameter of approximately 1 mm and the thickness is about 2 mm. In adults, the lobule consists of hepatocyte plates (aka cords), which radiate from a central vein in the center of the hexagon. Adjacent hepatocytes are joined by tight junctions. The tight junctions delimit the bile canaliculi with a diameter of about 1 μm. The hepatocytes in a plate are exposed on both sides to capillaries (sinusoids). The human liver contains about one million lobules. At each vertex of the hexagonal, lobule is a portal triad. A portal triad comprises an artery, a vein and a bile duct bundled by connective tissue. Liver metabolism, oxygenation and extracellular matrix (ECM) distribution are best understood by assuming that the portal triad is the center of symmetry instead of the central vein. Then, the hepatic acinus becomes the smallest liver functional unit and is defined as the population of hepatocytes supplied by one portal triad, i.e. a microcirculatory functional unit. The acinus extends over a roughly elliptical region comprising the hepatocytes from two adjacent lobules. The short axis of the ellipse is the line connecting two portal triads, the long axis connects two central veins (Fig. 2). The length of the long axis is approximately 1 mm. In the acinus area, the hepatocytes are exposed to a spatial biochemical gradient that influences metabolism and gene expression. The gradient is established by the changes in plasma composition and oxygenation occurring downstream to the blood flow in the space between the periportal and the perivenous areas (Jungermann and Kietzmann 1996, 1997; Kietzmann and Jungermann 1997). The blood from the portal vein supplies 80 % of the liver’s blood and contains nutrients that are absorbed from the digestive tract. From the periportal to the perivenous zone, the oxygen concentration drops from about 13 % v/v (equivalent to partial pressure of 60–65 mmHg and to a free concentration of 84–91 μmol/l, periportal) to 9 % v/v (mixed periportal) and finally to 4 % v/v (equivalent to a partial pressure of 30–35 mmHg and to a free concentration of 42–49 μmol/l, perivenous) (Allen and Bhatia 2003; Kietzmann et al. 2006). The oxygen gradient in the acinus regulates the spatial expression of genes encoding carbohydrate-metabolizing enzymes, including pyruvate carboxykinase 1 (mostly expressed in the periportal region), glucokinase and liver pyruvate kinase (both mostly expressed in the perivenous region), through oxygen-responsive transcription factors, such as NRE and HIFs (Kietzmann et al. 2006). This is the so-called metabolic zonation of the liver.

a Cellular composition and architecture of the liver. Hepatocytes have two basolateral sides that face the sinusoidal blood vessels. The apical side consists of invaginations of the plasma membrane of adjacent hepatocytes. These invaginations form the strongly interconnected bile canaliculi. Tight junctions separate the apical compartments from the basolateral compartment. Adapted from Sasse et al. (1992). b Immunohistochemical analysis of cell components of normal human liver tissue: 1 hepatocytes (Hepar, ×400); 2 biliary epithelial cells (CK7, ×400); 3 endothelial cells (CD31, ×100); 4 vascular endothelial cells (CD34, ×100); 5 endothelial cells in lymphatic vessels (D2-40, ×100); 6 perineural cells of a nerve (S100, ×100); 7 stellate cells (S100, ×600); 8 laminin deposition in the vicinity of bile ducts (+) and vessels (−), indicating smooth muscle cells as well as a stellate sell (*) in a sinusoid (×400). All primary antibodies from DAKO®. Detection system: EnVision Flex high pH (Link)

Organization of the liver lobule and acinus. Based on the local blood composition, the acinus is roughly divided into three zones, 1 periportal, 2 transitional and 3 perivenous. The periportal zone is close to the portal triad vasculature and supplied by highly oxygenated blood (O2 partial pressure 60–70 mmHg). The perivenous zone is proximal to the central vein and receives poorly oxygenated blood (O2 partial pressure 25–35 mmHg). If no specific zonal mechanisms are active (such as pericentral metabolic activation of many hepatotoxic compounds, because many CYP enzymes are preferentially expressed in the center of the liver lobules), toxicity becomes visible at first in the periportal region, as this is the first zone to filter blood (Allen and Bhatia 2003). Adapted from Bacon et al. (2006)
Compared to other organs, the liver is not particularly rich in ECM. Nevertheless, the ECM plays an important role in maintaining the differentiated phenotype of hepatocytes and NPCs (Martinez-Hernandez and Amenta 1993; Schuppan et al. 2001). Significant ECM alterations are observed in liver cirrhosis and fibrosis (Schuppan et al. 2001; Wells 2008a). The phenotypic changes induced by increasing the ECM stiffness are summarized in Table 1. As expected, isolated hepatocytes de-differentiate when cultured on hard 2D substrates that increase the ECM stiffness to favor a proliferative rather than differentiated cellular phenotype (Wells 2008a, b). The ECM composition roughly follows a gradient in the region comprised between the periportal and the perivenous areas (Table S2; see ESM). Basement membrane proteins (consisting of laminin, collagen type IV and perlecan) are mostly concentrated around the portal blood vessels and the larger venes. Here, the ECM composition is similar to that of other epithelial organs. By contrast, the basement membrane is absent in the parenchyma. The ECM in the parenchyma is located in the space of Dissé between the hepatocyte plates and the sinusoids (Fig. 3). Fibronectin and collagen I dominate in the parenchyma, with smaller amounts of collagen type III. The effect of the matrix components is striking in hepatic progenitor cells. Collagen I favors the differentiation of hepatic stem cells, while laminin maintains stemness (McClelland et al. 2008).


Distribution of extracellular matrix (ECM) in the liver acinus. A basement membrane is localized in the periportal and perivenous regions. Fibronectin is the main ECM component of the liver parenchyma, and it is localized in the space of Dissé. Adapted from Rodés (2007)
Hepatocytes take up substances destined for the bile, e.g. bile salts, via the basolateral membrane and secrete or excrete them across the canalicular membrane into the canaliculi, where they enter the biliary tree (Hofmann 2009). This functional polarity requires a strict partition of protein and lipid components in the different plasma membrane domains (Evans 1980; Coleman 1987; Wang and Boyer 2004). As a consequence, transport functions and transport proteins are expressed in a highly polar manner in hepatocytes (Meier 1988) (Fig. 4). To yield a domain-specific polar distribution of membrane proteins in the hepatocyte plasma membrane, the distribution of newly synthesized membrane proteins requires sorting processes. Hepatocyte basolateral proteins, as well as many of the canalicular proteins, after their biosynthesis in the endoplasmic reticulum, are targeted directly from the trans-Golgi network to the basolateral membrane, where canalicular proteins are subsequently endocytosed and transported to the apical domain by transcytosis (Bartles et al. 1987; Schell et al. 1992). This is different in columnar epithelial cells, where sorting occurs at the level of the trans-Golgi (Hubbard et al. 1989). By contrast, newly synthesized canalicular ABC transporters are directly targeted to the canalicular membrane (Sai et al. 1999; Kipp and Arias 2002). For Ntcp, the basolateral uptake transporter for conjugated bile salts, sorting to the basolateral membrane relies on (a) cytoplasmic sorting signal(s), as site-directed mutagenesis of Ntcp identified two tyrosine residues located in the cytoplasmic tail of Ntcp to be crucial for basolateral sorting of Ntcp (Sun et al. 2001). Studies investigating sorting of apical proteins identified a multiplicity of signals and mechanisms (Delacour and Jacob 2006; Weisz and Rodriguez-Boulan 1992), which are cell-type-specific. Interestingly, in hepatocyte cell lines, lipid rafts were shown to be involved in the transcytosis and direct apical trafficking of canalicular proteins (Nyasae et al. 2003; Slimane et al. 2003).

Transport polarity of human hepatocytes. Sodium-dependent uptake of bile salts is mediated by NTCP, while OATP1B1 and OATP1B3 are responsible for sodium-independent bile salt uptake. Canalicular export of bile salts is mediated by BSEP. Glucose is taken up from blood by GLUT transporters. Xenobiotics are taken up by OATPs, OATs and OCTs and exported into bile by MDR1, MRP2 and BCRP (ABCG2) for fecal elimination. Some drugs are exported back into the blood for renal elimination by MRP3 and MRP4. Biliary lipid secretion, phosphatidylcholine (PC) and cholesterol require the concerted action of BSEP, MDR3 and ABCG5/ABCG8
All the different functions of the liver are tightly linked to the complex assembly of highly specialized cell types organized in the sinusoidal unit embedding hepatocytes into a structural–functional organization, with the different NPCs of the liver, such as sinusoidal endothelial cells, hepatic stellate cells and liver macrophages (also termed as Kupffer cells). Hepatocytes are the major parenchymal cells carrying out most of the metabolic functions and account for the majority of the total liver cell population. The majority of circulating plasma proteins such as albumin, transporters, protease inhibitors, blood coagulation factors and modulators of immune complexes and inflammation is expressed by hepatocytes. They control the homeostasis of molecules such as glucose/glycogen, triglycerides, cholesterol, bile acids, and vitamins A and D and metabolize amino acids, metals and endogenous compounds such as heme and bilirubin. Ammonia detoxication and pH regulation need urea synthesis, that is performed by hepatocytes, so ammonia metabolism is often used as a functional marker of hepatic phenotype (Lippincott 1993; Saunders 1996; Michalopoulos 2007; Tanaka et al. 2011). Classic columnar epithelial cells are “leaning” with their basal membrane on the ECM and are facing with their apical or brush border membrane the external space. They are in addition connected to neighboring cells at their lateral membrane by tight junctions and desmosomes. In contrast, hepatocytes bear a unique topology: their apical domain (canalicular plasma membrane) is forming a tubular system by the connection of two adjacent hepatocytes by tight junctions. These tubuli form an anastomosing network, are called canaliculi and represent the smallest branches of the biliary tree (Jansen 2000). The basolateral domain of hepatocytes is formed by the sinusoidal and lateral plasma membrane. At the sinusoidal side, hepatocytes are directly in contact with blood plasma since the sinusoidal capillaries are fenestrated and surrounded by a discontinuous basal lamina. At the lateral membrane, hepatocytes are in contact with neighboring hepatocytes via desmosomes and gap junctions. This unique architecture allows the basolateral plasma membrane to mediate an intense solute exchange with blood plasma. Bile salts are mild detergents (Hofmann and Small 1967), and therefore, the canalicular membrane needs special biophysical properties and/or protective mechanisms to prevent it from being solubilized by the high concentrations of bile salts present in the canaliculus. Lipid composition of hepatocyte plasma membrane is specific for each domain. The rat canalicular liver plasma membrane contains about two times more cholesterol and total phospholipids and has about a two times higher sphingomyelin content than the basolateral rat liver plasma membrane (Meier et al. 1984). This enrichment of the canalicular plasma membrane in cholesterol and sphingomyelin is crucial for keeping its membrane integrity. For example, in vitro experiments showed that an increase in cholesterol content in phospholipid liposomes reduces bile salt induced membrane solubilization (Zhou et al. 2009). In addition, membrane microdomains or lipid rafts contain sphingomyelin and cholesterol in tightly packed, liquid-ordered state (Rajendran and Simons 2005). Indeed, recent studies demonstrated the presence of detergent and bile salt inducible microdomains in the canalicular membrane (Ismair et al. 2009; Guyot and Stieger 2011).
The non-parenchymal areas of the liver are mainly formed by endothelial cells (19 % of the total liver cell mass) (Kmiec 2001). The liver endothelial cells lining the sinusoids are uniquely specialized. They line the sinusoids and have large pores (fenestrae) with a diameter between 0.1 µm and 0.3 µm that allow a free flow of molecules (toxicants, nutrients, hormones, proteins and further plasma soluble components) from the plasma to the hepatocytes (Fig. 2). Since, in contrast to other organs, the liver endothelial cell sinusoids lack a basal lamina; the liver has no continuous barrier between epithelial cell surface and the plasma. The remaining major cell types populating the liver are stellate cells (6 %) (Kmiec 2001) and Kupffer cells (15 %). Liver sinusoidal endothelial cells (LSCEs) are not simply barrier cells that restrict access of blood-borne compounds to the parenchyma, they are functionally specialized cells that have complex roles and display some similarities to lymphatic endothelial cells, underscoring the view that the liver also displays features of a lymphatic organ. This includes not only receptor-mediated clearance of endotoxins, bacteria and other compounds, but also the regulation of inflammation, leukocyte recruitment and host immune responses to pathogens. Apart from being equipped with scavenger receptors that facilitate efficient uptake of potential antigens, sinusoidal endothelial cells also have the unique ability to function as antigen-presenting cells for T cells, which is considered to play a role for generating immunological tolerance (Limmer and Knolle 2001). Hepatic stellate cells in turn reside within the perisinusoidal space of Dissé that is lined by parenchymal cells and sinusoidal endothelial cells. Under physiological conditions, these cells are characterized as vitamin A–storing cells, displaying neuronal and neuroendocrine markers but also a variety of markers that characterize stem cells (Kordes et al. 2007; Kordes et al. 2008, 2009). Their recognition as the cellular source of myofibroblasts characterizing hepatic fibrosis has launched an era of astonishing progress in understanding the mechanistic basis of hepatic fibrosis progression and regression during chronic inflammatory diseases of the liver (Reeves and Friedman 2002; Atzori et al. 2009). This rather simple view of hepatic stellate cells as the major source of proliferative, contractile and fibrogenic cells has meanwhile been replaced by a remarkably broad spectrum of functions including stem cell–like features not only in liver injury, but also in regeneration (Kordes et al. 2009), intermediary metabolism and immunoregulation (Crispe 2009; Atzori et al. 2009). Liver macrophages are present in the microvessels of the sinusoids and under homeostatic conditions represent about 15 % of total liver cell population. The fact that the liver harbors almost 80–90 % of all tissue macrophages in the body (Bouwens et al. 1986), located in a strategic position for screening of pathogens, which enter the liver via the portal venous blood underscores the important role of the liver for systemic acute phase response and innate immunity. Apart from having vital homeostatic functions as a kind of “janitorial” cell responsible for the removal of cellular debris and clearance of exogenous material, macrophages are central to innate immunity with key functions in host defense against invading pathogens. Macrophages have a remarkable plasticity, enabling them to efficiently respond to environmental signals and modify their phenotype. They rapidly recognize potential danger from exogenous and endogenous sources and undergo activation, enabling them to launch biochemical attack and to involve hepatocytes and the other NPCs of the liver into the inflammatory process by releasing a variety of mediators including cytokines, chemokines, eicosanoids, proteolytic enzymes, reactive oxygen species (ROS) and nitric oxide; as they induce the expression of adhesion molecules and secrete chemotactic signals, liver macrophages are also involved in recruiting and retaining non-resident cellular players to the liver such as neutrophils, natural killer cells, and may further enlarge their own population by recruiting monocytes from circulation that subsequently differentiate into macrophages (Kolios et al. 2006). Thereby macrophages are not only important constituents of innate immunity but also relevant for regulation of liver regeneration and are critical regulators of hepatocyte function. Hence, they are considered to be the major source of mediators that control acute phase protein production in hepatocytes but also influence the metabolic and detoxifying capacity of hepatocytes. An in-depth understanding of the intercellular communication between hepatocytes and macrophages and the integration of macrophage-derived signals into hepatocyte function therefore is of high clinical and scientific relevance. A more detailed description of NPCs and their role in drug-induced liver injury (DILI) is reviewed in section “Non-parenchymal cells and their role in hepatotoxicity,” and in vitro models using macrophages are detailed in section “Co-cultures of hepatocytes and macrophages.”
2.2 Zonal heterogeneity of hepatocytes
Liver metabolism comprises an immense spectrum of interrelated anabolic and catabolic functions which are performed simultaneously without affecting each other or leading to futile cycles and other forms of wasting energy. In order to cope with this challenge, liver parenchyma shows a considerable heterogeneity and functional plasticity, known as “metabolic zonation” (Jungermann and Katz 1982; Gebhardt 1992). Different metabolic pathways are carried out in different zones and sometimes even single cell of the liver lobules, the smallest structural and functional units that can be discerned in liver sections. They appear mainly as hexagonal entities, but may also comprise pentagons as well as heptagons that are clearly defined by vascular elements (for comprehensive review of lobule structures in murine liver see Lamers et al. (1989). At their periphery, three adjacent lobules are grouped around a triangular structure of dense connective tissue, the Glisson trias, which contains the blood supply for conical sectors of all three adjacent lobules. Each Glisson trias contains two afferent vessels (the portal venule and the hepatic arteriole) as well as the bile ductule. In the center of the lobules, one efferent vessel, the hepatic venule or so-called central vein, is located that drains the blood from the lobule, i.e. from at least three different portal venules. According to their localization along the porto-central axis, hepatocytes are grouped into three different zones, the zone 1 (periportal), zone 2 (midzonal) and zone 3 (pericentral). This distinction is only semantic and does not reflect the real localization of any (marker) protein.
2.2.1 Key methods for investigating metabolic zonation
In the past, parenchymal heterogeneity has been extensively characterized with respect to the major metabolic pathways, namely carbohydrate, lipid, amino acid and drug metabolism. The most frequently used techniques for investigating the microdiversity of hepatocytes in liver parenchyma were immunocytochemistry or immunofluorescence and in situ hybridization which all provided a comprehensive overview about the exact lobular expression and localization of many enzymes of these metabolic pathways (reviewed by Meijer et al. 1990; Gebhardt 1992; Jungermann and Kietzmann 1996). For example, studies suggest that gluconeogenesis is present in all hepatocytes, but predominates in the periportal zone (Fig. 5). By contrast, glycolysis is most active in part of the pericentral zone, but generally shows a relatively low activity in hepatocytes. This distribution is dynamic and varies with feeding conditions. The zonation of other major metabolic pathways is schematically illustrated in Fig. 5. The immunochemical approach was also used for localizing hepatocytes involved in the synthesis of major serum proteins usually revealing shallow gradients in protein expression (Racine et al. 1995).

Lobular zonation of different metabolic pathways. The length and thickness of the colored fields represents the localization and activity gradients of individual metabolic pathways along the porto-central axis
Studies on the functional consequences of this heterogeneity required other techniques. For example, strongly zonated hepatic ammonia metabolism was studied using isolated perfused livers performed in the antegrade (portal to central) and retrograde (central to portal) direction. This method also revealed other functions, such as intercellular glutamine cycling (Häussinger 1983) and bile salt transport (Groothuis et al. 1982). This technique was improved by including separate perfusion of both afferent vessels instead of only the portal vein (Comar et al. 2010) and provided new insight into to the influence of arterial blood in the regulation of ammonia elimination. A distinct and more versatile approach was the isolation of hepatocytes from different locations of the liver lobules. Various techniques were applied to achieve this goal. For instance, hepatocytes from different lobular zones were isolated according to their different size and density by centrifugal elutriation (Wilton et al. 1993; Botham et al. 1998; Romero et al. 1999). The most suitable separation technique leading to consistent results, the so-called digitonin–collagenase perfusion method developed independently by Quistorff (1985) and Lindros and Penttilä (1985), allows isolation of two distinct subpopulations of hepatocytes, one enriched in periportal and the other one enriched in pericentral cells. The major drawback of this ingenious isolation procedure is that only one of these subpopulations of hepatocytes can be obtained from a given liver. A general and reliable protocol of this technique was published by Gebhardt (1998). When the subpopulations are isolated from different livers (from either mice or rats), the periportal fraction amounted to 60–70 % of the hepatocytes and the pericentral to 30–40 %. Because of the inter-individual differences between the mice, the high yield for both subpopulations achieved with this technique is obtained at the expense of low comparability of the subpopulations. Therefore, another technique aiming at isolating periportal and pericentral hepatocytes from one and the same liver was developed (Tordjmann et al. 1997). However; the method is more demanding, it results in a lower cell yield, and has been successful only in rats so far. More recently, laser microdissection has proven an elegant technique for isolating cellular material from few hepatocytes located anywhere in the parenchyma including RNA samples from pericentral glutamine synthetase (GS)-expressing hepatocytes [Gebhardt, unpublished observation], but this technique does not allow the isolation of viable cells. The enrichment of periportal and pericentral hepatocytes in the isolated subpopulations is usually estimated by measuring the activities of several highly zonated enzymes such as glutamine synthetase, alanine aminotransferase and pyruvate kinase (Gebhardt and Mecke 1983; Burger et al. 1989). Since E-cadherin in the liver is present only in the periportal zone (~50 % of hepatocytes) (Ueberham et al. 2010), it can be used as a suitable marker for revealing the enrichment of periportal cells by immunocytochemical staining.
The extensive use of the digitonin–collagenase perfusion technique has provided a detailed picture of metabolic zonation. In particular, a microarray study based on the comparison of periportal and pericentral hepatocytes considerably improved our knowledge of zonation (Braeuning et al. 2006). Thus, this study provided for the first time a many-facetted picture of the subtle differences in zonation of enzymes involved in xenobiotic metabolism. While most enzymes show pericentral dominance, a small number of these enzymes exhibit preferentially periportal expression. Another remarkable paper shows a very detailed zonal distribution of enzymes involved in heme synthesis (Braeuning and Schwarz 2010a). Further contributions concern the refinement of knowledge on zonation of amino acid metabolism (Braeuning et al. 2006) and iron metabolism (Troadec et al. 2008). Despite these advances in understanding metabolic zonation, it is important to note that separation of merely two subpopulations is not sufficient to elucidate all different aspects of hepatocyte heterogeneity. For instance, a recent proteomic study in adenomatous polyposis coli KO mice provided evidence that induced GS-expressing hepatocytes are characterized by an unexpectedly low amount of glycolytic enzymes and a downregulation of many components of mitochondrial oxidative phosphorylation (Vasilj et al. 2012). It is likely, though not yet proven, that the normal GS-expressing hepatocytes residing close to the central vein in up to three cell layers, exhibit the same features (Fig. 5).
2.2.2 Factors determining metabolic zonation
Since its discovery, parenchymal heterogeneity has raised the question of how it is determined by regulatory factors. Alhough they play an important role in the determination of local cell function, hormones and metabolic signals were found not to act as primary cues of metabolic zonation (Gebhardt and Gaunitz 1997; Jungermann and Kietzmann 2000). After several decades of intensive but slow-moving investigations, it became apparent that Wnt/β-catenin signaling is a master regulator of liver zonation (Loeppen et al. 2002; Benhamouche et al. 2006). Knockout studies of β-catenin, on the one hand, resulting in interruption of the pathway, and of APC, on the other hand, resulting in its over-activation revealed that Wnt/β-catenin signaling acts in a gradient-like manner with increasing activity from the periportal to the pericentral zone (reviewed in Gebhardt and Hovhannisyan 2010). Even though the origin of this gradient and other details of Wnt pathway function remain unknown, the mystery of liver zonation seems essentially solved. For the first time, it was shown that a morphogen may determine the function of a differentiated cell according to its spatial location within a specific tissue, termed “post-differentiation patterning” (Gebhardt and Hovhannisyan 2010).
In addition to Wnt/β-catenin signaling, it was speculated that Ha-ras-dependent signaling participates in determining zonal differences in gene expression (Hailfinger et al. 2006). However, this assumption is based mainly on comparisons of mRNA and protein expression patterns of periportal and pericentral hepatocytes with those of liver tumors containing different types of mutations in signaling pathways and, thus, is not completely convincing (Gebhardt and Ueberham 2006), since tumor signaling usually shows multiple deviations from the normal counterpart. Nonetheless, there is independent evidence that other morphogens cooperate with Wnt/β-catenin signaling in specifying liver zonation and that epidermal growth hormone (EGF)-induced Ha-ras-dependent signaling may be one of these (Braeuning et al. 2007a). Up until now, however, it remains to be elucidated how other morphogens aid in specifying the zonal heterogeneity of hepatocytes.
2.3 Non-parenchymal cells and their role in hepatotoxicity
The major cell type of the liver is the hepatocyte, a parenchymal cell, which makes up to 80 % of the entire liver mass and performs the majority of the liver functions (Kmiec 2001; Lippincott 1993; Saunders 1996; Michalopoulos 2007; Tanaka et al. 2011). The other 20 % of the liver mass are comprised of NPCs such as stellate cells of the connective tissue, endothelial cells of the sinusoids, Kupffer cells functioning as in situ macrophages and immune cells, such as lymphocytes (T cells, B cells, natural killer (NK) and especially NKt cells) and leukocytes (neutrophils, monocytes and dendritic cells) (Taub 2004; Tacke et al. 2009). Most of the current activities in developing in vitro test system for hepatotoxicity focus on the parenchymal cell, the hepatocyte itself. Great efforts are made to establish conditions to maintain in vivo activities of primary hepatocytes. Moreover, large research programs have been initiated to differentiate human hepatocyte-like cells from stem or precursor cells (Fletcher et al. 2008; Agarwal et al. 2008; Cai et al. 2007). However, recent studies have provided evidence that, upon an initial damage to hepatocytes, a secondary response occurs that involves several types of NPC or immune cells and may dramatically aggravate the initial damage (Liu et al. 2004, 2006a; Ochi et al. 2004), The main cell types involved in hepatotoxin-induced liver damage are shown in Table 2. It is thus questionable whether hepatotoxicity can be sufficiently predicted in vitro by analyzing only one cell type, i.e. the parenchymal cell. For example, many hepatotoxic compounds, e.g. methapyrilene, thioacetamide, piperonyl-butoxide (Ellinger-Ziegelbauer et al. 2008), do not, or only at extremely high concentrations, kill hepatocytes in vitro, which might be explained by the lack of a “second hit,” perhaps inflammatory cells, absent in in vitro systems that use hepatocytes alone. Although there is a wealth of information on the functional properties of NPCs in different pathological context, their precise contribution to hepatotoxicity has only recently been investigated. These seminal studies have generated great interest in the scientific community and in some cases also have raised important questions that challenge the validity of the experimental approaches. Evidently, a definite role for each NPC cannot be drawn based on a single methodology. Nevertheless, these studies have succeeded in setting up the stage for more refined investigations. It is critical to understand the communication between NPC cell types and hepatocytes and how this contributes to hepatotoxicity. These hepatocyte–NPC interactions would gain even further relevance if their degree depends on physicochemical properties of the compounds. Relatively little is known in this field (Rubbia-Brandt et al. 2004; DeLeve 1996; Wang et al. 2000); however, one example demonstrating a compound-specific effect is vinyl chloride. Like many other compounds, it is metabolically activated in hepatocytes and is hepatotoxic. However, a long-term effect of vinyl chloride is not only hepatocellular cancer but it also causes a very rare tumor of the liver, hemangiosarcoma, which arises from LSECs (Cohen et al. 2009). This “communication” between hepatocytes and LSECs is very specific for vinyl chloride and not observed for many other genotoxic compounds activated by hepatocytes (Cohen et al. 2009).
In the following section, the characteristics and transporter function of a number of NPCs and their contribution to hepatotoxicity with a particular focus on acetaminophen are reviewed. Acetaminophen-induced liver damage is perhaps the best understood model of drug-induced liver injury. Hence, it is not surprising that most studies on the role of NPCs in hepatotoxicity are based on acetaminophen intoxication. Acetaminophen induces direct cell death with features of apoptosis and necrosis (Cover et al. 2005). It is well established that necrotic cells release strong pro-inflammatory molecules such as DNA and high mobility group box protein-1 (HMGBP1) (Jaeschke et al. 2012b). Thus, it is very likely that this early necrotic cells trigger an inflammatory response (Kono and Rock 2008). Another indication for the involvement of NPCs in acetaminophen toxicity is the finding that precision-cut liver slices, that contain all the liver cell types, are more sensitive than isolated hepatocytes for acetaminophen cell death (Hadi et al. 2013). The role of NPCs in immune-mediated hepatotoxicity is described in detail in section “Immune-mediated iDILI.”
2.3.1 Liver sinusoidal endothelial cells
Liver sinusoidal endothelial cells (LSECs) are specialized endothelial cells characterized by fenestrations and the lack of a basement membrane (Wisse et al. 1996; Iwakiri and Groszmann 2007). This vascular endothelium provides more than just a physical barrier for blood circulation. It actively participates in inflammatory reactions by several mechanisms, including (1) detection of pathogen-associated molecular patterns (PAMPs, e.g. lipopolysaccharide, lipoteichoic acid (LTA), N-acetyl muramyl peptide (NAM)) or damage-associated molecular patterns (DAMPs, e.g. DNA), (2) secretion of cytokines and chemokines to recruit and activate leukocytes and (3) expressing adhesion molecules that favor the attachment and extravasation of leukocytes to the site of injury (Pober and Sessa 2007). LSECs have unique properties. They possess a strong scavenging capacity, which mediates the uptake of several waste macromolecules such as hyaluronic acid, collagen α-chains and modified low-density lipoproteins (LDL) (Li et al. 2011; McCourt et al. 1999; Malovic et al. 2007).
As described above, LSECs contain numerous fenestrae (Elvevold et al. 2008) that allow passage of proteins and large macromolecules (e.g. lipoproteins). In acute liver damage, LSEC suffer structural alterations that can promote inflammation. Electron microscopy revealed that within 2 h of acetaminophen intoxication in mice, LSECs exhibited many gaps throughout the cytoplasm that were formed by destruction and/or coalescence of fenestrae (McCuskey et al. 2005; Ito et al. 2003a). This effect was observed both in isolated LSECs and LSECs in liver tissue. Moreover, the gaps formed through LSECs permitted the passage of erythrocytes to the space of Dissé, indicative of hemorrhage and collapse of the sinusoidal wall (McCuskey et al. 2005).
LSECs express Toll-like receptors (TLRs) that detect bacteria or self-damage debris and trigger signal transduction pathways that promote inflammation (Wu et al. 2009). Upon acute intoxication, damaged hepatocytes release intracellular molecules which can activate TLRs in LSECs, including heat shock proteins (Hsp) and fragmented DNA rich in cytidinephosphate-guanosine (CpG-DNA) (Jaeschke et al. 2012a, b). LSECs express TLR9, and can efficiently recognize CpG-DNA in vitro and in vivo, as demonstrated by the uptake of FITC-labeled CpG-DNA either added to culture medium or injected intravenously in vivo (Martin-Armas et al. 2006). In addition to TLR9, LSECs express the adaptor molecule, MyD88, which mediates signal transduction pathways from activated TLR. Indeed, uptake of CpG-DNA into LSECs led to activation of the NF-kappaB signaling pathway, as indicated by nuclear localization of phosphorylated NF-kappaB (Martin-Armas et al. 2006). Furthermore, culture of LSECs in the presence of CpG-DNA enhanced the secretion of interleukin (IL)-1β (20 % over control) and IL-6 (40 % over control) into the medium (Martin-Armas et al. 2006). LSECs express adhesion molecules that are important for leukocyte attachment and further extravasation to the site of injury, namely intercellular adhesion molecule-1 (ICAM-1). Under conditions of liver damage by CCl4, the expression of ICAM-1 increases with a peak 24 h after injection (Neubauer et al. 2000). This may have important consequences in terms of tissue damage, since engagement of ICAM-1 by its receptor Mac-1 in neutrophils causes their degranulation and extensive oxidative stress (Jaeschke 2003; Shappell et al. 1990).
Recently, a study based on 3D tissue reconstruction and mathematical modeling has demonstrated that LSECs play a key role in the establishment of functional tissue structure (Hoehme et al. 2010). After cell division, hepatocytes orient themselves in the direction of the closest sinusoid, a process named “hepatocyte-sinusoid alignment” (HSA), which is essential for the restoration of liver microarchitecture. The importance of LSECs for liver regeneration is also illustrated by the fact that many hepatotoxic compounds that require metabolic activation by cytochrome P450 enzymes (CYPs) (e.g. acetaminophen and CCl4) kill almost all hepatocytes in the center of the liver lobules, because the relevant CYPs are mostly expressed in this pericentral region. While most hepatocytes are killed, a substantial fraction of LSECs survive and seem to be sufficient to serve as “guide rails” for regenerating hepatocytes that migrate from the outer surviving hepatocyte fraction into the inner dead cell mass (Hoehme et al. 2010). Besides their role in establishing functional liver microarchitecture, LSECs also coordinate hepatocyte proliferation during liver regeneration (Ding et al. 2010). Using a zoo of knockout mice, it has been demonstrated that LSEC-derived factors, particularly HGF and Wnt2, play a critical role in regenerative LSEC–hepatocyte communication.
2.3.2 Kupffer cells
Kupffer cells represent resting tissue macrophages which upon liver damage synthesize and secrete the pro-inflammatory cytokines tumor necrosis factor α (TNFα) and IL-1β (Roberts et al. 2007). Both cytokines can potentially cause hepatocyte killing by activation of signal transduction pathways that lead to apoptosis, such as p38, JNK and generation of ROS (Wajant et al. 2003). In addition, TNFα from Kupffer cells was reported to activate LSECs leading to deposition of fibrin in liver tissue which may cause ischemia and hypoxia (Roberts et al. 2007). Furthermore, Kupffer cell–secreted cytokines may attract and activate immune cells which in certain cases can exacerbate the initial damage (Roberts et al. 2007). Hence, they can potentially have a damaging role in acetaminophen toxicity. In early studies, their contribution to hepatotoxicity was assessed by treating acetaminophen-intoxicated mice with gadolinium chloride (GdCl3), a compound that inhibits phagocytic activity and generation of ROS in macrophages (Lee et al. 2004), and depletes macrophages in the periportal zone of the liver (Hardonk et al. 1992). Mice and rats injected with GdCl3 showed reduced liver damage after acetaminophen intoxication (Michael et al. 1999), supporting the concept of a harmful role of Kupffer cells in acetaminophen-induced hepatotoxicity (Michael et al. 1999; Laskin et al. 1995). However, recent reports suggest that these results are questionable. In these studies, Kupffer cell depletion was achieved by clodronate liposomes injection, a technique that efficiently depletes all resident macrophages from liver and spleen (van Rooijen 1989; van Rooijen and Sanders 1997). As expected, Kupffer cell depletion abrogated both TNFα and IL-1β induction (Ju et al. 2002; Campion et al. 2008), which would be expected to reduce the extent of acetaminophen toxicity. However, contrary to the GdCl3 reports, clodronate Kupffer cell depletion enhanced hepatotoxicity induced by acetaminophen (Ju et al. 2002; Campion et al. 2008). The mechanism for the protective effect of Kupffer cells was explained in part by a Kupffer cell–dependent induction of hepatic transporters, particularly Mrp4, which may be interpreted as a defense against exposure to toxic compounds (Campion et al. 2008). An alternative (or complementary) mechanism for the protective role of Kupffer cells might depend on the expression of the anti-inflammatory cytokine, IL-10. Indeed, IL-10 is strongly induced 72 h after acetaminophen intoxication, and this was completely abrogated by depletion of Kupffer cells (Ju et al. 2002; Campion et al. 2008). Of note, IL-10 was shown to protect against acetaminophen toxicity by downregulation of iNOS and peroxynitrite formation (Bourdi et al. 2002). The rather surprising fact that enhanced toxicity occurred in spite of downregulation of TNFα can be explained by studies showing that TNFα per se is not strongly hepatotoxic, as demonstrated by the observed low degree of liver damage in mice injected with TNFα (Beraza et al. 2007). Subsequent studies using GdCl3 found very little or no protection at all to acetaminophen-induced hepatotoxicity (Ito et al. 2003b; Knight and Jaeschke 2004; Ju et al. 2002). Thus, it seems that Kupffer cells are responsible for hepatoprotective responses mediated in part by induction of export pumps in hepatocytes and by secretion of anti-inflammatory cytokines.
2.3.3 Macrophages
The role of infiltrating macrophages in liver toxicity is controversial, largely due to the heterogeneity and plasticity of macrophages and difficulties in establishing effective markers to identify and study different populations of macrophages in the liver. As for Kupffer cells, it has been described that macrophages can contribute to acetaminophen-induced hepatotoxicity by producing pro-inflammatory cytokines such as TNFα and IL-1β (Goldin et al. 1996). However, macrophages can also secrete IL-10-, TGF-β- and IL-18-binding proteins, which are anti-inflammatory cytokines (Gordon 2003). In addition, in recent years, enormous progress has been achieved in the identification of different macrophage subtypes by flow cytometry, a technique that allows quantitative detection of surface antigens that reflect different macrophage populations (Geissmann et al. 2003, 2010). A current phenotypic definition of macrophages is based on their pro- or anti-inflammatory properties, which depends on the cytokine cocktail they secrete: M1 or classically activated macrophages are induced by lipopolysaccharide and Th1 cytokines (e.g. IFNγ, IL-1); M2 or alternatively activated macrophages are induced by apoptotic bodies or Th2 cytokines (e.g. IL-4, IL-10 and IL-13) (Gordon 2003; Geissmann et al. 2003, 2010). M1 macrophages release TNFα, IL-8, RANTES and IL-1β that promote the inflammatory process, whereas M2 macrophages secrete IL-1ra, TGF-β, IL-10 and PGE2, cytokines that repress inflammation and contribute to the regeneration process (Geissmann et al. 2003; Fadok et al. 1998). An elegant study by Holt et al. (2008) identified two different macrophage populations in rodent liver that reflected resident macrophages (Kupffer cells) and infiltrating macrophages (IM) based on flow cytometric analysis with two widely used markers for these cells, that is CD11b and F4/80 (Holt et al. 2008). Resident macrophages were CD11blow-F4/80high while infiltrating macrophages were CD11bhigh-F4/80low. Under control conditions, the majority of liver non-parenchymal cells were Kupffer cells (75 %), while the IM population was almost absent. However, upon acetaminophen intoxication, there was a strong and transient increase in IM that peaked at 48 h after intoxication (35 % of total liver non-parenchymal cells), while Kupffer cells followed an opposite trend, with a transient decrease that peaked also at 48 h (16 % of total liver non-parenchymal cells) (Holt et al. 2008). PCR analysis indicated that IM expressed markers that are characteristic of M2–alternatively activated macrophages (e.g. Ym1, Fizz1, Arg-1). These markers were not expressed in isolated Kupffer cells. Furthermore, IM expressed CCR2, a receptor for the macrophage-specific chemokine Mcp-1. In agreement with a role of the Mcp-1/CCR2 axis in recruitment of circulating monocytes, the IM population was completely absent in acetaminophen-treated CCR2 knockout mice. The role of IM in acetaminophen hepatotoxicity was determined by specifically depleting circulating monocytes, the precursors of infiltrating macrophages, by bone marrow irradiation 3 days prior to acetaminophen intoxication (Holt et al. 2008). This procedure only depleted the IM population (CD11bhigh-F4/80low) without affecting the KC population (CD11blow-F4/80high). Ablation of IM had a similar effect as depletion of Kupffer cells, which is a delayed recovery after acetaminophen intoxication (Holt et al. 2008). The mechanism by which IM promote the wound healing process during hepatotoxicity might depend on the secretion of cytokines that repress inflammation and contribute to the regeneration (IL-1ra, TGF-β, IL-10) (Geissmann et al. 2003; Fadok et al. 1998), but also in their ability to promote apoptosis of neutrophils. Indeed, IM from acetaminophen-treated mice induced apoptosis of mouse neutrophils in direct co-cultures (Holt et al. 2008). This effect depended on direct contact between the two cells, since IM-induced neutrophil apoptosis was almost completely abrogated when these cells were in trans-well culture dishes (Holt et al. 2008). In conclusion, the role of IM seems to be in promoting the regenerative response that follows acute liver damage, by secreting anti-inflammatory cytokines and by killing and eliminating infiltrating neutrophils at the site of injury.
Macrophages phagocytic activity as well as cytokine production can be modulated by bile acids (Calmus et al. 1992; Funaoka et al. 1999; Minter et al. 2005; Scott-Conner and Grogan 1994; Sung and Go 1999; Graf and Bode 2012). The influence of bile acids on the immune response has been reviewed recently (Fiorucci et al. 2010; Graf and Bode 2012). FXR, PXR and VDR as well as the TGR5 are expressed in peripheral blood mononuclear cells, macrophages and Kupffer cells (Fiorucci et al. 2010; Graf and Bode 2012; Kawamata et al. 2003; Keitel et al. 2008b; Schote et al. 2007). Treatment of isolated human mononuclear cells with the FXR agonist obeticholic acid (INT-747) decreased TNFα secretion and prevented differentiation of CD14+ monocytes into dendritic cells (Gadaleta et al. 2011). Because PXR activation suppresses NF-kappaB transcriptional activity in hepatocytes, a similar mechanism may apply to Kupffer cells (Hu and Li 2010; Zhou et al. 2006; Fiorucci et al. 2010). TGR5 mRNA and protein expression has been detected in CD14+ monocytes of the peripheral blood as well as in macrophages of lung, liver (Kupffer cells) and intestine (Wang et al. 2011; Keitel et al. 2008a, b; Kawamata et al. 2003). Stimulation of TGR5 in Kupffer cells by bile acids or specific agonists suppressed the lipopolysaccharide-induced mRNA expression of inflammatory cytokines such as IL-1β, TNFα, IL-6 and monocyte chemoattractant protein-1 (MCP-1) (Pols et al. 2011; Wang et al. 2011; Keitel et al. 2008a, b). TGR5 activation reduced the phosphorylation of IκBα, thereby preventing nuclear translocation of p65 and inhibiting NF-kappaB transcriptional activity (Pols et al. 2011). Thus, bile acids suppress NF-kappaB target gene expression through activation of both NRs and TGR5. The differential expression of nuclear and membrane-bound bile acid receptors in parenchymal cells and liver NPCs enables a cell-type and bile-acid-specific bile acid signaling in this organ.
2.3.4 Neutrophils
Neutrophils, the most abundant leukocytes in the blood, are professional phagocytes which are quickly recruited to sites of inflammation (e.g. bacterial infection) (Mantovani et al. 2011), where they release proteolytic enzymes stored in their granules and generate ROS (Mantovani et al. 2011). The signals triggering their recruitment are also present in sterile inflammation such as tissue injury by chemicals or trauma (McDonald et al. 2010; Rock et al. 2011). It is well established that acetaminophen toxicity induces a strong recruitment of neutrophils into the liver (Liu et al. 2004, 2006a; Williams et al. 2010; Cover et al. 2006). Yet, the role of these leukocytes in this context is highly controversial (Liu et al. 2004; Jaeschke et al. 2012b). Independent studies demonstrated that depletion of neutrophils in mice with antibodies directed against the epitope, Gr-1, dramatically decreased acetaminophen-induced liver damage (Liu et al. 2006a; Ishida et al. 2006). The increase in serum ALT was less than 50 % after neutrophil depletion (Liu et al. 2006a). Also the dead cell area in the lobules center was decreased by more than 50 %. Moreover, also survival of the mice was improved (Liu et al. 2006a). A proposed explanation for the role of neutrophils is the release of cytotoxic hypochlorous acid and chloramines from their granules. These cells can also release serine proteases that contribute to hepatocyte killing (Ramaiah and Jaeschke 2007). However, increasing evidence reveals highly controversial aspects of the neutropenia-inducing antibody approach, indicating that it induces a protective pre-conditioning in the liver. Kupffer cells actively removing antibody-tagged neutrophils become activated (Bautista et al. 1994; Jaeschke and Liu 2007). This also causes a stress response in hepatocytes inducing the expression of protective genes like metallothionein, heme oxygenase and others (Jaeschke and Liu 2007). Consistent with this, application of the neutropenia-inducing antibodies after acetaminophen injection but before the onset of injury was not protective (Cover et al. 2006). Furthermore, neutrophils recruited into the liver after acetaminophen intoxication are not activated, as indicated by their low ROS production upon phorbol ester (PMA) stimulation (Williams et al. 2010). Finally, mice deficient in ICAM-1 (Cover et al. 2006), CD18 (Williams et al. 2010) and NADPH oxidase (James et al. 2003) are not protected against acetaminophen toxicity. Altogether, in spite of initial reports on neutrophil-mediated acetaminophen hepatotoxicity, cumulative evidence strongly argues against this hypothesis. Nevertheless, it is important to consider that under certain conditions, neutrophils may induce an inflammation response that rather aggravates than repairs the injured tissue (Jungermann and Kietzmann 2000). Neutrophil-mediated toxicity has been extensively documented in ischemia/reperfusion, endotoxic shock and cholestasis-induced liver damage (Jaeschke 2003; Jaeschke and Hasegawa 2006; Jaeschke and Bajt 2006). Hence, it is puzzling why neutrophils recruited to acetaminophen-damaged livers are rather inactive, in spite of being in a pro-inflammatory milieu of TNFα and IL-1β secreted by Kupffer cells. Further studies are needed to establish the contribution of neutrophils in drug-induced hepatotoxicity.
2.3.5 Natural killer cells
Natural Killer (NK) cells are large granular lymphocytes representing a fundamental component of the innate immune system (Notas et al. 2009). As the name implies, these leukocytes are efficient cell killers by virtue of their granule content which includes perforin and serine proteases (granzymes) (Notas et al. 2009). In addition, these cells express pro-apoptotic ligands such as FasL and TNF-related apoptosis-inducing ligand (TRAIL) (Notas et al. 2009). Furthermore, NK cells contribute to inflammation by releasing cytokines such as IFNγ (Notas et al. 2009). Target cell recognition is mediated by a complex balance between activating and inhibitory signals. Normal healthy cells are protected from NK cell killing for example by major histocompatibility complex (MHC) class I molecules, which engage inhibitory receptors (Ly-49 family) in NK cells (Raulet and Vance 2006). Conversely, cells expressing ligands for killing stimulatory/activating receptors such as the NKG2D are targeted for cytolysis (Raulet and Vance 2006). Hepatocytes may be particularly prone to damaging effects by NK cells for two reasons: (1) the hepatocytes express relatively low levels of MHC class I molecules which inhibit NK cells (Ochi et al. 2004) and (2) the liver contains a specific subpopulation of NK cells lacking Ly-49 inhibitory receptors which recognize MHC class I (Ochi et al. 2004).
NK cells have been shown to mediate liver damage in a number of diseases, including primary biliary cirrhosis (Chuang et al. 2008), infection with pseudomona aeruginosa or staphylococcal-induced hepatotoxicity (Notas et al. 2009). However, relatively little is known about how NK cells contribute to chemically induced liver toxicity. A first report described an increased number of NK cells and activation (increased FasL and IFN expression) in the liver of acetaminophen overdosed mice (Liu et al. 2004). By applying a depletion strategy for NK (and NK-T) cells with an anti NK1.1 antibody, it was shown that NK cell removal protected mice from acetaminophen hepatotoxicity, as assessed by reduced serum transaminase and necrotic area compared to isotype antibody–treated mice (Liu et al. 2004). In addition, the report concluded that many of the pro-inflammatory cytokines induced upon intoxication came from NK cells (Liu et al. 2004). In support of this study, NK cells from the liver but not from spleen were able to cause killing of cultured hepatocytes in vitro (Liu et al. 2004), and NK cells activation by polycytidylic acid–enhanced hepatocyte killing in vitro (Liu et al. 2004). Furthermore, several cytokines that are secreted in response to liver damage such as IFNγ, TNFα, IL-2, IL-4 and IL-6 contribute to NK cell activation (Notas et al. 2009). Interestingly, NK and NK-T cells are a major source of interferon gamma (IFNγ) which has been shown to cause apoptosis of hepatocytes (Kano et al. 1997; McCullough et al. 2007). However, the significance of this report has been challenged by a recent study by Masson et al. which demonstrated that dimethyl sulfoxide (DMSO, which was used as vehicle for the first study) and not acetaminophen, triggers activation and recruitment of NK cells in liver (Masson et al. 2008). Furthermore, using the same anti NK1.1 antibody for NK cell depletion, Masson et al. found a protective effect only on mice injected with acetaminophen dissolved in DMSO, but no protection on saline acetaminophen solutions (Masson et al. 2008). This study indicates that NK cells may play a role in acetaminophen toxicity only if they are activated a priori, in this case by DMSO (Masson et al. 2008).
NK cells seem to have different consequences in chronic liver toxicity compared to the aforementioned acute liver damage. This may be due to the fact that in chronic liver disease another cell type, the activated stellate cell, plays a central role (Bataller and Brenner 2005). Several studies have shown that under conditions of chronic liver damage, NK cells attack stellate cells (Krizhanovsky et al. 2008; Radaeva et al. 2006). This effect is mediated by the NKG2D ligand, which activates NK cells. The NKG2D ligand was absent in quiescent stellate cells (in control livers), whereas high levels were expressed in activated stellate cells after induction of fibrosis by feeding of mice with 3,5-diethoxycarbonyl-1-4-dihydrocollidine (DCC) (Radaeva et al. 2006).
In conclusion, further investigations are needed to clearly establish the role of NK cells in acetaminophen- and xenobiotic-induced hepatotoxicity.
2.3.6 Stellate cells
Hepatic stellate cells (HSCs) reside within the space of Dissé in the liver which is formed between the parenchyma (hepatocytes) and sinusoidal endothelial cells (Bataller and Brenner 2005). Under normal conditions, these cells constitute a major storage site for retinoid (vitamin A) in the body (Bataller and Brenner 2005). Upon liver injury, HSCs undergo an activation process by which they lose vitamin A and acquire a myofibroblast-like phenotype, with increased synthesis of collagen I, α-smooth muscle actin and secretion of pro-fibrogenic factors like CTGF and TGF-β. Their role in pathology is mostly addressed in conditions of chronic liver damage, where their main function is the deposition of ECM, which limits the progression of injury and favors tissue regeneration (Bataller and Brenner 2005; Radaeva et al. 2006).
Increasing evidence suggests that HSCs can also contribute to inflammation occurring during acute liver damage, by detecting molecules released by dead hepatocytes. In response, HSCs secrete cytokines and chemokines that modulate the inflammatory response. HSCs cells express several TLRs including TLR9, which interacts with DAMPs such as CpG-DNA (Chen and Nunez 2010). In vitro, stimulating HSC with either DNA from apoptotic hepatocytes or by synthetic DNA rich in cytidinephosphate-guanosine (CpG) induces HSC activation (e.g. increased collagen I and TGF-β production, increased alpha smooth muscle actin expression) (Watanabe et al. 2007). Under conditions of acute liver damage by acetaminophen, dead hepatocytes release DNA to the extracellular space (Imaeda et al. 2009) which is detected by HSC via TLR9 (Gabele et al. 2008; Watanabe et al. 2007). Therefore, it is likely that HSCs become activated by cell debris from apoptotic/necrotic hepatocytes.
During acute liver injury, microvasculature rupture leads to tissue hemorrhage that induces activation of the coagulation cascade, which includes the proteolytic activation of thrombin. This serine protease acts as a potent activator for HSCs and myofibroblasts (Shultz et al. 1989). Thrombin also induces synthesis and secretion of Mcp-1 in HSCs, a potent chemoattractant for macrophages (Marra et al. 1995). HSCs can also actively recruit macrophages by secretion of the CC chemokine CCL5-RANTES (Regulated on Activation, Normal T-Cells Expressed and Secreted) (Schwabe et al. 2003). Expression and secretion of RANTES can be efficiently induced in isolated HSCs by stimulation with TNFα or IL-1β via NF-kappaB and JNK signaling pathways (Schwabe et al. 2003). Furthermore, incubation of murine HSCs with lipopolysaccharide, LTA or NAM triggers expression of TGF-β, IL-6 and macrophage chemoattractant protein-1 (Mcp-1) at mRNA and protein level (Brun et al. 2005). Activated HSCs can also actively recruit neutrophils. In response to culture-dependent activation in vitro or by stimulation with TNFα or IL-1, rat HSCs secrete Cxcl1/Gro1, a potent chemokine for neutrophils (Maher et al. 1998). The chemotactic capacity of conditioned media from activated HSCs was determined by the Boyden chamber technique with neutrophils as target cells. Conditioned media from HSCs at day 7 in culture, a time when HSCs have achieved culture-dependent activation, could strongly induce neutrophil migration (e.g. 20 vs. 150 neutrophils per 10× high-power field in control versus conditioned media, respectively). The role of Cxcl1 as chemoattractant in this conditioned medium was validated with the addition of an anti-Cxcl1 antibody, which strongly reduced the chemoattractant power of the conditioned media from 150 to 50 neutrophils per 10× high-power field. This effect was not observed by the addition of a control IgG (Maher et al. 1998). Thus, activated HSCs can promote the recruitment of leukocytes into injured liver.
Recent studies suggest that hepatic stellate cells have characteristics of stem cells (Kordes et al. 2007) and were recently identified as liver-resident mesenchymal stem cells (MSC) (Kordes et al. 2013). As known for MSC of the bone marrow, HSC can support hematopoiesis and differentiate into adipocytes and osteocytes (Castilho-Fernandes et al. 2011; Kordes et al. 2013). HSC maintain their undifferentiated state in the space of Dissé, which exhibits features of stem cell niches (Sawitza et al. 2009; Kordes and Häussinger 2013). Moreover, stellate cells were shown to be involved in the regeneration of liver tissue (Kordes et al. 2012). Cell differentiation experiments with isolated HSC, fate-mapping studies using the stellate cell marker glial fibrillary acidic protein and transplantation experiments with pancreatic stellate cells demonstrated that stellate cells can generate hepatobiliary cell lineages to reconstitute liver mass (Kordes et al. 2007; Yang et al. 2008; Kordes et al. 2013). Although quiescent hepatic stellate cells express the CD95 death receptor, addition of CD95 ligand does not induce HSC apoptosis, but instead triggers HSC proliferation (Reinehr et al. 2008). This is due to an inactivating tyrosine nitration of CD95 and a c-Src-dependent shedding of epidermal growth factor. Thus, HSC are obviously involved in important physiological processes that ensure liver function.
The expression of the nuclear bile acid receptors FXR, PXR and VDR has been detected in rodent and human HSCs (Fickert et al. 2009; Fiorucci et al. 2004). Treatment of bile duct ligated rats with a FXR agonist successfully attenuated liver fibrosis (Fiorucci et al. 2004). However, murine and human HSCs only showed very weak FXR mRNA expression, and FXR protein levels were undetectable in these cells independent of activation (Fickert et al. 2009). The mRNA expression of PXR in isolated human HSCs was also significantly lower compared to isolated human hepatocytes (Fickert et al. 2009). By contrast, VDR expression levels were significantly higher in human HSCs compared to human hepatocytes (Fickert et al. 2009). Activation of VDR in rats with thioacetamide-induced liver fibrosis significantly reduced fibrosis scores (Abramovitch et al. 2011). Furthermore, genetic variants of the VDR have been linked to fibrosis progression in patients with HCV infection (Baur et al. 2012). The membrane-bound bile acid receptor, TGR5, has not been detected in quiescent hepatic stellate cells (Keitel et al. 2008b).
2.3.7 Biliary epithelial cells
Biliary epithelial cells (i.e. cholangiocytes) line the tubular conduits which constitute the biliary tract. These cells are often targets in a number of human cholestatic liver diseases and therefore are important NPCs to study. Bile acids have been shown to regulate diverse cholangiocyte functions (Xia et al. 2006). Cholangiocytes express the nuclear bile acid receptors FXR and VDR (D’Aldebert et al. 2009; Gascon-Barre et al. 2003), and their activation leads to an increased expression of the antimicrobial peptide, cathelicidin, in biliary epithelial cells (D’Aldebert et al. 2009). Further studies are needed to elucidate the role of FXR and VDR in biliary epithelial cells. TGR5 has also been detected in cholangiocytes (Keitel et al. 2009, 2010; Keitel and Häussinger 2011, 2012; Häussinger et al. 2012) and is coupled to a stimulatory G-protein. TGR5 is responsive to bile acids, with taurolithocholate (EC50 = 0.29 μM) and taurodeoxycholate (EC50 = 0.79 μM) being the most potent agonists (Kawamata et al. 2003; Maruyama et al. 2002; Sato et al. 2008). In cholangiocytes, TGR5 is located in the primary cilium and apical plasma membrane (Keitel et al. 2010; Keitel and Häussinger 2011, 2012). Stimulation of TGR5 in biliary epithelial activates the cAMP-regulated chloride channel, CFTR, resulting in increased chloride secretion (Keitel et al. 2009). A rise in cyclic AMP (cAMP) may also trigger the insertion of CFTR and ASBT from an intracellular vesicular pool into the apical membrane thus facilitating transport activity (Alpini et al. 2005; Cheng et al. 1991; Howard et al. 2000). TGR5 may therefore function as a bile acid sensor coupling biliary bile acid constitution to cholangiocyte bile acid absorption and chloride secretion (Keitel and Häussinger 2011, 2012; Häussinger 2012). Furthermore, activation of TGR5 may trigger anti-apoptotic and proliferative effects in biliary epithelial cells (Keitel and Häussinger 2011, 2012; Häussinger 2012). For a recent overview on TGR5 expression and function in liver refer to Keitel and Häussinger (2012).
3 Regulatory genes and signaling pathways in the liver
3.1 MicroRNAs
MicroRNAs (miRNAs), short non-coding RNA molecules of 19–25 nucleotides in length, were recently identified to play a key role in the regulation of gene expression. Found in all animal and plant cells, as well as in viral genomes, miRNAs act as inhibitors of protein translation by binding to a short six-nucleotide region within the 3′-untranslated region (3′-UTR) of their target mRNAs (Bartel 2004; Bartel and Chen 2004). More than 1,000 miRNA molecules have been described in humans (http://microrna.sanger.ac.uk/). Present estimates suggest that about 50 % of human mRNAs appear to be miRNA targets. This makes the miRNA genes one of the most abundant classes of regulatory genes in mammals (Lewis et al. 2005; Shomron and Levy 2009). MicroRNAs are transcribed in the nucleus by RNA polymerase II and subsequently processed by multiple maturation steps, which include the initial cleavage of the transcribed primary miRNA (pri-miRNA) by the RNase III enzyme Drosha in interplay with its binding partner, DGCR8, the export to the cytoplasm and the consecutive cleavage by the endoribonuclease Dicer. These transformation steps lead to the formation of the mature double-stranded miRNA molecule. Finally, the two strands of the miRNA duplex are separated by an RNA helicase. One strand is preferentially assembled into the RNA silencing complex (RISC) to mediate the repression of translation or the degradation of the target mRNA molecule (Lund et al. 2004). MicroRNAs are expressed in a cell- or tissue-specific manner and have been demonstrated to play a role in the regulation of cell differentiation and cell replication (see section “Epigenetics and its mechanisms in the regulation of gene expression”). As a consequence, an aberrant expression of miRNAs has been repeatedly shown to be associated with the development of different cancer forms. The tissue-specific expression of miRNA molecules is especially well exemplified by the miRNA molecule miR-122. It could be demonstrated that miR-122 is most abundantly expressed in the liver, accounting for approximately 70 % of all hepatic miRNA (Chang et al. 2004; Orom et al. 2008). Two studies could show that miR-122 appears to suppress 100–200 genes in liver tissue as demonstrated in mice (Esau et al. 2006; Elmen et al. 2008a). The knockdown of miR-122 results in a decrease in hepatic cholesterol biosynthesis (Krutzfeldt et al. 2005; Esau et al. 2006; Elmen et al. 2008a). First attempts to use miR-122 as a therapeutic drug target have been already made by developing antagomirs against miR-122 and to test them as a putative treatment option for hepatitis C (Lanford et al. 2010) or for diseases associated with an aberrant cholesterol homeostasis (Elmen et al. 2008a, b). Given the central role that miRNAs play in regulating gene expression, it is not surprising that the translation of many proteins important for drug transport, drug metabolism and pharmacodynamic action appears to be regulated by miRNAs as in silico, as predicted by Rukov et al. (2011). In recent studies, research groups focused especially on the investigation of how miRNA molecules influence the translation of important NRs. As reviewed below, it appears that the most important xenosensors are targeted by miRNA molecules.
3.2 Nuclear receptors
First recognized as important xenosensors that ligand dependently modulate especially the expression of enzymes involved in the metabolism of xenobiotics, e.g. the CYP family, it has become more obvious that nuclear hormone receptors rather act as master regulators of a metabolizing network coordinating both an adequate drug transformation and the metabolism of endogenous compounds such as cholesterol and lipids. This is not only reflected in the fact that NRs target genes involved in both drug and bile acid transport and metabolism but also by the fact that NRs appear to be sensitive to drugs as well as bile acids, leading to a tight interplay between the application of therapeutics and physiological functions such as bile acid homeostasis (Pascussi et al. 2004). Forty-nine members of the NR family are currently known. The protein family has several characteristics in common. NRs are characterized by six functional regions (A–F), which show various degrees of sequence conservation. The transactivation domain AF-1 is found within the N-terminal localized A/B domain. While the DNA-binding domain (DBD), composed of two zink finger domains, is localized within the highly conserved C region, the ligand-binding domain (LBD) is found within the E region. The two remaining regions, D and F, display a linker peptide between the DBD and the LBD and a C-terminal extension region of the LBD, respectively. Typically, the LBD is able to bind agonistic or antagonistic acting ligands, such as hormones, vitamins, or toxins, leading to the homo- or heterodimerization of NRs. If not already constitutively expressed in the cell nucleus, the NR dimer travels from the cytoplasm into the nucleus, binds to its specific consensus sequence in target gene promoters and modulates gene expression. NR-binding sites are typically composed of a pair of 5–6 base-pair-long DNA sequences (two half-sites) which are often separated by a spacer of 1–6 bases of length (Bain et al. 2007; Urquhart et al. 2007). The actual functional impact of NRs on gene expression is not only triggered by ligand binding to the receptors but also exerted through an interaction of the NRs with co-regulatory proteins, leading to a consecutive modification of chromatin structure. Depending on their effect on NR action, co-regulators are classified as co-activators or repressors. While co-activators, e.g. enzymes such as acetyltransferases or methyltransferases, lead to chromatin relaxation and a consecutive facilitation of a further transcription factor recruitment, co-repressors lead to the recruitment of histone deacetylases (HDACs) that support chromatin condensation and suppression of gene expression (Pascussi et al. 2008).
3.2.1 Pregnane-X receptor (PXR)
The pregnane-X receptor (PXR, gene symbol NR1I2) is characterized by a wide ligand spectrum, including structurally unrelated xenobiotics, steroids, drugs and bile acids. PXR is especially highly expressed in human liver and intestine, and is also found in human breast tissue. Although originally detected as a xenosensor for different drugs, e.g. rifampicin or hyperforin/St. Johns wort, it appears that PXR is also involved in the coordinate expression of transport proteins and of metabolizing enzymes responsible for bile acid homeostasis (Staudinger et al. 2001; Wang et al. 2012a). The involvement of PXR in bile acid homeostasis is also reflected by the fact that the secondary bile acid lithocholic acid appears to be a strong agonist of PXR. Typically, PXR shares many target gene promoters of proteins involved in phase I–III metabolism with constitutive androstane receptor (CAR). This includes, among others, genes encoding members of the CYP3A and CYP2B family, the phase II enzymes sulfotransferase 2A1 (SULT2A1), UDP glucuronosyltransferase 1A1 and 1A6 (UGT1A1, UGT1A6) and the hepatic efflux transporter MRP2 (Kakizaki et al. 2012). CYP3A plays a role in bile acid detoxification since it catalyzes side-chain hydroxylations of bile acid intermediates so that they can be excreted in bile and urine (Goodwin et al. 2002). Unlike CAR, which appears to be primarily found in the cytosol and constitutively expressed in humans, PXR is especially found in the nucleus, bound to several co-repressors. Ligand activation leads to the release of these co-repressors, to a recruitment of co-activators and a consecutive promotion of transcription (Wang et al. 2012b). PXR has been shown in vitro to have the potential to prevent the cell from bile acid overload by reducing the interaction of peroxisome proliferative activated receptor gamma coactivator (PGC-1α) with hepatocyte nuclear factor-4α (HNF-4α, (gene symbol NR2A1)), thus, being able to inhibit the transcription of CYP7A1, one of the key enzymes in bile acid synthesis (Staudinger et al. 2001; Chiang 2003; Staudinger et al. 2003). Furthermore, PXR appears to be itself a transcriptional target of bile acid-activated FXR (Jung et al. 2006).
Bile acid elimination from hepatocytes is supported by PXR through its ability to upregulate the expression of MRP2, confirmed in different experiments that induced MRP2 with rifampin in enterocytes (Fromm et al. 2000), HepG2 cells (Schrenk et al. 2001) and hepatocytes (Jigorel et al. 2006). Furthermore, FXR, PXR and the CAR are able to stimulate Mrp2 expression in rodents via shared binding sites (Kast et al. 2002). As demonstrated in rodents, the expression of the hepatic uptake transporter OATP-C (SLC21A6) also appears to be upregulated by PXR (Staudinger et al. 2003; Wagner et al. 2005). Treatment with the PXR ligand, rifampicin, or the CAR ligand, phenobarbital, has been shown to ameliorate pruritus in cholestasis patients, to lower the cholestatic liver enzyme alkaline phosphatase as well as the concentration of bile acids in serum (Stiehl et al. 1972; Ghent and Carruthers 1988; Cancado et al. 1998). Comprehensive studies investigating the interplay between PXR and miRNA molecules are still needed, although it has been shown using different cell lines, including HepG2 cells, (Takagi et al. 2008), that the gene encoding PXR is targeted and suppressed by the miRNA molecule miR-148a, leading to the attenuation of the PXR-dependent induction of CYP3A4 gene expression. This observation could add to our understanding of the as yet not fully explained phenomenon that CYP3A4 shows such a high inter-individual variability in its expression.
Besides their role in bile acid metabolism, both PXR and FXR promote anti-inflammatory effects in hepatocytes (Wang et al. 2009; Zhou et al. 2006). FXR knockout mice suffer from increased liver inflammation and spontaneously develop hepatic tumors (Kim et al. 2007a; Yang and Seto 2007). Stimulation of FXR in isolated hepatocytes and HepG2 hepatoma cells significantly suppressed NF-kappaB transcriptional activity (Wang et al. 2008a). Hepatocytes from PXR knockout mice express higher levels of inflammatory cytokines such as IL-1β and TNF-α compared to wild-type mice (Hu and Li 2010; Zhou et al. 2006). Furthermore, activation of PXR in isolated hepatocytes lowered the expression of inflammatory cytokines (Hu and Li 2010; Zhou et al. 2006). It has been recently demonstrated the SUMOylation of PXR is essential for the repression of NF-kappaB target genes (Hu and Li 2010; Zhou et al. 2006). Interestingly, activation of NF-kappaB reduced transcriptional activity of FXR and PXR (Kim et al. 2003a; Wang et al. 2008a; Zhou et al. 2006), which may represent a feedback loop and underlie the downregulation of FXR and PXR target genes in liver during the acute phase response (Keitel and Häussinger 2012). The molecular mechanism for this effect may be the association of NF-kappaB-p65 with the retinoid X receptor (RXR), thereby preventing DNA binding by RXR (Zhou et al. 2006). Since RXR serves as a heterodimerization partner for several NRs (including FXR and PXR), this mechanism may apply for various NRs (Zhou et al. 2006; Wan et al. 2000).
3.2.2 Constitutive androstane receptor (CAR)
The constitutive androstane receptor (CAR, gene symbol NR1I3) is closely related to PXR with regard to sequence similarity and function. Like PXR, CAR is highly expressed in liver (Zhou et al. 2007) and intestine (Burk et al. 2005) but has also been detected in kidney and the adrenal glands (Lamba et al. 2004), testis, brain and lymphocytes (Lamba et al. 2004; Siest et al. 2008). CAR typically forms heterodimers with RXR before binding to its response elements within the 5′-regulatory regions of its target genes (Suino et al. 2004). Typical CAR ligands include androstane metabolites and xenobiotics, including drugs such as phenobarbital, clotrimazole, carbamazepine, efavirenz and nevirapine (Faucette et al. 2007) or the synthetic ligand TCBPOP. The androstane metabolites cause CAR-dependent target gene repression via the activation of repressive acting cofactors (Forman et al. 1998). CAR tends to act in strong cross talk with PXR due to its property to share the same binding sites with PXR. Thus, like PXR, CAR influences the expression of a broad spectrum of transporters and enzymes involved in drug and in bile acid transport and metabolism. Important targets include members of the xenobiotic-metabolizing phase I CYP enzymes (CYP1A1 and CYP1A2 (Yoshinari et al. 2010), CYP3A4 (Goodwin et al. 2002), CYP2B6 (Sueyoshi et al. 1999), CYP2C9 and CYP2C19 (Gerbal-Chaloin et al. 2002) and CYP2A6 (Itoh et al. 2006)) and enzymes involved in phase II drug metabolism such as the glucoronidating enzymes UGT1A1, UGT1A6 (Sugatani et al. 2001) and the sulfotransferase SULT2A1 as well as the transport proteins MDR1, MRP2 and OATP-C (Geick et al. 2001; Kast et al. 2002; Burk et al. 2005). As a regulator of SULT2A1 gene transcription, CAR appears to play an important role in bile acid detoxification. This is well reflected in the observation that mice appear to be resistant to the secondary bile salt, lithocholic acid, due to increased sulfation of this acid (Saini et al. 2004). Together with PXR, FXR/SHP, Liver X Receptor (LXR), HNF-4α and FTF/LRH-1, CAR regulates bile acid homeostasis by targeting the rate-limiting enzyme of bile acid synthesis CYP7A1 (Pascussi et al. 2007).
Comprehensive studies are still needed to investigate the interplay between CAR and a microRNA-dependent regulation of genes involved in drug and bile acid metabolism. Future studies have to show to what extent the action of CAR is influenced by small RNA molecules.
3.2.3 Hepatocyte nuclear factor 4α (HNF-4α)
HNF-4α belongs to the NR2A gene subfamily of NRs and is highly conserved between species. HNF-4α appears to be the most abundant transcription factor in the liver (Drewes et al. 1996). In addition to its strong hepatic expression, HNF-4α has also been found to be expressed in kidney, pancreas and the intestine in humans (Wirsing et al. 2011). Nine isoforms of HNF-4α have been detected in mammalian liver. The NR2A subfamily members, HNF-4α and HNF-4γ, appear to be highly expressed in mammalians and are regulated by two different promoters within the HNF-4α-expressing gene. While the synthesis of the adult protein forms HNF-4α 1-6 is controlled by the promoter P1 in the liver, the expression of the embryonic isoforms HNF-4α 7–9 is under the control of the second promoter P2 in pancreatic cells. HNF-4α has been shown to be involved in fatty acid oxidation, lipoprotein metabolism, glucose metabolism, amino acid metabolism, blood coagulation and genome replication (Chiang 2009). Being expressed predominantly in the nucleus, HNF-4α belongs to the class II orphan NR family, which was shown to be constantly active. HNF-4α acts as a homodimer and preferably binds to a direct repeat 1 (DR1) element composed of two AGGTCA-like binding sites (Jiang et al. 1995).
Several studies have demonstrated that HNF-4α plays an important role in both bile acid and drug metabolism. HNF-4α is an important transactivator of the bile acid-synthesizing genes, CYP7A1, CYP8B1 and CYP27A1, demonstrated in both rodents and humans. All three genes carry functional binding sites for HNF-4α in their promoters. The interplay between FXR and SHP is able to inhibit HNF-4α activity and, thus, to inhibit the expression of the mentioned three key enzymes involved in bile acid synthesis (Stroup et al. 1997; Chiang et al. 2000; Goodwin et al. 2000; Zhang and Chiang 2001; Chen and Chiang 2003). An important additional mechanism involves the interplay between PXR and HNF-4α in the regulation of bile acid homeostasis. It has been demonstrated that ligand-activated PXR is able to inhibit the transactivating effect of HNF-4α on the CYP7A1 promoter by directly interacting with the important HNF-4α co-activator PGC-1α (Bhalla et al. 2004; Li and Chiang 2005). Inhibitory effects on HNF-4α action have been also observed for CAR, which is able to directly compete with HNF-4α for DR1-binding sites and co-activator recruitment as demonstrated on the HNF-4α target promoters of CYP7A1 and CYP8B1 (Miao et al. 2006). Besides its modulating effects on the expression of enzymes important for bile acid synthesis, HNF-4α has been shown to regulate the expression of genes that encode transporters and enzymes involved in drug metabolism. HNF-4α directly enhances the expression of CYP2C9 and CYP2C19 (Chen et al. 1994; Kawashima et al. 2006). Furthermore, HNF-4α also appears to regulate the basal expression of other CYP family members, such as CYP3A4, CYP3A5, CYP2D6, CYP2A6 and CYP2B6 as demonstrated by several research groups (Corchero et al. 2001; Kamiya et al. 2003; Tirona et al. 2003).
HNF-4α mRNA is targeted and markedly decreased by the miRNA molecules miR-24 and miR-34a via two binding elements located in the 3′-untranslated region (UTR) and in the coding region, respectively (Takagi et al. 2010). The protein expression of HNF-4α is markedly decreased upon over-expression of miR-24 and miR-34a in HepG2 cells. The expression of CYP7A1 and CYP8B1, both important bile acid-synthesizing enzymes, is also significantly downregulated by miRNA molecules via miRNA-induced downregulation of HNF-4α. miR-34 and miR-449 are able to target the 3′-UTR of HNF-4α mRNA and, by it, to repress luciferase activity in vitro in HepG2 cells and to repress HNF-4α protein expression, which consecutively modulates the expression of the HNF-4α downstream target PXR (Ramamoorthy et al. 2012).
3.2.4 The Farnesoid X receptor (FXR)
FXR (gene symbol NR1H4) is an important member of the nuclear hormone receptor family and is highly expressed in the liver, intestine, kidney, the adrenal gland, adipose tissue and heart (Houten et al. 2007; Noh et al. 2011). FXR acts as a ligand-activated transcription factor by binding to specific DNA motifs in the promoter regions of its target genes. FXR either binds as a heterodimer together with RXR or, in rare cases, as a monomer to its consensus sequences, followed by a further recruitment of FXR-associated transactivators (Forman et al. 1995; Seol et al. 1995). In hepatocytes, FXR is an important regulator of bile acid synthesis, detoxification and transport (for recent reviews including overviews of FXR target genes see (Calkin and Tontonoz 2012; Modica et al. 2010; Lefebvre et al. 2009; Keitel et al. 2008a; Thomas et al. 2008; Kalaany and Mangelsdorf 2006). Bile acids can bind and activate nuclear bile acid receptors, including FXR (Kalaany and Mangelsdorf 2006; Lefebvre et al. 2009; Makishima et al. 1999; Parks et al. 1999; Teng and Piquette-Miller 2008), PXR (Staudinger et al. 2001; Xie et al. 2001) and the vitamin D receptor (VDR, NR1I1) (Gascon-Barre et al. 2003; Han and Chiang 2009; Makishima et al. 2002). Thus, bile acids are able to increase their cellular excretion by stimulating FXR activation of the ABCB11 gene promoter, leading to an elevated expression of BSEP and consequently, to higher bile acid efflux out of the hepatocyte. The expression profile of the different bile acid receptors determines which signaling pathways are activated by bile acids in the respective liver cells. Genes encoding enzymes essential for gluconeogenesis and glycogen synthesis are also transcriptionally regulated by FXR (reviewed in Calkin and Tontonoz 2012; Kalaany and Mangelsdorf 2006; Keitel et al. 2008a; Modica et al. 2010). Furthermore, FXR modulates triglyceride de novo synthesis as well as clearance thus controlling triglyceride homeostasis (Lambert et al. 2003; Sinal et al. 2000; Watanabe et al. 2004; for reviews refer to Calkin and Tontonoz 2012; Kalaany and Mangelsdorf 2006; Keitel et al. 2008a; Modica et al. 2010). Besides its central role in bile acid transport and metabolism, FXR acts as an important transcriptional regulator of genes involved in glucose, lipid homeostasis and carcinogenesis (Makishima et al. 1999; Parks et al. 1999; Kim et al. 2007a; Yang and Seto 2007).
FXR appears to act as a cell protecting biosensor for intestinal and hepatic cells against bile acid overload by (1) increasing the expression of transport proteins that support the elimination of bile acids from the cell (BSEP, MRP2) and bile acid detoxification (Maglich et al. 2002; Synold et al. 2001; Xie et al. 2001; Wagner et al. 2005); (2) decreasing the expression of transport proteins responsible for the uptake of bile acids into the cell (NTCP, OATP1B1, apical Na+-dependent bile acid transporter (ASBT)) and (3) inhibiting the de novo synthesis of bile acids from cholesterol (CYP27A1, CYP8B1, CYP7A1) (Kast et al. 2002; Plass et al. 2002; Bhalla et al. 2004; Han and Chiang 2009). Accordingly, PXR knockout mice show increased liver damage following lithocholic acid treatment (Staudinger et al. 2001; Xie et al. 2001). The combined activation of FXR, PXR and VDR under cholestatic conditions results in repression of bile acid synthesis and increases bile acid detoxification and excretion and may therefore protect hepatocytes from bile acid toxicity (Guo et al. 2003; Han and Chiang 2009; Maglich et al. 2002; Staudinger et al. 2001; Xie et al. 2001; Wang et al. 2002). The importance of FXR and PXR for efficient hepatoprotection is further underscored by the finding that FXR activation upregulates PXR expression (Wang et al. 2002; Jung et al. 2006). Primary bile acids, such as chenodeoxycholic acid and its conjugated derivatives, and secondary bile acids, such as deoxycholic and lithocholic acid, have been shown to act as direct ligands for FXR and, thus, to modulate the transcriptional impact of FXR on its target genes. The primary bile acid chenodeoxycholic acid and its conjugates constitute the most potent FXR ligands with an EC50 of approximately 5–10 μM, while the secondary bile acids deoxycholic acid and lithocholic acid also activate FXR, however, less efficient than chenodeoxycholic acid (Makishima et al. 1999; Parks et al. 1999; Wang et al. 1999a). Both PXR and VDR are responsive to the secondary bile acid lithocholic acid (Goodwin et al. 2003; Makishima et al. 2002; Staudinger et al. 2001).
Interestingly, FXR unfolds diverging effects on the expression of different OATP family members. While the OATP1B3 encoding gene SLCO1B3 has been shown to be transactivated by FXR (Jung et al. 2002), FXR appears to have divergent effects on the expression of the SLCO1B1 gene (Jung and Kullak-Ublick 2003). FXR can unfold a repressive effect on gene transcription via a co-repressor SHP-dependent pathway. SHP is able to interfere with HNF-4α, leading to the inhibition of HNF-4α-dependent transactivation of HNF-1α, a strong inducer of SLCO1B1 transcription. This pathway could explain the decrease in OATP1B1 expression found in liver biopsies of patients with cholestatic liver disease (Zollner et al. 2001). However, in vitro studies show that the SLCO1B1 gene can also be activated by FXR (Meyer zu Schwabedissen et al. 2011). The hepatic bile acid uptake transporter NTCP is also regulated in a FXR/SHP pathway-dependent manner. Bile acids, as well as the over-expression of SHP, strongly inhibit glucocorticoid receptor–mediated activation of the NTCP gene promoter (Eloranta et al. 2006). FXR and SHP also interplay to regulate genes involved in the de novo synthesis of bile acids. Bile acids are able to suppress their own synthesis by acting as ligands of FXR, which consecutively induces the expression of SHP, leading to a SHP-dependent inhibition of transcription factors that are able to upregulate the expression of the CYP7A1, CYP27A1 and CYP8B1. In the case of CYP7A1 and CYP8B1, SHP inhibits the transcription factors LRH-1 and α-fetoprotein transcription factor (FTF). In the case of CYP27A1, SHP targets and inhibits the action of HNF-4α (Goodwin et al. 2000; del Castillo-Olivares et al. 2004; Chen and Chiang 2003).
Direct targets of FXR also include OSTα/OSTβ, as well as the phase II metabolizing enzyme UGT2B4, which is able to transform bile acids into their hydrophilic glucuronide derivatives (Barbier et al. 2003; Landrier et al. 2006). An interesting link between bile acid homeostasis and drug metabolism is evident from the fact that FXR appears to transactivate the major drug-metabolizing enzyme, CYP3A4, which is also involved in the detoxification of bile acids. The FXR-dependent transactivation of CYP3A4 is triggered by two response elements within the distal 5′-flanking region of CYP3A4. The regulatory elements were identified within a sequence area previously shown to mediate drug–response via PXR and CAR and to contain a binding site for HNF-4α (Gnerre et al. 2004).
FXR is increasingly being recognized as a putative target of microRNAs that regulate its expression. Recently Zhong et al. (2012) investigated the impact of a changed miRNA expression profile on biliary tract cancer (BTC). On the basis of previous observations that FXR is able to act as a tumor suppressive element in hepatocellular carcinoma and breast cancer, the group investigated to which extent FXR expression is influenced by aberrantly expressed miRNA molecules. They could demonstrate that miR-421 appears to be significantly upregulated in BTC, whereby the measured miR-421 amounts correlated inversely with the FXR amounts detected in BTC probes. It was shown that miR-421 is able to directly target FXR mRNA leading to a significant loss in FXR expression. Another example for the synergistic impact of FXR and microRNA molecules on the regulation of gene expression was shown by Lee et al. (2012). They showed that FXR is able to repress the synthesis of miR-199a-3p, a miRNA molecule that targets and downregulates the transcription factor, and liver kinase B1 (LKB1). This pathway appears to be significantly downregulated by low FXR levels, which consecutively leads to low LKB1 levels as observed in patients suffering from severe liver fibrosis. Furthermore, Lee et al. (2010) demonstrated that FXR is able to SHP and p53 dependently repress the synthesis of the small RNA molecule miR-34a, an effect that leads to the upregulation of Sirtuin 1 (SIRT1) expression. SIRT1, an NAD-dependent acting deacetylase, has been shown to be critically involved in diverse cellular processes responsible for the development of metabolic diseases, cancer and aging.
3.2.5 Liver X receptor (LXR)
LXRα and LXRβ (gene names NR1H3 and NR1H2) are best known as oxysterol receptors. They belong, along with FXR and PXR, to the master regulators of lipid and cholesterol metabolism. Like several other NRs, LXR acts on target promoters by forming heterodimers with RXR. The heterodimer binds to its specific LXR response elements, a DR4 direct repeat element composed of two half-sites 5′-AGGTCA-3′ (Jakobsson et al. 2012). While LXRβ is ubiquitously expressed in different tissues, LXRα is especially found in tissues with high metabolic activity. Both LXRs have been found to preferably bind oxidized cholesterol metabolites such as 22(R)-hydroxycholesterol, 24(S), 25-epoxycholesterol or 27-hydroxycholesterol as endogenous ligands, which are able to agonize or antagonize LXR action (Peet et al. 1998a). Both LXR molecules have been recognized to be key regulators of different metabolic pathways including carbohydrate and energy metabolism, but LXRα also appears to be involved in cholesterol metabolism and lipogenesis (Peet et al. 1998b; Brunham et al. 2006; Naik et al. 2006). In rodents, LXRα is able to induce the expression of CYP7A1 (Chiang et al. 2001). Furthermore, LXR regulates the expression of cholesterol and lipid transporting proteins, such as ABCG5 and ABCG8 in the intestine or ABCG1, ABCA1 and apolipoproteins E and C in macrophages (Yu et al. 2002; Zelcer and Tontonoz 2006). Recently, Meyer zu Schwabedissen et al. (2010) demonstrated that the hepatic uptake transporter, OATP1B1, is under a dual transcriptional control through LXRα and FXR. Both NRs appear to be able to induce OATP1B1 expression ligand dependently as demonstrated in hepatoma cell lines and human hepatocytes.
LXRα appears to be regulated by microRNA molecules. The 3′-untranslated region of LXRα is targeted by miR-613, leading to a significant repression of LXRα expression (Ou et al. 2011). Interestingly, the miR-613-dependent regulation of LXRα is incorporated in a negative feedback loop of LXRα gene expression. LXRα itself is able to indirectly induce the expression of miR-613 via a sterol regulatory element-binding protein (SREBP-1c)-dependent pathway, as demonstrated in HepG2, Huh7 cells and human hepatocytes (Ou et al. 2011). Antagonistic effects of LXR-dependent and miRNA-dependent regulation of protein expression have been observed for genes involved in cholesterol homeostasis. miR-33 is encoded by a DNA sequence that is located within the SREBP-2 gene and, thus, appears to be co-transcribed with SREBP-2 (Marquart et al. 2010). While SREBP-2 leads to an increased clearance of circulating LDL cholesterol by promoting the transcription of LDL receptor, miR-33 directly targets the 3′-UTR of the LXR-target genes expressing ABCA1 and ABCG1 leading to a suppression of LXR-dependent cholesterol efflux (Marquart et al. 2010).
3.2.6 Small heterodimer partner (SHP)
SHP (gene symbol NR0B2) is a member of the NR family and belongs together with FXR to the group of master regulators involved in the regulation of bile acid homeostasis. SHP is highly expressed in the liver but has also been detected in brain, adrenal glands, gallbladder, kidney, ovary, testis, the gastrointestinal tract and heart (Lee et al. 1998; Nishizawa et al. 2002; Sanyal et al. 2002). In addition to its role in bile acid metabolism and transport, SHP regulates the expression of genes involved in lipid metabolism, gluconeogenesis and apoptosis (Zhang et al. 2011a). Unlike other NRs, SHP lacks the conventional DNA-binding domain. Therefore, SHP acts indirectly as a transcriptional repressor of its target genes via binding to a variety of other members of the NR family, thus inhibiting the binding of co-activators to these NR proteins. Important examples of SHP partners in this context include estrogen receptors (ERs), RXR, LRH-1, HNF-4, LXRs, glucocorticoid receptors (GRs), PXR and PPAR-α and -γ (Johansson et al. 1999, 2000; Goodwin et al. 2000; Lee et al. 2000; Gobinet et al. 2001; Kassam et al. 2001; Borgius et al. 2002; Brendel et al. 2002; Nishizawa et al. 2002; Ourlin et al. 2003; Shimamoto et al. 2004; Yamagata et al. 2004). Based on this principle of action, SHP has been shown to influence the expression of CYP7A1, CYP8B1 and CYP7B1, as well as important enteral and hepatic transporters involved in bile acid homeostasis, such as ASBT, BSEP, MDR2, MDR3 and NTCP. Interestingly, the NR0B2 gene promoter itself appears to be a target of transcription factors that are known to play a key role in the regulation of bile acid homeostasis. This includes FXR, LRH-1, HNF-4α, LXRα, PPARγ and AP1 (reviewed in Zhang et al. 2011a). A further indirect link between drug metabolism and bile acid homeostasis is evident from the observation that the NR0B2 gene promoter has been demonstrated in vitro to be regulated by PXR in a ligand-dependent manner using rifampicin (Ourlin et al. 2003).
SHP not only acts as an important co-repressor for NR target genes, but is also involved in the regulation of miRNA expression by modulating different transcription factor–dependent pathways. The miRNA molecules, miR-433 and miR-127, appear to be SHP dependently repressed (Song and Wang 2008); likewise, miRNA-206 expression is also influenced by SHP via a regulatory cascade that involves the transcription factors, Ying Yang 1 (YY1) and estrogen-related receptor gamma (ERRγ) (Song and Wang 2009). An interesting implication of the interplay of SHP and miRNA molecules was described by Xiao et al. (2012) who showed that the small RNA molecule, miR-134, known to be aberrantly highly expressed in prostate cancer (Mitchell et al. 2008), is able to target SHP 3′-UTR and to downregulate its expression. This is in line with the observation that miR-134 is upregulated in different prostate cancer cell lines, while SHP expression appeared to be concomitantly downregulated, leading to the transcriptional activation of the androgen receptor (Xiao et al. 2012). SHP and LRH-1 regulate miRNA-200c synthesis, a miRNA molecule shown to be aberrantly expressed in different tumor types, including pancreatic adenocarcinoma, colon cancer, ovarian cancer and renal cell carcinoma, and have been shown to promote tumor invasion and metastasis (Korpal et al. 2008; Ceppi et al. 2010; Zhang et al. 2011b).
3.2.7 Vitamin D receptor (VDR)
The vitamin D receptor (VDR, NR1I1) is a key regulator of calcium homeostasis. Its natural ligand is the hormone calcitriol (1, 25(OH)2D3). VDR is expressed in numerous organs, including the intestine (Han and Chiang 2009). After ligand binding, VDR heterodimerizes with RXR and binds to its response elements (vitamin D response elements, VDREs) within its target gene promoters. Recently, VDR has been shown to have a much wider spectrum of regulatory functions than initially expected. In addition to its ability to influence cell proliferation, cell differentiation and immune-associated functions, VDR has been shown to be able to regulate the expression of genes involved in drug metabolism and bile acid synthesis and detoxification (Campbell and Adorini 2006). VDR regulates the transcription of CYP3A4, CYP2B6 and CYP2C9 (Thummel et al. 2001; Drocourt et al. 2002), as well as the expression of the phase II detoxifying enzyme, SULT2A1 (Echchgadda et al. 2004), demonstrated using co-transfected intestinal and hepatic cell lines. In Caco-2 cells, VDR is able to ligand dependently activate the intestinal transporters, MRP1, MRP2 and MRP4 (Fan et al. 2009). Interestingly, these VDR-dependent transactivations are mainly triggered by a binding of VDR/RXR to CAR/PXR response elements in the respective gene promoters. VDR is also able to induce Mdr1 in both Fxr (+/+) and Fxr (−/−) mice, leading to an increased renal and brain efflux of digoxin in mice in vivo (Chow et al. 2011). VDR is also transactivated by the highly hydrophobic and toxic secondary bile acid, lithocholic acid (Makishima et al. 2002). This mechanism leads to induction of CYP3A4 and MRP3 in the colon, as well as to the inhibition of bile acid synthesis in the liver via the suppression of CYP7A1 expression. The suppressive effect on CYP7A1 appears to be unfolded via a MEK1/ERK1/2-dependent signaling pathway, which is induced by VDR bound to the cellular membrane. Lithocholic acid appears to induce the translocation of VDR from the cytosol to both the nucleus and the cellular membrane, which consecutively leads to the heterodimerization of VDR with RXRα, the recruitment of co-repressors and the final inhibition of CYP7A1 gene transcription (Han and Chiang 2009). The expression of OATP1A2 is ligand dependently transactivated by VDR in caco-2 cells, suggesting that a pharmacological administration of vitamin D3 may modulate the intestinal absorption of substrates transported by OATP1A2 (Eloranta et al. 2006). VDR polymorphisms have been investigated with regard to their potential to modulate the susceptibility for primary biliary cirrhosis. Several studies found a putative association between VDR genetic variants and an elevated risk for the development of this disease (Tanaka et al. 2009; Halmos et al. 2000; Vogel et al. 2002; Fan et al. 2005), shedding further light on a potential role of VDR in the pathogenesis of cholestatic diseases.
Mohri et al. (2009) identified a miR-125b-binding element within the 3′-untranslated region of human VDR mRNA and could demonstrate that this small RNA molecule is able to significantly decrease VDR expression. This mechanism consecutively leads to a suppression of CYP24 expression, one of the important enzymes involved in vitamin D3 degradation (Mohri et al. 2009). It was also demonstrated that VDR levels are inversely proportional to the levels of miRNA-125b in different melanoma cell lines, indirectly pointing to a regulatory impact of miRNA-125b on VDR expression (Essa et al. 2010).
3.2.8 Peroxisome proliferator-activated receptor (PPAR)
Peroxisome proliferator-activated receptors (PPARs) belong to the NR family of ligand-activated transcription factors (TFs), which regulate various physiological functions involved in development, metabolism and homeostasis.
The PPARs act as regulators of hepatic lipid metabolism and adipogenesis (Rakhshandehroo et al. 2010; Pyper et al. 2010; Siersbaek et al. 2010). Three PPAR isotypes have been identified to date: α, β and γ—all of which are products of different genes and show differential tissue expression. PPARα, which is expressed highly in hepatocytes, cardiomyocytes, enterocytes and proximal tubule cells in the kidney (Braissant et al. 1996), is primarily involved in regulation of genes involved in fatty acid oxidation, ketogenesis, gluconeogenesis, cholesterol catabolism and lipoprotein metabolism (Lefebvre et al. 2006; Mandard et al. 2004), as well as anti-inflammatory genes (Michalik and Wahli 2008; Zandbergen and Plutzky 2007). In rats and mice, sustained induction of peroxisome proliferation by PPARα can produce liver tumors (Reddy et al. 1976, 1980). Expression of PPARα is lower in human than in rodent liver and, as such, humans appear to be less sensitive to peroxisome proliferator-induced hepatocarcinogenesis (Ashby et al. 1994; Cattley et al. 1998). In the “canonical” mode of action, PPARs directly induce gene expression by forming heterodimers with the RXRα receptor, which then bind to peroxisome proliferator response elements (PPREs) on the promoters of target genes. The consensus response element consists of a direct repeat of the hexameric sequence AGGTCA separated by one less conserved spacer nucleotide (van der Meer et al. 2010). Fluorescence microscopy has revealed that: (1) in the mouse hepatoma cell line, Hepa-1, PPARs are primarily localized in the nucleus both in the absence and presence of ligand (Akiyama et al. 2002); (2) in the COS-7 and MCF-7 cell lines, PPARs readily form heterodimers with RXR molecules even in the absence of ligand (Feige et al. 2005). However, immunoprecipitation studies indicate that at least a fraction of PPARα molecules exists in mouse liver cytosol in a complex with heat shock protein 90 (hsp90) and the hepatitis B virus X-associated protein 2 (XAP2) (Sumanasekera et al. 2003). The intracellular localization of PPARα in primary human hepatocytes with and without ligand needs to be clarified. In the unliganded state, the PPARα-RXRα heterodimer is bound to DNA with co-repressor molecules, notably the NR co-repressor (NCoR)—which prevents constitutive gene expression (Dowell et al. 1999; Viswakarma et al. 2010). Ligand binding induces conformational changes in PPAR protein structure that lead to dissociation of co-repressor proteins and recruitment of coactivators including p300 (Dowell et al. 1997) and steroid receptor coactivator-1 (SRC-1) (DiRenzo et al. 1997), allowing chromatin relaxation and transcription of target genes. The transcriptional activity of PPARs is also modulated by kinases and phosphatases—particularly, phosphorylation by the mitogen-activated protein kinases ERK and p38-MAPK, protein kinases A and C (PKA and PKC), AMP kinase (AMPK) and glycogen synthase kinase 3 (GSK-3) (Burns and Vanden Heuvel 2007).
3.3 Signaling pathways involved in drug-metabolizing enzyme regulation


3.3.1 Observations in hepatoma cells link β-catenin signaling to hepatic drug metabolism
When studying pre-neoplastic liver foci in the rat, it was noted that the expression of a number of drug-metabolizing enzymes was altered in the pre-tumorous cell populations. In particular, a decrease in the expression of different CYP isoforms was observed (Schwarz et al. 1989; Buchmann et al. 1987). However, treatment with phenobarbital, a tumor promoter and CAR agonist was able to induce transiently the expression of CAR target CYPs in these liver foci (Schwarz et al. 1989). Similarly, expression of different drug-metabolizing enzymes, especially CYP isoforms, was observed in murine liver tumors from phenobarbital-treated animals alongside a very low expression of these enzymes in tumors from animals which had not received phenobarbital (Loeppen et al. 2005). In principle, this phenomenon might be caused by the presence of phenobarbital and its acute action on hepatoma cells; however, comparative analyses of the promoted and non-promoted tumors revealed that both tumor populations are characterized by different underlying genetic alterations: in mice injected with the initiator, N-nitroso-diethylamine, at 6 weeks of age without subsequent tumor promotion by phenobarbital, the vast majority of resulting tumors harbored activating mutations in either the Ha-ras or the B-raf proto-oncogene, leading to a constitutive activation of the mitogen-activated protein kinase (MAPK) signaling pathway (Jaworski et al. 2005). By contrast, tumor promotion by phenobarbital or the phenobarbital-like polychlorinated biphenyl, PCB153, specifically selects for the outgrowth of liver adenomas with activating mutations in Ctnnb1 (Aydinlik et al. 2001; Strathmann et al. 2006), which encodes the transcription factor β-catenin, a crucial player in the canonical Wnt signaling pathway. Detailed information about Wnt signaling and its functions can be found in Barker and Clevers (2000), Huelsken and Behrens (2002), Lustig and Behrens (2003), Polakis (2000), Willert and Nusse (1998) (see also Fig. 6). Constitutive activation of β-catenin signaling is frequently detected in tumors, often caused by activating mutations in Ctnnb1, which lead to a loss of one or more of the N-terminal phosphorylation sites, or by inactivating mutations in Apc, a gene encoding a crucial component of the cytosolic β-catenin destruction complex.

Wnt/β-catenin signaling and its role in drug metabolism. In the absence of agonistic Wnt signals, cytosolic β-catenin is phosphorylated by a cytosolic multi-protein complex and subsequently degraded in the proteasome. Wnt binding to FZD receptors impairs β-catenin degradation. As a consequence, the protein accumulates and translocates to the nucleus. Nuclear β-catenin interacts with TCF transcription factors and induces target gene transcription, e.g. nuclear receptors and certain drug-metabolizing enzymes. Cooperative interplay of β-catenin and nuclear receptors also contributes to the induction of drug-metabolizing enzymes, especially from the CYP and GST families
Both mouse hepatoma types (Ha-ras-/B-raf-mutated or Ctnnb1-mutated, respectively) exhibit strikingly different, often complementary gene and protein expression profiles which appear, at least to a major part, to be regulated at the level of transcriptional control by the respective constitutively active oncogenic pathway (Stahl et al. 2005; Jaworski et al. 2007; Strathmann et al. 2007; Rignall et al. 2009). Among the genes with differential expression between the two tumor populations are a number of drug-metabolizing enzymes from phase I and phase II, especially CYP enzymes from families 1 and 2, as well as a considerable number of GSTs, which are expressed at high levels in Ctnnb1-, but not in Ha-ras- or B-raf-mutated hepatomas. Moreover, AhR, CAR and PXR are over-expressed in tumors with activating Ctnnb1 mutations. Tables S3, S4 and S5 (see ESM) contain an overview of nuclear receptors and drug metabolism-related genes associated with β-catenin signaling.
A clarification whether the high expression of drug-metabolizing enzymes was due to the presence of the Ctnnb1 mutation or simply caused by the presence of phenobarbital comes from the comparably low number of tumors with activating Ctnnb1 mutations present in livers of mice from the non-phenobarbital groups of the tumor initiation/promotion experiments. These tumors exhibit the characteristic gene expression profile connected to β-catenin activation, including the expression of CYPs and GSTs, even in the absence of phenobarbital treatment. In addition, samples from an experiment where tumor-promoting chronic treatment of mice with phenobarbital had been stopped 2 weeks prior to killing (Bursch et al. 2005) demonstrate that the drug-metabolizing phenotype of the tumors is stable after withdrawal of the promoter. Thus, activating Ctnnb1 mutations leading to a constitutive activation of the Wnt/β-catenin signaling pathway induce a characteristic gene expression profile which includes high expression of enzymes from both phase I (CYP) and phase II (GST), as well as of NRs involved in the regulation of drug-metabolizing enzymes (AhR, CAR, PXR). This gene expression pattern is observed independently from the presence of exogenous substances such as phenobarbital. High expression of a number of CYP enzymes in CTNNB1-mutated human hepatoblastoma samples indicates that comparable mechanisms of β-catenin-dependent CYP expression might be active in human and rodent liver cells (Schmidt et al. 2011).
3.3.2 β-Catenin signaling regulates drug metabolism in normal murine liver tissue
The above mentioned observations in tumors (i.e. an induction of drug metabolism by mutational activation of β-catenin) gave rise to the hypothesis that, in normal healthy liver, physiological activation of the Wnt/β-catenin pathway in perivenous hepatocytes might induce the expression of enzymes related to drug metabolism (Hailfinger et al. 2006). In vivo observations underlined the relevance of β-catenin signaling for gene expression in perivenous hepatocytes: the physiological, preferentially perivenous expression of most drug-metabolizing enzymes correlates with perivenous activity of the β-catenin signaling pathway (Benhamouche et al. 2006; Sekine et al. 2006; Moriyama et al. 2007). Considerable information about the role of β-catenin in the regulation of drug metabolism has been collected by using transgenic mouse strains: ablation of hepatic β-catenin signaling in the liver by a conditional hepatocyte-specific knockout of Ctnnb1 causes a reduction in the expression of many, but not all, perivenously expressed enzymes involved in drug metabolism (Sekine et al. 2006; Tan et al. 2006; Braeuning et al. 2009). For details about xenobiotic-metabolizing enzymes regulated in this mouse model, please refer to Tables S4 and S5 (see ESM). Accordingly, these mice are resistant to the cytotoxicity of acetaminophen, a drug which is converted into a cytotoxic quinoneimine metabolite by CYP2E1 and CYP1A2, both of which are strongly downregulated in the Ctnnb1 KO mouse (Sekine et al. 2006). By contrast, expression of a transgene encoding mutant activated β-catenin in periportal hepatocytes induces the expression of a number of perivenous drug-metabolizing enzymes in these cells, demonstrating that activation of β-catenin signaling alone is sufficient to induce the expression of the perivenous drug-metabolizing hepatocyte phenotype (Schreiber et al. 2011). In addition, the response of Ctnnb1 knockout hepatocytes toward stimulation with xenobiotic inducers of drug metabolism is altered in two ways in vivo: first, xenobiotic-induced levels of a number of AhR- and CAR-regulated mRNAs encoding drug-metabolizing enzymes from phase I and II of xenobiotic metabolism remained lower in β-catenin-deficient livers, as compared to their wild-type counterparts exposed to the same dose of an AhR- or CAR-activating compound (Braeuning et al. 2009). Second, the localization of enzyme induction by AhR and CAR agonists is changed in these mice. A preferentially perivenous induction of target genes in wild-type mice is contrasted by a rather unsystematic induction in the Ctnnb1 knockout mice without a clear-cut zonal preference and with stronger- and weaker-responding hepatocytes distributed in a scattered pattern throughout the entire liver lobule (Braeuning et al. 2009).
3.3.3 Signaling gradients in liver—a role for non-parenchymal cells?
The origin of the β-catenin-activating signal in the perivenous areas of the liver is still not fully understood. The fact that over-expression of the Wnt antagonist, Dkk1, in transgenic mice is able to abolish the expression of a number of perivenously expressed genes argues for the existence of a physiological signal delivered to perivenous hepatocytes by agonistic Wnt molecules (Benhamouche et al. 2006). A Wnt signal might originate from the endothelial cells of the central veins and activate the β-catenin pathway in the surrounding hepatocytes (Hailfinger et al. 2006). This model implies a cross talk of epithelial (hepatocytes) and mesenchymal (vascular endothelium of the central venules) cell populations. There is no direct proof for this hypothesis yet, but interactions between different cell types play important roles in other processes connected to hepatocyte-specific differentiation and gene expression. For example, hepatocyte-like cells can be obtained from embryonic stem cells when cultured in the presence of non-parenchymal liver cell lines (Soto-Gutierrez et al. 2007) and signals from endothelial cells also play a crucial role in liver regeneration after partial hepatectomy (Ding et al. 2010). NPCs also positively influence hepatocyte functions in vitro when co-encapsulated in ectopic artificial liver constructs (Chen et al. 2011). After liver injury with CCl4, a selective poison for Cyp2e1-expressing perivenous hepatocytes, expression of model perivenous marker genes is restored in hepatocytes moving up from the portal side as soon as these cells resume the contact with the endothelium (Kuo and Darnell 1991). Expression of the model perivenous hepatocyte marker gene and β-catenin target, glutamine synthetase, is inducible in cultured hepatocytes by co-culture with the rat liver epithelial cell line RL-ET-14 in a β-catenin-dependent manner (Kruithof-de Julio et al. 2005; Gebhardt et al. 1998; Schrode et al. 1990). Whether drug-metabolizing enzymes are also affected in this co-culture system is not known. Of note, the induction of glutamine synthetase obtained with the RL-ET-14 cell line, which displays features of endothelial cells, was not reproducible with normal vascular endothelial cells (Schrode et al. 1990; Gebhardt and Gaunitz 1997). However, in accordance with the hypothesis that endothelial cells might be involved in the regulation of hepatic perivenous β-catenin activation and CYP expression, co-culture of primary mouse hepatocytes with preparations of NPCs consisting mainly of endothelial cells induces the expression of Axin2, a known direct transcriptional target of β-catenin, in the hepatocytes. This goes along with an induction of Cyp1a1 mRNA and protein levels (Braeuning and Schwarz 2010b).
In addition to a putative gradient of Wnt molecules, other gradients of regulators might influence hepatic β-catenin signaling and perivenous gene expression: a porto-central gradient of the β-catenin-negative regulator, Apc, was detected in murine liver which might contribute to a periportal repression and perivenous activation of the pathway (Benhamouche et al. 2006). The underlying effect might be transcriptional in nature, since a slight portocentral gradient of Apc mRNA expression was detected in a microarray analysis of periportal and perivenous hepatocyte subpopulations, which, however, failed the criteria of statistical significance in this analysis (A. Braeuning, unpublished data). Moreover, there is evidence that an antagonistic interplay of signaling through β-catenin and the Ras/MAPK cascade exists in hepatocytes and plays a role in the regulation of hepatic zonation via Ras/MAPK-mediated inhibition of β-catenin signaling in periportal hepatocytes (Hailfinger et al. 2006; Braeuning et al. 2007a, b; Zeller et al. 2012). In addition, one might also think of Wnt/β-catenin-regulating signals delivered by the ECM: for example, a cryptic module in cell surface collagen 18, aberrantly expressed in human liver cancer, carries sequence homology to the Wnt receptor Frizzled and is thus capable of inhibiting the Wnt pathway (Quelard et al. 2008). In a recent paper, Sekine and colleagues demonstrated that disruption of Dicer1 in a transgenic mouse model abolishes zonal gene expression of some preferentially perivenously expressed genes similar to what had been previously observed with conditional Ctnnb1 KO mice (Sekine et al. 2009). This points toward an important role of miRNAs in the regulation of zonal-specific expression of drug-metabolizing enzymes by β-catenin. Irrespective of the unsolved issue which mechanisms contribute to which extent to the physiological zonal gene expression pattern, observations in vivo clearly show that high expression of most pharmacologically and toxicologically relevant CYPs and GSTs is dependent on β-catenin signaling.
3.3.4 Effects in vitro and molecular mechanisms
Incubation of primary mouse hepatocyte cultures with Wnt3a leads to elevated levels of various CYPs from families 1–3, as well as of GSTs from the GSTm family (Hailfinger et al. 2006; Braeuning et al. 2011; Giera et al. 2010). A summary of observed effects is presented in Tables S4 and S5 (see ESM). The degree of mRNA induction greatly varied between different CYPs, with the most pronounced effects observed for Cyp1a2, Cyp2e1 and Cyp3a (Braeuning et al. 2011). In particular, the 1a2 and 2e1 isoforms were also consistently identified to be regulated by β-catenin in vivo (Table S4; see ESM). In general, in vitro effects of β-catenin signaling on GST mRNA expression were much less pronounced (Giera et al. 2010). Similarly, the expression of enzymes involved in the synthesis of the CYP prosthetic group heme was rather slightly upregulated in cultured hepatocytes by Wnt3a in vitro (Braeuning et al. 2010). This corresponds well to the perivenous expression of these enzymes in vivo and their high expression in murine liver tumors with activated β-catenin (Braeuning et al. 2010). The mRNAs encoding the drug metabolism-regulating AhR and PXR are also subject to regulation by β-catenin in cultured hepatocytes (Hailfinger et al. 2006; Braeuning et al. 2011; Braeuning and Buchmann 2009), whereas no significant effect of Wnt3a on CAR mRNA levels has been observed in hepatocytes in vitro (Braeuning et al. 2011). Of note, the AhR had been previously identified as a β-catenin target gene in human prostate cancer cells (Chesire et al. 2004).
The molecular mechanisms by which signaling through the Wnt/β-catenin pathway influences the expression of drug-metabolizing enzymes seem to be diverse and are only partially understood. A schematic delineation of some of the molecular mechanisms detailed in the following text can be found in Fig. 6. The most simple and direct explanation would be a transcriptional upregulation of the influenced genes by β-catenin via β-catenin/TCF-binding sites in the respective promoter/enhancer regions. Indeed, it has been shown that a putative β-catenin/TCF-binding motive within the human CYP1A1 promoter plays a role in the regulation of a CYP1A1 promoter-driven reporter gene by β-catenin in mouse hepatoma cells in vitro (Braeuning et al. 2011). Recent ChIP-seq analyses of global TCF and β-catenin binding to putative promoter regions in the mouse genome performed by Sabine Colnot and co-workers identified TCF/β-catenin-binding sites in a number of 5′-regulatory regions of genes encoding enzymes related to drug metabolism (S. Colnot, unpublished data). Thus, there is no reasonable doubt that β-catenin/TCF binding to target gene promoters is definitely involved in the regulation of drug-metabolizing enzymes. However, even though a β-catenin-dependent induction was found in the case of the murine GSTm3 and Alad (a β-catenin-regulated gene encoding an enzyme involved in heme synthesis) enhancer regions, a direct activation mechanism could not be confirmed (Giera et al. 2010; Braeuning and Schwarz 2010a). Thus, alternative mechanisms play some role. The upregulation of mRNAs encoding transcription factors such as the AhR suggests that elevated levels of these transcription factors might mediate the higher expression of their respective target genes. However, it is not clear whether a rather slight activation of receptor transcription will be sufficient to mediate a much stronger induction of their target genes, especially in the absence of known activators or ligands of the respective receptors. Moreover, siRNA directed against β-catenin downregulated the mRNA encoding the AhR-dependent CYP isoform 1a1 in mouse hepatoma cells without concomitant downregulation of the AhR (Braeuning et al. 2011). Treatment with the glycogen synthase kinase inhibitor and β-catenin activator LiCl equally induced Cyp1a1 mRNA levels in the rat hepatoma cell line 5L as well as in the 5L-derived cell line BP8+ (Braeuning et al. 2011), the latter of which does not possess a functional native AhR gene, but expresses the receptor from a transgene under the control of a non-β-catenin-responsive, constitutively active promoter (Weiss et al. 1996). Together these findings indicate that AhR mRNA induction is not responsible for Cyp1a1 induction by β-catenin. As further discussed in the paper by Braeuning et al. (2011), higher levels of the receptor might affect the maximum of xenobiotic-induced expression of AhR target genes, but, due to the observation mentioned above, it seems rather unlikely that elevated AhR mRNA levels are the major cause underlying alterations in Cyp1a1 expression in response to β-catenin activation. Instead, there is evidence for an even more complex interplay of β-catenin and the AhR in the regulation of Cyp1a1 expression, in addition to direct β-catenin/TCF-mediated effects on the CYP1A1 and AhR promoters: first, the presence of activated mutant β-catenin increases the ability of the AhR to activate transcription from an artificial promoter consisting of three AhR/Arnt-binding sites (and no β-catenin/TCF-binding site) in mouse hepatoma cells (Loeppen et al. 2005; Braeuning et al. 2011). This indicates that β-catenin affects the transactivation potential of the AhR at its binding sites on the DNA. A similar cooperation of both pathways was also observed by the group of Jan Vondracek, who showed that an activation of the Wnt pathway augments the expression of AhR target genes in a rat liver progenitor cell line (Prochazkova et al. 2011). Possibly, β-catenin acts as a co-activator of AhR-dependent transcription, a mechanism which is in line with the observation that β-catenin and the AhR interact physically (Braeuning et al. 2011). Of note, a different interaction of both pathways has been observed in other cellular contexts, where the ligand-activated AhR inhibits β-catenin signaling by acting as an ubiquitin ligase for β-catenin in vivo in Apcmin mice (Kawajiri et al. 2009), and also in rat liver progenitor cells in vitro, where persistent AhR activation leads to a reduction in β-catenin signaling (Prochazkova et al. 2011). A disruption of Wnt signaling by AhR-dependent signals was also observed in zebrafish (Mathew et al. 2009). Inhibitory effects of the activated AhR on β-catenin signaling were, however, not detected in murine liver cells (Braeuning et al. 2011). An additional type of cooperative cross talk between the two transcriptional regulators, β-catenin/TCF and AhR/Arnt, takes place at the hCYP1A1 enhancer, where the inactivation of a β-catenin/TCF-binding site reduced the inducibility of a CYP1A1 enhancer-driven luciferase reporter gene by the AhR ligand TCDD (Braeuning et al. 2011). In an analysis of the murine GSTm3 promoter, it was detected that transcriptional activation of a GSTm3 enhancer-driven luciferase reporter construct by β-catenin was mediated via a binding site for the NR RXRα (retinoid X receptor α) (Giera et al. 2010).
The rat Cyp2b1 gene is also under control of β-catenin signaling, as demonstrated by the use of a Cyp2b1 promoter-driven reporter system in mouse hepatoma cells (Loeppen et al. 2005; Sekine et al. 2006; Tan et al. 2006; Schreiber et al. 2011; Ueno and Gonzalez 1990). Of note, CYPs from family 2B are classic targets of CAR (for review see Tompkins and Wallace 2007), which is more or less absent from the cell line used for these analyses (A. Braeuning, unpublished). Co-transfection of a CAR expression vector did not substantially improve Cyp2b1-dependent reporter activity and had no effect on β-catenin-mediated Cyp2b1-dependent reporter induction (Loeppen et al. 2005), again arguing against a decisive role of the levels of NRs in the regulation of drug-metabolizing enzyme expression by β-catenin signaling. The rat Cyp2b1 gene was also the focus of another study, where an inhibition of gene promoter activity by the MAPK signaling pathway was detected, mediated by a distal enhancer region (Bauer et al. 2004). Inhibitory effects of MAPK signaling on the rat Cyp2b2 promoter were also reported by Joannard et al. (2006). In addition, CAR translocation into the nucleus is blocked by the MAPK ERK (Koike et al. 2007). Given the fact that an antagonistic interplay between signaling through the β-catenin and MAPK pathways exists in murine hepatocytes (Hailfinger et al. 2006; Braeuning et al. 2007a, b; Braeuning 2009; Zeller et al. 2012), the reduction in a MAPK signal inhibiting CYP expression by β-catenin might constitute another mechanism by which β-catenin signaling positively influences the expression of drug-metabolizing enzymes. It should be noted that an antagonism of both signaling pathways is not self-evident, since synergistic cross talk mechanisms have been detected in other systems, for example see Kim et al. (2007b) and Hu and Li (2010).
There is also accumulating evidence for a cross talk between β-catenin and the liver-enriched transcription factor HNF-4α, as recently shown by different groups. Stanulovic et al. (2007) reported that a deficiency of HNF-4α induces the periportal expression of “perivenous” genes, which are known to be under the control of the β-catenin pathway. Using hepatocytes derived from stem cells via an in vitro differentiation protocol, Colletti et al. (2009) demonstrated in a recent study that a concerted action of β-catenin and HNF4α takes place at a number of promoter regions controlling the expression of zonally expressed genes, among them Cyp1a1. The important role of HNF-4α as a co-regulator of β-catenin-dependent genes is further underlined by recent analyses (A. Braeuning, unpublished). A cross talk between β-catenin and another hepatocyte-enriched transcription factor, HNF-1α, is very likely to occur in the regulation of the Cyp2e1 gene (Ueno and Gonzalez 1990).
4 Hepatic drug and bile acid metabolism and transport


The cellular uptake and efflux of many drugs and xenobiotics, as well as endogenous compounds such as vitamins, hormones, bilirubin or bile acids, are highly dependent on the expression and activity of membrane transport proteins. Transport proteins in the liver and in the gastrointestinal tract, such as members of the ATP-binding cassette (ABC) or of the solute carrier superfamilies, have been extensively studied and have been shown to play a major role in the efficacy of xenobiotic and endobiotic absorption and excretion (Teng and Piquette-Miller 2008). It has long been assumed that inter-individual differences in the activity of xenobiotic-metabolizing enzymes and transporters and their associated susceptibility to drug side effects are predominantly caused by genetic variants within their encoding genes. However, numerous studies indicate that it is also crucial to elucidate the regulatory mechanisms coordinating the expression of proteins involved in phase I, II and III metabolism to be able to better understand the individual responses to drugs. It is estimated that genetic variation overall accounts only for about 15–30 % of inter-individual differences observed in drug metabolism and response (Eichelbaum et al. 2006). This assumption is especially well reflected in the case of the drug-metabolizing enzyme, CYP3A4. CYP3A4 is one of the major enzymes responsible for phase I metabolism of therapeutics and is estimated to be involved in the metabolism of at least 50 % of all drugs used in the clinic. Despite the observation that CYP3A4 is rarely polymorphically expressed, the enzyme has been repeatedly demonstrated to show a high inter-individual difference in gene expression (Westlind-Johnsson et al. 2003; Wilkinson 2005). Similarly, very high inter-individual variances in protein expression have been measured for the hepatic uptake transporter, organic anion-transporting polypeptide 1B1 (OATP1B1) (Ho et al. 2006b). Importantly, transport proteins and metabolizing enzymes involved in phase I and II metabolism and transport of drugs play in parallel a crucial role in bile acid synthesis and circulation. Here, the uptake and efflux of xenobiotics and endogenous compounds is described.
4.1 Uptake of xenobiotics and endogenous substances
4.1.1 OATPs and OATs in the liver
Drug and xenobiotic uptake into hepatocytes is mediated by transporters belonging to SLC families such as OATPs, OATs and OCTs, as well as the equilibrative nucleoside transporter (ENTs, SLC29A; CNTs, SLC28A) (Stieger and Meier 2011). OATPs are glycoproteins involved in the uptake of a wide range of drugs into hepatocytes. Typical drugs transported by OATPs are relatively lipophilic anionic drugs such as statins, antibiotics, sartans, angiotensin-converting enzyme inhibitors and anticancer drugs (Hagenbuch and Gui 2008; Kalliokoski and Niemi 2009; Kusuhara and Sugiyama 2009; Fahrmayr et al. 2010; Giacomini et al. 2010; Konig 2011; Roth et al. 2012), as well as a wide variety of generally amphipathic organic compounds including conjugated and unconjugated bile acids, bilirubin, bromosulfophthalein, neutral steroids, peptides and organic cations (Hagenbuch and Gui 2008; Kalliokoski and Niemi 2009; Kusuhara and Sugiyama 2009; Fahrmayr et al. 2010; Giacomini et al. 2010; Konig 2011; Roth et al. 2012). In contrast to other SLC superfamily members, such as OATs and OCTs that transport hydrophilic anions or smaller cations, respectively, OATPs are characterized by transporting larger amphipathic compounds in a Na+-independent manner (Roth et al. 2012). The molecular mechanism of transport by OATPs is not yet elucidated but seems to be based on anion exchange that couples the uptake of organic compounds with the efflux of intracellular anions (GSH, GS conjugates, HCO −3 ) (Satlin et al. 1997; Li et al. 1998a, 2000; Mahagita et al. 2007; Leuthold et al. 2009).
OATPs have been detected in mammalian species but not in yeast, plants or bacteria (Svoboda et al. 2011). Eleven human OATPs have been identified so far, which have been classified into six families according to their amino acid identity (Hagenbuch and Meier 2004; Mikkaichi et al. 2004; Hagenbuch and Gui 2008). In rat hepatocytes, Oatp1a1, Oatp1a4 and Oatp1b2 are expressed and mediate Na+-independent bile salt uptake. Oatp1a1, which is the first member of the OATP superfamily cloned by expression cloning from rat liver (Jacquemin et al. 1994), is expressed at the basolateral membrane of hepatocytes (Bergwerk et al. 1996). Oatp1a4 was the second Oatp to be cloned (Noé et al. 1997) and is localized to the basolateral membrane of hepatocytes (Reichel et al. 1999). The third hepatocellular Oatp member involved in bile salt uptake is Oatp1b2 which is exclusively expressed in liver (Li et al. 2002a) in the basolateral membrane of hepatocytes (Cattori et al. 2001) (Fig. 4). While these three Oatps have comparable Km values for bile salts, they do not have identical substrate specificity (Cattori et al. 2001). Knockout mice allow a more stringent testing of the role of individual transporters in hepatocellular drug transport. For example, the knock mouse model for Oatp1b2 (the only member of the Oatp1b subfamily in rodents) revealed a reduced hepatocellular uptake of intravenously administered rifampicin, as evidenced by the marked reduction in the liver-to-plasma plasma ratio for rifampicin (Chen et al. 2008; Zaher et al. 2008). The data obtained from knockout mice for various statins yielded conflicting results between different statins (Chen et al. 2008) and between the two research groups for pravastatin, which in part may be due to different experimental conditions (Chen et al. 2008; Zaher et al. 2008). Recently, a knockout mouse model for Slc1a and Slc1b genes was shown to display a 13-fold increase in serum-unconjugated bile salts, while conjugated bile salts levels remained unaffected. In this mouse model, Ntcp levels remain unchanged, suggesting that conjugated bile salts are taken up by Ntcp, while Oatp1a/1b are responsible of unconjugated bile salts (van de Steeg et al. 2010). Similar results were found in Oatp1b2-null mice with an increase of about 30-fold of unconjugated bile acids levels in plasma, while taurine conjugated bile acid levels remained normal (Csanaky et al. 2011).
In human hepatocytes, all four members of the OATP family are involved in drug uptake. Their role in in vivo pharmacokinetics is supported by pharmacogenetic studies (Kalliokoski and Niemi 2009; Fahrmayr et al. 2010; Konig 2011; Niemi et al. 2011; Stieger and Meier 2011; Sissung et al. 2012). OATP1B1 and OATP1B3 are involved in Na+-independent bile salt uptake but OATP2B1, despite its basolateral expression in hepatocytes, does not mediate bile salt transport (Kullak-Ublick et al. 2001). OATP1B1 shares a high amino acid identity with OATP1B3 and its expression is strictly limited to the liver at the basolateral membrane of hepatocytes (Konig et al. 2000a) (Fig. 4) an expression pattern, which is shared by OATP1B3 (Konig et al. 2000b). OATP1B1 and OATP1B3 mediate the transport of both conjugated and unconjugated bile salts (Mahagita et al. 2007). OATP1B1 expression is limited to the liver (Konig et al. 2000b; Hagenbuch and Meier 2004) where it has been shown to facilitate the uptake of endogenous substrates including bile acids, conjugated and unconjugated bilirubin, thyroid hormones and leucotriene C4 as well as drugs such as pravastatin, rifampicin, metotrexate, benzylpenicillin and fexofenadine (Cvetkovic et al. 1999; Nishizato et al. 2003; Kullak-Ublick et al. 2004; Konig et al. 2006; van de Steeg et al. 2009). OATP1B1 is polymorphically expressed, leading to significant variability in its transport efficacy for drugs as demonstrated for different statins in vitro and in vivo (Mwinyi et al. 2004; Niemi et al. 2004; Chung et al. 2005; Pasanen et al. 2007; Mwinyi et al. 2008). Notably, the genetic variant OATP1B1*5 has been shown to be significantly associated with a higher risk for statin-induced myopathy (Link et al. 2008).
OATP1B3 is mainly expressed in the basolateral membrane of hepatocytes (Konig et al. 2000a; Hsiang et al. 1999; Kullak-Ublick et al. 2001) (Fig. 4) but has also been detected in other tissues, including the colon, placenta and prostate (Briz et al. 2003; Ballestero et al. 2006; Hamada et al. 2008), as well as in various human cancer tissues and cell lines (Abe et al. 2001). OATP1B3 facilitates the uptake of different endogenous and exogenous compounds into the liver, e.g. bilirubin, cholecystokinin octapeptide (CCK-8), benzylpenicillin, bosentan, digoxin, paclitaxel and enalapril (Ismair et al. 2001; Kullak-Ublick et al. 2001; Smith et al. 2005). Like OATP1B1, OATP1B3 is also polymorphically expressed. The impact of these genetic variants on drug safety and efficacy appears, however, to be minor as demonstrated in in vitro and in in vivo (Smith et al. 2007; Baker et al. 2009; Ishiguro et al. 2008).
OATP1A2 is located at the apical membrane of cholangiocytes, the blood brain barrier and the brush border membrane of the distal nephron and, according to certain reports, also in small intestinal enterocytes (Bronger et al. 2005; Lee et al. 2005; Glaeser et al. 2007). Like OATP1B1 and OATP1B3, OATP1A2 is able to transport both endogenous compounds, such as bile salts, prostaglandins, thyroid hormones, bromosulfophtalein, and exogenous compounds, such as fexofenadine and the renin inhibitor aliskiren (Dresser et al. 2005; Rebello et al. 2012). Unlike the members of the OATP1B family, OATP1A2 is also able to transport organic cations, including rocuronium, N-methylquinine and quinidine (Hagenbuch and Meier 2004). OATP1A2 is polymorphically expressed, which has been shown to influence the pharmacokinetics of drugs, such as metotrexate in vitro (Badagnani et al. 2006). However, a relevant impact of these SNPs on pharmacokinetics and dynamics of OATP1A2 substrates in vivo was not confirmed (Eechoute et al. 2011). Another study showed that the tyrosine kinase inhibitor, imatinib, is transported by OATP1A2. A genetic variant within the promoter of the SLCO1A2 gene appears to be associated with higher clearances for imatinib in CML patients. However, a correlation between a SNP-dependent change in imatinib pharmacokinetics and the clinical response rate was not observed (Yamakawa et al. 2011).
Organic anion transporters (OATs, SLC22A) are organic anion exchangers. They may act generally as anion exchangers (although conflicting data exist for some OATs) and mediate the transport of a huge variety of drugs, such as angiotensin-converting enzyme inhibitors, angiotensin receptor II antagonists, diuretics, antibiotics and antivirals (Koepsell and Endou 2004; Burckhardt and Burckhardt 2011). In the liver, OAT2 (SLC22A7) and OAT7 (SLC22A9) are expressed in the basolateral membrane of hepatocytes, where OAT2 has been demonstrated to mediate transport of many drugs, while substrate characterization of OAT7 is less advanced (Burckhardt and Burckhardt 2011) (Fig. 4). Organic cation transporters (OCTs, SLC22A) mediate in vitro the bidirectional transport of small hydrophilic compounds. Typical drug classes transported by OCTs are anesthetics, antiallergics, antiarrhythmics antidepressants, antihypertensives, nonsteroidal anti-inflammatory drugs, antimalarials and antineoplastics (Nies et al. 2011). OCT1 (SLC22A1) is expressed at high level, and OCT3 (SLC22A3) is expressed at lower levels in the basolateral membrane of hepatocytes (Koepsell et al. 2007). The role of OCT1 in hepatocellular drug uptake was demonstrated in the Oct1-null model, which showed greater than 30-fold reduction in uptake of the antidiabetic drug metformin compared to wild-type mice (Wang et al. 2002). In human studies, SLC22A1 was found to be a highly polymorphic gene, with different genotypes leading to differences in metformin pharmacokinetics and efficacy (Shu et al. 2008; Holstein and Beil 2009). The basolateral sodium-dependent bile acid transporter NTCP (SLC10A1) not only transports conjugated bile acids but also, transports, to a lesser degree, experimental drugs (Stieger 2011) and clinically used drugs, e.g. rosuvastatin (Ho et al. 2006b; Funk 2008).
4.1.2 Bilirubin
In the liver, OATP family members are responsible for bilirubin uptake. In addition, bilitranslocase (TCDB #2.A.65.1.1) which is expressed in the basolateral membrane of human and rat hepatocytes in vivo (Terdoslavich et al. 2012), was shown to be involved in bilirubin uptake in HepG2 cells (Passamonti et al. 2005). In vitro characterization of human OATP1B1 revealed that it has a high affinity for conjugated and unconjugated bilirubin, while OATP1B3 was shown to transport conjugated bilirubin with lower affinity (Cui et al. 2001; Briz et al. 2003). Although HepG2 and HEK293 cells expressing OATP1B1 did not transport bilirubin by OATP1B1 (Wang et al. 2003), as mentioned above, polymorphisms of the genes encoding OATP1B1 and OATP1B3 are associated with increased serum levels of unconjugated and conjugated bilirubin in humans (Zhang et al. 2007b; van der Deure et al. 2008; Johnson et al. 2009; Sanna et al. 2009). These findings were supported by studies using mice with disrupted Slc1a and Slc1b genes, which showed that total bilirubin plasma content was increased by 40-fold, and 95 % of this increase was due to elevated conjugated bilirubin, while unconjugated bilirubin was increased by 2.5-fold (van de Steeg et al. 2010). Moreover, a recent human study demonstrated that the Rotor syndrome, a rare and benign hereditary–conjugated hyperbilirubinemia, is caused by mutations predicted to induce a complete and simultaneous deficiency of OATP1B1 and OATP1B3, further indicating an important role of these transporters in hepatocellular bilirubin uptake (van de Steeg et al. 2012).
4.1.3 Glucose
Glucose is taken up in the hepatocyte via transporters from the SLC2A family, comprising of 14 members that mostly mediate bidirectional facilitated diffusion of their substrates and GLUT13 acting as a proton-myo-inositol transporter (Thorens and Mueckler 2010). These transporters have 12 predicted transmembrane domains with one N-linked oligosaccharide and function as bidirectional facilitative transporters with either symmetric or asymmetric kinetic properties (Thorens and Mueckler 2010). GLUT1 was the first transporter characterized, cloned from HepG2 cells (Mueckler et al. 1985). A study using FRET glucose nanosensors combined with siRNA experiments showed that GLUT1 is the major glucose transporter dominating over GLUT9 for glucose influx in HepG2 cells (Takanaga et al. 2008). Despite its major role in glucose uptake in HepG2 cells, GLUT1 is not expressed in healthy hepatocytes but found in hepatocellular carcinoma in human liver (Amann et al. 2009). GLUT2 is the main glucose uptake system in hepatocytes and is expressed at high levels in the basolateral membrane of hepatocytes (Fig. 4). GLUT2 is a low-affinity, high-capacity transporter mediating the uptake of glucose (Km ~ 17 μM), fructose (Km ~ 76 μM), galactose (Km ~ 92 μM) and mannose (Km ~ 125 μM), while glucosamine is a high-affinity substrate (Km ~ 0. 8 μM) (Uldry and Thorens 2004). Glut2 expression in basolateral membranes of rat hepatocytes is downregulated by insulin, whereby Glut2 forms a complex with the insulin receptor that leads to Glut2 internalization in the presence of insulin (Eisenberg et al. 2005). GLUT9 participates to a low extent to glucose influx into HepG2 cells (Takanaga et al. 2008). In humans, GLUT9 is expressed only in the liver and kidney at high levels (Phay et al. 2000) and is transcribed into two alternatively spliced variants with different tissue distribution (So and Thorens 2010). In a genetic association study, GLUT9 was found to be associated with serum uric acid levels (Li et al. 2007). Heterologous expression of GLUT9 in Xenopus laevis oocytes directly demonstrated urate transport activity of GLUT9 (Anzai et al. 2008). The physiological relevance of GLUT9 in urate transport was confirmed in systemic and liver-specific Glut9 knockout mice, both displaying a high uric acid concentration in blood, which was attributed to a decrease in uric acid catabolism in the liver (Preitner et al. 2009). GLUT10 mRNA has been detected in liver and was characterized in X. laevis oocytes as a functional high-affinity glucose transporter (the Km for 2-deoxy-d-glucose is ~0.3 μM) (Dawson et al. 2001). mRNAs of GLUT8 and GLUT11-b variants are also expressed at low levels in liver, but their role in glucose uptake into hepatocytes remains to be determined (Doege et al. 2000; Wu et al. 2002).
4.1.4 Bile salts
Bile is mainly composed of bile salts, organic anions, phospholipids (mainly phosphatidylcholine) and cholesterol which are secreted across the canalicular membrane (Small 2003; Esteller 2008). Bile acids are synthesized from cholesterol via CYP7A1 and CYP8B1 or alternatively via CYP27A1 in the liver and are important regulators of physiological processes such as cholesterol catabolism. After secretion from the liver via the bile into the intestine, bile salts emulsify lipids, cholesterol and lipid-soluble vitamins due to their amphipathic nature, thus essentially supporting their absorption from the intestine into the portal venous blood. Bile salts themselves efficiently undergo enterohepatic circulation, whereby their reabsorption from the intestine into the portal venous blood and from the sinusoidal blood into the hepatocytes is highly dependent on active transport mechanisms through the respective plasma membrane barriers against concentration gradients. There is a positive correlation between membrane cholesterol content and activity of different canalicular transporters. These include the ATP-binding cassette (ABC) transporter, bile salt export pump (BSEP (ABCB11)) (Kis et al. 2009) expressed in SF9 cells, rodent Bsep in canalicular liver plasma membrane vesicles (Paulusma et al. 2009), as well as for ABCG2 (ABCG2) (Telbisz et al. 2007) and MRP2 (ABCC2) (Guyot and Stieger, unpublished). By contrast, the ATP-independent sodium-taurocholate co-transporting polypeptide (Ntcp, Slc10a1) expressed in HEK cells shows a decreased activity when located in cholesterol-rich microdomains (Molina et al. 2008).
Bile salt uptake from the blood plasma into hepatocytes occurs by Na+-dependent and Na+-independent mechanisms (Meier and Stieger 2002; Dawson et al. 2009). Both pathways are mediated by members of the families of Solute Carriers (SLC) (Hediger et al. 2004; Hagenbuch and Meier 2004). The main transporter involved in Na+-dependent uptake of conjugated bile salts is NTCP (Meier and Stieger 2002; Hagenbuch et al. 1996; Weinman 1997) and unconjugated bile salts by members of the OATP family. NTCP is an electrogenic transporter mediating the uptake of two sodium ions, together with one bile salt molecule (Weinman 1997). This electrogenic transport is driven by the inside negative membrane potential and by the sodium gradient which is maintained by Na+/K+ ATPase (Boyer et al. 1992; Kullak-Ublick et al. 2000; Meier and Stieger 2002) and is therefore unidirectional. NTCP transports conjugated bile acids with a high affinity, Km values for taurocholate transport in various experimental system range between 6 and 86 μM (Stieger 2011). In Xenopus laevis oocytes injected with total mRNA extracted from hepatocytes, the Na+-dependent bile acid uptake was reduced of 95 % by injection of an antisense mRNA targeting Ntcp, suggesting Ntcp is involved in Na+-dependent uptake of bile salts (Hagenbuch et al. 1996). It has been estimated that approximately >80 % of conjugated bile acid uptake and <50 % of unconjugated bile acid uptake take place via Na+-dependent mechanisms in humans (Meier and Stieger 2002; Kullak-Ublick et al. 2004). Topologically most likely composed of 7 transmembrane domains (Mareninova et al. 2005), NTCP appears to be exclusively expressed in the basolateral membrane of hepatocytes in humans and rats (Ananthanarayanan et al. 1994; Stieger et al. 1994; Kullak-Ublick et al. 1997) (Fig. 4). NTCP has been shown to have highest affinity for conjugated di- and trihydroxy-bile acids (Meier et al. 1997). Besides bile acids, human NTCP also transports other endogenous and exogenous compounds, such as the bile acid metabolite estrone-3-sulfate (Craddock et al. 1998), bromosulfothalein (Meier et al. 1997), thyroxine (Visser et al. 2009) or drugs covalently bound to taurocholate, such as chlorambucil (Kullak-Ublick et al. 1997). NTCP has been cloned and characterized from rat (Hagenbuch et al. 1991), mouse (in two alternatively spliced variants: Ntcp1/2) (Cattori et al. 1999), rabbit (Kramer et al. 1999) and human (Hagenbuch and Meier 1994) liver. Experimental evidence demonstrated a seven-transmembrane helical domain structure and two additional helices arranged in an extracellular loop at the plasma membrane for rat Ntcp (Mareninova et al. 2005). While only computer modeled data are available for human NTCP, these also suggest a similar structure. NTCP is exclusively expressed at the basolateral membrane of rat and human hepatocytes.
4.2 Efflux of xenobiotics and endogenous substances
4.2.1 Efflux of xenobiotics and drugs
Drugs and their metabolites are transported from the hepatocyte back to the sinusoidal blood for renal elimination or across the canalicular membrane for secretion into bile and fecal elimination. Efflux of xenobiotics and drugs into blood is mediated by MRP3 and MRP4, which are ABC transporters belonging to the multidrug resistance subfamily (MRP, ABCC). MRP3 and MRP4 are responsible for the efflux a broad range of xenobiotics and drugs in blood (Keppler 2011). Drug elimination into bile is mediated by three ABC transporters: multidrug resistance protein 1 (MDR1, ABCB1, also called p-glycoprotein), breast cancer resistance protein (BCRP, ABCG2) and MRP2 (ABCC2). Moreover drugs are excreted by the transporter Multidrug And Toxin Extrusion 1 transporter (MATE1, SLC47A1).
MDR1, BCRP and MRP2 mediate the efflux of a broad range of substrates including a large variety of drugs and chemotherapy agents for which they share an overlap of substrate specificity (Nies and Keppler 2007; Polgar et al. 2008; Cascorbi 2011). MDR1 mediates the export of bulky neutral and cationic compounds (Giacomini et al. 2010), MRP2 is the main biliary export system for phase II drug conjugates, also transports non-metabolized xenobiotics (Nies et al. 2008; Ieiri et al. 2009; Marquez and van Bambeke 2011), while BCRP was shown to transport anticancer drugs and environmental carcinogens (Polgar et al. 2008; Poguntke et al. 2010; Meyer zu Schwabedissen et al. 2011) as well as sulphate conjugates of drugs and steroid hormones (Nakanishi and Ross 2012).
MRP transporters are able to transport endogenous and exogenous substrates across cell membranes against concentration gradients using ATP as energy source. There are currently nine members of the MRP family described, which differ in their substrate spectrum and their location within cellular membranes. In contrast to the hepatic transport proteins, MRP3, MRP4 and MRP6, which act as basolateral efflux pumps transporting their substrates from the hepatocyte back into the sinusoidal blood (Konig et al. 1999; Rius et al. 2003), MRP2 is expressed on the apical surface membrane of several epithelial membranes including the canalicular membrane of hepatocytes (Konig et al. 1999) (Fig. 4). Here, MRP2 is able to transport numerous organic anionic compounds, drugs and their conjugated metabolites. MRP2 is mainly detected in liver but is also expressed in epithelial cells of the gall bladder (Rost et al. 2001), in the proximal tubulus system of the kidney (Schaub et al. 1999), in the small intestine, as well as in placental trophoblast (Evseenko et al. 2006) and in CD4+ lymphocytes (Janneh et al. 2007). MRP2 is especially efficient at transporting glucuronide, sulfate and glutathione (GSH) conjugates, a feature which connects MRP2 closely to the activities of enzymes involved in phase I and phase II metabolism. MRP2 has been demonstrated to transport endogenous compounds such as GSH, leukotrienes, bilirubin glucuronide and conjugates of hormones such as estradiol (Keppler 2011). Besides BSEP, MRP2 appears to be one of the major efflux transporters of bile acids in the liver. This is confirmed by the observation that mutant rats exhibit a reduction in bile flow by approximately 50 % when lacking Mrp2 (Jansen et al. 1985; Bohme et al. 1994). Furthermore, MRP2 appears to be strongly involved in drug transport. Several in vitro studies demonstrated that MRP2 is able to transport several antineoplastic agents, including methotrexate, cisplatin, irinotecan, cyclophosphamide, paclitaxel and vincristine (Chu et al. 1997; Cui et al. 1999; Van Aubel et al. 1999; Evers et al. 2000; Huisman et al. 2005). Other important therapeutics transported by MRP2 include protease inhibitors, such as indinavir, ritonavir and saquinavir, used in HIV therapy (Huisman et al. 2002; Su et al. 2004). A polymorphic expression or modulated expression patterns of MRP2 accounted for drug resistance observed in vitro and in vivo. MRP2-related loss in therapy efficacy has been described for metotrexate (Hulot et al. 2005), chlorambucil (Smitherman et al. 2004), doxorubicin (Kool et al. 1997), cisplatin (Korita et al. 2010; Taniguchi et al. 1996) and several antiepileptic drugs (Dombrowski et al. 2001; Potschka et al. 2003a, b; Loscher and Potschka 2005). MRP2 is also regulated by numerous NRs as reviewed in section “Nuclear receptors.”
4.2.2 Phospholipids and cholesterol
Phospholipids, mainly as phosphatidylcholine, and cholesterol are secreted from the canalicular membrane into bile by ABC transporters. This process is tightly linked with canalicular bile salt secretion and requires the coordinate action of BSEP, MDR3 and ABCG5/ABCG8 (Oude Elferink and Groen 2000; Small 2003). MDR3 (ABCB4) (Mdr2 in rodents), is a phospholipid flippase translocating specifically phosphatidylcholine from the inner to the outer leaflet of the canalicular plasma membrane (Oude Elferink and Beuers 2011) (Fig. 4). Phosphatidylcholine is released from the outer leaflet into the canaliculus along with bile salts (secreted by BSEP), and forms mixed phosphatidylcholine–bile salt micelles (Small 2003). The release of cholesterol from the canalicular plasma membrane is facilitated by the presence of the heterodimeric ABC-transporter ABCG5/ABCG8 (ABCG5/ABCG8) (Wang et al. 2006). The exact molecular mechanism of ABCG5/ABCG8-mediated cholesterol release is not completely elucidated, but ABCG5/ABCG8 may act as a flippase projecting part of the cholesterol molecule into the outer membrane leaflet thereby creating a configuration that enables cholesterol to be picked up by phosphatidylcholine–bile salt micelles (Wittenburg and Carey 2002).
4.2.3 Bilirubin
Once unconjugated bilirubin is conjugated to glucuronic acid by UGT1A1 in hepatocytes, bilirubin diglucuronide (BDG) is excreted into bile by MRP2. The functional role of MRP2 in BDG transport became evident from the identification of two rat strains naturally lacking functional Mrp2: transport deficient (TR−) rats (Jansen et al. 1985) and Eisai hyperbilirubinemic rats (Takikawa et al. 1991). These rats display a hereditary defect of biliary secretion of organic anion conjugates in conjunction with a 50 % reduction in bile flow and have mutations in their Abcc2 gene (Paulusma et al. 1996; Ito et al. 1997). The impact of MRP2 on bilirubin glucuronide transport is particularly well reflected in its pathogenetic connection to the Dubin–Johnson syndrome, a hereditary autosomal recessive disorder characterized by functional impairment of MRP2 in the apical membrane of hepatocytes due to genetic mutations within the ABCC2 gene. Patients suffering from Dubin–Johnson syndrome show a benign chronic-conjugated hyperbilirubinemia (Kartenbeck et al. 1996) and the deposition of a dark pigment in the hepatocytes (Nies and Keppler 2007). Lack of functional MRP2 is correlated with an increased expression of MRP3 on the basolateral membrane of hepatocytes (Hirohashi et al. 1998; Konig et al. 1999). MRP3 transports bilirubin glucuronides and its upregulation in the absence of functional canalicular MRP2 further supports its role as a basolateral salvage transporter (Borst et al. 2007).
4.2.4 Bile salts
Bile salts are secreted from the hepatocyte into the canaliculus by BSEP and MRP2 (Stieger et al. 2007; Stieger 2011). BSEP, constitutes the rate-limiting step in bile salt secretion, and therefore, BSEP is critical to maintain a low intracellular concentration of bile salts (Stieger et al. 2007; Stieger and Beuers 2011). Rodent Bsep shows a low transport activity for cholate (Gerloff et al. 1998), while the evidence for human BSEP is conflicting (Mita et al. 2006; Noé et al. 2002). BSEP is mainly expressed in the liver where its expression is limited to the canalicular membrane of hepatocytes (Fig. 4). Different forms of BSEP in species such as the rat (Gerloff et al. 1998), human and mouse (Stieger 2011) have been cloned and characterized for functional properties. These studies showed that BSEP is composed of twelve transmembrane-spanning domains (Gerloff et al. 1998). Several groups reported extrahepatic expression of BSEP at the mRNA level (Stieger et al. 2007; Hanafy et al. 2012) but only one study showed an extrahepatic protein expression, specifically in mouse kidney (Huls et al. 2006).
Impairment of BSEP function due to inherited mutations or drug-induced inhibition leads to severe liver disease (Davit-Spraul et al. 2009; Stieger 2010). Non-functional BSEP will induce an increase in bile salt concentration in hepatocytes, which in turn leads to mitochondrial toxicity (Krahenbuhl et al. 1994). Several genetic polymorphisms and mutations impair the function of BSEP, leading to a disturbed bile salt excretion and to cholestasis in humans. Depending on the pattern of occurring mutations, a polymorphic expression of BSEP can induce a wide spectrum of cholestatic phenotypes ranging from very mild to very aggressive forms, such as progressive familial intrahepatic cholestasis type 2 (PFIC2) (van Mil et al. 2004; Lam and Benet 2004; Pauli-Magnus et al. 2005; Oude Elferink et al. 2006; Takahashi et al. 2007a; Davit-Spraul et al. 2009). PFIC2 leads to severe jaundice, hepatomegaly and pruritus, combined with histologically detectable portal inflammation, giant cell hepatitis and high serum levels of bile acids and liver-specific aminotransferases. Children affected by PFIC2 in most cases require liver transplantation during the first decade because of cirrhosis and liver failure (Bezerra and Balistreri 2000). Milder BSEP-associated cholestasis forms include benign recurrent intrahepatic cholestasis (BRIC2), which is associated with repeatedly occurring episodes of cholestasis and gall stone formation (van Mil et al. 2004; Lam et al. 2005).
Multiple drugs are known to inhibit BSEP function (Stieger et al. 2000; Morgan et al. 2010; Stieger 2011; Dawson et al. 2012). This has been demonstrated in animal models and in different cell lines for glitazones and glibenclamide, bosentan, cyclosporine, statins, efavirenz and saquinavir (reviewed in Stieger 2010). While low IC50 values for BSEP correlate with drug-induced liver problems (Morgan et al. 2010), serum concentrations of drugs do not correlate with their tendency to cause DILI, indicating the importance of additional factors, such as drug uptake into hepatocytes (Dawson et al. 2012). In contrast to the severe phenotypes that BSEP deficiency confers in human, mice lacking the protein suffer only from mild cholestasis (Wang et al. 2001). The importance of BSEP for xenobiotics and, in this context, particularly drug transport appears to be negligible. Only pravastatin appears to be transported by BSEP (Hirano et al. 2005).
In addition to BSEP-mediated bile salt export into the canaliculus, bile salt export is also possible across the basolateral plasma membrane back into the sinusoids. This route becomes relevant under pathophysiological conditions with impaired canalicular bile salt export for protecting hepatocyte from the toxic action of bile salts. Basolateral bile salt export involves three different bile salt transport systems (Fig. 4). Rat and human Mrp3/MRP3 have been demonstrated in heterologous expression systems to mediate ATP-dependent bile salt transport (Hirohashi et al. 2000; Zeng et al. 2000; Akita et al. 2002), whereby the human system has a considerably higher affinity for bile salts than the rat system. While in rats, Mrp3 is strongly upregulated under cholestatic conditions (Donner and Keppler 2001; Soroka et al. 2001), data from liver biopsies from patients with cholestatic liver disease are conflicting (Shoda et al. 2001; Zollner et al. 2001; Schaap et al. 2009). Human MRP4 acts as a bile salt transporter in the presence of GSH (Rius et al. 2003) and is upregulated under cholestatic conditions (Keitel et al. 2005; Gradhand et al. 2008; Chai et al. 2011). Consequently, these two transporters may help to reduce the toxic concentrations of bile acids in the hepatocytes under cholestatic conditions.
4.3 Transporter expression in hepatocyte models
4.3.1 Primary cultured hepatocytes
Primary cultures of hepatocytes in different configurations are widely used as a tool to study transport, metabolism or toxicity of drugs, and new chemical entities and, often, such studies also include the investigation of regulation of the processes involved (Lake et al. 2009; Swift et al. 2010). However, primary hepatocytes as tools for the investigation of the role of hepatocytes in drug disposition have clear limits, such as the high functional variability observed between human hepatocytes from different donors, the limited life span and the difficulties in maintaining a differentiated phenotype over culture time in vitro resulting in strongly reduced expression of some of the transporters (Guguen-Guillouzo and Guillouzo 2010). Technical improvements regarding the cell density, the composition of the culture medium or the use of different matrices on which to seed hepatocytes are continuously developed to circumvent the limitations of these models. Nevertheless, polarity, expression and maintenance of transporters and metabolic enzymes have to be monitored carefully in order to extrapolate data obtained from primary cell culture to hepatic metabolism, transport or toxicity into an in vivo setting such as patients (Sahi et al. 2010).
In primary culture, rat hepatocytes rapidly lose Ntcp mRNA expression and taurocholate uptake capacity on collagen-coated plates (Liang et al. 1993). There is a faster downregulation of mRNA (a decrease to 27 % after 24 h culture) than of Ntcp protein (a decrease to 48 % after 24 h culture) (Rippin et al. 2001). The extent of Ntcp protein downregulation parallels the downregulation of initial uptake rates of Na+-dependent taurocholate, with only 5 % of protein and slightly more transport activity remaining after 72 h. Similar findings were observed for Oatp transporters (Rippin et al. 2001) such that Oatp1a1 mRNA and protein levels are rapidly and dramatically reduced (to approximately 10 % and 20 % for mRNA and protein, respectively, after 48 h culture) with a transport activity remaining at about 40 % at 72 h, Oatp1a4 shows a comparable but less pronounced reduction (approximately reduction to 20 % and 50 % for mRNA and protein expression respectively after 48 h), while transport activity for Oatp1a1 and Oatp1a4 at 72 h remains with about 30–40 % of the initial transport activity (Rippin et al. 2001). Consequently, the function of Oatps is better preserved than the function of Ntcp. Protein expression of Mrp2 and Bsep as canalicular efflux transporters is maintained around 50 % of initial values after 72 h of culture (Rippin et al. 2001). The dedifferentiation of this culture system is also illustrated by a massive upregulation of Mrp1, which is a marker for regenerating hepatocytes, i.e. proliferating (Roelofsen et al. 1997). The uptake of the Oatp substrate, pravastatin, decreases with time, supporting the findings regarding Oatp protein expression (Ishigami et al. 1995). mRNA coding for facilitative glucose uptake was reported to increase over 9 h in primary cultured rat hepatocytes (Rhoads et al. 1988). The expression of mdr1 is upregulated in primary rat hepatocytes (Fardel et al. 1992), more specifically Mdr1b is very strongly upregulated and Mdr1a is moderately upregulated in primary hepatocyte culture, while Mdr3 is downregulated (Lee et al. 1993). In human hepatocytes, MDR1 expression and extrusion of doxorubicin from primary human hepatocytes is only moderately upregulated over time in culture (Fardel et al. 1993), suggesting species-specific changes in MDR1 expression during culture.
This marked reduction in transport activity observed in cultured rat hepatocytes seems to be less pronounced in human hepatocytes. Interestingly, human hepatocytes cultured on collagen-coated plates preserved 70 % of their taurocholate uptake activity after 5 days in culture (Jemnitz et al. 2012). In primary human hepatocytes cultured in sandwich cultures for 5 days, protein expression of efflux transporters, BSEP, MRP2 and BCRP, is generally maintained or increased compared to the liver (Takeba et al. 2011; Schaefer et al. 2012). A recent study evaluated the uptake kinetics of OATP1B1 and OATP1B3 in plated primary human hepatocyte over time and revealed that culture time was crucial. After 2 h in culture, OATP1B1- and OATP1B3-mediated uptake was observed in all donors, while over longer culture times, an extensive decrease in transport activity, together with an increased variability due to increased passive uptake, was observed (Ulvestad et al. 2011). If transport experiments are performed, the inter-individual variability of transporter expression in human liver, as demonstrated, e.g., for canalicular ABC transporters (Meier et al. 2006) or the basolateral uptake systems OCT1 and OCT3 (Nies et al. 2009) needs to be taken into account, as it will affect transport measurements and their interpretation (De Bruyn et al. 2011).
Changing the culture conditions of primary hepatocytes to a sandwich configuration between collagen layers not only leads to the formation of an extensive canalicular network with culture time (LeCluyse et al. 1994), but also to a partial recurrence of Ntcp expression and transport activity over 5 days of culture time (Liu et al. 1998). This finding is also true of the basolateral uptake transporters, Oat1a1 and Oatp4, as well as to the basolateral efflux transporters, Mrp3 and Mrp4 (Swift et al. 2010). In rat hepatocyte sandwich cultures, canalicular exporters are similar to classic cultures, only mildly downregulated, such as Bsep or Mrp2, or induced, such as Bcrp, or p-glycoprotein (Swift et al. 2010). It should be kept in mind that transporter expression in the sandwich culture configuration can be significantly affected by the choice of culture medium (Turncliff et al. 2006). Determination of the bile salt excretory index allows the measurement of canalicular secretion of substances, which is a unique property of the sandwich culture system (Swift et al. 2010). However, a rapid downregulation of uptake and export systems was reported in this setup, which may be related to methodological and technical differences (Tchaparian et al. 2011). Investigation of human hepatocytes in sandwich culture showed comparable changes in transporter expression for some transporters (e.g. BSEP, MDR1, MRP4) to those in rat hepatocytes, while the expression of other transporters is different or even the opposite (e.g. MRP2, BCRP, MRP4) (Li et al. 2009a; Swift et al. 2010). Hence, comparison of results obtained in rat and in human hepatocyte sandwich cultures needs careful analysis and should take into account transporter expression levels (Kotani et al. 2011). Finally, absolute quantification of efflux and uptake transporters in sandwich-cultured human hepatocytes showed comparable transporter amounts in comparison with human liver tissue (Schaefer et al. 2012).
4.3.2 Organoid cultures
Organoid cultures can originate from intact tissue, such as tissue slices, or from cells cultured to form or resemble 3D cultures. For example, human liver slices can be maintained in culture, where the levels of many transporters change considerably, but the transporters involved in drug and bile acid transport such as NTCP, BSEP, several OATPs and MRPs remained fairly constant during 24 h of culture (Elferink et al. 2011). For isolated hepatocytes, various encapsulation or entrapment methods are known (Meng 2010). There have been no extensive systematic investigations on the expression of transport proteins and/or transporter functions in these types of organoid cultures. Hepatocytes encapsulated in alginate have reported maintained uptake of salicylate, allopurinol and prostaglandin E2 for 120 days (Koizumi et al. 2007). Entrapment of rat hepatocytes has also been reported to maintain the expression of Ntcp, albeit at a reduced level, for up to 5 days, while expression of Oatp1a1, Oct1, Oat2, Mdr1 and Mrp2 was detectable for up to 9 days (Yin and Meng 2012). These expression data were supported by significant inhibitor-sensitive accumulation or efflux of typical substrates of Oatp1a1, Oat2, Mrp2 and Mdr1, which compare favorably with the sandwich system after 5 days and in gel-entrapped rat hepatocytes (Yin and Meng 2012). Mitaka and co-workers developed a hepatic-organoid culture system using long-term culture of progenitor hepatocytes of the rat the so-called small hepatocytes (Chen et al. 2007). These progenitor cells expand in culture and form canalicular networks that accumulate fluorescein, demonstrating canalicular secretion (Mitaka and Ooe 2010). After prolonged culture, these organoids display the polar expression of hepatocellular transporters, e.g. Ntcp and Oatp1b2 are expressed in the basolateral membrane, and Mrp2 and Bsep are expressed in the canalicular membrane (Sidler Pfandler et al. 2004). Immunofluorescent analysis of Mrp2 expression revealed a 3D network of canaliculi, which were able to secrete fluorescein and the fluorescent bile salt cholylglycyl-fluorescein (Sidler Pfandler et al. 2004).
5 Liver in vitro models in pharmacology, toxicology and basic research
This section describes different ex vivo and in vitro models used in research. The models extend from the most in vivo-like to isolated cells, followed by complex 3D models and bioreactors. In addition, since human hepatocytes are a valuable model but in limited supply, alternative models which have been developed in recent years are described.
5.1 The isolated perfused rat liver


The isolated perfused liver is a well-established experimental model for studies on hepatic metabolism, trans-hepatocellular transport, pharmacokinetics, hemodynamics, intra- and intercellular communication in the liver and transplantation research. This experimental model was introduced by Miller et al. (1951), and several excellent reviews have appeared since then on this topic (Sies 1978; Gores et al. 1986; Häussinger 1987; vom Dahl and Häussinger 1997; Sahin and Rowland 1998; Sahin 2003; Bessems et al. 2006; Zhang et al. 2012). This section will primarily focus on rat liver perfusion.
Studies using the intact liver have the advantage that the structural and functional organization of the liver is preserved with the maintenance of hepatocyte polarity, hemodynamic responses, the interplay and communication between different intrahepatic cell populations, and in situ signaling properties due to intrahepatic micro-milieus, as well as compartmentation at the cellular and subcellular levels. This, however, makes this experimental system more complex, but the problem of complexity can partly be overcome by use of additional techniques such as organ spectrophotometry, the retrograde/antegrade perfusion technique, use of micro-electrodes, use of selective inhibitors, radiolabeled compounds, different fractionation techniques of the liver tissue and analysis of liver specimens obtained at different time points of perfusion for analysis of signal transduction elements, gene expression or protein localization. By means of these approaches, intracellular events can be followed up directly and indirectly by analyzing the composition of the perfusate before and after a liver passage. In the following, the technique of isolated liver perfusion with some major modifications and applications will briefly be discussed based on own previous reviews on this topic (Häussinger et al. 1987; vom Dahl and Häussinger 1997).
5.1.1 The perfusion apparatus—general considerations
An example of a perfusion setup is schematically depicted in Fig. 7. The perfusion fluid is delivered from a reservoir by a roller pump at a constant speed (“constant flow system”) to a silicon tube oxygenator, where the perfusion fluid is warmed up to 37 °C and equilibrated with an appropriate gas mixture, for example O2/CO2 (95/5; v/v), when the perfusion fluid is Krebs–Henseleit buffer. Alternatively, a “constant pressure system” can be used, which keeps the perfusion pressure constant, whereas the perfusion flow varies with alterations of perfusion resistance. Appropriate additions of metabolites, hormones or drugs to the influent perfusate can be performed by precise micropumps for defined time periods. The perfusate enters the liver via the cannulated portal vein and is drained into effluent by a cannula fixed in the superior caval vein. The hepatic artery usually is tied off; however, perfusion can also be performed bivascularly, i.e. via the portal vein and the hepatic artery (Sahin and Rowland 1998; Gardemann et al. 1991). Under these conditions, the portal versus hepatic arterial flow ratio should be about 4:1 (Gardemann et al. 1991). When required, the bile duct is cannulated and bile samples can be taken for analysis, as is the case with the effluent perfusate samples. Besides the portal pressure, the oxygen concentration and pH in effluent perfusate are monitored continuously, as well as the effluent Ca2+ and K+ concentrations using ion-sensitive electrodes, which are placed in the effluent perfusate. One lobe of the liver may be placed in the light beam of a dual wavelength organ photometer (Sies et al. 1974). A platinum electrode may be placed around the portal vein and hepatic artery, and perivascular hepatic nerves can be stimulated electrically with 20 V, a frequency of 20 Hz and an impulse duration of 2 ms (Hartmann et al. 1982; Häussinger et al. 1987). Placing the liver on a balance pan not only allows for monitoring liver mass, whose baseline constancy is one surrogate marker for excellent perfusion quality, but also allows the measurement of substrate- and hormone-induced changes in the hepatocellular water content in the absence of alterations of perfusion pressure and flow (vom Dahl et al. 1991). Finally, a liver lobe can be placed into a light beam with specific wavelengths for organ photometry and fluorescence recordings (Sies 1978; Sies et al. 1974).

Setup for isolated rat liver perfusion in the open, non-recirculating, constant flow system. a The liver is posted on a balance pan, which allows for continuous monitoring of liver mass. Perivascular nerve stimulation is achieved by means of a platinum electrode placed around the portal vein. b Organ photometry/fluorimetry allows to monitor redox transitions in the NAD(P)H/NAD(P)+ system using nicotinamide nucleotide-specific wavelength pair 350–377 nm
The quality of a liver perfusion experiment is decisive for its scientific validity of the experiment. Several criteria of a good perfusion quality must be considered, and several parameters should be monitored. The macroscopic aspect of the liver is homogeneously light-brown without evidence of swelling, the basal portal pressure should be 2–5 cm H2O at a flow rate of approximately 4 ml/min/g liver, which should be constant throughout the experiment in the “constant flow” system. Continuous perfusion pressure monitoring allows not only for investigation of vasoactive compounds, but also for the detection of micro-embolisms, which lead to sudden, only partly transient increases in the perfusion pressure. The K+ concentration should remain constant throughout the experiment, unless K+ fluxes across the plasma membrane are induced by hormones, substrates, nerve stimulation (Fig. 8) or anisoosmolarity (Häussinger et al. 1987). The release of lactate dehydrogenase into the perfusate should be less than 1 mU/ml in the open system of perfusion; the basal oxygen consumption should be 2.3–3.0 μmol/g/min and the pH in effluent 7.35–7.45 throughout the experiment, which is carried out at 37 °C. Most importantly, experimentally induced deviations of pH, [K+], [Ca2+], oxygen uptake and portal pressure should be reversible and reproducible within the same perfusion experiment. This also holds for metabolic effects and other functional parameters, such as glucose release, urea and glutamine synthesis, thiol release, K+ and Ca2+ transients, bile flow, biliary excretion and the response to challenges, such as hormones, and may give additional information on the perfusion quality. The macroscopic appearance, the continuous monitoring of oxygen uptake, portal pressure, pH and [K+] in effluent perfusate, determination of lactate dehydrogenase activity in the effluent perfusate in 5-min intervals and the reversibility and reproducibility of metabolic effects are normally sufficient for the assessment of good perfusion quality. Viability of the liver in the hemoglobin-free non-recirculating perfusion system is maintained usually over a period of 3 h.

Effect of electrical perivascular nerve stimulation on the K+ concentration in effluent perfusate (from Häussinger et al. 1987)
Several modes of liver perfusion can be distinguished:
-
Perfusion with versus without oxygen carriers
-
Non-recirculating versus recirculating perfusion
-
Constant flow versus constant pressure perfusion
-
Antegrade versus retrograde perfusion
Usually, the bicarbonate-buffered Krebs–Henseleit solution (118 mM NaCl, 4.8 mM KCI, 1.2 mM KH2PO4, 1.2 mM MgSO4, 1.25 mM CaCl2, 25 mM NaHCO3), equilibrated with O2/CO2 (95/5; v/v) at 37 °C to give a final pH of 7.4, is used. When albumin is added, it should be defatted and dialyzed and the CaCl2 concentration should be raised to 2.5 mM. Albumin should be present in studies on lipid metabolism; however, albumin is not required for reasons of oncotic pressure, since the liver does not have an interstitial space like other organs. The perfusion fluid should contain L-lactate and pyruvate at concentrations of 2.1 and 0.3 mM, respectively, in order to adjust the redox potential in the cytosolic compartment at −241 mV. The addition of an energy-providing substrate is necessary in experiments with livers from starved rats, whereas the glycogen content of livers from fed rats is usually sufficient for a 1–2-h perfusion experiment. In this hemoglobin-free perfusion system, an adequate O2 supply for the liver even during stimulation of hepatic metabolism is guaranteed when the perfusion medium is saturated with 95 % O2 and the flow is approximately 3.5–4 ml/g liver/min, a value about threefold the physiological portal blood flow rate (i.e. 1.25 ml/g liver/min Gores et al. 1986). The perfusion flow should not exceed 5 ml/g liver/min in order to avoid sinusoidal endothelial cell damage. Rates of gluconeogenesis, ureagenesis and oxygen uptake are not affected by the presence or absence of erythrocytes. However, oxygen carriers like erythrocytes or fluorocarbons may be necessary when lower flow rates are desired or when an exceedingly high O2 consumption is expected in the respective investigation. The disadvantage of using erythrocytes is the introduction of another metabolically active compartment, and some of the fluorocarbons are hepatotoxic and are not metabolically inert. On the other hand, oxygen carriers allow for lower, more physiological perfusion flow rates.
The perfusion can be carried out with a single liver passage of the perfusate (non-recirculating “open” system of perfusion) or the perfusate can be recirculated (“closed” system). The latter system has the advantages that (1) the total perfusion volume is low and resource-sparing and that it (2) allows for an accumulation or enrichment of products generated at low amounts during a single liver passage. The closed perfusion system was, for example, successfully employed in studies on the synthesis and degradation of acute phase proteins by the liver. However, the major disadvantage of recirculating systems is that the composition of the perfusate changes with each liver passage and metabolic steady-state conditions are not achieved or maintained. Furthermore, the accumulation of organic acids requires a careful pH monitoring of the perfusate and appropriate pH adjustments. On the other hand, the open system of perfusion allows the constant addition of defined substrate concentrations and calculation of metabolic flux rates, when metabolic steady-state conditions are achieved. Further, when the substrate or an effector is removed, the reversibility and reproducibility of the observed effects can be studied in the same experimental preparation—an important parameter for the interpretation of experimental results.
When vasoactive compounds are added to a constant flow system, the perfusion pressure will increase and perfusion pressure monitoring is recommended, because a high perfusion pressure harbors the threat of endothelial cell damage. Instead of constant perfusate delivery via a roller pump, perfusion can also be carried out with a constant perfusion pressure (“constant pressure system”); whereby each change in the vascular resistance will alter the amount of perfusate flowing through the liver. In order to avoid incomplete liver perfusion, such a device requires careful monitoring of the perfusion flow, and one has to keep in mind that changes in metabolic flux rates may be due to changes in substrate delivery to the liver.
The perfusate flow direction is normally from the portal to the hepatic vein, but can be changed also into the opposite direction. Experiments with altering the perfusion direction within the same liver preparation were used in studies on functional cell heterogeneities along the liver acinus (Häussinger 1983; Häussinger and Stehle 1988). In such experiments, it is important that the perfusion pressure is similar in antegrade and retrograde perfusion directions. This is achieved by carefully adapting and positioning of the tube systems.
The sequential liver perfusion technique has been employed for studies on mediator compounds, which are formed inside the liver acinus, but are normally not released into effluent perfusate due to inactivation by perivenous scavenger cells (Häussinger and Stehle 1988). In this setup, the perfusate leaving the first liver is re-oxygenated and thereafter enters a second liver, whose metabolic and hemodynamic response is monitored. By changing the perfusion direction in the first liver to the retrograde mode, mediators formed inside the liver acinus are not eliminated by perivenous scavenger cells and enter the second liver, which is used as a reporter organ.
5.2 Applications of liver perfusion
5.2.1 Determination of metabolic flux rates
With a constant substrate supply via the portal vein (non-recirculating, single pass perfusion), the concentrations of respective products in the effluent perfusate can be measured. When the equilibrium between substrate concentration and product formation, i.e. the metabolic steady state is reached, the flux rate through a respective pathway can be calculated. Examples are the formation of urea from added NH4C1 or proteolysis inhibition by ethanol and acetaldehyde (Häussinger et al. 1986; Vom Dahl and Häussinger 1998). As shown in Fig. 9, acetaldehyde (5 mmol/l) inhibits proteolysis (measured as 3H-leucine release from in vivo pre-labeled liver proteins) by about 20 %. The effect is fully reversible after withdrawal of acetaldehyde, indicating that the effect is not due to an impaired viability of the perfused liver. Not only the flux through a whole pathway including transport steps across the plasma and mitochondrial membranes, but also the flux through a single enzymatic step can be measured by use of labeled products; for example, flux through pyruvate dehydrogenase may be determined as 14CO2 production from added 1-14C-pyruvate. By combining these techniques with the use of inhibitors, measurements of substrate disappearance and the formation of the various products, complex quantitative metabolic flux maps can be established with identification of sites of metabolic flux control. Recent studies suggest that the effluent perfusate of isolated perfused rat liver can be used to study the liver secretome, i.e. the proteins secreted by the various liver cell types.

Antiproteolytic effect of acetaldehyde in the single pass perfused rat liver. a Acetaldehyde (5 mmol/l) was infused into the perfused liver for 30 min, and the release of [3H]leucine from pre-labeled rats was taken as a measure of proteolysis. b The resulting inhibition of proteolysis under steady-state conditions at different concentrations of acetaldehyde. Data are from 2 to 4 different experiments and are given as mean ± SEM. From vom Dahl and Häussinger (1998)
5.2.1.1 Monitoring of intracellular events
Freeze-clamps of perfused liver and metabolite extraction allow the determination of intracellular metabolite levels or enzyme activities. Here, correction has to be made for the extracellular space and the technique will give overall tissue levels of metabolites, but no information about the concentrations in specific cell types and subcellular compartments. During the individual perfusion experiment, liver lobes can be ligated and excised in a way that keeps the portal pressure constant by adjusting the perfusate flow. Current evidence suggests that this approach allows harvesting at least three sequential tissue samples without affecting the function of the remaining tissue. This allows studying signal transduction events by determining changes in protein phosphorylation and their reversibility within one liver preparation (for example see Cantore et al. 2011). Sequentially removed liver tissue specimens can also be used for the determination of changes in gene expression and protein localization (toponomics) using immunohistochemistry and fluorescence profiling. Such techniques have been employed in studies on the regulation of transporter insertion/retrieval into or from the canalicular membrane and to link these movements to signal transduction mechanisms (Cantore et al. 2011).
Intracellular events can also be monitored with radioactive compounds. This approach was used in studies on the CO2/HCO3 − compartmentation in perfused rat liver (Häussinger 1986). A noninvasive method for studying intracellular parameters is the use of organ photometry (Sies and Chance 1970; Sies et al. 1974; Sies 1978). With the dual wavelength mode, light is transmitted through a liver lobe of 2–4 mm thickness and both absorbance and fluorescence are measured with photomultipliers and monitored during metabolic transitions. This technique allows the sensitive assessment of the redox state and its transitions for nicotinamide nucleotides (using the nicotinamide-specific wavelength pair 350–377 nm) and various CYPs as well as the follow-up of catalase compound I. Calibration of the system can be performed with dansylated serum albumin for measurement of the extracellular component of the penetrating light path. By means of the relative fluorescence/absorbance ratios during the metabolic transitions, different nicotinamide nucleotide pools can be characterized as a consequence of nicotinamide nucleotide compartmentation by binding and spatial subcellular compartmentation. For the determination of the redox status of the cytosolic and mitochondrial NADH/NAD+ systems, the concentrations of the redox indicator metabolite couples lactate/pyruvate and β-hydroxybutyrate/acetoacetate in effluent perfusate can be measured (Bücher and Sies 1976).
Monitoring the washout curves after equilibration of the single pass perfused rat liver with 3H-inulin/14C-urea allows to determine the intracellular water space in perfused rat liver (vom Dahl et al. 1991). 3H-inulin will equilibrate in the extracellular space only, whereas 14C-urea equilibrates not only with the inulin-accessible space, but also in the intracellular compartment. From the washout curves of both labels, a virtual “urea space” and a virtual “inulin space” can be calculated. The difference between both spaces reflects the intracellular water space. This technique is noninvasive and can repeatedly be employed in one single liver preparation so that cell hydration changes under the influence of effectors, such as amino acids or hormones, and their reversibility can be determined. By means of this technique, cell hydration changes as low as 2 % can reliably be picked up. Combining this technique with simultaneous liver mass, K+ and perfusion pressure recordings allow conclusions about fluctuations of intra- and extracellular spaces.
5.2.1.2 Studies on hepatocyte heterogeneity
Many metabolic steps are heterogeneously distributed along the liver acinus. Metabolic interactions between different subacinar hepatocyte populations have been established in ammonium, glutamine and eicosanoid metabolism (Häussinger 1983; Groothuis et al. 1982; Häussinger and Stehle 1988). This functional hepatocyte heterogeneity can be studied in isolated perfused rat liver, in which the structural organization is preserved, by the retrograde–antegrade perfusion technique (Häussinger 1983). When two metabolic pathways are differently localized in the acinus and share a common substrate, under conditions of a rate-limiting substrate supply, one of these pathways will be favored depending upon the direction of perfusion. As for controls, the metabolic flux differences between retro- and antegrade perfusion must be abolished either when excess substrate is added or when one of these competing pathways is inhibited. Such competing pathways are urea and glutamine synthesis from ammonium ions (Fig. 10), and by means of this technique, the periportal localization of urea synthesis and glutaminase and the perivenous localization of glutamine synthetase and the existence of the intercellular glutamine cycle in the structurally and metabolically intact liver were demonstrated (Häussinger 1983). The antegrade/retrograde perfusion technique was also successfully employed with regard to intra-acinar eicosanoid metabolism (Häussinger and Stehle 1988). Here it was shown that prostanoids can be formed inside the liver acinus, but do not leave the liver due to their removal by perivenous hepatocytes (so-called perivenous scavenger cells) (Häussinger and Stehle 1988; Morimoto et al. 1993). Oxygen microelectrodes and microlightguides (Ji et al. 1980) have been developed for the registration of oxygen tension and fluorescence at different sublobular regions; however, these techniques are restricted to signals obtained from the hepatocytes located at the surface of a lobe. Perfusion experiments after destruction of the perivenous compartment of the liver acinus without impairment of the periportal zone have also been used for studies on hepatocyte heterogeneity (Häussinger and Gerok 1984).

Retrograde/antegrade liver perfusion for studies on hepatocyte heterogeneity. The technique was first used in studies on hepatic ammonia metabolism (Häussinger 1983). Urea cycle enzymes are located in periportal hepatocytes, whereas glutamine synthetase is located in a small perivenous hepatocyte population surrounding the terminal hepatic venule. Under conditions of limited ammonia supply, the metabolic fate of ammonia is dependent on the direction of liver perfusion
The heterogeneity of hepatocytes in transport function was studied for taurocholate, DBSP, ouabain and the asialoglycoprotein asialoorosomucoid in antegrade and retrograde perfusions, combined with autoradiographic or fluorescence localization and computer modelling (Groothuis et al. 1982, 1983; Braakman et al. 1987; van der Sluijs et al. 1988). For taurocholate, Rhodamine B and asialoorosomucoid, but not for DBSP or ouabain a steep gradient was observed in the liver lobules. Moreover a prominent difference in the biliary excretion rate of zone 1 and zone 3 hepatocytes was found for taurocholate.
5.2.1.3 Mouse liver perfusion studies
Mouse liver perfusions are increasingly employed due to the availability of a great variety of transgenic mouse models. Mouse liver perfusion is in principle similar to rat liver perfusion; however, the perfusion apparatus has to be miniaturized and the liver perfusion is preferably performed with the liver in situ due to the small animal size. Perfusate composition and flow per g liver is similar to that employed in rat liver perfusion. Mouse liver perfusion has been employed in studies on the heterotrimeric G-protein Gi3 on insulin-induced autophagy in liver using different knockout animals (Gohla et al. 2007) and on the role of the K+ channel α-subunit KCNQ1, serum and glucocorticoid-inducible kinase SGK1 for insulin-induced K+ fluxes and cell hydration changes employing livers from KCNQ1-knockout, SGK1-knockout and control mice (Boini et al. 2009a, b).
5.3 Precision-cut liver slices


Warburg and Krebs used slices of tumor and liver tissue as early as the 1920s (Krebs 1933; Warburg 1923). Liver slices were prepared manually with limited reproducibility and viability (Stadie and Riggs 1944). After a decline in the application of slices in favor of the use of isolated hepatocytes, the development of the Krumdieck slicer in the 1980s led to a “comeback” of the technique enabling the production of reproducible and viable slices (Krumdieck et al. 1980). This technology induced a revival of the liver slices. The technique of PCLS has been described in detail in a recent publication by de Graaf et al. (2010). There are numerous pivotal steps to obtain and culture viable liver slices. The first is the source of the liver tissue. In animal experiments, the source can be controlled and perfusion of rat or mouse livers with a solution, such as an organ preservation solution or simple buffer medium, before harvesting is not necessary. Perfusion can deteriorate the viability during incubation (P. Olinga, unpublished data). In addition, blood taken by a heart puncture before harvesting of a rat or mouse liver is not recommended and may also influence the viability of the PCLS in culture. Livers of larger animals such as monkeys (Olinga et al. 1998a) or dogs (P. Olinga, unpublished data) should preferably be perfused with ice-cold organ preservation solution (e.g. University of Wisconsin Organ preservation solution (UW) (Belzer et al. 1990). Human liver tissue can be obtained from surgical waste after partial hepatectomy or parts of non-transplantable donor liver (Olinga et al. 1998a; Elferink et al. 2011; Vickers et al. 2011). Human surgical waste material should be perfused with UW to remove blood from the tissue (Olinga et al. 1998a). Non-transplantable donor livers are already perfused in situ with an organ preservation solution. After collecting the liver, if slices are not prepared immediately, the liver should be stored in an organ preservation solution (Olinga et al. 1998a). A core can be made by a biopsy punch or coring tool before the liver tissue is transferred to a slicer (de Graaf et al. 2010).
Most research groups that successfully prepare and use precision-cut liver slices use the Krumdieck slicer, Vitron slicer or Leica VT1200 S microtome (Krumdieck et al. 1980; de Graaf et al. 2010; Parrish et al. 1995; Zimmermann et al. 2009). Recently, the EMS-4000 tissue slicer was introduced, which is mainly used to prepare lung slices (Khan et al. 2010a); however, others have performed pilot experiments with rat liver and they have shown that viable PCLS can be prepared (M.H. De Jager and G.M.M. Groothuis, unpublished data). The slice buffer should preferably be Krebs–Henseleit buffer at pH 7.42, carbogenated (95 % O2, 5 % CO2) and kept at 4 °C (de Graaf et al. 2010). The slice buffer is supplemented with 25 mM glucose, which seems to be essential for the viability of the slices (Olinga et al. 1997). The optimal thickness of PCLS is between 250 and 100 μm (de Graaf et al. 2006; Olinga et al. 1993). If necessary (human), PCLS can be stored up to 18 h in an organ preservation solution, without losing their metabolic capacity (Olinga et al. 1998b).
5.3.1 Incubation of PCLS
Over the years, various incubation systems have been described for liver slices (de Graaf et al. 2007a, 2010; Olinga et al. 1997; van Midwoud et al. 2011a). Successful incubation systems are based on optimal penetration of nutrients and oxygen into the PCLS. The most widely employed systems are the multi-well-plate incubation system (de Graaf et al. 2010; Elferink et al. 2011; Olinga et al. 1997, 2008) and the dynamic organ culture system (Vickers et al. 2011; Brendel et al. 1990; Klassen et al. 2008; Schaffert et al. 2010). Both systems utilize a gas phase with high oxygen concentrations, i.e. up to 95 % oxygen and 5 % CO2. It is essential for the multi-well-plate incubation system that the plates are not incubated under static conditions but should be shaken during culture, otherwise the viability of the PCLS will deteriorate dramatically (de Graaf et al. 2010; Olinga et al. 1997). Long-term culture of PCLS, i.e. incubations longer than 72 h, is mostly performed in the dynamic organ culture system (Vickers et al. 2011, 2004), in which the PCLS are intermittently exposed to the gas and medium phase (Brendel et al. 1990). Recently, a microfluidic system for PCLS was developed (van Midwoud et al. 2010b). In this system, PCLS are continuously perifused to keep the incubation environment stable over time (van Midwoud et al. 2010b, 2011a, b, c, d). Until now, the maximum incubation period of PCLS has been 96 h (Klassen et al. 2008; Vickers et al. 2004).
5.3.2 Viability of PCLS
Different methods are applied to assess the viability of the PCLS during culture. The leakage of (liver) enzymes [e.g. aspartate aminotransferase (AST) or lactate dehydrogenase (LDH)], the ATP content or grading the histomorphology of the PCLS are used in different studies (Fisher et al. 2001). It is generally recognized that histomorphological evaluation is a very sensitive general viability marker. Histomorphological evaluation is, however, very work intensive and necessitates highly trained personnel that have to interpret and grade the morphology of the PCLS. ATP content of tissue slices appears to correlate well with morphology (de Graaf et al. 2007a); therefore, this method is used by many different laboratories (de Graaf et al. 2010; Vickers et al. 2004; van de Bovenkamp et al. 2008).
5.3.3 Drug metabolism in PCLS
Previously, PCLS were mainly used for drug metabolism and toxicity studies (Worboys et al. 1997). Distribution, metabolism and transport of drugs were established and validated in PCLS. Olinga et al. (1993) showed that in human PCLS, all hepatocytes in the slice had an equal rate of metabolism of lidocaine. Others have shown that the rate of drug metabolism per hepatocyte present in the slice was impaired in rat liver slices (Worboys et al. 1997). However, de Graaf et al. (2006) showed in rat PCLS, that this decreased drug metabolism rate per hepatocyte is due to limited permeation into the PCLS of high clearance compounds. By using slices of 100 µm thickness, this can be circumvented and metabolic clearance of drugs is equal to that found in freshly isolated hepatocytes.
In the pharmaceutical industry, in vitro metabolite profiling is of utmost importance to correctly predict the metabolites found in human in vivo and select the animal species with preferably a similar metabolite profile to that measured in human cryopreserved hepatocytes or human PCLS (de Graaf et al. 2007a). As there are no commercially available cryopreserved (human) liver slices, only fresh (human) liver slices can be used for metabolite profiling studies. Results on cryopreservation of liver slices are promising; however, the method is not yet commercialized (de Graaf et al. 2007b; Kasper et al. 2011). Phase I and II metabolism is retained in (human) liver slices and liver slices better predicted in vivo metabolite profiles than microsomes or cell lines (de Graaf et al. 2007b). A microfluidic system for PCLS allows online measurement of metabolites (van Midwoud et al. 2011a). This system better mimics the in vivo (flow) conditions than the dynamic organ culture or multi-well-plate incubation system, and, together with the possibility to sequentially perfuse several chambers with slices from different tissues, it has great potential in drug metabolism and toxicology studies (van Midwoud et al. 2010a, b, 2011a, b, c).
The decline in the metabolic capacity during culture of (human) hepatocytes is well known (Martin et al. 2002). Different groups have shown that the metabolic capacity is better preserved in (human) liver slices (Elferink et al. 2011; Olinga et al. 1997; Martin et al. 2002) compared to (human) hepatocytes. However, others have shown that drug metabolism in liver slices is impaired after 24 h of culture (de Graaf et al. 2007a; Wright et al. 1996; Boess et al. 2003). Phase I and II metabolism enzyme expression and activity in tissue slices tend to decrease upon culturing (de Graaf et al. 2007a), partly because of the loss of endogenous or exogenous inductive stimuli, thus future studies using liver slices could prevent the deterioration of metabolic capacity in PCLS by adding natural growth factors and hormones to the culture medium.
5.3.4 Drug transport in PCLS
In drug discovery, in addition to phase I and II drug metabolism, phase III transporter function has gained importance and more intensive scrutiny. PCLS have been used to study regulation and function of these transporters in (human) PCLS (Olinga et al. 2001, 2008; Worboys et al. 1997). In isolated and cultured hepatocytes, drug transporters are strongly downregulated during culturing (Borlak and Klutcka 2004). By contrast, in liver slices, the expression of drug transporter is retained during culture (Elferink et al. 2004, 2011; Jung et al. 2007) and is regulated by lipopolysaccharide, cytokines and bile salts (Elferink et al. 2004; Jung et al. 2007; Khan et al. 2009a, b, 2010b, 2011). PCLS with a thickness of 250 μm were incubated with the lipophilic compound rhodamine B or 3H2O (Worboys et al. 1997; Olinga et al. 2001) and these compounds reached all layers of the slice within 5 min, demonstrating that compounds can reach the inner cell layers within minutes. In addition, even a large molecule like modified albumin (72 kDa) is taken up by slices and can reach the inner cell layers (Olinga et al. 2001). In PCLS, all cell types are present in their normal physiological environment (Lerche-Langrand and Toutain 2000) and studies in PCLS accurately predict the distribution and uptake of drug-targeting preparations into specific liver cell types in vivo (Hagens et al. 2006; Melgert et al. 2000, 2001; Proost et al. 2006; Gonzalo et al. 2007). In addition, these studies also revealed that, besides hepatocytes, other liver cell types, Kupffer cells, endothelial cells and stellate cells, are viable in PCLS.
5.3.5 Drug-induced toxicity and liver disease using PCLS
Since drug-induced toxicity often is a multicellular phenomenon, PCLS seem an ideal in vitro system to investigate toxicity of drugs. Particularly the Kupffer cells have a central function in hepatotoxicity (Roberts et al. 2007). When drug-induced toxicity gene expression patterns from in vivo rat liver, rat liver slices and different isolated and cultured cells were compared, liver slices were most comparable to intact rat liver (Boess et al. 2003). Microarray analysis of toxic compounds in PCLS correctly predicted hepatotoxicity as found in vivo and could discriminate between different mechanisms of toxicity (Elferink et al. 2008). Toxicity studies in PCLS have been reviewed extensively (de Graaf et al. 2007a, 2010; Olinga et al. 1997; Vickers and Fisher 2004, 2005), and lately, an additional number of papers have been published on PCLS in drug-induced toxicity (Baverel et al. 2011; Lemaire et al. 2011; Ly and Brock 2011; Schaffert et al. 2010; Vickers 2009; Yue et al. 2009). Recently human and mouse PCLS were used to investigate the mechanism of idiosyncratic drug-induced liver injury (iDILI) by co-incubating PCLS with LPS and drugs known to induce iDILI. Species differences were observed in the patterns of cytokine production by LPS and the synergistic effects with the iDILI drugs (Hadi et al. 2012, 2013). Recently, PCLS have also been used in studying liver diseases, e.g. fibrosis (Klassen et al. 2008; van de Bovenkamp et al. 2006, 2008; Guyot et al. 2010) and HCV infection (Lagaye et al. 2012). The mechanism of these diseases can only be investigated in vitro in a system that mimics the multicellular milieu of the liver in vivo.
5.4 Isolated human hepatocytes


The isolation of primary human hepatocytes was performed for the first time more than 40 years ago (Bojar et al. 1976; Strom et al. 1982; Guguen-Guillouzo et al. 1982; Reese and Byard 1981). The introduction of the two-step isolation procedure using collagenase by Seglen (1976) signified an important progress in primary liver cell isolation. This procedure has been the basis of many isolation protocols that have since been published (Dorko et al. 1994; Strom et al. 1982, 2005; Knobeloch et al. 2012; Gerlach et al. 1994). The continuous increase in the demand for liver cells for various applications, such as drug development, safety issues, discovery of new biochemical pathways in liver diseases or for temporary liver support, requires the need for a continuously updated detailed isolation protocol. However, the isolation of human primary liver cells requires extensive experience, the establishment of a detailed network between surgeons and the researchers, who isolate the cells as well as the compliance to ethical rules. Detailed protocols for the isolation of human, rat and mouse hepatocytes are described in the “Appendix 1.” The present protocol for isolating human hepatocytes is the result of the past 25 years of research, which is currently used in national and international research networks. Here, the handling of primary liver cells after isolation is described and as well as possible pitfalls and limitations of hepatocytes isolated from either liver resections or tissues rejected for liver transplantation.
5.4.1 Shipping of isolated hepatocytes
The availability of human tissue is unpredictable, and hepatocyte isolation is a complicated procedure that can only be performed in special centers with experienced staff (Pless et al. 2012). When isolating more cells than are immediately needed, primary human hepatocytes can be provided to other laboratories, either by shipping plated cells or by sending them in cold-stored cell suspensions. However, this method requires adequate storage conditions and transport strategies. In addition to these two forms of shipping, cryopreserved primary hepatocytes are also a possibility to preserve cells for longer periods. Furthermore, cryopreservation has the advantage that the cells can be used, whenever they are needed. Recent developments in the methods of cryopreservation are described in section “Further improvement of cryopreservation techniques.” Cold storage and sending of the cells in suspension is a fast and low-priced method of shipment. The main problem with this procedure is cellular damage due to hypothermia. Storage at 4 °C slows down the energy metabolism of the cells and is associated with a time-dependent linear decrease in the intracellular ATP levels (Berendsen et al. 2011). As a result, the inhibition of energy-dependent Ca2+ pumps may lead to an increase in cytosolic Ca2+, which, in turn, leads to damage and even dysfunction of the cytoskeleton, e.g. aggregation of actin filaments. In early stages of hypothermia (up to 24 h of cold storage), alterations are reversible. By contrast, a longer duration of cold storage (>24 h) causes irreversible alterations in the cytoskeleton, which are closely connected to a loss of function and membrane integrity (Stefanovich et al. 1995). In addition, the classical view of hypothermia describes an inhibition of Na+/K+-ATPase, which leads to a pronounced cellular sodium accumulation, accompanied by an accumulation of chloride, which causes osmotic effects leading to cell swelling and finally to cell death (Hochachka 1986). For this reason, cold storage solutions often contain low concentrations of Na+ and Cl− ions. While this seems to be beneficial for rat hepatocytes, a significant decrease in damage of human hepatocytes could be observed in chloride-rich storage solutions (Pless et al. 2012). Cell swelling and the formation of so-called blebs are often observed under hypothermic conditions, and several groups investigated stabilizing agents in order to reduce damage and improve the integrity of cell membranes (Stefanovich et al. 1995; Kim and Southard 1999). Furthermore, cold storage leads to an increase in the intracellular chelatable iron pool in several cell types followed by the formation of ROS (Pless et al. 2012). Oxidative stress has been ascribed a significant role in cellular damage because it alters the functional properties of cell membranes through lipid peroxidation (Vara et al. 1995; Meng 2003). Therefore, recent preservation solution development has focused on a few critical topics including the maintenance of ionic and osmotic balance, the prevention of cell swelling and blebbing, the control of free radical formation and the development of serum-free media (Ostrowska et al. 2009). Consequently, cold storage solutions containing antioxidants, iron chelators and/or membrane stabilizers have been developed to protect cells from such damages (Meng 2003; Pless et al. 2012).
A classical organ storage solution, namely the University of Wisconsin solution (UW), is insufficient for storage of cell suspensions in some laboratories (unpublished data); although others have reported better success using this solution (Sandker et al. 1993; Olinga et al. 1998a). Certain workgroups have developed or refined cold storage solutions in order to optimize them for the demands of primary human hepatocytes. The cold storage solution from hepacult GmbH (Regensburg, Germany) has been successfully used such that transport with a loss of approximately 20 % of cell viability was possible up to 24 h (A. Nüssler, unpublished data). A proposed method for the shipment of hepatocytes using hepacult cold storage solution is described in the “Appendix 1”. Another possibility which excludes hypothermic damage and the need for an appropriate cold storage solution is the shipping of plated cells. For this purpose, cells are seeded onto cell culture plates/flasks. After an attachment period of at least 4 h in a humidified incubator at 37 °C, the cell culture plates containing adhered cells can be tightly sealed with Parafilm and sealed in an insulated box with warm packs for shipment. The cells can survive a 12-h shipping procedure without marked changes in their viability compared to classical shipment in suspension culture. This method is very convenient for the recipient, but it is much more time-consuming and costly for the cell provider. Furthermore, the cells usually arrive after 36–48 h in the collaborating laboratory, while cell suspensions arrive only one day after cell isolation.
5.4.2 Functionality and quality control of human hepatocytes
Many tests are available for assessing functionality of primary human hepatocytes. Several hepatic functions, including phase I and phase II enzyme activities, glucose metabolism and ammonia detoxification, are functional during culture for at least 48 to 72 h. However, a thorough characterization of the isolated hepatocytes is essential to ensure that functions of interest are maintained during culture. The morphology of hepatocytes in a 2D culture is characterized by a polygonal shape that is comparable to epithelial cell cultures (Knobeloch et al. 2012). The investigation of morphology in combination with albumin secretion is frequently used as proof of hepatocyte functionality. However, some studies have shown that these parameters alone do not prove the existence of other hepatocyte-specific functions, such as glucose metabolism, detoxification of ammonia and biotransformation (Beerheide et al. 2002; Hengstler et al. 2005; Sharma et al. 2005; Knobeloch et al. 2012). More details about liver cell function and applications for predicting liver toxicity are described in section “Use of in vitro systems for predicting liver toxicity.”
5.4.3 Pitfalls and limitations in the isolation of primary human hepatocytes
The effect of transport between the surgical department and the cell isolation laboratory along with the inter-individual donor tissue variability makes it difficult to predict the outcome of the isolation. However, the biggest limitation is the general scarcity of donors. Tissue quality strongly depends on pre-treatment and the lifestyle of the donors. In turn, this has a major influence on the quality of the isolated liver cells. Diseases that lead to an accumulation of bile in the liver tissue almost disqualify these specimens for hepatocyte isolation because the interaction of bile salts with the liver tissue results in highly damaged cells, which are even further damaged during the cell isolation process. In addition, the fixing of cannulae into blood vessels using tissue glue is difficult when bile is distributed all over the resected liver piece. Notably, a qualified laboratory has to have carried out a certain number of liver cell isolations in order to have sufficient experience to judge which resected liver pieces are suitable for isolating hepatocytes. This point is very important since the whole isolation process is very costly and the isolation of liver tissue that is of bad quality usually results in a low yield and low viability of the hepatocytes.
Besides the limitations that are caused by donor scarcity and tissue condition, many pitfalls have to be avoided when trying to establish primary human hepatocyte isolation. Some of these points are mentioned in the isolation procedure described in “Appendix 1”. Therefore, two other main technical issues that influence the perfusion of liver tissues are the collagenase digestion and the hepatocyte function in culture. During perfusion of the liver piece, two important steps for loosening cell–cell and cell–matrix adhesion are performed. In the first step, the perfusion of the liver piece with the EGTA-containing perfusion solution causes a depletion of Ca2+ within the tissue. As a consequence, the desmosomes, which are responsible for cell–cell connections, undergo structural changes that cause a weakening or an irreversible complete loss of cell–cell linkages, so that the desmosomes are unable to reform even when the tissue is perfused with a second perfusion solution containing high concentrations of Ca2+, which is needed for the collagenase activity (Berry et al. 1997). During step 2 of the perfusion process, cell–matrix contacts are destroyed by the digestion of ECM proteins with collagenase.
Collagenase is used to hydrolyze peptide bonds in intercellular collagen. Collagenase P (Roche, Mannheim, Germany) from Clostridium histolyticum (EC 3.424.3) was initially developed to isolate pancreatic islet cells but is also suitable for human liver tissue, especially when it is mildly fibrotic. Collagenase P is a mixture of at least 12 different enzymes, of which collagenases form the biggest group of active enzymes. Six single collagenases, which can be divided into two classes, have been detected in the crude mixture of Collagenase P (Johnson et al. 1996). Class I enzymes are more stable and have a greater activity toward insoluble collagen, whereas class II enzymes are characterized by the ability to attack a significantly higher number of smaller peptides than their class I counterparts (Kin et al. 2007). A combination of both classes of collagenases is important, but in particular, the presence of high amounts of class II collagenases represents an advantage for the isolation of hepatocytes (Johnson et al. 1996). Other enzymes playing an important role in the digestion of human liver tissue are clostripain, trypsin and neutral proteases (Williams et al. 1995). There is evidence that these enzymes act synergistically to degrade collagen (Kin et al. 2007). It was postulated that a combination of collagenase and the aforementioned enzymes digests the ECM in a sequential manner, starting with the initial degradation of matrix proteins by neutral proteases. The exposed native collagen is first digested by class I collagenases, which then enables class II collagenases to fragment the denatured protein. The resulting collagen fragments can then be further degraded by the neutral proteases (Johnson et al. 1996). Each culture of C. histolyticum has a unique composition of proteases in the final lyophilized product. It is therefore not surprising that the quality of Collagenase P and the proteolytic activity varies from batch to batch (Williams et al. 1995). Nowadays, many collagenase preparations are available for the isolation of liver cells. Before using a batch of collagenase routinely, it is necessary to test it for its ability to digest liver tissue with minimum toxicity. A decrease in the collagenase activity as well as an increase in the trypsin activity can be observed different collagenase batches used (Table S6; see ESM). Kin et al. (Kin et al. 2007) reported a decrease in collagenase activity due to filtration through membranes with a porosity of 0.22 μm in all the tested types. In contrast, the protease activity remained unaffected. It is also worth mentioning that the collagenase activity decreases throughout storage because the collagenase classes, I and II, are very susceptible to proteolysis. Even the smallest amount of hydration, such as the hydration occurring during the freeze–thaw cycles between different cell isolations, can cause a deterioration of enzyme function. Hydration causes the activation of proteases which are responsible for the degradation of the high molecular weight collagenases (Johnson et al. 1996).
Low collagenase activity and high protease/trypsin activity correlate with a decrease in isolation efficiency with regard to cell yield and cell viability (Berry et al. 1997). In general, but not invariably, the most rapid digestions and the best yields of intact cells are achieved with preparations of highly active collagenase (Berry et al. 1997). Total proteases as well as trypsin activities should be regarded as a double-edged sword: both accelerate tissue digestion but might result in a decrease in cell yield and enhance cell lysis (Kin et al. 2007). Improved cell yield and cell viability can be achieved by adding bovine serum albumin (0.5 %) or fetal calf serum to the second perfusion solution. This addition leads to a gentler digestion and offers a competing substrate (other than the liver cell membrane proteins) for proteases (Alpini et al. 1994). Ensuring that the protease/trypsin activities are low in proportion to collagenase activity gives us the possibility to use collagenase batches with a lower activity and also compensates for collagenase losses that are due to sterile filtration and/or storage. Even when a good batch is used, the subsequent deterioration of enzyme activity because of the storage requires that a significant amount of time and resources are used for batch testing and probably batch adjustment. The variability of the enzyme composition of collagenase preparations is considered to be a major obstacle to a successful tissue digestion. Therefore, several alternative sources are currently used for cell isolation. The introduction of collagenase blends (Liberase™, Roche, Mannheim, Germany) was intended to reduce lot-to-lot and even intra-lot variability. Meanwhile, various enzymes are available in a purified form or as a defined mixture, which makes it possible to create customized collagenase blends, as reported by Bhogal et al. (2011). However, at present, the application of single enzymes or the Liberase™ blends is rather expensive, and therefore, the use of Collagenase P is still preferred. No matter which collagenase is used, in the end, the reconstituted enzyme solution should be sterile filtered due to the fact that the enzymes are delivered in a non-sterile state. Furthermore, the dissolved enzyme should be warmed up to 37 °C in a water bath, as collagenase rapidly loses its activity below 37 °C. Potent inhibitors of Collagenase P are oleic and palmitic acid, which are among the main components in fatty livers (Rennert and Melzig 2002). Steatotic livers, which can be easily macroscopically recognized because of their slightly yellow tissue color, often require an extension of the duration of the second perfusion step.
Last but not least, consideration should be given to the addition of insulin when studying the fat metabolism of liver cells. The concentration of human insulin in hepatocyte culture medium has to be chosen carefully, since a high insulin concentration promotes lipid accumulation (Chan et al. 2002). In particular, in combination with a high glucose concentration—which is doubled compared to the physiologic values in Williams medium E—an elevated insulin concentration favors lipogenesis. For example, primary human hepatocytes cultured in the presence of 32 mU/ml insulin exhibit a significantly higher incorporation of fat droplets than cells that have been cultured in the presence of 50 μU/ml insulin.
5.5 Co-cultures of hepatocytes and macrophages


In this section, experimental in vitro and in vivo systems to analyze the interrelationship of macrophages and hepatocytes are described in detail. In addition, selected results using the respective experimental approaches are provided to shed light on the interaction between macrophages and hepatocytes during acute phase response, regeneration and regulation of hepatocyte metabolism.
5.5.1 Isolation of macrophages and models
One important tool to analyze the role of macrophages for the regulation of liver function and regeneration in vivo is the depletion of macrophages using either gadolinium chloride, carbonate iron overloading or liposome-encapsulated dichloromethylene diphosphonate (also termed as liposomal clodronate). Previous studies clearly indicated that macrophage depletion by liposome-encapsulated dichloromethylene diphosphonate is the most suitable method since it is a non-toxic approach, and upon intracellular release of the substance, macrophages are selectively eliminated without activation (Van Rooijen 1989; Van Rooijen and Sanders 1994). This is in contrast to macrophage depletion using, for example, gadolinium chloride, which activates macrophages to secrete biologically active substances and is considered to be retained in hepatocytes, which causes subsequent toxic effects (Takeishi et al. 1999; Rai et al. 1997). Another possibility for selective macrophage depletion is the conditional ablation of macrophages expressing the diphtheria toxin receptor under the control of a macrophage-specific promoter. This approach has been successfully used for ablation of CD11b-expressing macrophages in transgenic mice that express the diphtheria toxin receptor under control of the CD11b promoter. In these mice, application of diphtheria toxin resulted in an efficient depletion of monocytes from the circulation and of macrophages from the ovary and the kidney. However, this approach did not allow efficient elimination of sessile macrophages from the liver and the lung, indicating that CD11b is not expressed by the major part of macrophages resident in the lung or the liver (Cailhier et al. 2005). Another more recently published approach to render monocytes/macrophages sensitive to diphtheria toxin is the Cre-mediated excision of a transcriptional STOP cassette from the simian diphtheria toxin receptor gene in transgenic mice expressing the Cre recombinase under control of the lysozyme M promoter. This approach also allows an efficient toxin-mediated ablation of macrophages from the liver (Goren et al. 2009) and therefore appears to be more suitable to assess the role of sessile macrophages in the liver.
Several procedures have been described on how to prepare macrophages from liver tissue for the analysis of macrophage-derived communication signals and the interaction of macrophages with hepatocytes in vitro. Most of these protocols are based on macrophage separation by a single density gradient centrifugation after dissociation of the liver cells by sequential collagenase/pronase-mediated digestion (Olynyk and Clarke 1998; Van Bossuyt and Wisser 1988). Liver macrophages are purified from other NPCs by counter-flow centrifugal elutriation (Zahlten et al. 1978; Eyhorn et al. 1988), by the use of FACS-based cell sorting (He et al. 2009) or by cell purification using magnetic bead–conjugated antibodies directed toward surface antigens specific for tissue macrophages. In all cases, macrophages are allowed to settle for approximately 24–48 h in order to allow recovery from isolation procedure stress-associated responses. Another recently published method is the propagation of macrophage-like cells by mixed primary cultures of liver cells using a parenchymal hepatocyte-enriched fraction after detachment of the liver cells by sequential digestion (Kitani et al. 2010).
The macrophages isolated from the liver by the different procedures form the basis for several experimental approaches that have been used to study the impact of liver macrophages on hepatocyte function and vice versa. This includes the use of supernatant transfer experiments employing conditioned media (Keller et al. 1985a; Mackiewicz et al. 1988), direct co-culture models of isolated liver macrophages with primary hepatocytes (Keller et al. 1985a, b; Mackiewicz et al. 1988; West et al. 1985, 1986) or 3D tissue models where liver macrophages and hepatocytes are separated by a respective matrix such as a collagen layer (Bader et al. 1996; Yagi et al. 1998). Additionally, a two-chamber system separated by a membrane with <0.4-μm pore size, which allows the exchange of soluble mediators—but not cells—migrating from one compartment into the other, can be used to separately analyze gene expression and functional changes in liver macrophages and hepatocytes during co-culture (unpublished data). Moreover, variants of the Boyden chamber, either as systems composed of two chambers separated by a membrane that permits cell migration or as single-chamber assays such as the checkerboard assay (Laskin et al. 1986), in turn represent experimental systems that allow the analysis of the impact of hepatocytes or hepatocyte-conditioned media on chemotactic activity and cell migration of other non-parenchymal or immune-competent cells (Schwabe et al. 2003; Seki et al. 2009; Sawitza et al. 2009). Furthermore, using a micropatterning technique, a co-culture technique has been recently described that allows controlling the relative proximity of one cell type to another (Zinchenko et al. 2006; Zinchenko and Coger 2005). Although all these different models are per se artificial and therefore debatable with respect to their physiological relevance, they are useful tools to get an impression of cellular interactions in the liver. Nevertheless, a point which has to be considered is an appropriate ratio of the different cell types within the liver under respective conditions to keep as close as possible, e.g. physiological conditions, where the ratio of hepatocytes to liver macrophages is about 6–1 (Kuiper et al. 1994).
A major drawback of experimental models employing isolated liver macrophages is the digestion procedure required to detach macrophages from liver tissue, since this is associated with an enhanced generation of damage-associated molecular patterns (DAMP) originating from tissue disintegration, which may provoke DAMP-induced activation of respective macrophages (Chen and Nunez 2010). Moreover, cleavage products or possible contaminations (e.g. lipopolysaccharide) of the enzyme preparations used may also affect the activation state and the differentiation of the isolated liver macrophage population, an aspect which most likely is not sufficiently redressed during a respective recovery period. This pre-activation of the generated population of so-termed liver macrophages makes it difficult to ascribe specific features of isolated liver macrophages to a liver-specific phenotype or to a defined activation state elicited during the preparation procedure. Therefore, it may be also reasonable to use macrophages prepared by a procedure that keeps activation artefacts as low as possible (e.g. usage of bone marrow-derived macrophages), to analyze the reciprocal interrelationship between macrophages and hepatocytes. Another advantage of this approach would be the fact that the macrophage population employed is well characterized and highly standardized.
5.5.2 Interaction between hepatocytes and macrophages during the acute phase response and septic liver injury
Hepatocytes are the major source of serum constituents upregulated during an inflammatory response of the organism toward different challenges such as infection, tissue injury or inflammation. This response of the organism is also termed as the acute phase response (Bode and Heinrich 2001; Gabay and Kushner 1999). Notably, while production of the so-called positive acute phase reactants is upregulated during a systemic inflammatory response, the synthesis of other proteins such as albumin or hepatic CYPs, also termed as negative acute phase proteins, is substantially depressed (Powanda et al. 1972; Shedlofsky et al. 1994; Monshouwer and Witkamp 2000; Milosevic et al. 1999). This results in a net suppression of the overall protein synthesis of hepatocytes during inflammation, as indicated from in vivo and in vitro experiments (Mackiewicz et al. 1988; Keller et al. 1985c; Gabay and Kushner 1999). Depending on the eliciting stimulus, the pattern of acute phase proteins produced from hepatocytes during the acute phase response varies considerably and, among others, comprises important constituents of the systemic innate host response toward pathogens, including secreted pathogen recognition receptors (PRR) or complement components, as well as protease inhibitors or proteins involved in the iron metabolism or components of the coagulation system (Gabay and Kushner 1999; Bode et al. 2011). Although several important factors and pathways that control the hepatic acute phase response have been characterized, the complex interplay of the different mediators and the respective cell types that control the inflammatory response of the hepatocyte during the systemic response toward an invading pathogen, such as Gram-negative bacteria, is far from being understood. Likewise, the regulatory relevance of the particular acute phase reactants and their influence on the inflammatory response is largely unclear. Depletion experiments suggest that in the context of lipopolysaccharide, the major immune-stimulatory bacterial wall component of Gram-negative bacteria, macrophages are key regulators of the inflammatory response of the hepatocyte in vivo since upon macrophage-ablation hepatocytes do not respond toward a challenge with lipopolysaccharide (Seki et al. 2007). Consistently, in vivo experiments indicate that depletion of liver macrophages impairs the lipopolysaccharide-induced acute phase response in rats after partial hepatectomy (Prins et al. 2004) and suggest that the NPC fraction is the major source of inflammatory cytokines such as IL-6 driving the acute phase protein production in hepatocytes (Billiar et al. 1992).
According to the in vivo observations, it is long known from co-culture and supernatant transfer experiments that bacterial products such as lipopolysaccharide mediate their overall effects on hepatocyte protein synthesis through the induction of the release of heat labile-soluble mediators and not via induction of oxidative burst or the release of proteases (West et al. 1985; Keller et al. 1985a, b, c). Consistently, lipopolysaccharide had no effect on the protein synthesis of isolated hepatocytes cultured in the absence of liver macrophages, while the protein pattern synthesized from hepatocytes experienced dramatic changes if lipopolysaccharide was applied in the presence of liver macrophages (West et al. 1988). This effect of macrophages on hepatocyte protein synthesis was largely neutralized by glucocorticoids (Keller et al. 1986) and has been suggested to depend on l-arginine (Billiar et al. 1989). While IL-1 was not able to mimic the modulatory effect of lipopolysaccharide on the protein synthesis of hepatocytes co-cultured with liver macrophages (West et al. 1988), IL-2 was able to prime and activate liver macrophages to negatively affect hepatocyte protein synthesis in vitro (Curran et al. 1988). Furthermore during co-culture, pre-incubation with IL-6, but not with TNFα, prior to lipopolysaccharide was able to enhance the impact of macrophages on hepatocyte mitochondrial dysfunction and depression of albumin synthesis (Bankey et al. 1994). The latter observation suggests that IL-6 but not TNFα-induced hepatocyte products enhance liver macrophage-signaled hepatocyte dysfunction following a second, inflammatory insult. Further studies identified TNFα and IL-1β as important mediators, which are responsible for the suppressive effects of lipopolysaccharide-activated macrophages on CYP protein expression in co-cultured hepatocytes (Milosevic et al. 1999; Wu et al. 2006). Thereby, conditions that permit direct cell–cell contact of hepatocytes and macrophages augmented the depression of hepatocyte biotransformation capacity and resulted in a substantial enhancement of NO production, as well as TNFα and IL-6 release (Hoebe et al. 2001). This enhancing effect of hepatocytes on lipopolysaccharide-induced cytokine production by liver macrophages requires the functional lipopolysaccharide receptors TLR4 and CD14 expressed by macrophages and involves lipopolysaccharide-binding protein (LBP) as a critical hepatocyte-derived factor (Scott et al. 2005). Apart from cytokine production, co-culture with hepatocytes also modulates lipopolysaccharide-induced prostaglandin production from liver macrophages (Billiar et al. 1990b; Lysz et al. 1990) and TNF dependently results in an enhanced NO production in response to lipopolysaccharide (Billiar et al. 1990a) which in turn mediates mitochondrial dysfunction, oxidative DNA alterations and lethal hepatocyte injury (Kurose et al. 1996; Watanabe et al. 2001). Notably, the toxic effect of TNFα derived from liver macrophages on co-cultured hepatocytes further involves activation of Caspase 3 (Hamada et al. 1999). This hepatotoxicity of lipopolysaccharide -activated liver macrophages is synergistically enhanced by granulocytes in a way that requires direct cell–cell contact, cell adhesion and serine protease activity (Sauer et al. 1996). It should be emphasized that the lipopolysaccharide-induced depression of protein synthesis, CYP expression and the enhanced production of inflammatory cytokines such as TNFα requires an experimental setting that permits tight and direct cell/cell interaction of macrophages, granulocytes and hepatocytes (Wu et al. 2006; Hoebe et al. 2001; Sauer et al. 1996). Conversely, co-culture of macrophages and hepatocytes results in a suppression of lipopolysaccharide-induced TNFα production and in an enhanced production of IFNβ and the anti-inflammatory cytokine IL-10 if an experimental setting is chosen that enables an intercellular exchange of mediators but does not allow a tight cell/cell contact of macrophages and hepatocytes (Keitel et al. 2008a). These data suggest an inter-cellular feedback loop (Fig. 11) that enables hepatocytes to influence macrophage activation by soluble mediators or a mediator pattern, which still have to be identified. In this context, it is interesting to note that for example bile acids represent such a hepatocyte-derived anti-inflammatory signal suppressing lipopolysaccharide-induced inflammatory cytokine release in macrophages (Keitel et al. 2008a).

The influence of macrophage activation on hepatocyte function during lipopolysaccharide (LPS)-induced inflammation depends on the ability of direct cell–cell interaction. Co-culture experiments suggest that the distance between macrophages and hepatocytes and the possibility of direct cell–cell contacts plays an important role for the impact of activated macrophages on hepatocytes during lipopolysaccharide-induced inflammation. Moreover, the data suggest that hepatocyte-derived factors such as the acute phase protein, lipopolysaccharide-binding protein (LBP), is a strong feedback modulator of the inter-cellular communication, since it is produced by hepatocytes in response to cytokines derived from activated macrophages and further enhances macrophage activation. B contrast, co-culture conditions that allow exchange of soluble mediators but no direct cell–cell contact (as is the case under normal conditions with macrophages and hepatocytes which are separated by sinusoidal endothelial cells and the space of Dissé) result in a suppression of the inflammatory macrophage response toward lipopolysaccharide with reduced release of TNFα and upregulation of the production of IFNβ and the anti-inflammatory cytokine IL-10
Apart from their impact on hepatocyte protein synthesis, acute phase protein production and cellular viability, results from co-culture models further suggest that lipopolysaccharide-activated liver macrophages IL-6 dependently suppress the biosynthesis of insulin-like growth factor (IGF)1 (Priego et al. 2006; Lelbach et al. 2001) and impede the intercellular communication of hepatocytes during inflammation (Gonzalez et al. 2002). Moreover, macrophage-derived prostaglandins have been demonstrated to increase hepatic glycogenolysis by various stimuli including endotoxin, immune complexes and anaphylotoxin C3a involving prostaglandin receptors coupled to phospholipase C (Casteleijn et al. 1988).
5.5.3 Intercellular feedback loops of hepatocytes and macrophages in the regulation of liver regeneration and hepatocyte function
As outlined above, sufficient evidence from in vivo and in vitro experiments indicates that activated macrophages and macrophage-derived products are major mediators of inflammatory hepatocyte injury, as well as altered hepatocyte protein synthesis and depression of hepatocyte biotransformation capacity during inflammatory conditions. However, there is also evidence indicating that under healthy conditions, a controlled interaction between liver macrophages and hepatocytes is also required for sufficient hepatocyte function. Thereby the data available suggest that the distance between macrophages and hepatocytes and the possibility of direct cell–cell contacts plays an important role for the impact of activated macrophages on hepatocytes. Thus, the studies discussed above suggest that lipopolysaccharide-activated macrophages are particularly harmful to hepatocytes under conditions, which enable a direct cell–cell contact (Wu et al. 2006; Hoebe et al. 2001; Sauer et al. 1996), whereas conditions that do not favor a direct cell–cell contact but permit an intercellular communication via soluble mediators rather mediate “deescalating” and hepatoprotective effects (Petrasek et al. 2011). Micropatterned co-cultures that allow the control of the relative proximity of one cell type to another have consistently demonstrated that under defined conditions, liver macrophages significantly improve hepatocyte function (Zinchenko et al. 2006). Hence, it is well conceivable that under physiological conditions, where the sinusoidal endothelial cell layer and the space of Dissé separate liver macrophages and hepatocytes from each other, liver macrophages release signals and maintain auto-regulatory feedback loops that play an important role for optimal hepatocyte functionality. The nature of these signals and feedback loops is largely unknown and remains to be elucidated. In this context, it is interesting to note that several in vivo studies suggest that liver macrophages not only play a role for maintenance of hepatocyte functionality but are also important for undisturbed liver regeneration (Selzner et al. 2003; Bode 2011; Abshagen et al. 2007, 2008; Meijer et al. 2000) and for recovery from inflammatory liver injury and scarring (Duffield et al. 2005; Fallowfield et al. 2007).
The regenerative process of the liver is controlled by a variety of different growth hormones and cytokines, which, apart from growth hormones, hepatocyte growth factor (HGF) and EGF, also includes insulin-like growth factor (IGF) and respective IGF-binding proteins (IGFBPs). Both IGF-1 and the different IGFBPs are rapidly upregulated during liver regeneration (Mohn et al. 1991) and are considered to play a role for liver regeneration (Desbois-Mouthon et al. 2006; Leu et al. 2003). The production of IGF-1 and of IGFBP-1 to IGFBP-4 mainly occurs in the liver and involves hepatic NPCs, as well as hepatocytes and is controlled by a yet incompletely understood inter-cellular feedback loop (Fig. S1; see ESM). Thereby, particularly liver macrophages are considered to be the major source of IGFBP-3 (Villafuerte et al. 1994), the major binding protein for circulating IGF forming a ternary binding complex comprising IGF, IGFBP and the acid-labile subunit (ALS). While IGFBP-3 is mainly synthesized by liver macrophages, IGFBP-1, IGFBP-2 and IGFBP-4, as well as the acid-labile subunit, are mainly produced by hepatocytes (Scharf et al. 1996). Interestingly, the stability of liver macrophages to express IGFBP-3 is enhanced upon co-culture with hepatocytes, and the expression of IGFBP-3 could be stimulated by insulin and IGF-1, but not by growth hormones. However, the stimulating effects of insulin and IGF-1 on IGFBP-3 expression in liver macrophages essentially require the presence of hepatocytes indicating that upon stimulation with insulin or IGF-1, hepatocytes release a soluble mediator that controls IGFBP-3 expression in liver macrophages (Villafuerte et al. 1994; Scharf et al. 1996). The expression or the action of this soluble mediator as well as the expression of ALS appears to be negatively controlled by cAMP, since treatment of co-cultures of hepatocytes and liver macrophages with cAMP analogues impedes the formation of the 150-kDa complex through downregulation of IGFBP-3 and ALS. Conversely, the biosynthesis of IGF-1, IGFBP-1, and IGFBP-4 in hepatocytes is upregulated upon stimulation of hepatocytes co-cultured with liver macrophages with cAMP analogues, which enables an enhanced formation of binary IGF/IGFBP complexes (Scharf et al. 2001). Another factor which appears to be involved in the differential control of the expression of IGF-1 and IGFBP-1,IGFBP-3 and IGFBP-4 in co-cultures of hepatocytes and macrophages is IL-6, since it enhances expression of IGFBP-1 and IGFBP--4 in hepatocytes as well as of IGFBP-3 in liver macrophages while it suppresses the expression of IGF-1 (Lelbach et al. 2001).
Apart from their relevance for regulation of IGF and IGFBP production, co-culture experiments further revealed that the intercellular cross talk between hepatocytes and macrophages also plays a role for other processes. Co-culture experiments were used to demonstrate that treatment with glucagon causes an auto-regulatory feedback loop that involves the production of prostaglandins by liver macrophages, followed by prostaglandin-mediated inhibition of the glucagon-stimulated glycogenolysis in hepatocytes (Hespeling et al. 1995). Moreover, the production of cysteinyl leukotriens essentially requires cooperation between liver macrophages and hepatocytes since upon stimulation liver macrophages are not able to produce these factors unless they are co-cultured with hepatocytes or supplemented with LTC4 synthase (Fukai et al. 1996).
5.6 3D liver models


Cells in vivo are 3D in both their morphology and organization. Dedifferentiation of hepatocytes in a 2D cell culture (monolayer culture) is well established and goes along with a reduction in major liver functions, including detoxification due to downregulation of phase I and II enzymes or production of plasma proteins such as albumin (Bissell et al. 1987; Clayton and Darnell 1983; Godoy et al. 2009; Clayton et al. 1985; Koide et al. 1989; Tong et al. 1992). This is particularly relevant to hepatocytes, which are polygonal in shape and are multi-polarized to present at least two basolateral and two apical surfaces (Braiterman and Hubbard 2009). Maintaining liver parenchymal function ex vivo is especially important as there is need for fully functional hepatocytes (Bissell et al. 1987) to generate stable systems for toxicology screenings (Clayton and Darnell 1983), to expand primary hepatocytes for transplantation into patients, (Tateno and Yoshizato 1996) or to establish bioartificial liver devices. First steps toward stabilization and maintenance of hepatocyte function included supplementation of culture media with cytokines and other chemicals. Improvement of hepatocyte stability was achieved using, e.g. DMSO or nicotinamide (Tateno and Yoshizato 1996; Inoue et al. 1989; Isom et al. 1985; Baribault and Marceau 1986). Combinations of growth factors and chemicals were also tested to optimizing culture conditions further (Kost and Michalopoulos 1991). Another focus of research to maintain parenchymal function was put on the ECM. Matrix proteins not only allow anchorage of hepatocytes but also induce intracellular signaling pathways, thereby enabling sensing of the extracellular milieu with subsequent cellular adaptation to the environment. The complex 3D interaction involving NPCs and the ECM is believed to be crucial in regulating and maintaining hepatic function in vivo (Koide et al. 1989; Landry et al. 1985; Wu et al. 1999). For example, hepatocytes express a distinct set of transporter proteins on their sinusoidal, basolateral and apical (canalicular) membrane which is lost in cultures which do not maintain cell polarization (Berthiaume et al. 1996). Traditionally, in vitro hepatocyte models have been far removed from the complex 3D in vivo environment. Most hepatocyte models in the past have been based on 2D monolayer cultures using surfaces pre-treated with ECM proteins such as collagen, biomatrices, proteoglycan derivates, soft collagen and Matrigel (Rojkind et al. 1980; Spray et al. 1987; Michalopoulos et al. 1976; Mitaka 1998). While these models have proved invaluable in advancing basic liver biology in both a practical and cost-effective way, they are unable to fully replicate and maintain convincing hepatocyte function in vitro (Berthiaume et al. 1996). The 2D substrate forces adherent cells like hepatocytes to alter their cytoskeleton toward a flattened morphology. This change in cell shape and form limits cell–cell and cell–matrix interactions that consequently leads to reduced polarization, reduced bile canaliculi formation and a loss of important signaling pathways necessary for normal hepatocyte function. Unsurprisingly, hepatocytes from primary sources cultured in vitro remain viable for only a few days and rapidly deviate from their differentiated phenotype (Gomez-Lechón et al. 1998). As the need for more predictive hepatocyte models is increasing, especially in routine drug toxicity screening, there now exists strong demand for technologies that enable 3D hepatocyte culture. Models which are amenable to routine use and high-throughput adaptation are particularly desirable in the context of industrial drug discovery. While cells in the body are embedded and oriented in a complex 3D network, continuously supplied with oxygen and nutrients, in vitro cell models require certain compromises. Careful evaluation of the model is required to explore its biological and technical possibilities and limitations. A number of techniques are currently employed to maintain a 3D configuration of cells in vitro (Pampaloni et al. 2009; Nahmias et al. 2007; Ijima 2010) which are also applied for hepatocyte cultures. So far, the most common technology in use is the 2D sandwich culture whereby hepatocytes are placed between layers composed of ECM components (Dunn et al. 1991). Although not a definitive 3D organization, sandwich systems have been shown to promote polygonal hepatocyte morphology for extended culture periods and to maintain their functionality better than in monolayer cultures (Dunn et al. 1989, 1991). In this type of model, cell–matrix adhesion from above and below reduces cytoskeletal flattening and maintains cell–cell contact between adjacent hepatocytes. Results have shown that sandwich cultures with matrix proteins can lead to prolonged hepatocyte viability (Dunn et al. 1991), extended CYP activity (Kern et al. 1997) and increased cell polarization toward more advanced bile canaliculi networks (LeCluyse et al. 1994). Three techniques for placing cells into 3D culture are described below, namely hydrogels, synthetic scaffolds and hepatospheres.
5.7 Hydrogel 3D scaffolds
Spheroids can be produced by embedding hepatocytes in non-adhesive hydrogels (Ringel et al. 2005; Koebe et al. 1994). One of the first commercially available hydrogels onto the market was Matrigel™ (BD Biosciences), which is based on an ECM extracted from a mouse sarcoma (Kleinman et al. 1986). Although designed as a generic hydrogel, Matrigel™ has been shown to prolong aspects of hepatocyte function beyond those observed in collagen sandwich cultures (Moghe et al. 1997). Extracel™ (glycosan biosystems) is another commercial hydrogel based on collagen (Ranucci et al. 2000) which has been shown to prolong in vitro hepatocyte CYP activity for up to 17 days (Prestwich et al. 2007). However, hydrogels present issues associated with poor mass transfer of nutrients and xenobiotics, as well as making cell retrieval more difficult. Algimatrix™ (Invitrogen) is a porous 3D scaffold based on an alginate sponge (Rowley et al. 1999) which, although it is not representative of the mammalian ECM environment, is able to be marketed as an animal-free scaffold for in vitro 3D cell culture and this can be considered advantageous for reasons discussed later. Within Algimatrix™, cells typically display limited interaction with the scaffold and so aggregate into individual spherical masses that occupy the volume of the scaffold voids. Results have demonstrated that primary rat hepatocytes maintain a higher level of albumin synthesis throughout their culture period when grown on Aligmatrix™ compared to collagen-coated 2D substrates (Glicklis et al. 2000). However, growing hepatocytes as individual spheroids is non-representative of their hepatic organization and presents technical difficulties related to controlled growth, for example during the setup of co-cultures with non-parenchymal liver cells. Furthermore, the issue of limited mass transfer, as seen with hydrogels, applies to spheroid-based systems also and can easily lead to oxygen starvation in central regions and areas of cell necrosis. Gels of self-assembling peptide nanofibers are gaining much attention as they are thought to mimic the architecture of fibrils in the ECM (Zhang et al. 2005). Targeted peptides resembling a specific ECM can be engineered to form inter-weaving fibers to which cells can attach and interact in a similar manner to in vivo. PuraMatrix™ (BD Biosciences) is a commercially available peptide hydrogel that has been shown to induce the differentiation of putative rat liver progenitor cells into mature hepatocyte-like cells exhibiting upregulated albumin and CYP activity (Semino et al. 2003). However, the relatively poor mechanical strength of these scaffolds makes tissue processing problematic. Furthermore, engineering-specific peptide nanofibers on a large scale is expensive compared to simpler scaffold systems. Two novel approaches to 3D culture, namely hepatospheres and scaffolds, are described in detail below.
Recently, HGF/heparin-immobilized collagen scaffolds were evaluated as an artificial ECM for hepatocyte culture (Hou et al. 2010). Since HGF has a high affinity for heparin, and binds to hepatocytes and extracellular space of the liver through heparin-like molecules (Kato et al. 1994), the 3D HGF/heparin-immobilized collagen scaffolds exhibited albumin synthesis up to 30 μg/well/day. The albumin synthesis by hepatocytes was twofold higher in 3D gel cultures compared with 2D gel cultures. It was demonstrated that spheroid formation was easily detected in HGF/heparin-immobilized collagen films, providing evidence that cultured hepatocytes can maintain their liver-specific functions Moreover, they also developed vascular endothelial growth factor (VEGF)/heparin-immobilized collagen gel-filled polyurethane foam (PUF) scaffolds to enhance viability of transplanted hepatocytes and to induce angiogenesis of transplanted cells (Hou et al. 2011). The results indicated that transplantation of fetal hepatocyte-embedded VEGF/heparin-immobilized collagen-gel-filled PUF scaffold exhibited a VEGF-induced pre-vascularized cavity in the subcutaneous space of rats after 70 % partial hepatectomy. The system appears to be a promising strategy for future liver tissue engineering.
Formation of multicellular hepatocyte spheroids in the 3D culture is a promising approach for enhancing liver-specific functions in bioartificial liver devices. Therefore, a highly porous hydrogel, alginate/galactosylated chitosan/heparin scaffolds as a synthetic ECM, was fabricated using the freeze-drying technique through electrostatic interaction (Seo et al. 2006a). The level of albumin secretion in the alginate/galactosylated chitosan/heparin scaffolds was markedly enhanced compared to that in alginate/galactosylated chitosan scaffolds (shown in Fig. 12). It is likely that the alginate/galactosylated chitosan/heparin scaffolds provide more multicellular spheroid formation mediated by cell-to-cell adhesion. However, the detailed mechanism of enhanced functions by hepatocyte spheroids within the alginate/galactosylated chitosan/heparin scaffolds is not fully understood.

Time course of albumin secretion by hepatocytes within alginate, alginate/GC (a) and alginate/GC/heparin (b) sponges. Albumin secretion rates were measured with various concentrations of GC to alginate contents under the fixed alginate concentration, and heparin to alginate contents under the fixed GC concentration
Although gelatin is frequently used as biopolymer for creating cellular scaffolds, chemical cross-linking is necessary to create stable gelatin scaffolds at physiological temperature. Therefore, a cross-linking was carried out by radical polymerization of methacrylated gelatin, and the gelatin scaffolds was fabricated in the presence of hyaluronic acid or chondroitin sulfate by emulsion templating (Barbetta et al. 2008). The results indicated that the gelatin scaffolds containing glycosaminoglycans secreted more albumin and higher resistance to enzymatic degradation than gelatin ones. These data reflect the longer permanency and the higher biocompatibility of the scaffold in vivo. Many naturally and synthetically derived hybrid hydrogels are used as ECMs for tissue engineering (Kim et al. 2011). One of them, a heparin-based hydrogel as 3D scaffold for hepatocyte culture was prepared by a Michael addition reaction between thiolated heparin and diacrylated poly (ethylene glycol) (Kim et al. 2010a). The heparin-based hybrid hydrogels were non-cytotoxic to cells and, in fact, promoted high levels of albumin and urea synthesis during three weeks in culture. As heparin binds to growth factors, the incorporated HGF release from heparin hydrogel matrix occurred in a controlled manner. In addition, the hepatocytes cultured within HGF-containing hydrogels showed higher levels of albumin and urea synthesis than those cultured in hydrogels alone.
5.7.1 3D scaffold cultures
Recently, hepatic tissue engineering using primary hepatocytes has emerged as a promising technique to treat the loss or malfunction of liver (Hammond et al. 2006; Ohashi et al. 2007). The technique involves in vitro seeding of hepatocytes into the 3D scaffolds where the cells proliferate, migrate and differentiate into the hepatic tissue (Sachlos and Czernuszka 2003). Usually, tissue engineering uses artificial ECM because it regulates many cellular behaviors, including proliferation, survival, migration and differentiation (Daley et al. 2008). Therefore, the design of artificial ECM is very important in hepatocytes culture as it brings the desired cell type in contact with an appropriate environment and provides mechanical support as the scaffold (Putnam and Mooney 1996). There are two kinds of methods for producing 3D scaffolds. One is conventional scaffold method that includes fiber bonding (Gillette et al. 2011), phase separation (Ma and Zhang 1999), particulate leaching (Holy et al. 2000), melt molding (Oh et al. 2010), gas foaming (Son et al. 2011) and freeze drying (Yang et al. 2012). Among the conventional manufacture techniques, freeze-drying method of naturally derived polymers have been applied for liver tissue engineering because porosities and average pore sizes of the 3D scaffolds were controlled by the cooling rate of the hydrated alginate/galactosylated chitosan (alginate/galactosylated chitosan) scaffolds as shown in Fig. 13 (Chung et al. 2002). However, the conventional techniques have several limitations, such as being manual-based processes, inconsistent procedures with shape limitations and the use of toxic organic solvents and porogens. Other methods include computational scaffold design (Hollister 2005) and solid-free form (Kang and Cho 2012), which both overcome the limitations of conventional manual-based manufacture methods.

Scanning electron micrographs of a cross section of alginate/GC scaffolds as a function of the freezing temperature: (a) −20 °C, (b) −70 °C and (c) liquid nitrogen
5.7.1.1 Scaffolds derived from natural materials
Decellularized liver-derived ECM has been used for 3D culture of hepatocytes because it is bioresorbable, can be easily handled, supports long-term liver function and provides 3D organ architecture and ECM components (Bao et al. 2011). The 3D scaffold prepared from a decellularized rat liver lobe with layer-by-layer heparin deposition was developed to transplant into the portal system after populating hepatocytes in the scaffold as a tissue-engineered liver (Bao et al. 2011). It was found that treatment of extended hepatectomized rats with a tissue-engineered liver improved liver function and prolonged survival. In addition, hyaluronic acid or heparin-conjugated hyaluronic acid hydrogel containing acellular porcine liver ECM was prepared to enhance survival and functions of hepatocytes (Skardal et al. 2012). The hepatocytes cultured in hyaluronic acid or heparin-conjugated hyaluronic acid hydrogels containing acellular liver ECM secreted steady levels of albumin and urea, and sustained drug metabolism due to liver-specific ECM components in the acellular liver ECM and slow release of growth factors from heparin-conjugated hyaluronic acid.
5.7.1.2 Scaffolds derived synthetically and their fabrication methods
A range of different substrates have been considered for 3D hepatocyte culture. These can generally be divided into substrates made from either natural or synthetic materials. Each of these has advantages and disadvantages (Table 3). While the use of naturally derived substrates offers advantages in terms of biocompatibility and opportunities to mimic cell–matrix interactions, there are several practical disadvantages in the context of routine 3D hepatocyte culture. Importantly, materials derived from living tissues are often inherently variable with undefined constituents, creating potential for significant batch-to-batch variability with consequences for reproducibility in experimental data. Such materials are also biodegradable, which, although advantageous in certain tissue engineering applications, makes routine in vitro use difficult. Natural substrates usually require careful, often laborious preparation before use, posing barriers for high-throughput applications and introducing further potential for variability. Therefore, synthetic scaffolds represent potentially attractive alternatives to naturally derived substrates as they overcome many of the practical pitfalls associated with naturally derived substrates, including uncontrollable reproducibility, instability, poor mass transfer and difficulty-of-use. Furthermore, the wide range of synthetic polymers and fabrication methods now available opens up many opportunities for cell-specific tailored scaffolds. For example, the specific affinity of hepatocytes toward the galactose residue has led to a range of synthetic scaffolds presenting galactose on the surface for improved hepatocyte adhesion and function (Cho et al. 2006).
Some of the early and most successful synthetic scaffolds to be produced were based on poly (lactic acid) (PLA), poly (glycolic acid) (PGA) and poly (lactic-co-glycolic acid) (PLGA) (Mikos et al. 1993). These scaffolds have been used to support 3D hepatocyte growth for up to 2 weeks in the context of tissue engineering (Hasirci et al. 2001). From the development of these materials came a plethora of different fabrication techniques to create synthetic scaffolds of different morphology, reproducibility, mechanical strength and porosity (Dalton et al. 2009). Electrospinning is a technique that whips polymeric solutions into micro- or nano-scale fibers that are inter-weaved. The technique is relatively cheap and hugely versatile enabling a range of different fibrous architectures to be produced with different fiber diameters and porosities. Hepatocytes cultured on synthetic electrospun fibers have been shown to become engulfed by the fibrous structure and form integrated 3D hepatocyte spheroids with increased cell–cell contacts (Chua et al. 2005). However, many electrospun materials exhibit weak mechanical strength and poor control over batch-to-batch structure, making commercialization and reproducibility difficult.
Solvent casting/particle leaching is another common approach to fabricating synthetic scaffolds for 3D cell culture. Here a polymer–solvent solution is cast over a mold containing porogen particles such as crystalline salts. After solvent evaporation, the polymer–salt composite is washed to dissolve the salt, leaving a porous structure behind. Hepatocytes have been cultured on materials prepared from this technique and then successfully transplanted into laboratory rats (Mooney et al. 1995), suggesting this fabrication method as a suitable approach for hepatocyte culture. However, particle leaching often gives rise to variable porosity products, and can leave residual particles in the scaffold. It is also difficult to control void size distribution. Gas-in-liquid foam templating has also been used for synthetic scaffold fabrication for 3D cell culture (Salerno et al. 2009); however, issues with bubble coalescence and hence variable porosities have meant this method is less popular compared to other approaches. Rapid prototyping with techniques such as 3D printing is also an emerging field for scaffold fabrication, although expensive machinery is needed for this approach (Fedorovich et al. 2012).
With the broad range of natural and synthetic materials available, the challenge for biotechnology companies wishing to develop technologies for routine 3D hepatocyte culture is therefore choosing the appropriate material, fabrication method and final format. Technologies based on natural materials are not ideally suited for routine use due to problems with consistency and stability. On the other hand, until recently, technological advances based on synthetic materials have faced difficulties in producing inert, highly porous and reproducible structures that can be presented in an easy-to-use manner. Recently, a porous synthetic scaffold has been commercialized for routine cell culture of a variety of cell types, including hepatocytes (Knight et al. 2011). Alvetex® (Reinnervate) has been developed from cross-linked polystyrene, ensuring good stability, compatibility with chemicals used in tissue processing and a comparable chemical surface to traditional 2D plasticware. The fabrication method also ensures a highly uniform and consistent structure from batch-to-batch. Results have shown that good control over synthesis parameters leads to a controlled scaffold morphology of voids and interconnecting windows (Carnachan et al. 2006) (Fig. 14a). Alvetex® has been engineered into a 200-μm-thick membrane (Fig. 14b) that offers several biological and practical advantages. Biologically, the relatively thin cross section combined with high porosity enables efficient mass transfer between cultured cells and the surrounding medium. Practically, the membrane can fit conveniently into traditional tissue culture plasticware and can therefore be supplied ready-to-use (Bokhari et al. 2007a). The technology is adaptable to high-throughput applications and formats such as 96- and 384-well plates. The membrane is also strong enough to support the weight of high cell densities and is resistant to common tissue processing methods.

Scanning electron micrographs showing the structure of alvetex polystyrene scaffold. a Alvetex is a highly porous (>90 %) material comprised of interconnecting voids. Essentially, alvetex creates “space” and introduces the third dimension to polystyrene. Inside the scaffold, cells occupy and grow in 3D in the space created, maintaining a more natural shape and form. b Alvetex is engineered as a 200-μm-thick membrane, ensuring that any cell is no further than 100 μm away from the source of culture medium. This distance compares favorably with the majority of tissue types and avoids the formation of cellular necrosis in central regions of the scaffold
There is strong evidence that Alvetex® supports 3D hepatocyte culture (Bokhari et al. 2007b; Schutte et al. 2011a; Burkard et al. 2012). For example, primary rat hepatocytes grown on Alvetex® displayed a more natural polygonal morphology compared to the flattened 2D morphology associated with collagen-coated plasticware (Fig. 15) (Schutte et al. 2011a). In addition, cell viability was also found to be higher after 24-h culture, with rat primary hepatocytes on Alvetex® being >74 % viable, compared to only 57 % viability for hepatocytes on conventional 2D plasticware (Schutte et al. 2011a). Enhanced functional responses of hepatocytes grown on Alvetex® have also been demonstrated. The induced activity of phase I metabolizing enzymes CYP1A2, CYP2B1 and CYP3A2 was assessed with primary rat hepatocytes and showed much greater levels of CYP induction in cells cultured in Alvetex® compared to 2D controls (Schutte et al. 2011a). Similarly, levels of CYP2B6 and CYP3A4 enzyme expression were shown to be elevated in human hepatocytes grown in Alvetex® compared to their counterparts in 2D conventional plasticware (Burkard et al. 2012).

Example of hepatocytes cultured for 7 days in an Alvetex scaffold. Cells maintain a natural 3D morphology and form close associations with adjacent cells thus creating a tissue-like structure. This sample has been fixed, embedded, transverse sectioned and stained with hematoxylin and eosin. Scale bar 30 μm
5.7.2 Scaffold parameters and hepatocellular behavior
Hepatocytes are attachment-dependent cells and lose their liver-specific functions without optimal ECMs (Kim et al. 2011). It has been demonstrated that the morphology, attachment, growth, differentiation, and survival of hepatocytes are affected by several factors such as galactose density (Yin et al. 2003) and microdistribution of galactose (Cho et al. 1996) in the scaffold, type of galactose (Kim et al. 2003b), co-culture (Bhatia et al. 1999), cell source (Chan et al. 2004) and topology of the ECM (Berthiaume et al. 1996). Moreover, the 3D artificial ECMs induce differentiated hepatocyte function more effectively than 2D ECMs due to the provision of better model systems for physiologic situation and in vivo-like configuration (Berthiaume et al. 1996). Here, the effects of porosity, galactose ligand and glycosaminoglycan in 3D scaffolds on hepatocellular behavior are reviewed.
A successful 3D scaffold should balance mechanical property with growth factor delivery to provide a sequential transition in which the regenerated tissue undertakes function as the scaffold degrades. This balance shows a trade-off relationship between a denser scaffold supporting better mechanical function and a more porous scaffold providing better growth factor delivery (Hollister 2005). Besides, interconnected porous networks are very important in ensuring spatially uniform cell distribution, cell migration, proliferation and cell survival that affect the diffusion of physiological nutrients and gases and the removal of metabolic wastes (Huang et al. 2007a). Control of pore size of 3D scaffolds is critical for liver tissue engineering as the pore size affects hepatocellular behavior, yet the optimum pore size for hepatocyte function has not been reported due to complex parameters. Despite its complexity, it has been demonstrated that poly (lactic acid-co-glycolic acid) (PLGA) scaffolds with about 6 μm promoted 3D aggregation of hepatocytes, whereas scaffolds with about 3 μm induced 2D hepatocyte reorganization, and scaffolds with about 17 μm promoted both 2D and 3D hepatocyte reorganization (Ranucci and Moghe 1999). Similarly, collagen scaffolds with pore sizes of approximately 82 μm exhibited a high degree of spread hepatocytes with high albumin secretion owing to 3D intercellular contacts (Ranucci and Moghe 1999). Hepatocytes cultured on micro-grooved glass scaffolds with a 100 μm high channel between each scaffold provided better liver-specific functions than those in scaffolds without micro-grooves due to protection of hepatocytes from shear stress and maintenance of oxygen delivery (Park et al. 2003, 2008). Hepatocytes cultured on 3D alginate scaffolds with about 100–150 μm secreted large amounts of albumin (60 μg/106 cells/day) within a week due to non-adherent nature of alginate and 90 % hepatocyte aggregation (Glicklis et al. 2000).
Pricer and Ashwell (1971) first reported that circulating asialoglycoproteins (ASGPs) bind to asialoglycoprotein receptors (ASGPR) on the hepatocytes and then degraded confirming that hepatocytes having cell surface receptors recognize and bind molecules with exposed galactose through a unique ASGPR–galactose interaction (Neufeld and Ashwell 1979). Therefore, many researchers have incorporated galactose moieties to the artificial ECMs to mimic the biological environment of the liver. The galactose ligand has been also introduced to the surface of ECMs as well as to the bulk state of the ECMs because hepatocyte–ECM interaction is a surface phenomenon (Kim et al. 2011). The galactose ligand was mostly introduced to the naturally derived 3D scaffolds among artificial ECMs because they provide highly porous structures and high pore-interconnectivity although they have weak mechanical property and reproducibility. Some naturally derived polymers used for liver tissue engineering are summarized in Table 4.
Although collagen has arginine-glycine-aspartic acid (RGD) sequence as the recognition site instead of galactose, collagen gels were used in hepatocyte culture for the application of bioartificial liver (Zhao et al. 2010b). The results indicated that the collagen gels reconstituted a 3D vascularized hepatic tissue in vivo although they have weak mechanical property. To overcome the weak mechanical property of the collagen gels, collagen/Poloxamine (Sosnik and Sefton 2005) and collagen/chitosan (Wang et al. 2005a) hybrids were used as artificial scaffolds for liver tissue engineering. The hybrid scaffolds exhibited enhanced mechanical property of the collagen gels with good cell adhesion and high survival of hepatocytes.
Regarding the role of galactose as a ligand, galactosylated alginate was used to encapsulate hepatocytes in the presence of calcium ions and the function of hepatocytes was evaluated (Yang et al. 2002). It was found that the function of hepatocytes in galactosylated alginate microcapsules was enhanced compared to cells in alginate, as shown in Fig. 16. It was suggested that the increased function of hepatocytes was due to more spheroid formation of hepatocytes in galactosylated alginate than alginate microcapsules. Besides, alginate microcapsules prepared with galactose-carrying xyloglucan as an artificial ECM showed better liver-specific functions than alginate ones without xyloglucan due to the enhanced multicellular spheroidal hepatocyte formation. Moreover, connexin 32 gene of hepatocyte spheroids in alginate/xyloglucan microcapsules were more rapidly expressed than in alginate ones (Seo et al. 2005). In similar study, the galactosylated chitosan was hybridized with alginate to make alginate/galactosylated chitosan scaffold for liver tissue engineering (Yang et al. 2001; Chung et al. 2002). The hybrid of galactosylated chitosan and alginate improved cell adhesion and stability of the alginate scaffold, which retained differentiated hepatic cellular functions. Moreover, galactosylated gelatin prepared by reaction of lactobionic acid with amine-incorporated gelatin was evaluated for use in hepatocyte culture (Hong et al. 2003). The results indicated that liver functions such as albumin secretion and urea synthesis of hepatocytes cultured on galactosylated gelatin scaffolds were higher than that of hepatocytes cultured on collagen-coated monolayers, with longer survival times of hepatocytes because of the specific interaction of galactose moieties in galactosylated gelatin with ASGPR of hepatocytes. Further, galactosylated hyaluronic acid prepared by reaction of hyaluronic acid and aminated lactobionic acid was mixed with chitosan to make highly porous galactosylated hyaluronic acid/chitosan sponge for hepatocyte culture (Fan et al. 2010a). It was found that the addition of galactosylated hyaluronic acid in the chitosan sponge improved mechanical property and liver functions compared with those in the chitosan scaffolds. These results clearly demonstrate the role of galactose as a ligand in the 3D scaffolds on the function of hepatocytes.

Phase-contrast micrographs of encapsulated hepatocytes in alginate/calcium capsules (a) and galactosylated alginate/calcium capsules (b)
Glycosaminoglycans are negatively charged polysaccharides which are found as natural components of ECMs. They are located in liver tissue where they influence hepatocyte proliferation and differentiation by directing or interacting with other matrix components (Barbetta et al. 2008), and they also bind with high affinity to various kinds of growth factors (Deakin et al. 2009). A study has shown that, among various glycosaminoglycans, only heparin-containing collagen gels improved the maintenance of albumin synthesis (Lin et al. 1995). It was suggested that some specific interaction between heparin and collagen would exist for the maintenance of hepatocyte functions. In another study, the effect of two different glycosaminoglycans, heparin and chondroitin-6-sulfate, on the metabolic activities in hepatocytes cultured on collagen gels was assessed for the application to the bioreactors (Kataropoulou et al. 2005). The results indicated that the addition of heparin and 1,6-diaminohexane to the collagen gels increased the formation of hydroxylation of testosterone in hepatocytes, whereas the combination of chondroitin-6-sulfate and 1,6-diaminohexane increased glucuronidation of kaempferol by hepatocytes. Similarly, collagen/chitosan/heparin scaffolds fabricated by gelation of collagen/chitosan with heparin provided increased mechanical property and better blood compatibility compared to collagen and collagen/chitosan ones (Wang et al. 2005b). In addition, hepatocytes cultured on the collagen/chitosan/heparin scaffolds showed high urea and triglyceride secretion for 25 days after cell seeding.
5.7.3 Hepatospheres
Aside from hydrogel- and scaffold- based technologies, hepatocytes are also re-aggregated by cellular self-assembly to reform a 3D configuration. The fundamental concept is that single suspended cells from cell lines or fresh tissues are capable of reforming 3D tissue or “spheroids” if adhesion to a substrate is prevented (Kelm and Fussenegger 2004; Kelm et al. 2003, 2006). These spheroids show extensive cell–cell contacts, liver-specific cell polarity and bile canaliculi (Peshwa et al. 1996). The cell phenotype also changes from monolayer to spheroids. For example, the actin cytoskeleton localizes on the cortex instead of forming stress fibers (Tzanakakis et al. 2001; Chang and Hughes-Fulford 2009). In general, an intact actin cytoskeleton is required for the self-assembly and differentiation of liver cell spheroids (Tzanakakis et al. 2001). In comparison with the majority of other methods, cellular spheroids retain most of the cell–cell and cell–ECM contacts, since the cells are in close contact and they produce their own ECM. Primary hepatocytes, as well as hepatic cell lines, can be used to generate hepatospheres. These can be created with various methods: (1) spontaneous self-assembly in non-adhesive wells/dishes under static conditions (Friedrich et al. 2009), (2) with agitation (rotary culture, rocked culture, Bioreactor) (Chang and Hughes-Fulford 2009), microcavities (Fukuda et al. 2006) or (3) in a hanging drop (Kelm et al. 2003). In contrast to most liquid overlay cultures, the hanging drop culture produces hepatospheres with good size reproducibility, since only one tissue per drop is formed with a defined cell number. This typically yields size variations of less than 10 % of mean, which is essential for reproducible results. Recent developments in microfluidics have led to more advanced concepts in which rat hepatospheres are accumulated in micro-cavities with interconnected channels which allow for continuous medium flow (Fukuda and Nakazawa 2011).
5.7.3.1 Cell-line-derived hepatospheres
Hepatoma-derived cell lines such as HepG2, HepaRG and Huh7 are frequently used in early safety assessment (Table 5). The advantages of using cell lines instead of primary cells are obvious: unlimited growth and availability and the absence of donor variations lead to higher reproducibility of results (Castell et al. 2006). The disadvantage of the HepG2 and Huh7 cell lines is that they display very limited hepatocyte functionality in 2D culture (Castell et al. 2006). Spheroids obtained from HepG2 cells also show a markedly different gene expression pattern compared to monolayers. Genes over-expressed in the HepG2 spheroids include xenobiotic metabolism and lipid metabolism (Chang and Hughes-Fulford 2009). A similar expression pattern was observed in rat hepatocyte spheroids (Sakai et al. 2010). However, the recently introduced HepaRG cell line seems to preserve a set of hepatocyte-like functions and can therefore can be used for in vitro metabolism studies. Although conventionally used in 2D culture, all these cell lines can also be used in 3D culture. Culturing HepG2 in 3D resulted in hepatocyte-like morphology with expression of bile canaliculi and dense cell–cell contacts (Kelm et al. 2003). Gene expression analysis of HepG2 cells cultured in hanging drops showed elevated transcription of CYP1A1 and HNF3A (Kelm and Fussenegger 2004). Moreover, HepG2 spheroids generated in rotating wall vessels showed distinct upregulation of genes involved in metabolism (CYP1A1, AKR1C1, EPHX1, LTB4DH) and synthesis (albumin, GST1A1, GCLM). Higher expression of CYP1A1 also resulted in enhanced turnover of resorufin in spheroids compared to HepG2 monolayers (Chang and Fussenegger 2009). Metabolic analysis of HepG2 cells in spheroid cultures showed higher production of glutamate, as well as uptake of glutamine, alanine and branched-chain amino acids. The sensitivity toward toxicity of the anticancer drug, tamoxifen, was reduced in comparison with 2D culture, which was explained by the presence of the drug transporter, MRP2. Importantly, MRP2 activity could be demonstrated by the use of CMFDA dye, which is actively exported by MRP2 into bile canaliculi of HepG2 spheroids (Mueller et al. 2011). In addition to MRP2 being highly active, the efflux activity of MDR1 is enhanced in HepG2 spheroids (Oshikata et al. 2011). Interestingly, spheroid culture of HepG2 resulted in expression of lipopolysaccharide receptor and showed lipopolysaccharide-induced cytokine responses (Liu et al. 2011). Culturing Huh7 cells in a rotating wall vessel resulted in cells that were morphologically and transcriptionally distinct compared to Huh7 in 2D culture. The 3D aggregates showed expression of phase I and phase II drug metabolism genes as well as hepatocyte-specific transcripts (HNF4α, albumin, TTR and αIAT). Importantly, polarized expression of cell adhesion molecules, tight junction markers and hepatitis C virus (HCV) receptors were induced in 3D, the latter permitting infection with HCV (Sainz et al. 2009). Nothing is published so far on the behavior of HepaRG cells cultured as spheroids, although unpublished experiments using HepaRG cells show that these cells form spheroids in hanging drop culture. The functional characteristics of this 3D HepaRG culture are currently being evaluated in the EU-FP7 project NOTOX.
5.7.3.2 Tissue-derived hepatospheres
Beside hepatic cell lines and ex vivo cultures such as liver slices, cultures of primary hepatocytes continue to be used extensively in research. However, disadvantages of primary hepatocytes are their limited availability and high inter-donor variability. Since availability is limited, it is of importance to gain as much data as possible from low cell numbers. In this respect, spheroid models offer the advantage of requiring very few cells. As previously described, rat hepatocyte spheroids so far represent a well-characterized 3D model derived from primary hepatocytes, and have been used since the 1980s. Their metabolic capacities, functions and morphology are well described and will be discussed later. However, little is known about the characteristics of human hepatocytes in 3D culture (Li et al. 1992; Tostoes et al. 2012; Tong et al. 1994). For example, spheroids produced in a bioreactor were viable for up to 4 weeks, showed phase I and phase II metabolic enzyme gene expression and activity and staining with typical hepatocyte markers cytokeratin 18, CYP3A4 and HNF4α (Tostoes et al. 2012). As with rat hepatocyte spheroids, a bile canalicular network is established and can be visualized using a fluorescent dye (Tostoes et al. 2011). Primary hepatocyte spheroids from species frequently used in safety assessment, such as monkey, dog and mice, are only poorly characterized. An overview on established hepatocyte spheroid models is provided in Table 6. Hepatospheres from porcine liver are mainly studied as extracorporal liver support after liver failure (Nyberg et al. 2005). Since porcine spheroids are usually not used for toxicology research, Table 6 shows information on hepatospheres from other species.
5.7.3.3 The cellular environment of hepatospheres
In contrast to other epithelial tissues which have two basement membranes and a considerable amount of ECM placed between endothelial and epithelial cells, liver tissue contains only small amounts of ECM. This is composed mainly of fibronectin, some collagen type I and minor quantities of types III, IV, V and VI (Martinez-Hernandez and Amenta 1993). During liver regeneration, laminin is synthesized predominantly by stellate cells. At the time the regeneration process in finalized, the synthesis of laminin stops. The interaction between ECM and hepatocytes is critical for normal homeostasis (Martinez-Hernandez and Amenta 1993). Evidence for this was reported by Abu-Absi et al. (2002) who analyzed the effect of dexamethasone on the ECM in primary rat hepatocyte spheroids. On a transcriptional level fibronectin, collagen I and collagen III were detected in hepatospheres after day 1 and day 14. The addition of dexamethasone resulted in slightly elevated levels after day 1. However, after 14 days in culture, they could not detect a significant difference in the expression levels of the ECM components (Abu-Absi et al. 2002).
Sustained cellular contacts are the key for maintaining differentiation and functionality of hepatocytes. In the spheroid model, cellular contacts are re-established during cellular self-assembly. This process is thought to involve three steps: (1) single cell rapidly aggregate, a process mostly dependent on an initial ECM–integrin interaction; (2) E-cadherin expression is upregulated; and (3) the cells form tight interactions with each other via homophilic cadherin–cadherin binding (Lin and Chang 2008). In the assembled hepatosphere, all three types of cell junctions are present, namely (a) anchoring junctions (AJ), (b) occluding junctions (OJ) and (c) communicating junctions (CJ) (Peshwa et al. 1996; Vinken et al. 2006a). Anchoring junctions consist of adherens junctions and desmosomes, which share similar structures. The presence of anchoring junctions was shown to be beneficial for hepatocyte functionality, such as albumin secretion, ammonia detoxification, glycogenolysis and bile secretion (reviewed in Vinken et al. 2006a). Together with the gap junctions, the anchoring junctions were shown to be essential for drug-induced gene expression of CYP3A4 and CYP2B6 (Hamilton et al. 2001). In hepatospheres, the presence of E-cadherin as part of anchoring junction was verified by immunofluorescence (Takei et al. 2005; Brophy et al. 2009). Gap junctions are communication junctions between two cells. They are formed by the interaction of two hemichannels of adjacent cells. The hemichannels consist of connexins, which are named after their molecular weight (e.g. Cx26, Cx32 and Cx43). Two cells can directly exchange small metabolites, such the second messenger cyclic adenosine monophosphate (cAMP), inositol triphosphate (IP3) and ions (e.g. Ca2+) via gap junctions. Gap junctions occupy as much as 3 % of the hepatocyte membrane and are mainly composed of Cx26 (approximately 5 %) and Cx32 (approximately 90 %) (Vinken et al. 2006a). The extent of cell–cell contacts is directly related to the usefulness of an in vitro model system from evaluation of hepatotoxic effects. Xenobiotics often induce hepatic dysfunctionality by targeting cellular junctions. It was demonstrated that downregulation of cell junction components resulted in acute hepatic injury and can be caused, for example, by alcohol, carbon tetrachloride and thioacetamide (Vinken et al. 2006a, 2009). Long-term exposure to hepatotoxic chemicals was shown to inhibit cell junctions and to cause chronic liver disease, fibrosis, cirrhosis and hepatitis. 2D cultures of hepatocytes reflect the expression pattern of E-cadherin and Cx32 close to in vivo values, but only for a limited time period after establishment of a confluent hepatocyte monolayer, which is typically between day 1 and day 3 after seeding of hepatocytes. A high degree of confluence of the monolayer is the key to establish cell–cell contacts between hepatocytes, and this is often difficult to achieve reproducibly between experiments. By contrast, the cell density in a hepatosphere is always the same, with equal amounts of cell–cell contacts between hepatocytes. Hepatosphere cell–cell contacts are sustained for a longer time period than in 2D culture (Sakai et al. 2010), which is undoubtedly the explanation for extended functionality of the hepatocytes in this model. Since many xenobiotics target cellular junctions, it is necessary to choose a model system which shows in vivo-like expression patterns of cellular junctions for prolonged time periods.
A sufficient supply with oxygen is crucial for a functional 3D in vitro model of the liver. Due to their high metabolic activity, hepatocytes have a high oxygen turnover which can be up to tenfold greater than other types of non-proliferative cells (Cho et al. 2007). The higher the oxygen uptake rate of the hepatocyte, the higher the liver-specific albumin and urea production (Cho et al. 2007). Similar observations have been seen even earlier using liver tissue sections which were exposed to different oxygen partial pressures. The higher the partial pressure, the better cells in deeper regions of the liver slices survived (MacDougall and Mccabe 1967). Therefore, it is particularly important to control the spheroid diameter not only to prevent necrosis due to oxygen depletion but also to sustain high hepatocyte functionality within the whole model (Funatsu et al. 2001). Modeling of the oxygen profile of mouse hepatocyte spheroid under standard conditions results in a diameter of about 200 μm until a critical O2 concentration is achieved in the core of the hepatosphere (Curcio et al. 2007). Increasing the oxygen concentration up to 160 mmHg in the medium e.g. by using a rotating wall system, increases the maximum theoretically to 450 μm in diameter until a critical oxygen concentration is reached in the core. However, increasing the oxygen concentration leads also to an increase in ROS (Lillegard et al. 2011).
Self-assembly of hepatocytes into spheroids results in a structure similar to that of native liver tissue. Hepatocytes in spheroids have cuboidal shapes and abundant cytoplasmic organelles. The surface of spheroids from rat hepatocytes was shown to be smooth and permeated by numerous pore-like openings (Abu-Absi et al. 2002; Peshwa et al. 1996). These pores have been demonstrated to be the entrances to microvilli-lined channels which are similar to canaliculi. The hepatocytes show polarization with an apical site for transport of bile acids and a basolateral site for trafficking for metabolites. The polarity was shown by apical HA4 and basolateral HA321 staining. The network of channels was visualized by FITC-dextran (Abu-Absi et al. 2002). Moreover, exposure to the pseudo bile acid FITC-glycocholate led to directed secretion into bile canaliculi, demonstrating the functional polarity.
5.7.3.4 Hepatocyte functionality
Rat hepatocyte spheroids generated on nanopillar sheets showed higher expression of MRP2, albumin and CYP3A3 gene expression as compared to monolayer culture (Takahashi et al. 2010; Sakai et al. 2010). Another report thoroughly investigated the difference in gene expression between rat hepatocytes in monolayer or spheroid culture (Sakai et al. 2010). The result showed that genes encoding cell adhesion molecules (integrin 3, cadherin 1, Cx32), transcription factors (HNF4α, CCAAT/enhancer binding protein β), protein and metabolic enzymes (albumin, glucose-6-phosphate, tryptophan 2,3-dioxygenase, arginase 1 and CYP7A1) and transporters (OATPs, MDR2, BSEP) are more highly expressed in spheroid than in monolayer cultures. Monolayers quickly lost their expression of these proteins, whereas spheroids were able to maintain the liver-specific gene expression profile for longer times. Another study showed that rat hepatocytes showed stable expression of more than 80 % of 242 liver-related genes, including those of albumin synthesis, urea cycle, phase I and II metabolic enzymes (Brophy et al. 2009). The expression of metabolic enzymes was verified by the upregulation of leukotriene, cholesterol metabolism and synthesis of GSH, albumin and ATP (Chang and Hughes-Fulford 2009; Brophy et al. 2009; Fukuda et al. 2006).
It is well known that the metabolic activity of hepatocytes in 2D culture rapidly declines while many studies have shown that the liver-specific metabolism of hepatocytes maintained in 3D is preserved for extended periods (reviewed in van Zijl and Mikulits 2010). The enhanced gene expression of hepatocytes in spheroids for phase I enzymes led to increased metabolism of 7-ethoxyresorufin to resorufin via CYP1A1 and CYP1A2, and diazepam to exazepam via CYP3A4 (Fukuda et al. 2006). Rat hepatocyte spheroids cultured in bioreactors showed enhanced liver-specific metabolism, such as elevated phase I (ECOD) and phase II enzyme (UGT) activities and the capacity to metabolize diphenhydramine and troglitazone (Miranda et al. 2009). In summary, liver-specific metabolism was shown to be maintained for extended time periods in 3D culture of hepatocytes.
5.7.3.5 Hepatospheres for toxicology assessment
Hepatocytes in 3D maintain xenobiotic metabolism enzymes and are therefore thought to be suited for toxicity assessment. In one study, five different compounds were tested (Xu and Purcell 2006) with rat hepatocyte spheroids. All tested compounds (diclofenac, galactosamine, isoniazid, acetaminophen, m-DNB and 3-nitroaniline) significantly decreased glucose secretion, which was thus suggested as the most sensitive end point. Other evaluated end points, such as pyruvate uptake, galactose biotransformation and lactate release, were less sensitive than glucose secretion. Moreover, the compounds, such as propanol, galactosamine, diclofenac and acetaminophen, had a negative impact on anchorage dependence, cellular morphology and cell spreading (Xu et al. 2003) of spheroids. Other reports suggested that rat hepatocyte spheroids were not useful for drug testing, since they were not sensitive to methotrexate treatment (Walker et al. 2000), whereas 2D culture displayed sensitivity. The authors suggested that this may result from the lack of compound penetration into the tissue or from the maintenance of cellular functions, which would render hepatocytes more resistant to methotrexate-induced cell death. The latter hypothesis was recently supported by the finding that hepatocytes in gel entrapment, in contrast to 2D culture, display high levels of the drug transporter MRP2, which is able to excrete methotrexate from the cell, thus rendering the hepatocytes more resistant toward methotrexate (Yin et al. 2009). However, a rigorous screen with known hepatotoxic compounds on spheroids models has so far not been undertaken. Moreover, an evaluation of accepted and sensitive endpoint assays for different toxicity pathways on hepatocyte spheroids would aid the use of this model system.
The long culture life time, presence of tight cell–cell contacts and lack of exogenous stimuli in the scaffold-free culture make spheroids an ideal model system for studying effects of carcinogens, such as non-genotoxic carcinogens (Roberts and Soames 1993). Likewise, it was shown that rat hepatocyte spheroids exhibit a 4.5-fold increase in the cytoplasmic fraction of peroxisomes in response to the peroxisome proliferator nafenopin. In addition, there was a concomitant induction of peroxisomal bifunctional enzyme CYP4A, the enzyme marker associated with peroxisome proliferation. The spheroids also maintained expression of peroxisome proliferator-activated receptor and are able to undergo replicative DNA synthesis in response to nafenopin (Roberts and Soames 1993).
5.8 3D co-cultures of hepatocytes with non-parenchymal cells


Inspired by the in vivo situation, researchers set up attempts to maintain hepatic function in vitro by co-culturing hepatocytes with NPCs (Langenbach et al. 1979; Talamini et al. 1998). Based on availability, liver NPCs were used, such as Kupffer cells, hepatic stellate cells and sinusoidal endothelial cells, and found to be superior to the extrahepatic-derived NPCs (Bader et al. 1996; Bhatia et al. 1999). For Kupffer cells (but also for other NPCs). it is important to include an adequate acclimation/recovery period to avoid activation due to the stress-inducing culture conditions prior to their use. Moreover, optimized ratios of hepatocytes to Kupffer cells should be established to reproduce the effects that occur in tissue. Similar to in vivo, heterotypic cell–cell contacts are therefore beneficial for in vitro use of primary hepatocytes (Morin and Normand 1986; Okamoto et al. 1998; Auth et al. 1998; Bhandari et al. 2001). A further improvement of the co-culture setting, as measured by urea synthesis, was the use of 3T3 fibroblasts together with hepatocytes, grown as double-layers. As substratum, collagen-tagged poly-dimethylsiloxane membrane was used to allow faster oxygen diffusion/exchange (Nishikawa et al. 2008). Oxygen supply in culture is a challenge as hepatocytes have high oxygen demands (Smith et al. 1996), and indeed, increased oxygen supply is capable of improving hepatocyte function (Tilles et al. 2001; De Bartolo et al. 2006). In general, an improvement in hepatocyte stability and maintenance is achieved irrespectively of the type of cell used for co-culture. In addition, the co-culture cell type is not required to be primary, since established hepatic stellate cell lines were demonstrated sufficient for hepatocytes. Readouts for improved hepatocyte function in co-culture are frequently CYP activity measurements, urea secretion and albumin production (Guguen-Guillouzo et al. 1983; Begue et al. 1984).
Approaches have been made to combine the benefits of 3D models leading to polar hepatocyte structures, either sandwiched or cultured as spheroids, with heterotypic cell–cell contacts with NPCs. However, distinct co-culture models may also be considered as 3D when sandwiching the hepatocytes between a substratum and a dense layer of other cells, where it was shown that the hepatocytes maintained a polar shape (Fig. 17 illustrates the different approaches). The idea behind these efforts is to promote formation of lobular structures with apical-basal polarization (including bile canaliculi formation) of hepatocytes and additionally to maintain enzymatic activities. The latter feature is of utmost relevance for long-term cytotoxicity testing, and therefore, this model is of particular interest and improvement needs to be fostered. On the other hand, the growth of understanding mechanisms to maintain hepatocyte function will be applied to advance the development of bioreactors and to translate toward the establishment of bioartificial liver devices (BALs) offering support to patients suffering from acute liver failure.

Models of combined co-culture and 3D systems. a Hepatocytes grown on a soft collagen surface overlaid by non-parenchymal cells, e.g. endothelial or hepatic stellate cells. b Hepatocytes cultured in sandwich configuration, overlaid by non-parenchymal cells; under these conditions, no heterotypic cell–cell contacts are possible. c Hepatocyte/non-parenchymal cell spheroids, grown on low or non-adhesive matrices. d Hepatocytes and non-parenchymal cells sandwiched in ECM matrices. These conditions enable heterotypic cell–cell communication. Different culture surfaces, e.g. glass, plastic or semi-permeable membranes, can be used. NPC non-parenchymal cells, HCs hepatocytes, ECM extracellular matrix
A direct comparison between hepatocyte cultures and co-cultures with NPCs in monolayer, or sandwich condition was performed by Uchino and co-workers who proved significant superiority of co-culture in collagen sandwich (Fig. 17a) based on urea synthesis (Koike et al. 1996). However, the culture period used in this study did not exceed 14 days and also did not investigate CYP activities. Furthermore, there was no difference between albumin secretion in co-cultures and single hepatocyte cultures in the sandwich condition. Another study described the generation of a sandwich system, where hepatocytes were maintained within two collagen layers, covered by a NPC mixture from the same isolation procedure (Bader et al. 1996). A hallmark of this study was the use of a gas permeable membrane on the bottom to allow better gas exchange and oxygen supply. Studying albumin production revealed that the NPC co-culture had no beneficial effect on hepatocyte function. Similarly, biotransformation of ethoxyresorufin was not influenced by NPCs. However, a major drawback of this system is the lack of heterotypic cell–cell contacts that have been shown to be relevant for maintaining hepatocyte function (Fig. 17b).
Recently, a spheroid system combining rat hepatocytes with hepatic stellate cells was developed (Thomas et al. 2005; Riccalton-Banks et al. 2003). Here, primary rat HSCs were seeded on a poly-DL-lactic acid surface that allowed weak attachment of cells (Fig. 17c). Within 2 days, spheroids developed consisting of both cell types. The authors not only identified improved enzymatic function, but also effects of stellate cells on spheroid formation underlining their relevance for organ/lobule formation of hepatocytes. CYP2E1, CYP3A1 and CYP1A2 expression and CYP activities (assessed using testosterone metabolism) were enhanced in these speroids. Electron microscopy revealed the presence of bile canaliculi, tight junctions and desmosomes. Additionally, a widespread fibrous pattern within the spheroids was evident, giving rise for stellate cells to contribute to the generation of ECM supporting hepatocyte stability. Another spheroid system using the HSC-T6 stellate cell line was tested, using primaria as the matrix (Abu-Absi et al. 2004). In this study, hepatic marker expression, but not enzymatic activities, was assessed after 14 days of culture. Comparing hepatocyte spheroids with co-culture aggregates, a significant production of albumin and CYP2B1/2 was determined. However, a benefit of the co-culture condition could not be drawn for other hepatic markers (e.g. CPS-I, CYP3A2).
Another approach to establish a 3D hepatocyte environment is embedding hepatocytes in liquid collagen solution with subsequent gelation (Jindal et al. 2009) followed by the addition of a layer of endothelial cells. Although no heterotypic cell contacts are established, the authors were able to identify soluble factors that signal in a paracrine manner. Depending on the focus, other cell types may also be applied to study cell–cell communication with subsequent analysis of hepatocyte functionality. Here, a combination of co-culture in the sandwich condition might be promising (Fig. 17d). A further challenging approach to study hepatic cell communication was introduced recently (Kasuya et al. 2011). Here, a tri-culture model employing hepatocytes, stellate and endothelial cells was generated. Using a microporous membrane, an intercalating sheet of HSC between layers of hepatocytes and endothelial cells was established. Thus, translating this to a more general level, this model allows analysis of complex communication networks in vitro and might allow adjustment for specific questions. A very promising strategy for the development of 3D tissues is the culture of hepatocytes on biodegradable membranes (Kasuya et al. 2012). After attachment to the membranes, these layers can be stacked and upon biodegradation, a two (or more)-layer tissue is achieved. As this approach has not been tested with co-culture systems and due to appearing problems with oxygen supply based on increased stack sizes, the system needs further validation.
In order to enhance hepatocyte-specific functions of hepatospheres (see section “Hepatospheres”), co-culture approaches were performed with different cell types. It was shown that co-culture of rat hepatocytes with mouse NIH3T3 (Seo et al. 2006b; Chia et al. 2005) had beneficial effects on albumin secretion, ammonia elimination rate and CYP1A1 activity. Co-culture of rat hepatocytes with the rat hepatic stellate cell line HSC-T6 resulted in heterospheroids with elevated albumin and CYP2B1/2 expression. The HSC-T6 cells invaded into the hepatocyte spheroids before retracting to their original location at the periphery of the MT, leaving sinusoid-like spaces (Abu-Absi et al. 2002). Similarly, coating of rat hepatocyte spheroids with human umbilical vein endothelial cells (HUVECs) resulted in invasion of HUVECs into the hepatocyte spheroid and establishment of a dense vascular network (Inamori et al. 2009). The previously discussed approaches use cell lines mixed with primary cells but to fully exploit the potential of co-culture as a means of achieving a more organotypic model, primary hepatocytes would ideally to be co-cultured with primary cells from the same organ. This can be achieved by isolation of primary hepatocytes and enrichment of NPCs, such as endothelial cells, Kupffer and stellate cells. This cell mixture can be co-cultured with hepatocytes in hanging drops, which results in tissue re-formation within 2–3 days. Interestingly, the endothelial cells re-organize themselves to completely surround the hepatocyte core, as visualized by whole-mount confocal microscopy in Fig. 18a. The endothelial cells were stained with ICAM-1 marker, whereas hepatocyte polarity and bile canaliculi were visualized with DPPIV marker. The self-sorting of cells can be explained by the differential expression of cadherins on the two cell types. According to the differential cell adhesion hypothesis, the cell type with the higher expression of cadherins builds the core of a tissue, whereas the cell type with the lower expression of cadherins surrounds the core (Foty and Steinberg 2005). Moreover, the Kupffer cells, which are present in the NPC fraction, distribute themselves within the hepatosphere (Fig. 18b). Kupffer cells are very motile within the tissue in vivo as well as in the hepatosphere, since they do not form direct cell–cell contacts to hepatocytes. Importantly, Kupffer cells can be stimulated with inflammatory stimuli, such as lipopolysaccharide. In response to this stimulus, the macrophages secrete cytokines, which trigger local inflammation (unpublished results). Thus, it is possible to study inflammation-mediated toxicity.

a Confocal image of whole-mount staining of primary rat liver microtissue in co-culture with non-parenchymal cells. The endothelial marker ICAM-1 is visualized by red, bile canalicular marker DPPIV is shown by green, and nuclei are by blue fluorescence. The picture was kindly provided by Dr. Seddik Hammad, IfaDo, Dortmund. b Paraffin section and immunostaining of primary rat liver microtissue in co-culture with NPCs. Kupffer macrophage marker CD68 is visualized by green color, whereas nuclei appear in gray
Besides generating stable cultures of primary hepatocytes for drug testing and development of BALs, it is of outmost relevance to establish systems to expand hepatocyte cultures, e.g. for transplantation purposes. Although the hepatocyte dedifferentiation in monolayers leads to genetic reprogramming, priming the cells for proliferation (Zellmer et al. 2010), even supplementation with growth factors (e.g. HGF), only leads to minor cell expansion in vitro (and partially only DNA synthesis was observed with a lack of subsequent cell divisions) (Richman et al. 1976; Block et al. 1996). Therefore, in parallel to investigations of maintaining hepatocyte function using co-cultures, methods for in vitro expansion are under development with mixes of NPCs, certain liver-derived cell types or fibroblast cell lines (Goulet et al. 1988; Shimaoka et al. 1987; Uyama et al. 2002). Advancement was achieved as recently reported using 3T3-J2 fibroblasts as feeder cells for hepatocyte cultures (Cho et al. 2008). The authors showed that hepatocytes underwent proliferation and at the same time maintained functionality, as evaluated by albumin production. Unfortunately, re-plating in a 3D sandwich configuration led to proliferation arrest but kept hepatocytes stable and functional. Thus, although hepatocytes have a high potential of proliferation in vivo (e.g. upon partial hepatectomy), a setting to trigger hepatocyte expansion in a 3D environment in vitro is still pending. Attempts using a 3D extracellular scaffold were introduced recently (Lang et al. 2011; Zhang et al. 2009). Although no co-culture technologies were applied, the use of matrix scaffolds for maintaining hepatocyte function and triggering proliferation seems promising and superior compared with sandwich or spheroid culture techniques. Noteworthy, to circumvent these limitations, alternative sources of functional hepatocytes are being developed, ranging from pluripotent stem cells to differentiated cells which have to be reprogrammed toward a hepatocyte phenotype. These approaches are described in section “iPS cells for modeling diseases and ADMET.”
In conclusion, it is now very obvious that the in vitro establishment of long-life fully functional hepatocytes for BAL development, drug discovery and toxicity testing or even transplantation depends on several factors that need to be integrated into in vitro models. Besides the composition of medium (e.g. growth factors and stabilizing agents), cell–cell communication is improving hepatocyte function (including paracrine communication via soluble factors and direct cell–cell interactions) and the extracellular environment is required as a scaffold. Although many attempts have been followed, a final recommendation what the optimal system is cannot be drawn, and this might also depend on the scientific question to be addressed. However, the feasibility of comparing the above-introduced models is limited. This is mainly due to not-standardized systems, e.g. how long are the cells cultured (weeks to months), and the readout, e.g. urea or albumin synthesis, or CYP activities. Furthermore, the species the primary cells derive from will matter as, for example, human hepatocytes were more stable than mouse hepatocytes in vitro. With respect to co-cultures, only a few publications tested the ratio of parenchymal/non-parenchymal to be used for optimal hepatocyte function. Hepatocytes make up around 65–80 % of total liver cells with, e.g., stellate cells making up around 8 % (Morin et al. 1988). Will the approximately 8:1 ratio be sufficient in in vitro systems to maintain functionality? Data are implying that a lower ratio is required in culture systems. A not well-investigated question yet to be clarified is whether polar, bile canaliculi–forming hepatocytes in a 3D environment might become cholestatic due to impaired bile efflux. This might subsequently affect longevity and stability of hepatocytes in vitro. Another not yet carved out question focuses on throughput capabilities. Usually, the generation of 3D co-culture systems requires a lot of hands-on, non-automated work, binding workforce and limiting broad applications. Systems being developed thus should also be evaluated for usability in high-throughput desiring projects. Nevertheless, co-cultures are superior to single hepatocyte cultures, also in a 3D environment, and a combination of these parameters will definitely enable stable systems for many applications, e.g. for BALs, bioreactors mimicking liver function and expanding of hepatocytes used for transplantation or toxicology tests. For the latter, an ethical motivation should additionally lead to rapid advances of in vitro systems.
5.9 Microfluidic in vitro systems—advances and status for a physiologically relevant sinusoid-like liver cell culture device


Preclinical testing of drug biotransformation and organ-specific toxicity is greatly hampered by the low comparability between in vitro results and the in vivo situation. An important issue during drug development is the occurrence of adverse drug reactions (ADRs) which has led to the removal of several drugs from the market because of CYP inhibition by co-administered drugs. The still existing high drug failure rate in clinical trials calls for novel cell culture devices increasing the predictability of ADME/Tox assays as well as short- and long-term in vitro safety testing of potential drug compounds. Reasons for lack of significance and comparability of standard cell cultures include:
-
Biotransformation reactions in cultured cells are usually much lower than in the same cell types embedded in the organotypical ECM and the specific cellular environment in the native tissue.
-
Organ toxicity is rarely a matter of a single cell type, but rather depends on interactions of several cell types which mutually influence each other in various ways.
-
In addition to the interactions between tissue resident cells, interactions with immune cells may participate and may modify the toxic response according to the activation state of the entire immune system.
-
Since each organ has an individual connection with the brain and is subject to specific innervation, organ toxicity may also be influenced by neuronal activity and various types of neurotransmitters.
-
Furthermore, results obtained from animal derived cells do not adequately reflect the behavior of drugs in humans as a consequence of species differences.
The liver features a distinguished example of the importance of these different levels of intercellular and inter-organ communication for the regulation of its function. There have been no in vitro systems that may account for all different levels of complexity ranging from proper interaction of cells with their ECM up to the multifunctional influence of the innervation by cells of the peripheral and/or central nervous system. Even if complexity is reduced to the first two levels mentioned above, most cell culture systems are far from mimicking tissue-specific interactions between individual cells and the surrounding ECM or neighboring cell types. Sandwich culturing has brought a remarkable step forward (Dunn et al. 1992; Hoffmaster et al. 2004; Nahmias et al. 2007; Pan et al. 2012; Swift et al. 2010), visible particularly in a more pronounced biliary polarity and enhanced biotransformation compared to simple monolayer culture (Kim et al. 2010b; Liu et al. 1999). According to currently used protocols, however, it replaces the relatively sparse, but highly diverse matrix of the liver by a bulky one with only few, strongly overrepresented molecular species. As revealed by microarray and proteomic studies, the global impact of sandwich culturing is very limited (Kienhuis et al. 2007; Rowe et al. 2010) and does not overcome hepatocyte dedifferentiation. Likewise, simple co-cultures are also not a completely satisfying solution, even though they acknowledge the presence and interaction of different cell types and, therefore, may perform better than monocultures (Gebhardt et al. 2003; Guillouzo et al. 1999). Usually, co-cultures are based on random mixing of different cell types (Gebhardt 2002) and, thus, do not account for their specific anatomical relationship. This may lead to a very artificial situation concerning neighborhood relations and relative distances between different cell types, although these parameters may be of utmost importance for organotypic interactions favoring longevity and performance of the cells in situ and in culture. If these parameters are not met, inefficient or aberrant interactions may occur resulting in detrimental influence and malfunctioning of the cells. This unfavorable situation urgently calls for sophisticated novel culture approaches that avoid some, if not all of these problems and lead to improved culture systems with much higher predictive power. Two recent major scientific and technical achievements have paved the way toward a rational and successful novel approach of tissue-like 3D culture, namely (1) the elucidation of morphogen action in liver physiology and metabolic regulation, and (2) microfluidics coupled with dielectrophoretic cell positioning.
Morphogens are signaling molecules which, by definition, play important roles during embryogenesis and organogenesis (Hendriks and Reichmann 2002; Hogan 1999). Usually, they are produced by small groups of cells arranged in specific signaling centers. The morphogens spread from there in a gradient-like fashion over relatively short distances of less than 20 cells. Interestingly, the majority of these signaling factors are proteins that belong to a relatively small number of conserved multiprotein families, in particular the BMPs, EGFs, FGFs, Hedgehogs and Wnts. Concerning liver, Wnt factors play a particularly important role, because canonical Wnt signaling has been identified as the main determinant of zonation of the liver parenchyma (Benhamouche et al. 2006; Burke and Tosh 2006; Gebhardt and Hovhannisyan 2010). Proof of this fact has been obtained by knockout of the tumor suppressor gene, APC, which is a negative regulator of β-catenin activity (Benhamouche et al. 2006; Colnot et al. 2004). APC protein in liver shows a gradient decreasing from the periportal to the pericentral zone (Benhamouche et al. 2006). Thus, its knockout leads to a pericentralization of hepatic functions, e.g. the extension of the small pericentral glutamine synthetase-expressing zone to the entire parenchyma (Benhamouche et al. 2006; Gebhardt and Hovhannisyan 2010). Conversely, studies on the knockout of β-catenin revealed the opposite influence on zonation, i.e. the periportalization of hepatic functions (Sekine et al. 2006; Tan et al. 2006). These studies provided compelling evidence that expression of β-catenin is a necessary condition for the expression not only of major enzymes of ammonia detoxification, but also of many CYP isoforms in the liver (Braeuning 2009; Loeppen et al. 2005; Sekine et al. 2006). In particular, it could be shown that β-catenin not only regulates basal expression of drug-metabolizing enzymes but also determines the magnitude and hepatic localization of responses to xenobiotic inducers in vivo (Braeuning et al. 2009; Braeuning and Schwarz 2010b). Taken together, these findings imply that conservation of biotransformation capacities in vitro is impossible without maintenance of proper functioning of the Wnt/β-catenin signaling pathway between hepatocytes and NPCs. Besides controlling hepatocellular function in the adult liver, Wnt/β-catenin signaling also plays an important role in liver development, hepatocyte proliferation and maturation, and in cell fate decision of progenitor cells (Apte et al. 2007; Decaens et al. 2008; Hu et al. 2007). These aspects are also of highest relevance for establishing and maintaining a tissue-like situation in vitro. It is obvious that cultured liver cells always start and reside in an artificial environment reflecting an injured or disorganized tissue rather than a healthy one. Therefore, any signals that aid in certain routes of regeneration or “healing” seem welcome. Again, it can be expected that morphogen signals like Wnt/β-catenin signaling can exert their beneficial effects the better the closer the cellular arrangement reflects the in situ situation.
Much progress has been made in recent years on microfluidics and cell positioning techniques. Ever since the establishment of successful hepatocyte cultures, culture systems enabling continuous perifusion with culture medium have proved advantageous over standard culture in flasks or wells requiring sequential changes in culture medium (Gebhardt and Mecke 1979a; Gebhardt et al. 2003). In particular, perifusion systems allow the maintenance of hormones and drugs at very low steady-state concentrations and enhance metabolic performance of the hepatocytes. Likewise, the delivery of oxygen may be improved by perifusion. Furthermore, perifusion offers a way of diluting or removing toxic metabolites, such as bile acids in higher concentrations. All these features may support longevity and phenotypic stability of the cultures (Gebhardt et al. 2003). On top of that, perifusion aids in determining effective concentrations, kinetic constants and other parameters characterizing biotransformation and toxicity (Gebhardt and Fischer 1995; Gebhardt et al. 1996). Following the rapid progress in manufacturing of tiny channels and almost any kind of microstructures on biocompatible plastic material, microfluidic systems have become increasingly popular for cell culture. This technology allows the 3D cellular environment to be mimicked on a simple microchip. Thus, complex “artificial micro-organ” cultures that match well the size of cells and blood vessels of the human liver can be realized. Such perfusion cultures are able to avoid the disadvantages of short-term incubation, metabolite accumulation and non-steady-state conditions to improve viability, life span and metabolic activity of cultured hepatocytes (Takeshita et al. 1998; Gebhardt and Mecke 1979b; Allen et al. 2005; Khetani and Bhatia 2008; Novik et al. 2010).
One of the first feasibility studies to engineer hepatic tissue was published in 1997 and featured a mixture of primary hepatocytes and endothelial cells on biodegradable polymers (Griffith et al. 1997). Several limited liver cell models were reported, for instance, the microfluidic 3D Hepa Tox Chip, which is based on multiplexed microfluidic channels where a 3D microenvironment is engineered in each channel to maintain hepatocyte functions (Toh et al. 2009). The device utilizes physical restraints (micropillars) for mimicking more or less adequately the fenestrated endothelial cells, and an animal-derived extracellular matrix to retain the cells and to support a 3D aggregation. A similar approach was achieved by surrounding a culture area comprising rat primary hepatocytes at high density by a parallel panel of microfluidic channels replacing an endothelial cell layer for physically separating the hepatocytes from media perfused vessels (Lee et al. 2007). Both cell culture devices do not describe the restoration of membrane polarity by the formation of bile canaliculi.
A further developed design consisted of a cell compartment in the middle flanked by two microchannels with additionally micropillars as a barrier (Goral et al. 2010). The microfluidic device was used to promote and maintain 3D tissue-like cellular morphology and cell-specific functionality of primary human hepatocytes. The integration of bottom-patterned microstructures in the cell culture channel resulted in minimized cell spreading and cell surface interactions which support the re-establishing of cell polarity, demonstrated by active transport of fluorescein diacetate via MRP2 transport protein in the bile canalicular structures. In all approaches discussed, the influence of liver NPCs was neglected.
Primary hepatocytes cultures co-cultured with growth factor–secreting 3T3-J2 fibroblasts (Khetani and Bhatia 2008) in a miniaturized multi-well culture system for human liver cells was demonstrated as a valuable model for elucidating phase I and phase II biotransformation activity over several weeks. They use polydimethylsiloxane (PDMS) stencils consisting of 300-μm-thick membranes with trough-holes at the bottom of each well in a 24-well mold. Hepatocytes adhere to previously adsorbed collagen I, thus forming micropatterned clusters which were subsequently surrounded by mouse 3T3-J2 fibroblasts. The co-cultures were able to express bile canicular transport proteins. Further progress was made by applying dielectrophoretic forces to sorting and active cell positioning in microfluidic devices (Docoslis et al. 1999; Ho et al. 2006a; Wang et al. 1999b; Archer et al. 1999; Sankaran et al. 2008). Of note, Docoslis et al. (1999) demonstrated that positive dielectrophoresis can be safely used to retain viable cells in perifusion cultures which provide a high degree of cell separation between viable and non-viable cells without any adverse effects on the cultured cells over long periods of time. A first approach for active cell positioning to mimic liver-like structures was demonstrated by positive dielectrophoresis on a concentric-stellate-tip electrode array (Ho et al. 2006a). In this model, HepG2 cells and HUVECs were radially oriented to form stellate-type pearl chains towards the center of the concentric electrode array. However, this design enables only a 2D structure, and organ-typic perifusion is not feasible. The mentioned examples show clearly that microfluidic technology is a practical tool to build up artificial microorgans.
The considerations above have prompted the establishment of a novel culturing approach for liver cells, combining a microfluidic system with a liver-like cellular arrangement. Extensive in silico modeling and optimization processes combined with intensive experimental studies (Schutte et al. 2010, 2011b) resulted in a semi-automated 3D culture system mimicking hepatic sinusoids, called the HepaChip®. On an area the size of a microscope slide, the HepaChip® features a system of branching microchannels supplying and draining 8 microchambers (Fig. S2; see ESM). Each microchamber contains 3 parallel cell assembly ridges with a length of 500 μm and a width of 100 μm, approximately the mean length of sinusoidal structures of the human liver. The ridges are also parallel to the flow direction, mimicking the portal and central area along the porto-central axis in the liver lobule in vivo (Gebhardt 1992). Additional micro-pillars located at the front and back of the ridges represent flow barriers which provide reduced flow velocity and a reduction in friction forces acting on the settled cells, imperative for long-term culture conditions of microfluidic hepatocyte cultures. Just before cell positioning, the inner surfaces of HepaChip® were modified to bind human collagen IV exclusively to the cell culture regions, whereas other areas become non-adhesive for cells. To carry out active cell positioning, positive dielectrophoresis was used dragging the cells toward the assembly ridges. To this end, each cell chamber comprises two electrodes at the outer chamber wall which span the full length of a ridge. After turning on the electric filed, a field of inhomogenity results because of the microstructured cell chambers, creating highest dielectrophoretic forces at the edges of the cell assembly ridges where the channel’s restriction is maximal. Thus, cells are trapped out of the flow to the top of the assembly ridges.
Positioning of the cells by dielectric forces is a sequential process that serves not only the correct localization on the ridges, but also the separation of viable cells from non-viable contaminants (Docoslis et al. 1999). First, the viable hepatocytes only are attracted to the coated surface of the ridges by applying an AC electric field with approximately 200 VSS and 350 kHz. After positioning and switching to normal culture medium, the hepatocytes start to attach to the collagen matrix and establish first contacts with neighboring cells (Fig. 19). Second, positioning is continued by assembling sinusoidal endothelial cells in the same manner. The sequential process favors the attachment of the majority of the endothelial cells to the right and left border of the hepatocyte cord on the ridge. Only some few endothelial cells may reach the inner surface of the cords (Figs. 19, 20). Frequently, endothelial cells may form pearl chains that stretch into the lumen between the ridges, but it appears that later in the process, these chains bent back toward the borders and, thus, place most endothelial cells in an ideal position. The morphology of such artificial sinusoids does not change over several days; moreover, they retain a robust volume ratio of nucleus to cytoplasm, unusual in common monolayer cultures. Clearly visible slender spaces between hepatocytes indicate the formation of bile canaliculi (Fig. 20), an indicator of re-established cell polarity. Both characteristics are supported by heterotypic cell–cell interactions of the bordering and covering co-cultured endothelial cells, depicted by the typical granular pattern of vWF-positive endothelial cells in the artificial sinusoids (Fig. 20).

Cell assembly of hepatocytes and liver endothelial cells in HepaChip®. a Assembly of primary mouse hepatocytes onto the cell assembly ridges in less than 2 min. b After 4-h culture, sparsely assembled cryopreserved human hepatocytes are labeled with Calcein-green fluorescence demonstrating the initial cord-like arrangement. c Assembly of cryopreserved mouse liver endothelial cells (Calcein-red) onto 4-h cultured hepatocytes (Calcein-green)

Sinusoid-like shape of a 96-h-old hepatocyte/endothelial cell culture in HepaChip®. a Micrograph overlay of DAPI fluorescence and transmission microscope images. b Immunofluorescence image of von Willebrandt factor (green) decorated endothelial cells and DAPI (blue) nuclei. c Enlarged receptive of image B showing clearly an endothelial cell characteristic granular pattern of von Willebrandt factor in HepaChip® “sinusoids”
The HepaChip® in vitro microfluidic system has been tested for activities of several phase I and phase II metabolizing enzymes (Figs. 21, 22) and compared to standard 96-well plate co-cultures of hepatocytes and endothelial cells. Freshly isolated mouse hepatocytes and cryopreserved liver endothelial cells have been applied for short-term incubations up to 3 h each day with a substance cocktail containing 10 μM 7-hydroxycoumarin, 20 μM testosterone and 20 μM phenacetin in Williams E medium supplemented with 0.1 μM dexamethasone. Incubations of hepatocytes without test substances were also included. Data on testosterone hydroxylation and phenacetin deacetylation to acetaminophen by CYP3A4 and enzymes CYP1A2, respectively, are summarized in Fig. 21; data on 7-hydroxycoumarin-sulfate formation by sulfotransferase and 7-hydroxycoumarin-glucuronide formation by UGTs are summarized in Fig. 22. From these data, it is evident that activities in HepaChip® cultures are at each time point significantly higher than in standard cultures. These results fit well with the increased urea and albumin secretion rate (Fig. 23) which is obvious higher in HepaChip® compared to standard 96-well plate cultures.

Primary mouse hepatocytes and liver endothelial cells: Phase I biotransformation in HepaChip® and standard 2D cell cultures. CYP3A metabolism was measured using testosterone hydroxylation (a) and CYP1A2 activity using phenacetin metabolism to acetaminophen (b). Data represent mean values ± SD of four mice

Primary mouse hepatocytes and liver endothelial cells: Phase II biotransformation in HepaChip® and standard 2D cell cultures. Sulfotransferase (a) and UDP glucuronosyltransferase (b) activities were measured using 7-hydroxycoumarin as a substrate (b). Data represent mean values ± SD of four mice

Primary mouse hepatocytes and liver endothelial cells: urea (a) and albumin (b) secretion in HepaChip® versus standard 2D cell cultures. Data represent values ± SD of four mice
In its current version, the HepaChip® has already demonstrated an unprecedented improvement of structural and metabolic stability and performance. However, because of its sophisticated and versatile design and functionality, the HepaChip® in its current format is still not at the end of its capabilities. Several build-in features may allow and support further efforts to implement even higher levels of complexity as have been currently reached. For instance, dielectric positioning may allow an easy inclusion of additional liver cell types such as Kupffer cells and NK cells. The fact that the fraction of NPCs from ordinary cell preparations from human liver provides the source of endothelial cells currently used in the HepaChip® renders the goal achievable to include other cells from the NPC fraction in the positioning process. Furthermore, the HepaChip® may allow an approach to the problem of biliary drainage that currently is not yet solved by any existing hepatic culture system. As mentioned above, the ridges carrying the sinusoidal cell cords are flanked by plastic pillars for the sake of optimized medium flow. These pillars, however, in particular those placed at the entrance of the medium stream, may also allow the imitation of “portal fields” where drainage of bile could be established in the natural anatomic location. Of course, such an endeavor seems not easily achievable, but in contrast to other culture systems the design of the HepaChip® at least opens the possibility to approach this challenge. Besides this cellular and structural complementation, other functional aspects merit attention. First, the automated supply of culture medium can easily be adapted to mimic various physiologic conditions of the blood such as postprandial and starvation states or circadian cycles of hormone and metabolite concentrations. Second, there are a number of biocompatible materials suitable for microfluidic devices, partially used in medical engineering with a high oxygen transfer rate. For instance, the HepaChip® device is covered and closed with a thin cyclic olefin copolymer, to enable adequate oxygen transfer into HepaChip® cultures. Artificial oxygen carriers developed as blood substitutes to transfusion medicine can further support and increase oxygen delivery if needed (for an extensive overview see Simoni 2012). Third, the system already has attractive analytical possibilities, e.g. intermittant periods of perifusion with drug cocktails for repetitively determining biotransformation capacity. Even here, the HepaChip® could be equipped with additional sensors and analytical tools working online and allowing time-dependent measurements, for example, integrated oxygen sensors measuring the cell respiration allow the calculation of LC50s in cytotoxicity testing and require only minimal handling and no additional agents (Deshpande et al. 2005).
5.10 Bio-artificial livers


Bioengineering an artificial liver is a major goal in biotechnology with a huge potential impact on regenerative medicine and toxicology (e.g. in ADMET assays). Unpredicted liver toxicity is the main cause of late-stage failure and withdrawal of drugs from the clinical development or even from the market (Pampaloni et al. 2007). Species-dependent metabolism prevents an accurate prediction of toxicity with laboratory animals (e.g. rodents, fish). Cell-based toxicity assays with human cells are the obvious alternative. Primary hepatocytes (e.g. human hepatocytes cultured in vivo in receptive transgenic mouse, e.g. from Yecuris Corporation, USA, see also Chen et al. (2011)) and immortalized liver cell lines (e.g. HepaRG) are available from companies in bulk amounts. However, hepatocytes lose their liver-specific functions within 72 h when cultured on conventional 2D plates (Schuppan et al. 2001). This is due to the non-physiological microenvironment of 2D substrates. Thus, establishing culture conditions that mimic a liver micro-environment is a major issue in drug development. In order to bioengineer a functional artificial hepatic tissue, the physiological interactions between hepatocytes and NPCs, as well as the interactions between the liver-specific extra-cellular matrix and hepatocytes, must be re-established.
Current liver bioengineering strategies are based on retaining the actual architecture, cellular composition, ECM composition, mechanics and physicochemical gradients in the liver. Early efforts have shown that hepatocytes and NPCs extracted from mice liver spontaneously reorganize to form functional structures (Mitaka et al. 1999). More recent approaches mimic one or more specific aspects of the liver architecture, namely heterotypic cellular composition, culture in ECM gels and the sinusoid plates compartmentalization (Nahmias et al. 2007). An overview of the commercially available bioengineered liver constructs and of the corresponding mimicked biomimetic cues is given in Table 7. Commercial liver constructs are mainly employed for drug and toxicity screening.
One of the basic approaches to establish a liver-specific microenvironment is the co-culture of hepatocytes with NPCs (Bhatia et al. 1999). Culturing the different liver cell types in close proximity allows for heterotypic cell–cell communication through cytokines and chemokines. A recent publication reported the culture of primary hepatocytes on circular ECM (collagen type I) spots with a diameter of about 500 μm. Stromal cells (3T3-J2 fibroblasts) were subsequently seeded in the space between the spots (about 1,200 μm, center-to-center). The cells were cultured in a 24-well plate format, which is suitable for drug screening (Khetani and Bhatia 2008). In another paper, circular spots of fibroblasts (3T3-J2) were used as a feeder layer for a second hepatocytes layer deposited on the top. This layered co-culture approach allows for an increased heterotypic cell–cell contact area, and for an improved oxygen supply to the cells (Cho et al. 2010). Both types of micro-patterned co-cultures favor liver-like differentiation and liver-specific metabolism of the hepatocytes. This is confirmed by the secretion of albumin and urea, the expression of CYPs, the formation of bile canaliculi and the polygonal and densely packed phenotype of the hepatocytes. Micro-patterned cell islands on planar substrates can be spotted over an extended area. Thus, this technology should be extendable to large-scale ADME/Tox screenings (see Table 7, Hepregen). However, micro-patterned co-cultures do not precisely mimic the layered 3D liver architecture. Flat and hard substrates are employed. Moreover, fibroblasts are mostly employed as co-cultured NPCs. However, fibroblasts are not abundant in the liver acinus. They mainly populate the periportal region. Myofibroblasts are found in the space of Dissé (Table S1; see ESM). The use of fibroblasts as a NPC type limits the power of simple co-cultures in mimicking the liver functionality. LSECs are the second most abundant cell type in the liver (see Table S1, ESM) and should be employed in co-cultures in order to improve the predictive ability of this type of bioengineered liver.
Sandwich cultures of hepatocytes have been established more than twenty years ago (Dunn et al. 1991). In the sandwich approach, hepatocytes are seeded on a collagen I substrate and subsequently overlaid with a second collagen layer. Under these conditions, the hepatocytes assume their typical liver polarity, with the basolateral side facing the collagen layers and the apical side facing the bile canaliculi (Fig. 24a). The conventional sandwich culture has been widely adopted by the pharmaceutical industry. A recent improvement of the sandwich method seeds hepatocytes in micro-molded collagen “pits” with a diameter of about 80 μm, which are then overlaid by a second collagen layer (Matsui et al. 2012) (Fig. 24b). The hepatocytes in the cavities develop a more extended canalicular network compared to conventional sandwich cultures. A further advantage is that biliary metabolites can be more easily recovered from the enlarged canaliculi with a micro-pipette. Nahmias et al. (2006a) have developed a sandwich system in which a fluorocarbon oxygen carrier is embedded within the collagen I matrix. A physiological oxygenation of the hepatocytes during the seeding phase in the gel is ensured by the carrier. This results in much higher hepatocyte viability and CYP activity, as well as increased albumin and urea levels.

a Hepatocyte polarization in 2D and 3D collagen gel. In the collagen “sandwich” gel, hepatocytes assume a typical polar structure, with multiple basolateral and apical compartments. The basolateral sides face the collagen layers and the apical sides face the bile canaliculi. By contrast, hepatocytes on collagen monolayers are flattened and form actin stress fibers. Adapted from (Dunn et al. 1991). b Formation of canaliculi in micropatterned sandwich culture. The hepatocytes are cultured in micromolded collagen pits of increasing diameters. Following 2 days in culture, the hepatocytes have formed a canalicular network (green staining). The canalicular network appears more organized in the pits than in a conventional non-patterned sandwich culture. A pit diameter of 80–100 µm is optimal for canaliculi formation. Scale bar 100 µm (from Matsui et al. 2012)
The culture of hepatocytes within microfluidic devices allows the integration of multiple biological, structural and physical cues (Huh et al. 2011). Liver-specific cues derived from cell–cell contacts (Kane et al. 2006), blood hydrodynamics (Kane et al. 2006; Carraro et al. 2008; Toh et al. 2009), and physicochemical gradients of oxygen and plasma components (Kane et al. 2006; Nahmias et al. 2006a; Lee et al. 2007; Toh et al. 2009; van Noort et al. 2009) have been applied with microfluidic systems. Kane et al. (2006) have combined micro-patterned co-cultures of hepatocytes and fibroblasts with a microfluidics system consisting of an 8 × 8 chambers array. The system features two separated channels for medium perfusion and oxygenation. This separates the effects of medium exchange and shear stress from that of oxygenation on hepatocyte functionality. A stable and sustained production of urea and albumin was measured for 32 days in the system. Carraro et al. (2008) mimicked the liver parenchyma by seeding hepatocytes in a microfluidic capillary network reproducing the length scale and flow parameters of the sinusoids. The hepatocytes are separated from the artificial sinusoids by a nanoporous polymer membrane. The nanopores have the same size of the sinusoidal fenestrae and allow the exchange of nutrients, oxygen and metabolites. The membrane is coated with collagen I in order to mimic the space of Dissé. The collagen-coated membrane directs the formation of the basal side of the hepatocyte facing the nanopores. This mimics the liver-specific hepatocytes polarization. The system is scalable and could be developed further to an artificial liver suitable for clinical application (e.g. a liver assisting device that supports patients waiting for a liver transplantation). Toh et al. (2009) have reproduced the sinusoidal architecture in a multiplexed device. The liver plates have been mimicked by seeding the hepatocytes in chambers enclosed by micropillars (Fig. 25a). The space between micropillars mimics the fenestrae. The culture medium flows in perfusion channels surrounding the artificial plate. In vitro toxicity data obtained with this system correlate well with the corresponding in vivo data. A similar strategy has been employed by Lee et al. (2007). The fenestrated endothelium was reproduced by parallel channels with a width of 2 μm and a height of 1 μm (Fig. 25b).

Mimicking liver plates and fenestrated endothelium by seeding the hepatocytes in chambers enclosed by microfabricated pores. a1 Schematic representation of the system developed by Toh et al. (2009). An array of micropillars separates the microchannel in the central compartment containing the seeded hepatocytes and two-side compartments with the perfusing media. a2 Transmitted light image of seeded hepatocytes. b1–2 SEM micrograph and schematic representation of the microfluidic artificial sinusoid. The central channel containing the hepatocytes and the outer flow channel have a width of 50 µm and a height of 30 µm. b3a–3b phase-contrast and epifluorescence images (calcein and ethidium homodimer-1 staining) of hepatocytes seeded at low density. The images indicate that hepatocytes have a low viability at low cell density. b3c–d By contrast, hepatocytes seeded at high density are viable, as visible from the calcein staining (green) (from Lee et al. 2007)
Perhaps the most intriguing approach to liver bioengineering exploits the propensity of cells to histotypic self-organization. It is well known that a mixture of different types of isolated cells has an intrinsic ability to self-organize. Cells of the same type tend to coalesce in a mixture following a typical length and time-scale. This ability relies mainly on a differential cell–cell adhesion. This principle can be exploited in liver bioengineering. Nahmoas et al. (2006b) have generated vascular structures formed by seeding endothelial cells on basement membrane ECM. Hepatocytes seeded in contact with the bioengineered vasculature migrate and adhere to the vessel. Structures resembling the liver sinusoids, with hepatocyte plates, bile canaliculi and a vascular lumen are formed by the self-organization of the hepatocytes and the endothelial cells (Fig. 26). These bioengineered sinusoids maintain CYP expression and activity, as well as an expression and secretion rate of albumin stable for over 2 months. A further approach to the controlled self-assembly of functional liver constructs is the formation of spheroids, described in detail in section “Hepatospheres.” The maximum diameter that can be reached by liver cell spheroids is limited by the diffusion of oxygen and nutrients. A necrotic core develops in a spheroid as its diameter exceeds 200–300 μm. Several approaches have been tested in order to overcome the size limitation of the spheroids and obtain larger bioengineered constructs. Inamori et al. (2009) have obtained a large vascularized liver construct by self-assembly of hepatocyte spheroids coated with endothelial cells. Spheroids with a diameter of 100–150 μm were obtained from rat hepatocytes. The spheroids were first coated with collagen I by immersion in a diluted solution. The collagen-coated hepatocyte spheroids were then co-cultured with endothelial cells (HUVEC). Due to the collagen barrier, the HUVEC covered the spheroid surface without invading it. Subsequently, the HUVEC-coated spheroids were packed in a plastic hollow fiber and cultured further. After nine days of culture, the spheroids were fused with each other and the endothelial cells have formed a dense vascular network (Fig. S3; see ESM). This is an interesting approach to bioengineer the liver parenchyma by employing a scaffold-free self-assembly strategy. A similar approach was pursued (Kelm et al. 2006) to engineer vascularized cartilage by culturing spheroids in large custom-shaped agarose molds.

Self-assembly of sinusoid-like structures in vitro by co-culturing hepatocytes and endothelial cells. Endothelial cells were seeded on Matrigel. The endothelial cells rapidly formed tubes. Subsequently, freshly isolated hepatocytes were randomly seeded in the culture. The hepatocytes directionally migrated toward the artificial vasculature and adhered to it. The image shows hepatocytes decorating an endothelial cell tube at day four in co-culture. Double-immunofluorescence staining for endothelial cells (CD31, red) and hepatocytes (CK-18, green). Scale bar 200 µm (from Nahmias et al. 2006b)
Decellularization is a new approach to remove cells from an organ, preserving the original ECM functionality and 3D architecture. Recently, decellularization was applied to rat liver yielding a scaffold with intact ECM and vasculature (Uygun et al. 2010). The scaffold was repopulated with rat hepatocytes and endothelial cells. This bioengineered liver graft was then successfully transplanted to a recipient rat. This model can be used to investigate liver development and regeneration, and can ultimately be employed for transplantation in humans, as claimed by the company Miromatrix (Table 7).
6 Cryopreservation of hepatocytes and recent developments


The reasons for cryopreserving human hepatocytes are manifold; however, for a long time, cryopreservation was a very difficult process and mostly associated with a high loss of cell viability after thawing. In the 1980s and 1990s, huge strides were made toward the successful freezing and storage of human hepatocytes such that they were not only viable but could also attach in culture after thawing. These advancements have meant that cryopreserved hepatocytes can be used for assays in which previously only fresh cells could be used, for example, drug-metabolizing enzyme induction studies and bile transporter function assays (Kaneko et al. 2010; Bi et al. 2006). Cryopreserved human hepatocytes are also a valuable tool that can be used in a multitude of other different applications ranging from pharmacotoxicology studies to cell transplantation in humans (Donato et al. 2008a; Gomez-Lechón et al. 2003, 2008; Lahoz et al. 2008; Li et al. 1997). Commercial suppliers of hepatocytes now offer plateable human hepatocytes from multiple donors, together with the assurance that they will function in such assays.
6.1 Further improvement of cryopreservation techniques
6.1.1 General considerations for successful cryopreservation
Although the confidence in cryopreservation methods has reached a level that regulatory agencies accept fresh and cryopreserved cells data interchangeably (Huang and Stifano 2006), research continues to optimize this process further (Gomez-Lechón et al. 2003; Sosef et al. 2005). Several protocols have been established, according to which hepatocytes can be cultured and cryopreserved as a suspension or as a sandwich culture configuration (Gomez-Lechón et al. 1984; Koebe et al. 1990; Novicki et al. 1982; Dunn et al. 1989). One technique has been published by Dunn et al. (1989) and Koebe et al. (1990), which demonstrated that rat hepatocytes that were cultured and cryopreserved in a sandwich gel culture were able to maintain their phenotypic properties and functionalities for a longer period of time than hepatocytes in suspension. In addition, Sugimachi et al. (2004) demonstrated that cryopreserved rat hepatocytes retain their function and metabolism when placed in co-culture to the same extent as freshly isolated primary hepatocytes. Over the years, intensive research into the development of an optimal cryopreservation protocol has been performed, and key parameters that influence the success rate of this process are constantly under investigation. To date, there are a few critical factors that are crucial for a successful cryopreservation and a subsequent recovery of hepatocytes. Full details of cryopreservation methods have been reviewed by Hewitt (2010) and Stéphenne et al. (2010). First of all, following the isolation process, a high quality of hepatocytes is the first vital step toward a successful cryopreservation process and the quality of hepatocytes can be impaired by a high fat content, prolonged warm ischemia or mishandling or inappropriate storage of the liver (Terry et al. 2005; Gomez-Lechón et al. 2006). In addition, the different sources of tissue from which human hepatocytes have been isolated and are also an important factor that has to be considered, as Terry et al. (2005) demonstrated that hepatocytes originally isolated from non-heart-beating donors and steatotic donors are more sensitive to the cryopreservation process than hepatocytes that have been originally isolated from a piece of resected liver tissue. Moreover, additional factors from the patient’s medical history (for example drug intake, smoking, diabetes, obesity) could also influence the successful process of cryopreserving hepatocytes. However, these studies have not been carried out so far. There is also evidence by a few research groups that shows that a pre-incubation of hepatocytes as a suspension culture after their isolation greatly improves their recovery after cryopreservation (Darr and Hubel 2001; Hubel et al. 2000; Gomez-Lechón et al. 2006). Furthermore, several groups investigated the beneficial effect of anti-oxidants within this pre-incubation medium and concluded that the presence of anti-oxidant agents greatly helps the recovery of hepatocytes following thawing (Gomez-Lechón et al. 2008; Terry et al. 2006; Silva et al. 1999). In most studies, hepatocytes are cryopreserved at a concentration ranging between 106 and 107 cells/ml and it has been demonstrated previously that the use of the UW solution supplemented with 10 % human albumin or fetal calf serum as a freezing medium has a beneficial effect on hepatocytes after thawing (Terry et al. 2010; Arikura et al. 2002; Adams et al. 1995). Regarding the cryoprotectants, DMSO is universally used in a final concentration of 10 % and represents the gold standard cryoprotectant. Furthermore, Gomez-Lechón et al. (2006) showed that the addition of a non-permeating cryoprotectant known as polyvinylpyrrolidone (PVP) to the freezing medium already containing DMSO significantly improves the cell viability following thawing. The rate at which hepatocytes are frozen is also critical for a successful cryopreservation and a successful recovery of the hepatocytes. Most cryopreservation protocols use a slow cooling procedure before the cryovials are stored in liquid nitrogen (Coundouris et al. 1993; Dou et al. 1992; Alexandre et al. 2002). Finally, a fast thawing procedure at 37 °C is also required in order to avoid intracellular ice formation, which results in cellular damage (Harris et al. 1991). The following sections touch on a number of aspects of cryopreservation which have been explored in the past decade.
6.1.2 Storage of 2D and 3D cultures
Although the majority of researchers freeze cell suspensions, some continue to optimize the cryopreservation of in situ monolayers. Early attempts to freeze hepatocytes as sandwich cultures resulted in varied success (Kafert-Kasting et al. 2006; Koebe et al. 1996, 1999) due to extensive loss of viability of cells which were trapped in the gel. More recent attempts by Miyamoto et al. (2010) using collagen vitrigel membranes showed significant improvement in comparison with cells cryopreserved without the collagen vitrigel membrane; however, the recovery of living rat hepatocytes after cryopreservation was only 26.7 %. Despite the limited success of this method, the concept of freezing pre-cultured cells has continued, possibly as a result of the increased use of 3D culture formats since more complex structures are considered to be more predictive of in vivo processes. Magalhães et al. (2012) used two different concepts of freezing, namely vitrification and cryopreservation to store cell suspensions as well as monolayer and spheroid cultures. Vitrification involves the solidification of a supercooled liquid by using high concentrations of cryoprotectant and a rapid cooling rate (>40 °C/min) to produce a “glassy state,” rather than a crystalline state. These authors showed that cryopreservation and vitrification differ with respect to the degree of mechanical stress they cause to the cells, reflected in changes to the actin cytoskeleton and levels of apoptotic markers. For example, the cytoskeletal structure of cryopreserved cells (either suspensions or monolayer or spheroid cultures) was disrupted, while vitrification did not markedly alter cytoskeletal structure or induce apoptosis. This study concluded that cell-to-cell contact is beneficial in the maintenance of viability post-cryopreservation and that the vitrification approach was far superior to those of conventional freezing when applied to 2D and 3D hepatocyte-based engineered cultures. Others have employed encapsulation methods to improve the vitality of human hepatocytes after cryopreservation. For example, Hang et al. (2010) prepared human hepatocytes by first pre-incubating for 12–24 h and then microencapsulating them in alginate-poly-l-lysine-alginate. Compared to cells which had been immediately cryopreserved, encapsulated hepatocytes exhibited higher mRNA and protein levels in attached cells, and higher secretion of albumin and urea levels after thawing. The protective effect is reported to be due to the alginate microencapsulation protecting the hepatocytes from physical damage caused by the growth of extracellular ice crystals and the alginate gel maintaining the HNF level (Kusano et al. 2008) and retention of detoxifying enzymes (Canaple et al. 2001). Encapsulation also has a general protective effect on of hepatocytes in culture, such as maintenance of specific functions (transaminase activity, urea synthesis and protein secretion (Stéphenne et al. 2010), suggesting that this culture format would be amenable to cryopreservation.
6.1.3 Cryoprotectants and supplements
The most common cryoprotectant is DMSO and it is unlikely that many researchers will deviate from this recipe. However, Grondin et al. (2009) reported on the use of a crude wheat extract as a promising alternative to DMSO. Using partially purified wheat extracts or recombinant wheat freezing tolerance-associated proteins (such as WCS120, TaTIL, WCS19 and TaIRI-2), the post-thaw viability (77–93 %), attachment efficiency (77 %) and CYP activities (CYP1A1/2, CYP2C6, CYP2D2 and CYP3A1/2) of cryopreserved rat hepatocytes were comparable to those of freshly isolated cells. The advantage of using wheat proteins as cryoprotectants is that they are non-toxic, natural products that do not require animal serum, and are economical and easy to prepare.
While the basic freezing medium components remain constant (DMSO, basal medium and serum), there have been a number of reports of additional supplements to the cryoprotectant medium which claim to result in higher post-thaw viabilities (reviewed by Hewitt 2010). More recently, Galbiati et al. (2010) reported a beneficial effect of pre-incubating hepatocytes with unconjugated bilirubin, a physiological antioxidant. Another natural supplement, platelet lysates, was also shown to improve hepatocyte recovery (Tolosa et al. 2011a). This rather unusual supplement resulted in hepatocytes exhibiting higher expression of adhesion molecules, higher attachment efficiency and cell survival as well as decreased apoptosis. They also showed that ATP levels and metabolic enzyme levels were close to those in fresh hepatocytes. Others have reported beneficial effects of an ice nucleating agent, crystalline cholesterol; to reduce supercooling and subsequent cryoinjury (Massie et al. 2011), while Miyamoto et al. (2010) described the effectiveness of the inclusion of maltose and a silk-derived high molecular protein, sericin, on the attachment of hepatocytes. Regardless of the supplement, the need for animal component-free media has been of a greater importance, either due to transport requirements (and avoidance of swine fever/CJD issues) or clinical reasons such as a lack of tolerance to animal derived products (Selvaggi et al. 1997).
6.1.4 The freezing apparatus
Most researchers use either a programmable freezing machine or the more basic isopropanol “Mr Frosty” container to freeze their cells. However, for clinical use, liquid coolants for cryopreservation and storage should be avoided to minimize contamination of the cells. To address this, Massie et al. (2011) compared a cryogen-free cooler with a nitrogen vapor-controlled freezer. They cryopreserved alginate-encapsulated liver cell spheroids using both freezing machines. Viability, cell numbers and function were comparable between the two methods, suggesting that cryogen-free coolers offer a promising alternative to liquid nitrogen-coolant cryopreservation for cells designated for clinical use.
6.1.5 Post-thaw methods
Post-thaw methods have remained largely unchanged but are divided into two distinct methods: either thawed cells (still containing a few ice crystals) are placed on ice and the DMSO gradually diluted by sequential addition of ice-cold medium or the cells are thawed until no ice remains in the vial and then transferred into a large volume of warm (37 °C) medium, which rapidly removes DMSO. Early methods using the former technique involve the use of glucose to off-set the osmotic changes during DMSO removal but supplementation of thawing media with glucose has also been shown to significantly decrease caspase-3 activation and increase the preservation of adhesion molecules, suggesting that this basic addition may be advantageous in more than one way (Tolosa et al. 2011a).
6.2 Effect of cryopreservation on transporter function
Cryopreserved hepatocytes are routinely used for assessment of drug metabolism in the pharmaceutical industry. Access to human hepatocytes is critical due to the large variation in drug-metabolizing enzyme expression across species such that animal hepatocytes often do not reflect human responses or functions. The optimization of hepatocyte cryopreservation has therefore been instrumental in improving the capability to predict metabolic clearance, drug–drug interactions and metabolite formation in man. In general, phase I metabolism, e.g. CYP activities, as well as the phase II enzymes e.g. UGTs, that have been investigated are well preserved after cryopreservation (McGinnity et al. 2004; Jacobson et al. 2007). By contrast, the GSH status may be compromised which may explain the sometimes lower activity of GSH conjugation observed in cryopreserved hepatocytes (Sohlenius-Sternbeck and Schmidt 2005).
More recently, drug transporters have emerged as important determinants of drug disposition. Several solute carriers and ATP-binding cassette transporters in the liver have an impact on the disposition of their drug substrates, as reviewed by the “International Transporter Consortium” (Giacomini et al. 2010). Regulatory authorities are currently reviewing their guidelines, and among the liver transporters, OATP1B1 (SLCO1B1), OATP1B3 (SLCO1B3), MDR1 (ABCB1) and BCRP (ABCG2) are on the list of transporters to be assessed in drug development. In addition, EMA recommends assessment of OCT1 (SLC22A1) and BSEP (ABCB11) (FDA draft guidelines and EMA guidelines).
Functional activity of clinically important drug-transporting solute carriers has been assessed in human and rat cryopreserved hepatocytes. In general, NTCP (SLC10A1), OATP1B1/1B3 (SLCO1B1/3) and OCT1 (SLC22A1) have been reported to be functional after cryopreservation (De Bruyn et al. 2011). However, only few groups have compared drug transporter activity in the same batch of hepatocytes before and after cryopreservation. In human hepatocytes, uptake studies have been performed before and after cryopreservation of hepatocytes from the same donors (Shitara et al. 2003; Badolo et al. 2011). In terms of Na+-dependent uptake of taurocholate, mediated by NTCP (SLC10A1), there was a large variation in the effect of cryopreservation (Shitara et al. 2003) between donors with an average decrease in CLuptake by 40 %. In the same study, the average of estradiol-17β-glucuronide CLuptake, reflecting the functional activity of OATP1B1/3 (SLCO1B1/3), was decreased by 33. Similarly, Badolo and co-workers observed a 50 % decrease in CLuptake of estradiol-17β-glucuronide after cryopreservation of human hepatocytes (Badolo et al. 2011). This was due to a decrease in V max, whereas the Km of estradiol-17β-glucuronide uptake was similar before and after cryopreservation, indicating conservation of the substrate affinity for the transporter. OCT1 (SLC22A1) activity was also assessed in human hepatocytes before and after cryopreservation (Badolo et al. 2011). Uptake of the organic cation transporter substrate 1-methyl-4-phenylpyridinium (MPP+) was not statistically different in terms of Km and Vmax after cryopreservation, and thus, no difference in CLuptake of MPP+ could be detected.
Drug transporters of the ABC-binding cassette family also retain functional activity after cryopreservation. Although a direct comparison of freshly prepared and cryopreserved hepatocytes has not been accomplished on the same preparations, several studies have demonstrated efflux in the same order of magnitude in cryopreserved as freshly prepared cells. Sandwich culture, which is the most commonly used system for assessment of transporter-mediated efflux at the canalicular membrane, has been successfully prepared from cryopreserved human hepatocytes (Bi et al. 2006). Mdr1 activity was retained in cryopreserved rat hepatocytes (Jorgensen et al. 2007). Biliary excretion rates of taurocholate and digoxin were similar in cryopreserved and fresh hepatocytes. Using hepatocytes from dog, rat, monkey and man in suspension, comparable results were found in experiments with freshly prepared and cryopreserved hepatocytes when efflux of substrates of MDR1 (ABCB1), BCRP (ABCG2) and MRPs (ABCCs) was measured (Li et al. 2008).
In conclusion, hepatocytes retain functional activity of both solute carriers and ATP-binding cassette transporters during cryopreservation. In some cases, e.g. uptake of estradiol-17β-glucuronide, the activity may decrease during cryopreservation (Shitara et al. 2003; Badolo et al. 2011). Cryopreserved hepatocytes are important tools in the prediction of metabolic clearance and transport. In terms of transporters, the strength lays in the possibility to gain a mechanistic understanding of hepatobiliary drug disposition. Cryopreservation may affect the quantitative aspect of drug transport similar to other factors like incubation and cell culture conditions which may also affect transporter expression on the mRNA level (Richert et al. 2006).
7 Hepatocyte dedifferentiation


Freshly isolated primary hepatocytes and their culture, either of human or rodent origin, are considered as faithful replicas of in vivo-like hepatic physiology. The hepatocytes are cultured, usually as sandwich cultures, in which the cells are maintained between two layers of soft gel or as collagen monolayers in which hepatocytes grow on a dish that has been coated with stiff and dry collagen (protocols for which are described in the Supplement Section B). Hepatocytes maintain a considerable level of functionality during short-term cultures and thus represent a well-accepted tool for studying drug metabolism (Reder-Hilz et al. 2004; Gebhardt et al. 2003; Carmo et al. 2005; Papeleu et al. 2002; Knobeloch et al. 2012; Ullrich et al. 2007, 2009; Hengstler et al. 2000a, 2005) and drug interactions such as inhibition or induction (Li et al. 1999; Hengstler et al. 2000a, b; Ringel et al. 2002, 2005; Kafert-Kasting et al. 2006; Saussele et al. 2007). All compounds known to cause enzyme induction in vivo that have been tested with cultured hepatocytes produced positive results (Bode and Heinrich 2001). Nevertheless, their routine implementation in preclinical safety evaluation, particularly for long-term studies, is hampered by the progressive deterioration of liver-specific features (Elaut et al. 2006; Vinken et al. 2006a). Altered mRNA and protein levels of phase I and phase II biotransformation enzymes and drug transporters are well-known hallmarks of hepatocyte dedifferentiation (Baker et al. 2001; Elaut et al. 2006; Beigel et al. 2008; Rowe et al. 2010). In fact, the entire physiological repertoire in hepatocytes collapses as a function of culture time. This is caused at least in part by a drastically decreased expression of hepatic master regulators, such as liver-enriched transcription factors (LETFs) (Padgham et al. 1993; Mizuguchi et al. 1998; Rodriguez-Antona et al. 2002). Primary hepatocytes ultimately die after only a couple of days in culture. Loss of hepatic cytoarchitecture and ischemia-perfusion injury, experienced by hepatocytes during their isolation from the freshly removed liver, are the main molecular triggers of these changes. They initiate proliferative and inflammatory signaling cascades, with a shift of the hepatocellular balance toward a proliferation-oriented and thus less differentiated cell phenotype (Paine and Andreakos 2004; Elaut et al. 2006; Vinken et al. 2006a). In this section, the changes in gene expression as a result of cell isolation and culture are described, as well as potential methods to restore hepatocyte-specific functions.
7.1 Characteristics of hepatocyte dedifferentiation
7.1.1 Hepatocyte “dedifferentiation” is a consequence of overactive RAS/MEK/ERK signaling
With the advent of gene expression profiling, it would be of interest to use cultured hepatocytes also for toxicogenomic studies (see section “Toxicogenomics, a rapidly evolving subdiscipline of toxicology”). Currently, this is hampered by the fact that cultured hepatocyte cultures show major alterations in gene expression compared to the in vivo situation. When placed into culture, more than 3,000 genes are up- or downregulated by at least threefold. Principle component analysis (PCA) of gene array data demonstrated that most up- or downregulations occur during the first 24 h of culture, followed by a period with much smaller expression alterations (Fig. S4(a); see ESM) (Zellmer et al. 2010). This PCA also included liver tissue of mice (L) which shows only relatively small differences compared to the freshly isolated hepatocytes (H). In a next step, only genes altered during culture were included into the PCA (Fig. S4(b); see ESM). This analysis illustrates that the three mice (indicated by blue pink and red color) can be differentiated along axis 1. More importantly, axis 2 comprises genes whose expression was altered during the culture period (Fig. S4(b); see ESM). To understand the mechanism responsible for the observed time-dependent gene expression alterations, the genes associated with axis 2 (Fig. S4(b); see ESM) were analyzed for over-represented transcription factor binding sites (Zellmer et al. 2010). After adjustment for multiple testing, ETF, Elk-1 and NF-Y were identified as over-represented. An important factor that these transcription factors have in common is that they are influenced by MAP kinase signaling. This led to the hypothesis that MAP kinase signaling might be activated in cultured hepatocytes compared to the in vivo situation. Indeed, phosphorylated ERK1/2 was clearly increased in cultured hepatocytes compared to liver tissue (Fig. 27; Godoy et al. 2009). This increase in phosphorylated ERK1/2 was already present in freshly isolated hepatocytes, indicating that activation of MAP kinase signaling is not only a consequence of the culture conditions (see 24–72 h in culture in Fig. 27) but also of the isolation stress. Similar to ERK1/2, Akt phosphorylation was also increased. The degree of Akt and ERK1/2 activation strongly depends on the culture conditions with much stronger phosphorylation seen in hepatocytes cultured as monolayers than in sandwich culture (Fig. 27). Both activation of the signaling via ERK1/2 and Akt have major consequences on the hepatocyte phenotype. Activation of ERK1/2, e.g. by expression of a constitutively active Ras, but not constitutively active Akt leads to hepatocyte dedifferentiation and to features of epithelial to mesenchymal transition—EMT (Fig. 28; Godoy et al. 2009). Activation of Akt causes resistance of apoptosis by antagonizing activation of p38. This has been shown by inhibitor experiments in hepatocyte monolayers where inhibition of PI-3 kinase restored apoptosis sensitivity (Godoy et al. 2009). Similarly, over-expression of a constitutively active Akt in sandwich cultures (representing conditions without Akt activation and apoptosis resistance) induced resistance to apoptosis. Therefore, activation of Akt as a consequence of the culture conditions is of relevance for toxicity experiments and may lead to underestimation of in vivo toxicity. Both activation of ERK1/2 and Akt and its biological consequences (EMT and apoptosis resistance) are reversible. Upon harvesting hepatocytes from collagen monolayers and re-plating them into sandwich cultures, the degree of ERK1/2 and Akt phosphorylation decreased (Godoy et al. 2009). This was accompanied by a re-establishment of the differentiated phenotype, a decrease in EMT markers and by re-establishment of apoptosis sensitivity.

Phosphorylated and total ERK1/2 and Akt in liver tissue from C57BL6/N mice (“liver”), freshly isolated hepatocytes (“fresh hep”), hepatocytes cultured on stiff and dry collagen (“Col. Monolayer”) and between two layers of soft gel collagen (“Col Sandwich”) (Godoy et al. 2009)

Influence of hepatocyte culture conditions on signaling and phenotype. When hepatocytes are isolated from the organ and cultured on stiff and dry collagen (“collagen monolayers”), at least two signaling pathways (ERK and Akt) are activated. The activation process involves focal adhesion kinase (FAK) and src although the exact mechanisms initiating this process are still unknown. Signaling via the Ras/Raf/ERK pathway (“MAP kinase”) causes dedifferentiation and epithelial to mesenchymal transition (EMT). Activation of the PI3K/Akt pathway causes resistance to apoptosis. Both pathways are strongly activated in collagen monolayers but much less in collagen sandwich cultures (Godoy et al. 2009)

Epigenetic control mechanisms of gene transcription. Inhibition of gene transcription typically corresponds with hypermethylated CpG islands in gene promoter regions and deacetylated histone tails at local chromatin domains. HDAC inhibitors (HDACi) and DNMT inhibitors (DNMTi) modulate the chromatin structure. They create an open, transcriptionally active euchromatin configuration at gene coding and regulatory regions, accessible for transcription factors (TF), thereby facilitating gene transcription. 5-AzaC decitabine, M, 5-methyl cytosine at CpGs, SB sodium butyrate, TSA Trichostatin A, VPA valproic acid (from Snykers et al. 2009)
7.1.2 Cultured hepatocytes exist in a “proliferation primed state”
Since signaling via Akt and ERK is known to mediate proliferation, BrdU incorporation into hepatocytes cultured as collagen monolayers was analyzed. Under subconfluent conditions, basal BrdU incorporation (without EGF, HGF or other mitogens in the culture medium) was already relatively high and generally ranged between 15 and 20 % (Zellmer et al. 2010). Addition of the MEK1 inhibitor, PD098059, or the PI3K inhibitor, LY294002, almost completely abolished the basal BrdU incorporation, demonstrating the role of MAP kinase and Akt signaling. In contrast to subconfluent cultures of hepatocyte monolayers, confluent cultures did not show increased basal BrdU incorporation despite the high levels of phosphorylated ERK1/2 and Akt. This is most probably due to efficient contact inhibition (Machide et al. 2006). Similar to confluent monolayers (on stiff and dry collagen), hepatocytes in collagen gels (sandwich cultures) did not show increased basal BrdU incorporation.
7.1.3 Hepatocyte differentiation and dedifferentiation as reversible results of signaling network activities
Signaling activities and gene expression patterns of hepatocyte monolayers are strongly altered compared to the in vivo situation. The phenotype resulting from these alterations is a dedifferentiated (“EMT-like”) and apoptosis resistant cell. These processes are driven by overactive MAP kinase and Akt signaling (Fig. 28). This is in contrast to the common view that hepatocyte dedifferentiation in vitro is a passive process of deterioration finally leading to cell death. Actually, hepatocyte dedifferentiation is an active process driven by overactive signaling pathways, which makes them more apoptosis resistant. Under appropriate conditions, dedifferentiated hepatocytes can be cultured for months. By manipulating the respective signaling pathways, the cells even re-differentiate, showing that the differentiated and EMT-like phenotypes are reversible. Although it is clear that the isolation stress as well as the matrix of the culture system contributes to the in vitro alterations, the exact mechanisms initiating ERK1/2 and Akt signaling are not fully understood. Unfortunately, practical strategies that completely avoid the culture condition-mediated switch to increased signaling activities are not yet available. Soft gel collagen sandwich cultures clearly improve the situation. However, although quantitatively to a lesser degree, similar patterns of gene expression alterations are observed in sandwich as in monolayers cultures, suggesting that the in vitro alterations are ameliorated but not stopped by the soft gel collagen. More advanced 3D culture systems such as hepatocyte spheroids (discussed in section “Hepatospheres”) have not yet been systematically studied with respect to gene expression and signaling activities. An important milestone in future will be to fully understand the mechanisms that cause the altered state of the signaling network and to identify efficient strategies to maintain them in a more in vivo-like state.
7.1.4 Epigenetic and posttranscriptional mechanisms as novel anti-dedifferentiation strategies for primary hepatocytes in culture
Initial anti-dedifferentiation approaches attempted to boost the expression of liver-specific features and to prolong the lifespan of cultured primary hepatocytes by providing an in vivo-like culture microenvironment (Papeleu et al. 2002; Vinken et al. 2006a). Yet, these methodologies only slow down hepatocyte dedifferentiation but do not causally counteract it. More recent strategies described here aim at the restoration of the hepatocyte-specific transcriptional blueprint by directly targeting (epi)genetic mechanisms that drive hepatocellular gene expression.
7.1.5 Epigenetics and its mechanisms in the regulation of gene expression
Already in the early 1940s, the term “epigenetics” was introduced by merging “genetics” with “epigenesis,” i.e. the developmental events that bring mature organisms to life (Waddington 1942). Although this term was used initially purely in the context of developmental studies, it became clear over the years that the functional scope of epigenetics stretches far beyond the developmental processes (Choudhuri 2010). The most general contemporary interpretation describes epigenetics as an inheritance of variation (-genetics) above and beyond (epi) changes in the DNA sequence (Bonasio et al. 2010). Three major mechanisms, which are not caused by changes in gene sequence, provide the molecular basis for such variations, namely (1) DNA methylation, (2) reversible histone modifications and (3) non-coding RNA (ncRNA)-related control (Choudhuri 2010). It is, however, still a matter of debate whether the last group can be considered as a part of the epigenome or rather must be seen as a separate regulatory phenomenon; and therefore, mechanisms involving ncRNA are not expanded on here (although miRNAs are described in section “MicroRNAs”).
7.1.5.1 DNA methylation
Both DNA methylation and posttranslational histone modifications control by means of an elegant mechanism the accessibility of gene promoters to the RNA polymerase II-containing transcriptional machinery. As such, methylation marks deposited on a DNA template by DNA methyltransferases (DNMTs) hinder efficient transcription factor binding (Fig. 29). Specifically, cytosine, which is located in so-called CpG islands of DNA within the 5′ promoter of genes, is methylated (Cheng and Blumenthal 2008; Szyf 2010; Ren et al. 2011). The presence of 5-methylcytosine subsequently attracts the methylated DNA-binding domain proteins (Meehan et al. 1989; Nan et al. 1993). The latter recruit histone-modifying enzymes, which cause gene silencing by altering the level of chromatin compaction (Nan et al. 1993; Fuks et al. 2003). DNA methylation in regulatory regions, such as gene promoters and enhancers, is therefore inversely correlated with gene expression (Szyf 2010).

Biogenesis of miRNA. miRNAs are processed through the canonical pathway or mirtron pathway into pre-miRNA. After exporting the pre-miRNA from the nucleus to the cytoplasm, miRNA–miRNA* duplexes are formed after cleavage by Dicer. From this duplex, only the guide strand is loaded into the RISC complex, forming miRISC. This complex will cause translational repression or mRNA cleavage. DGCR DiGeorge syndrome critical region, Pre-miRNA Precursor miRNA, Pri-miRNA Primary miRNA, RISC RNA-induced silencing complex
7.1.5.2 Histone deacetylation
Histone deacetylases (HDACs) are often recruited to methylated gene promoters, bringing about a final silencing imprint. HDAC-mediated deacetylation of histones N-termini tightens DNA strands on histone cores by increasing the electrostatic attraction between these two chromatin components (Witt et al. 2009). By contrast, the introduction of acetyl groups by HDACs reduces the affinity of the protein core to the DNA strands. As a result, a more relaxed chromatin configuration is formed, thus facilitating transcription factor binding. The presence of covalently attached acetyl groups on histone tails is therefore linked with the transcriptional activation, while their absence is related to transcriptional repression (Fig. 30) (Riggs et al. 1977; Hebbes et al. 1988; Durrin et al. 1991).

Modulation of CYP activity levels in HepG2 cells transduced with CYP adenoviruses. HepG2 cells were individually transfected with increasing doses (moi) of adenoviruses encoding CYP1A2 (a), CYP2C9 (b) or CYP3A4 (c). Afterward, activities were determined for 48 h using phenacetin, diclofenac or midazolam as selective substrates, respectively. Activity data are expressed as pmol of the corresponding metabolite formed per minute and per mg of cell protein
Although reversible acetylation is the best-studied example of posttranslational modification of histone proteins, a plethora of other chemical signatures may be deposited at their N-terminal tails, evoking either transcriptional activation or suppression (Yang et al. 2007; Tambaro et al. 2010). All known histone phosphorylation events are associated with transcriptional activation. In comparison, histone methylation and ubiquitination may have a dual outcome, depending on the identity of the amino acid residue concerned in the histone tail, while sumoylation has a purely repressive character (Choudhuri 2010). These specific chemical entities not only modulate the interaction between the DNA and the histones, but also create a so-called histone code, which is a sort of roadmap for nuclear regulatory proteins (Strahl and Allis 2000). The latter possess evolutionarily conserved domains, which allow them to selectively bind specific histone modifications with a very high affinity. Thus, nuclear regulators can “read” the histone code and initiate appropriate DNA-templated programs, including the on or off switching of gene transcription (Bannister et al. 2001; Lachner et al. 2001; Santos-Rosa and Caldas 2005; de la Cruz et al. 2007; Vermeulen et al. 2007).
7.1.6 Inhibition of HDAC and/or DNMT activity in the hepatic in vitro systems as anti-dedifferentiation strategy?
Aberrant expression and function of epigenetic regulators, such as HDACs and DNMTs, have been implicated in a variety of pathological processes. As such, their role in carcinogenesis has been reported on numerous occasions and these enzymes became ubiquitous targets of clinical anticancer therapies (Batty et al. 2009; Fandy 2009; Kristensen et al. 2009; Prince et al. 2009; Witt et al. 2009; Spiegel et al. 2011). In fact, in vitro cancer models were the first cell systems in which the anti-proliferative and pro-differentiating potential of HDAC and DNMT inhibitors, HDIs and DMTIs, respectively, could be demonstrated (Gore 2009). Specifically, in respect of liver cancer-derived cell models, the natural prototypical HDI, Trichostatin A, was shown to induce the expression of CYP3A4 and alcohol dehydrogenase (ADH) 1B phase I biotransformation enzymes, as well as the CCAAT-enhancer-binding protein (C/EBP) α transcription factor in the human hepatoma HepG2 cell line (Kim et al. 2004; Dannenberg et al. 2006a, b; Dannenberg and Edenberg 2006). Furthermore, both HepG2 and Huh-7 hepatoma cells responded to Trichostatin A exposure with upregulated apolipoprotein CIII, human blood coagulation factor (HCFX) and glutamine synthetase expressions, in addition to an improved ammonia removal and albumin secretory ability (Yamashita et al. 2003). In comparison, the pharmacological inhibition of DNMT activity exerted positive effects on the expression of several phase I and phase II biotransformation effectors in HepG2 cells (Bakker et al. 2002; Dannenberg et al. 2006). Combined inhibition of these epigenetic mechanisms in the HepG2 cell line also upregulated C/EBPα, ADH 1B and 1C levels (Dannenberg et al. 2006a, b). These observations were subsequently extrapolated to cultures of primary hepatocytes. In this respect, Trichostatin A was successfully used to inhibit the proliferative induction of EGF-stimulated hepatocytes (Papeleu et al. 2003, 2007). The sooner the cells could be exposed to the HDI, the earlier, in terms of a cell cycle stage, the cells became arrested. Indeed, when Trichostatin A was added already during the isolation of the hepatocytes from liver tissue, i.e. during the two-step collagenase perfusion, the hepatocytes were still in the state of proliferative quiescence and neither the proto-oncogen c-jun nor cyclin D1 could be detected. This pointed toward a cell cycle block at the early G1 phase. However, hepatocyte proliferation could only be stopped in the early S-phase when cells were cultured in the presence of Trichostatin A from the time of cell seeding onwards. This was evidenced by the inhibition of DNA replication and the absence of the S/G2/M-phase marker cyclin-dependent kinase 1 (cdk1) (Papeleu et al. 2003). By contrast, the metabolically more stable synthetic Trichostatin A derivative, ω-carboxypentyl p-dimethylaminobenzamide hydroxamate (4-Me2N-BAVAH), could already induce a G1 cell cycle arrest when added to the cell culture medium from the time of plating (Papeleu et al. 2007). In primary rat hepatocyte cultures, Trichostatin A and its analogues elevated CYP1A1, CYP2B1/2 and CYP3A2 mRNA and protein steady-state levels, and this was accompanied by corresponding increased enzymatic activities (Henkens et al. 2007; Fraczek et al. 2009). Similar observations were made with respect to the protein expression of key hepatic transcription factors, namely C/EBPα and HNF-4α (Henkens et al. 2008). HDAC inhibition also improved other aspects of hepatocyte functionality, namely albumin secretion and gap junctional intracellular communication (Papeleu et al. 2003; Henkens et al. 2007, 2008; Vinken et al. 2006b). In contrast, Trichostatin A, as well as a number of its structural analogues, reduced caspase-3 activation and the expression of the pro-apoptotic B cell lymphoma 2 (Bcl-2)-like proteins Bid and Bax in rat hepatocyte monolayer cultures. At the same time, the protein levels of the anti-apoptotic Bcl-2 family member BclxL were increased, indicating that interference with HDAC activity delays the onset of apoptosis, which spontaneously occurs during primary hepatocyte culture (Papeleu et al. 2003, 2007 Vanhaecke et al. 2004; Fraczek et al. 2009). Most recent findings also demonstrate that DNMT inhibition has comparable beneficial effects as HDAC inhibition on the phenotype of primary hepatocytes in an in vitro setting. Accordingly, DMTI, i.e. decitabine alone or in combination with HDI, caused a concentration-dependent inhibition of DNA synthesis in EGF-induced hepatocyte monolayers, and had a positive impact on albumin secretory activity and CYP1A1 protein expression (Fraczek et al. 2011). Moreover, simultaneous exposure to both epigenetic modifiers resulted in even more pronounced effects than each of these agents separately.
7.1.7 miRNAs and their regulation by HDAC inhibition in primary hepatocyte cultures/hepatoma cell lines
To date, little is known about miRNA expression in hepatic in vitro models. Yet, it was recently shown that dedifferentiation of primary rat hepatocyte cultures is accompanied by changes in their hepatocellular miRNA profile, reflecting the combined action of multiple miRNAs on different biological pathways. Two miRNA species, i.e. miR-21 and miR-126, were found to be the most up- and downregulated miRNAs, respectively (Bolleyn et al. 2011). These modifications are presumed to be linked to the proliferative response triggered upon isolation of the cells from the liver (Guo et al. 2008; Elaut et al. 2006; Marquez et al. 2010; Song et al. 2010). In addition, Trichostatin A had a positive outcome on miR-122 expression (Bolleyn et al. 2011), a miRNA species that accounts for approximately 70 % of all hepatic miRNAs and that has been claimed to be imperative for preserving the differentiated hepatic phenotype (Lagos-Quintana et al. 2002; Esau et al. 2006). Concerning the miRNA expression in hepatic cell lines, different miRNAs have been reported to be aberrantly expressed, such as miR-375, miR-21 and miR-34a, which probably is a manifestation of tumor-based characteristics including cell proliferation, migration/invasion and clonogenicity (He et al. 2011; Connolly et al. 2011; Cheng et al. 2010).
8 Alternative models to primary human hepatocytes


Primary cultured human hepatocytes are the “gold standard” for hepatotoxicity studies (LeCluyse 2001; Gomez-Lechón et al. 2010a, b). However, their phenotypic instability over culture time, the scarce and irregular availability of liver tissue for cell harvesting, the poor plateability of certain lots of cryopreserved hepatocytes, and the high batch-to-batch functional variability of hepatocyte preparations from different donors seriously compromises their use in routine testing (Gomez-Lechón et al. 2003).
In order to develop an alternative to primary human hepatocytes, it is necessary to identify specific cell surface markers for each of the liver cell types and to perform a detailed characterization of liver parenchymal cells and NPCs (Michalopoulos 2007). Generally, the downregulation of fetal markers, such as α-fetoprotein (AFP) and glutathione-S-transferase P1 (GSTP1; GSTπ), and the acquisition of phase I and phase II drug-metabolizing enzymes expression, such as CYPs, are used as markers of mature hepatocyte. In addition, the expression of albumin, cytokeratins (CK) 18 and 19, the epithelial cell adhesion molecule (EpCAM), α1-antitrypsin, asialoglycoprotein receptor and tyrosine aminotransferase is considered a feature of differentiated hepatocytes (Nava et al. 2005; Gridelli et al. 2012; Touboul et al. 2010). Moreover, hepatic-enriched nuclear factors (HNF) family members and CAAT/enhancer-binding protein α (C/EBPα) superfamily members are nuclear factors expressed in human liver and, among others features, exert an important role in the biotransformation enzyme functions (Tan et al. 2007). In particular, HNF-4 is described to be one of major transcription factors for various liver-specific genes involving in the regulation of protein and lipid synthesis, glucose and drug metabolism (Kimata et al. 2006; Crestani et al. 2004). These hepatocyte characteristics and functions emphasize their importance in liver functions. This section describes two main areas of research addressing alternatives to primary human hepatocytes, namely cell lines, iPS cells and embryonic stem cells.
8.1 Cell lines isolated from human hepatomas
8.1.1 Advantages and drawbacks of cell lines
To overcome the limitations of primary human hepatocytes, several human hepatoma cell lines have been proposed for hepatotoxicity assessment (e.g. HepG2, Hep3B, Huh7, Fa2N4, HepaRG). Cell lines are characterized by their unlimited life span, stable phenotype, high availability and easy handling, which make them potential alternative in vitro models for screening purposes. Unfortunately, most hepatic cell lines show a low or partial expression of drug-metabolizing enzymes compared to primary hepatocytes or human liver, likely due to a decreased transcription of enzyme genes (i.e. CYPs) (Donato et al. 2008b). The marked differences in expression levels of key hepatic transcription factors and nuclear receptors found between hepatocytes and hepatoma cell lines have been related to the observed differences in CYP expression (Rodriguez-Antona et al. 2002). This finding was supported by adenovirus-mediated transfection studies with c/EBPα or HNF-4, PXR and CAR in HepG2 cells, resulting in increased levels of several CYPs (Jover et al. 1998; Naiki et al. 2004; Martinez-Jimenez et al. 2007; Küblbeck et al. 2010).
Recent studies have established that several hepatoma cell lines show an expression pattern closer to hepatocytes in confluent cultures. Proliferating HepaRG cells differentiate toward hepatocyte-like phenotype after several weeks of treatment with DMSO, and under these culture conditions, they show higher levels of drug-metabolizing activities than other hepatoma cells commonly used for hepatotoxicity screenings (i.e. HepG2) (Kanebratt et al. 2008a). However, compared with human hepatocytes, CYP expression in HepaRG cells is in general lower, with the exception of CYP3A4, which is present at higher mRNA and activity levels (Kanebratt et al. 2008a; Lubberstedt et al. 2011). Similarly, confluent growth of hepatoma HuH7 cells for several weeks results in increased levels of CYP3A4 activity (Sivertsson et al. 2010). Phenotypic changes in HuH7 cells occur in the absence of differentiation inducers (i.e. DMSO). Fa2N4, a non-tumorigenic immortalized hepatic cell line widely used in the pharmaceutical industry, has been reported to be a potential model system to assess the induction of the major CYPs (Youdim et al. 2007). However, the basal enzyme activities are low, and therefore, it is difficult to assess CYP induction without very sensitive analytical methods (Sinz et al. 2008). Drug metabolism (particularly CYP-dependent metabolism) is a major determinant of hepatotoxicity, as both detoxification and bioactivation processes can occur, and are most frequently responsible for inter-individual differences in drug-induced toxicity. Unfortunately, even the most promising and differentiated hepatoma cells do not constitute an ideal surrogate system for human hepatocytes for hepatotoxicity studies, as they do not reproduce drug-metabolizing enzyme pattern of human hepatocytes.
8.1.2 Strategies to develop metabolically competent hepatic cell lines by gene engineering
In view of the limited expression of drug-metabolizing enzymes in most hepatic-derived cell lines, alternative approaches have been explored to obtain immortalized hepatocytes from a non-hepatocarcinoma origin (reviewed by Castell et al. 2006 and Donato et al. 2008b). A successful immortalization of normal hepatocytes from different species was achieved using different strategies including cell transformation with virus genes or oncogenes (i.e. simian virus 40 large T antigen, c-myc, cH-ras) (Osanai et al. 1997, reviewed by Castell et al. 2006), hybrid cells obtained by the fusion of hepatocytes and immortalized cell lines (Widman et al. 1979; Cassio et al. 1991) or the generation of hepatic cell lines from transgenic animals (reviewed by Castell et al. 2006). Immortalized hepatic cell lines have been established from livers of transgenic mouse and rat expressing the SV-40 large T antigen under the control of the hepatic L-pyruvate kinase (Courjault-Gautier et al. 1997) or albumin (Bulera et al. 1997) promoter, respectively; or from animals over-expressing growth factors (TGF-α or human growth hormone), early growth signals (constitutively active met-protooncogene) or truncated growth suppressor genes (p53-knockout mice) (reviewed by Castell et al. 2006). Although using these strategies some hepatic functions were maintained following cell transformation, the cells show a very low expression of CYP enzymes, which, in general, makes them unsuitable for drug metabolism and hepatotoxicity studies (Castell et al. 2006; Donato et al. 2008b).
Other strategies have been currently explored to overcome the limitations of hepatic cell lines for drug metabolism studies. Metabolically competent hepatic cells have been successfully developed by the transfection of hepatic and NPCs with viral expression vectors encoding for human CYP enzymes and other genes involved in xenobiotic metabolism (i.e. UGTs, glutathione transferases.) resulting in both transient or stable gene expression (Crespi and Miller 1999; Gonzalez and Korzekwa 1995; Sawada and Kamataki 1998). The development of genetically manipulated hepatic cell lines expressing CYP genes has been accomplished by using vaccinia virus, adenovirus, cytomegalovirus (CMV) and retroviral vectors systems. While vaccinia virus and adenoviral vectors transduce hepatocytes effectively, the vectors are non-replicating and remain episomal, and thus gene expression is transient (Ilan et al. 1999; Li et al. 1993), by contrast, most integrating vectors into the host genome require a round of cell division for the integration event to occur (Ferry et al. 1991; Yamashita and Emerman 2006). Genetically modified hepatic-derived cells expressing human drug-metabolizing enzymes have become in recent years suitable cell tools for assessing metabolism-mediated bioactivation of chemicals and their effects on cells (Prakash et al. 2008). In addition, in contrast to primary hepatocyte cultures, these cell lines offer the advantage of robustness and good experimental reproducibility.
A key point is that the catalytic activity of CYP transfected cells relies not only on the efficient expression of the transgene, but also in the existence of the required electron transport partners (NADPH-P450 reductase and cytochrome b5) (Gonzalez and Korzekwa 1995). The existing hepatoma cell lines express sufficient P450 reductase to ensure sufficient monooxygenase activity (Donato et al. 2008b). In fact, among mammalian cell expression systems, liver-derived cell lines (HepG2, THLE, Hep3B, HLE, HLF, Huh6, Huh7 and Fa2N4 cells) have been successfully transfected to express human CYP genes. The CYP expression is confirmed by the determination of enzyme activities and by the RT-PCR procedure. Recombinant enzymes show catalytic properties comparable to those of human liver microsomes, and the activity levels of the expressed CYP enzymes are similar or higher when compared to human hepatocytes.
Vectors containing CMV promoter/enhancer sequences, such as the singular expression vector pCMVneo (Baker et al. 1990), which effectively drive the expression of CYP genes inserted, has been used in human hepatic–derived THLE cells, a non-tumorigenic SV40-immortalized human liver epithelial cell line (Mace et al. 1994; Bort et al. 1999). Recombinant retroviruses have been widely used to deliver human CYP genes to mammalian cell lines (Sawada and Kamataki 1998). Lentiviral vectors are unique within the retroviral vector family since they are capable of effectively transduce both dividing and non-dividing cells and stably integrate into the genome of the host cell, thereby facilitating long-term transgene expression (Naldini et al. 1996). In the past few years, different vector systems have been developed based on primate and non-primate lentiviruses, including human immunodeficiency virus type 1 (HIV-1), simian immunodeficiency virus (SIV), equine infectious anemia virus (EIAV) and feline immunodeficiency virus (FIV) (Chang and Gay 2001). Several studies have shown that lentiviral vectors effectively transduce the widely used hepatoma cell lines, Huh7 and HepG2 (Nash et al. 2004; Liao and Ning 2006). Some studies have reported that baculovirus (Autographa californica nuclearpolyhedrosis virus) vectors can be used to shuttle foreign genes into mammalian cells (Gonzalez et al. 1991a; Shoji et al. 1997; Condreay et al. 1999). Baculovirus transfection strategies have proven successful at transferring foreign DNA into hepatoma cells and primary hepatocyte cultures (Beck et al. 2000). It is noteworthy that the uptake of the baculovirus was reported to be predominantly specific for hepatic cell types, with associated transfection efficiencies ranging greater than 70 % (Boyce and Bucher 1996).
In general, genetically engineered cells using vectors that integrate the genetic material into the host cell genome have no limited life span, express permanently high levels of the transgene. However, present limitation of these cells is the fact that only one or two enzymes can be satisfactorily transfected into cells and the risk of mutagenic properties associated with integrating vectors cannot be excluded.
Recombinant constructions of vaccinia virus which only replicates in the cytoplasm of the host cell, outside of the nucleus have been described (Gonzalez et al. 1991b). Several isoforms of CYP have been expressed in HepG2 cells using vaccinia virus-mediated transient expression (Aoyama et al. 2009; Waxman et al. 1991). The major drawback of this system is that infection of host cells with vaccinia virus results in cytopathic effects, hindering stable recombinant protein expression.
The adenovirus vector strategy has been used for introducing target genes into liver-derived cells with very high efficiencies (reviewed by Wickham (2000), and cell transfer is not dependent on active cell division. Recombinant adenoviruses rapidly and efficiently infect hepatic cell lines, and almost 100 % of the cells can express functional levels of the transgene after a short exposure to the virus (Castell et al. 1997). This technology has facilitated the generation of transient metabolically competent cells after transduction with recombinant-defective adenoviral vectors encoding for CYP genes (Castell et al. 1997; Bai and Cederbaum 2004; Naiki et al. 2004; Hosomi et al. 2011; Donato et al. 2010). A major characteristic of this approach is that functional levels of CYP are easily modulated as a function of the number of infecting virus particles (Fig. 31). Among several hepatoma cell lines (HepG2, Hep3B, HLE, HLF, Huh6, Huh7 and Fa2N4 cells) efficiently infected with adenovirus vector harboring CYP3A4, HepG2 cells showed the highest CYP3A4 protein expression and corresponding testosterone 6β-hydroxylase activity (Hosomi et al. 2011). The use of adenoviral strategy to confer CYP activities to HepG2 cells has been extensively reported (Vignati et al. 2005; Donato et al. 2010; Aoyama et al. 2009). This cell system has been proposed as a new in vitro tool for metabolism-mediated toxicity and clearance prediction of drugs metabolized by CYPs (Vignati et al. 2005; Donato et al. 2010). Recently, it has been shown that HepG2 cells can be co-transduced with multiple CYPs (Tolosa et al. 2011b). By selecting an appropriated mixture of recombinant CYP adenoviruses, transgene expression in HepG2 cells is comparable to that of human hepatocytes as shown by the enzymatic activity assessed with specific substrates (Fig. 32). Important advantageous properties of adenoviral vectors include: feasible production of high-titer vector preparations, high efficiency in transducing both quiescent and actively dividing cells, high levels of controllable gene expression and co-transduction with multiple CYPs which can reproduce the in vivo relative abundance of each enzyme and a lack of mutagenic properties associated with integrating vectors. However, a limitation of adenovirus transduction is that expression of the enzyme of interest is transient, and a new transfection is required for each experiment.

CYP activities in HepG2 cells simultaneously transduced with a mix of adenoviruses encoding CYP1A2, CYP2C9 and CYP3A4. HepG2 cells were co-transfected with a mixture of adenoviral CYP constructs (6 moi CYP1A2 + 90 moi CYP2C9 + 66 moi CYP3A4). CYP1A2 (phenacetin O-deethylation), CYP2C9 (diclofenac 4′-hydroxylation) and CYP3A4 (midazolam 1′-hydroxylation) were determined 48 h later in the cells and compared to those in control HepG2 cells and human hepatocytes (HH) in primary culture. Activity values are expressed as pmol of the corresponding metabolite formed per minute and per mg of cell protein

Aflatoxin B1-induced toxicity in upgraded HepG2 cells. Metabolically competent HepG2 cells (prepared by co-transduction with CYP1A2, CYP2C9 and CYP3A4 adenoviruses) or control HepG2 cells were treated for 24 h with increasing concentrations of Aflatoxin B1. Cell viability (a), nuclear changes indicative of apoptotic death (b), mitochondrial membrane potential (MMP) (c) and intracellular calcium concentration (d) were compared in both cell systems (*p < 0.01). Results are expressed as percentage of untreated cells
8.1.3 Metabolically competent hepatic cell lines for drug hepatotoxicity testing
Conferring drug-metabolizing capability to target cells allows their use in the study of phenomena involving bioactivation and toxicity, as it facilitates discrimination of toxic effects resulting from the expression of an individual gene, and to compare with their isogenic parental control cell line. There has been a considerable progress in the development of suitable cell systems based on the stable transfection of cells with gene/cDNAs encoding for drug-metabolizing enzymes (Crespi and Miller 1999; Gonzalez and Korzekwa 1995). Hepatic THLE cells have been genetically engineered to express individual human CYPs (CYP1A2, CYP2B6, CYP2C9, CYP2C19, CYP2D6, CYP2E1 and CYP3A4) with activities comparable to those of human liver while retaining the characteristics of the parental cells and conjugating enzymes (Pfeifer et al. 1993, 1995; Mace et al. 1997; Bort et al. 1999). THLE cell lines expressing human CYP2E1 or CYP1A2 were used to activate N-nitrosodimethylamine and 2-amino-3-methylimidazo 4,5-f quinoline and to assess the inhibitory effect of sulforaphane (Barcelo et al. 1998). A five THLE cell line set has been used as a first tier screen to assess whether toxicity is due to the parent compound or an active metabolite or whether there is CYP-mediated detoxification of the parent compound (Dambach et al. 2005). Yoshitomi et al. (2001) have also established a series of HepG2 cell lines with stable expression of single human CYP enzymes, such as CYP1A1, CYP1A2, CYP2A6, CYP2B6, CYP2C8, CYP2C9, CYP2C19, CYP2D6, CYP2E1 and CYP3A4 which are a suitable model to investigate drug-induced cytotoxicity. Genetically engineered cell lines expressing stable human drug-metabolizing enzymes have also been satisfactorily used in the identification of those enzymes involved in the metabolism of a drug candidate. In fact, incubating the compound with each separate cell line is useful to ascertain which CYP isoform(s) is(are) responsible for metabolite(s) formation (Bort et al. 1999; Chang et al. 2006a; Emoto et al. 2006).
A cell line, Huh7-1A2-I-E, with high expression level of CYP1A2 has been established based on Huh7 cells using a recombinant lentiviral vector (Chu et al. 2011). The Huh7-1A2-I-E cells were evaluated as a cell-based model for high-throughput screening to identify CYP1A2 inhibitors or CYP1A2-associated cytotoxic agents. A collection of approximately 200 drugs were screened using this system, and results indicate that for most drugs the metabolism by CYP1A2 is unlikely to have made a major contribution to the in vitro cytotoxicity (Chu et al. 2011).
CYP3A4 is the major isoform in the liver contributing to the metabolism of more than 50 % of the drugs currently used (Rendic and Carlo 1997) and is involved in the metabolic activation of drugs causing toxicity (Walgren et al. 2005). Several engineered hepatic cells expressing this isoform have been developed. HepG2 cells lacking estrogen receptors and engineered to over-express CYP3A4, the most important CYP to metabolize tamoxifen, have shown to be a good model to study the effects of tamoxifen metabolites which are not related to estrogen receptor inhibition (Holownia and Braszko 2004). CYP3A-mediated biotransformation of the thiazolidinedione ring may be involved in hepatotoxicity of the glitazones in humans (Alvarez-Sanchez et al. 2006). The toxicity of 3-(3,5-dichlorophenyl)-2,4-thiazolidinedione and several structural analogues or potential metabolites was comparatively tested in wild-type human HepG2 cells and HepG2 cells stably transfected with CYP3A4. The results of these studies indicate that thiazolidinedione-ring-induced cytotoxicity in the transfected HepG2 cells is dependent on CYP3A4-mediated metabolism (Frederick et al. 2011). The role of CYP3A4 (responsible for amiodarone N-deethylation) in amiodarone-associated hepatotoxicity was investigated in HepG2 cells stably transfected with CYP3A4. Amiodarone was cytotoxic for HepG2 expressing CYP3A4 cells but not for wild-type HepG2 cells and co-incubation with ketoconazole attenuated cytotoxicity of amiodarone. Metabolized amiodarone triggered the production of ROS, induced mitochondrial damage and cytochrome c release, and promoted apoptosis/necrosis in HepG2 cells expressing CYP3A4, supporting the hypothesis that a high CYP3A4 activity is a risk factor for amiodarone hepatotoxicity (Zahno et al. 2011).
CYP2E1 is a key CYP enzyme involved in the biotransformation of ethanol and volatile anesthetics and in the chemical activation of many carcinogens, pro-carcinogens and toxicants. A HepG2 cell line stably expressing recombinant CYP2E1 was established to assess the metabolic activation of N-nitrosodiethylamine (Zhuge et al. 2003). An increase in cytotoxicity and micronucleus rate was observed in CYP2E1-expressing cells in comparison with wild-type HepG2 cells. Thus, the cell line is proposed as a useful model for testing the cytotoxicity, mutagenicity and metabolism of xenobiotics, which may be activated or metabolized by CYP2E1.
To approach more complex phenomena (i.e. two-stage metabolism, bioactivation), cells expressing both activating and detoxifying enzymes have been constructed (Sawada and Kamataki 1998). Engineering hepatoma cells (human HepG2 and HuH7 and rat Hepa1c1c7) expressing CYP2E1 and GSTP1 has been developed and used to investigate the bioactivation of carcinogens (Goldring et al. 2006). Cells expressing other drug-metabolizing enzymes, such as aldehyde dehydrogenases, superoxide dismutase, UGTs and glutathione transferases, have also an obvious utility in pharmacology and toxicology (Townsend et al. 1999).
A major limitation of engineered cells stably expressing drug-metabolizing enzymes is that metabolic profiles differ from those of primary hepatocytes. Transfection techniques did not allow a controlled expression of the transfected gene, and often resulted in activity levels lower or higher than in hepatocytes (Wu and Cederbaum 1996; Vignati et al. 2005; Frederick et al. 2011). Moreover, each cell line shows relatively high activity levels of the transfected enzyme (i.e. a particular CYP) compared to other drug-metabolizing enzymes (i.e. other CYPs or conjugating enzymes), which produce an unbalanced metabolic capacity. These drawbacks can be avoided by the use of adenoviral strategy which allows the generation of cells expressing desired levels of each enzyme (Aoyama et al. 2009; Tolosa et al. 2011b). In addition, it has been suggested that transient adenovirus-mediated expression avoids potential selection problems and cell adaptations which may occur with permanent engineered cell lines (Bai and Cederbaum 2004).
A feature of adenovirus infection is that functional expression level of the recombinant enzyme is modulated as a function of the amount of virus used. Therefore, infection of hepatoma cells with appropriate doses of adenoviral constructs lead to high expression of target genes, which ensure high metabolic activity of the enzyme(s) of interest (Donato et al. 2010). It has been shown that by optimization of transfection conditions (adenovirus dose, infection time), HepG2 cell cultures expressing CYP activity levels similar to those of primary hepatocytes can be easily prepared (Fig. 32) (Vignati et al. 2005; Aoyama et al. 2009; Tolosa et al. 2011b). To date, a few HepG2 cell-based systems prepared using adenoviral vectors have been proposed to evaluate CYP-mediated hepatotoxicity (Bai and Cederbaum 2004; Vignati et al. 2005; Hosomi et al. 2011; Tolosa et al. 2011b; Iwamura et al. 2011). The sensitivity of cytotoxicity assays is increased by cell treatment with L-buthionine sulfoximine to deplete GSH levels. HepG2 hepatoma is selected as the cell system since it has been proven to be successfully transfected with adenoviruses, expresses the required levels of elements needed to support CYP activity (i.e. NADPH-cytochrome P450 reductase, cytochrome b5) and is widely used for hepatotoxicity studies.

Scheme of key simultaneous processes of hepatocyte disposition. From Baker and Parton (2007)
As a proof of concept of the potential use of these cell systems for toxicity assessment, effects of acetaminophen were studied in HepG2 cells infected with an adenovirus construct harboring CYP2E1 (Bai and Cederbaum 2004). Acetaminophen is a commonly administered drug known to produce hepatotoxicity when taken at large doses. Toxic effects of the drug are metabolism-dependent and are mainly due to its bioactivation by CYP2E1 to NAPQI, an active metabolite. Compared with cells infected with β-galactosidase adenovirus, HepG2 cells transiently over-expressing CYP2E1 were more sensitive to acetaminophen-induced necrosis and apoptosis (monitored by changes in cell viability, relative percentage of apoptotic or necrotic cells, caspase-3 activity, mitochondrial membrane potential and formation of drug protein adducts). The observed cytotoxicity was clearly dependent on the concentration of acetaminophen and the amount of CYP2E1 adenovirus (multiplicity of infection, moi). HepG2 cells infected with CYP2E1 adenovirus have also been used to study the role of CYP2E1 in Fas-mediated cytotoxicity, oxidative stress and apoptosis (Yan et al. 2008). Vignati et al. (2005) proposed HepG2 cells transiently transfected with CYP3A4 as an in vitro tool for metabolism-mediated toxicity screenings. The results showed that ten CYP3A4 substrates known to generate toxic metabolites (bioactivation) produced higher cytotoxicity (assessed by MTT test and intracellular ATP content) in CYP3A4 adenovirus-transfected cells than in non-transfected control HepG2 cells. By contrast, when cells were treated with drugs known to be metabolized by CYP3A4 to non-toxic metabolites (detoxication), the highest toxic effects were produced in control HepG2 cells. The potential utility of adenovirus-transfected HepG2 cell systems to identify hepatotoxicity associated with CYP3A4 metabolism was supported by a recent study including 24 bioactivated and non-bioactivated drugs (Hosomi et al. 2011). In this study, the sensitivity of HepG2 cells over-expressing CYP3A4 to drug-induced cytotoxicity was increased by reduction in intracellular level of Nrf2, a transcription factor involved in upregulation of several genes coding antioxidant proteins and phase II drug-metabolizing enzymes. A similar strategy was applied to the study of drug-induced toxicity associated with metabolic activation by CYP2C9 (Iwamura et al. 2011). Recombinant adenovirus vectors provide versatile systems for efficient transfection of more than one gene. Using this technology, CYP3A4-expressing and superoxide dismutase (Yoshikawa et al. 2009) or γ-glutamylcysteine synthetase (Hosomi et al. 2010) knockdown rat hepatoma cells have been generated. These cell systems were proposed as useful screening tools for the prediction of metabolism-mediated hepatotoxicity produced by oxidative stress and/or generation of active metabolites by CYP enzymes.
As indicated above, simultaneous transfection with a mixture of recombinant CYP adenoviruses results in HepG2 cells with a metabolic competence similar to that of human hepatocytes (Fig. 32). Recently, the procedure of adenovirus coinfection was optimized to cells cultured in 96-well formats with such degree of efficiency and accuracy that the system is amenable to use in high-throughput hepatotoxicity screenings (Tolosa et al. 2011b). As an example, aflatoxin B1, which is bioactivated by several CYPs, was more toxic to upgraded HepG2 cells transiently expressing functional levels of CYP1A2, CYP2C9 and CYP3A4 than to non-metabolically competent HepG2 cells (Fig. 33). By contrast, no appreciable differences in cytotoxicity parameters (cell viability, mitochondrial membrane potential, intracellular calcium concentration and nuclear changes) of non-bioactivated compounds were found between both cell systems.
In summary, human liver-derived cells lines manipulated for both stable or transient expression of drug-metabolizing enzymes are promising in vitro systems for routine screening of metabolism-based hepatotoxicity in drug discovery. Although cells engineered to permanently over-express a single enzyme exhibit an unbalanced metabolism, they provide useful tools to maximize the production of reactive metabolites and to identify potentially bioactivated hepatotoxins (Dambach et al. 2005). Similarly, rapid, sensitive and relatively inexpensive cell-based hepatotoxicity screenings can be performed using adenovirus constructs. A major advantage of adenovirus procedure is its versatility that allows generating cells expressing desired levels of multiple genes. Thus, customized cells over-expressing a single enzyme or expressing a combination of several drug-metabolizing enzymes that are representative of the average activity in human liver/hepatocytes or that mimic a particular population group (i.e. extensive or poor metabolizers) can be easily prepared.
8.2 iPS cells for modeling diseases and ADMET
An alternative to primary human hepatocytes may be the use of other cells, such as human fetal liver cells, or adult liver stem/progenitor cells. In this section, the focus is on the potential of these possible cell sources for liver cell transplantation. Hepatocytes have been differentiated from a number of different stem and somatic cell sources, including mesenchymal, fibroblast, embryonic and induced pluripotent stem (iPS) cells. The use of somatic cell sources has grown in the past few years, and iPS-derived hepatocytes have been generated from a variety of species including mouse (Okita et al. 2007; Sancho-Bru et al. 2011), human (Takahashi et al. 2007b; Yu et al. 2007; Song et al. 2009) and pig (Aravalli et al. 2012). Recent technological advances in iPS derivation have evolved for the development of footprint and feeder-free lines (Iwamuro et al. 2010; Nagaoka et al. 2010; Yu et al. 2011) and the use of non-integrating episomal vector reprogramming of the patient T-cell population (Brown et al. 2010; Mack et al. 2011). These iPS cells can be expanded and directly differentiated into hepatocytes in vitro and are capable of many hepatic functions (1) albumin secretion, glycogen storage, drug metabolism, drug transportation and lipogenesis (Rashid et al. 2010; Si-Tayeb et al. 2010; Chen et al. 2012). Human iPS-derived hepatocytes exhibit key morphological features of differentiated hepatocytes (2) senescence and polyploidism as well as differentiated gene expression and function (Fig. S5; see ESM). A promising application of IPS-derived hepatocytes will be to study inherited metabolic disorders of the liver such as progressive familial hereditary cholestasis, α1-antitrypsin deficiency, glycogen storage disease type 1a, familial hypercholesterolemia, hereditary tyrosinemia and Crigler–Najjar syndrome (Ghodsizadeh et al. 2010; Rashid et al. 2010). Rashid and colleagues recently showed that their iPS-derived hepatocytes were capable of maintaining the phenotypic characterization of their intrinsic disease properties. In another study, they were able to use zinc finger nucleases (ZFNs) and PiggyBac technology in human iPS cells to correct a point mutation (Glu342Lys) in the α1-antitrypsin gene that is responsible for α1-antitrypsin deficiency (Yusa et al. 2011). These studies are an important proof of concept that different mechanisms of inherent liver diseases can be recapitulated in iPS-derived hepatocytes. Another in vitro application will be for the study of hepatitis infection and disease. Recently it has been shown that both mouse and human iPS-derived hepatocytes are capable of HCV infection and replication (Aly et al. 2011; Yoshida et al. 2011; Si-Tayeb et al. 2012).
Since iPS cells can bypass the ethical concerns surrounding embryonic stem cells (ESCs), they represent an ideal source of patient and disease-specific cells for clinical applications. In order to reduce the dependence on donor liver organs, iPS hepatocytes have been evaluated for cell therapy treatments. In recent studies, iPS-derived hepatocyte functions have been tested to determine whether these cells are useful for cell replacement therapy applications such as in a bioartificial liver (Yu et al. 2012) and their functional integration in drug-induced rodent models of the liver (Asgari et al. 2011).
Hepatotoxicity and the variability of individual responses are major causes of drug failure during pre-clinical testing. Therefore, a useful application of iPS-derived hepatocytes will be to screen drugs tailored to the individual patient and genetic background. Moreover, this will also be useful for the study of idiosyncratic drug interactions. The net result of this approach would substantially decrease the risk and cost associated with clinical trials and will lead to a more personalized approach in drug administration.
8.2.1 Limitations and challenges of using iPS-derived hepatocytes for studying human liver diseases
It is known that many metabolic disorders of the liver and hepatotoxicity require interactions between hepatocytes and the other liver NPCs (see sections “Non-parenchymal cells and their role in hepatotoxicity” and “Use of in vitro systems for predicting liver toxicity”). While many advantages to having patient-specific iPS-derived hepatocytes exist, the development of models that include these hepatocytes along with other key signals from extracellular matrices and other liver cells may be necessary when testing unknown mechanisms of disease and drug toxicity. In addition, it is known that differences in iPS reprogramming (Kim et al. 2010c) and epigenetic cell memory (Ohi et al. 2011; Ruiz et al. 2012) can cause variability in subsequent differentiation procedures. Advances in iPS cell reprogramming will be needed to understand and generate more consistent iPS cell cultures for subsequent hepatocyte differentiation procedures. Another challenge is the large quantities of hepatocytes required for large-scale toxicology and drug interaction screenings. These iPS-derived hepatocytes will need to be produced in large volumes with consistent functionality and gene expression between batches. Current developments exist that provide large numbers of functional iPS-derived hepatocytes (CDI, unpublished results). In addition to the difficulty of generating this high volume of cells, the possibility of teratoma formation is a concern. Many, recent, remarkable advances in the field of stem cell–derived hepatocytes have been made (Takebe et al. 2013). However, major challenges still exist, and more studies are needed to address the key issues surrounding the expansion and development of these cells to achieve an efficient differentiation into pure and functional populations of disease- and toxicity-relevant hepatocytes.
8.3 Embryonic stem cell-derived hepatocytes
Embryonic stem cells (ESCs) have been extensively studied as a potential cell source for cell replacement therapies and drug development due to their self-renewing capability and a strong proliferation rate. Many protocols have been developed in order to differentiate several cell types from ESCs (Kim et al. 2002; Kehat et al. 2004; Lako et al. 2001; Suzuki et al. 2005; D’Amour et al. 2006; Soto-Gutierrez et al. 2007). In an elaborate study, Duan et al. (2007) described a method to differentiate human ESC in hepatocyte-like cells. For the first time, they demonstrated by a bioluminescence imaging that purified differentiated ESCs express liver-specific genes at physiological levels and exhibit liver-specific functions comparable to those of primary human hepatocytes. In addition, the differentiated ESCs are able to engraft mouse livers and produce human albumin detectable in mouse serum. Moreover, they found human liver-specific mRNA and protein species in the liver of transplanted mice after 3 weeks of transplantation (Duan et al. 2007). Cai et al. (2007) reported a protocol to differentiate ESCs in hepatic cells, by treatment with activin A for 3 days followed by treatment with fibroblast growth factor-4 and bone morphogenetic protein-2 for 5 days. The hepatocyte-like cells obtained express the adult liver cell markers tyrosine aminotransferase, tryptophan oxygenase 2, phosphoenolpyruvate carboxykinase (PEPCK), CYP7A1, CYP3A4 and CYP2B6. Moreover, the cells were able to secrete albumin, store glycogen, indocyanine green, and uptake low-density lipoprotein, and possessed inducible CYP activity. Several other reports showed methods to obtain hepatocyte-like cells from ECSs (Touboul et al. 2010; Basma et al. 2009), suggesting the potential of these embryonic cells to differentiate into mature hepatocytes. Despite such potential, the clinical application of ESCs is associated with practical and ethical concerns. In general, these cells proliferate extensively in vitro and possess high levels of telomerase activity and, when injected in mice, they generate teratoma and eventually teratocarcinoma (Przyborski 2005). Therefore, the persistence of undifferentiated ESCs and their differentiation into NPCs after infusion in mice is a serious concern about long-term safety of these cells. At present, there are no clinical trials using ESCs to treat liver diseases in human patients.
8.3.1 Foetal liver cells
An alternative source of stem cells for hepatocyte production was found in fetal liver by Suzuki et al. (2002). They developed a hepatic colony-forming unit in culture (H-CFU-C) assay to isolate hepatic progenitor/stem cells from mouse liver characterized by multi-lineage differentiation potential and self-renewing capability. These cells, when clonally propagated in culture, can both maintain their primitive stem cell feature and produce hepatocytes and cholangiocytes as descendants. When transplanted in recipient animals, mouse fetal liver stem cells differentiated into hepatocytes and cholangiocytes. Moreover, they differentiated into pancreatic ductal and acinar cells or intestinal epithelial cells when transplanted into the pancreas or duodenal wall (Suzuki et al. 2002). Other studies described the possibility to isolate precursor cells from the fetal liver in rodents (Tanimizu et al. 2003; Oertel et al. 2006). These results prompted researchers to isolate progenitor cells also from human fetal livers. Nava et al. (2005) identified and isolated from early human fetal livers a cell population positive for the two hematopoietic markers CD117 and CD34, but not hepatic markers, able to differentiate in vitro into hepatic cells when cultured in presence of HGF and EGF. These differentiated cells expressed the hepatic markers such as albumin, AFP, α1-antitrypsin and CK19. Moreover, they found in the later gestation time a subpopulation of cells expressing CD90 and co-expressing hepatic markers. They proposed that, during liver development, the two earliest markers expressed by hepatic precursor cells are CD117 and CD34 and that CD90 marker appears later (Nava et al. 2005).
Dan et al. (2006) reported the isolation and characterization of a stable population of human liver progenitor cells, called human fetal liver multi-potent progenitor cells (hFLMPCs), from the human fetal liver. hFLMPCs were characterized by mesenchymal stem cells properties such as the osteogenic, adipogenic, chondrogenic and endothelial differentiation ability, and express the mesenchymal–epithelial transition marker. These cells can differentiate into functional hepatocytes and bile duct cells although do not express liver-specific genes. Moreover, hFLMPCs possess the repopulation ability in a mouse model of liver injury (Dan et al. 2006).
Schmelzer et al. (2007) isolated from fetal liver a human hepatic EpCAM + stem cell population expressing CK8, CK18, and CK19, CD133/1, telomerase, CD44H, claudin 3, and albumin. These cells are negative for α-fetoprotein, intercellular adhesion molecule (ICAM) 1, and for CYPs, CD45 and some endothelial markers. When cultured on feeder layers of embryonic mouse fibroblasts, these cells differentiate into hepatoblasts. Both freshly isolated EpCAM + cells and human hepatic stem cells expanded in culture can give rise to mature liver tissue expressing human-specific proteins, when transplanted into NOD/SCID mice (Schmelzer et al. 2007).
In recent work, Gridelli et al. (2012) described a 5-step method, characterized by a portal vein in situ perfusion technique, to isolate cells from fetal liver tissue obtained from the late second trimester of gestation (gestational weeks 18–22). They found a heterogeneous population characterized by cells expressing hepatocyte markers (CK18), albumin-positive cells, α-fetoprotein–positive cells, HNF-4 positive cells and asialoglycoprotein receptor–positive cells. The population also included CK19+ cells (a bile duct marker), CD68+ cells (Kupffer cells), epithelial cell adhesion molecule (EpCAM) cells, as well as cells expressing markers associated with mesenchymal stem cells. Of interest, this cell population was used in the first clinical application by splenic artery transplantation in a patient with end-stage liver disease. It was observed a reduction in MELD score, which was the main clinical end point in the study protocol, from 15 to 11 at 3-month and to 10 at the 18-month follow-up and the patient continued to show no signs of encephalopathy, suggesting that fetal liver stem cells could be a feasible cell source for liver cell therapy (Gridelli et al. 2012).
An interesting interpretation about fetal liver development was proposed by Zhang et al. (2008a). They assumed that the hepatic stem cells secondarily give rise to hepatoblasts, the presumptive transit amplifying cells. The hepatic stem cells are located in vivo in stem cell niches that are represented by the ductal plates in fetal and neonatal livers and by canals of Hering in pediatric and adult livers. The hepatic stem cells express the epithelial cell adhesion molecule (EpCAM), neural cell adhesion molecule (NCAM), CK19, albumin± , and are negative for α-fetoprotein. The hepatoblasts are contiguous to the niches, decline in numbers with age and differ from hepatic stem cells in expressing albumin++, and AFP++. Thus, the canals of Hering are shown to be the adult remnants of the ductal plates containing the hepatic stem cells that give rise to the hepatoblast. This assumption suggests symmetry between fetal and adult liver transition and indicates the adult reparative process as a recapitulation of fetal development. Moreover, this interpretation could explain the response of liver regeneration to specific diseases. In particular, the involvement of hepatic stem cells and minimal response from the hepatoblast, during massive liver necrosis and, by contrast, the expansion of the hepatoblast in chronic diseases such as cirrhosis (Zhang et al. 2008a).
8.3.2 Human adult liver stem cells
Evidence from several studies indicates the presence of resident stem cells in the adult liver (Fausto 2004; Shafritz et al. 2006). Results based primarily on models of liver injury and carcinogenesis in experimental animals led to the concept that a potential stem cell compartment is located within the smallest branches of the intrahepatic biliary tree (Fausto 2004). The human liver progenitor cell activation and proliferation has been mainly observed during acute and chronic liver diseases. Herrera et al. (2006) described in the adult a population of pluripotent resident liver stem cells (HLSCs) able to localize within the injured liver and contribute to liver regeneration when injected in non-immunocompetent mice with acute liver failure induced by acetaminophen. HLSCs can be isolated by culturing under stringent conditions hepatocytes obtained from normal human liver and are able to grow for up to 30 passages in culture. HLSCs express CD29, CD90, CD73 and CD44 mesenchymal markers, nanog, Oct-4, Sox2, and SSEA-4 α-fetoprotein embryonic stem cell markers and liver-specific markers such as human albumin, CK18 and CK8. In addition, HLSCs are negative for hematopoietic (CD34 and CD45), oval stem cell markers (CD45, CD34, and CD133 and CK19), α-SMA, NCAM and STRO-1. HLSCs, like mesenchymal stem cells, are characterized by the ability to differentiate into osteogenic, adipogenic, endothelial and insulin-producing cells when cultured in appropriate conditions. Moreover, HLSCs can be in vitro differentiated into mature hepatocytes by culturing in the presence of a combination of FGF-4 and HGF. When cultured in a rotary bioartificial liver (BAL), HLSCs spontaneously acquired an hepatocyte phenotype increasing the expression of liver-specific markers and acquiring the expression of CYPs concomitantly a downregulation of embryonic and fetal liver markers. In addition, HLSCs gain liver-specific metabolic activities such as detoxification capabilities, cleavage of the CYP substrate and urea production. In addition, HLSCs in rotary bioartificial liver (BAL) markedly enhanced the production and release of HGF in respect of adherence culture conditions. The quantitative difference was 20-fold higher in HLSCs in rotary BAL than in adhesion. Moreover, when cultured in rotary BAL, HLSCs acquired the expression of liver-specific transcription factors such as HFN-4 and C/EBP (Fonsato et al. 2010). The presence of a progenitor/stem cell population in the adult liver was confirmed by Khuu et al. (2007) that describe an epithelial cell population with characteristics similar to HLSC. However, this cell population is more engaged in the hepatocytic lineage than HLSC (Khuu et al. 2007).
Duret et al. (2007) isolated non-parenchymal epithelial cells (NPE) from samples of human liver resections obtained from patients who underwent lobectomy. These cells are negative for classic stem/progenitor cell markers (Oct-4, Rex-1, α-fetoprotein, CD90, c-kit and CD34), are only slightly positive for albumin, but possess a strong proliferative potential. Despite the lack of stem cell phenotype, NPE cells are able to differentiate into mature hepatocytes when cultured in presence of HGF, EGF and FGF-4 and express albumin, α1-antitrypsin, fibrinogen, hepatobiliary markers such as CK7, CK19 and CK8/18, liver-enriched transcription factors and genes typical of either a fetal (CYP3A7 and GST pi) or a mature (tyrosine aminotransferase, tryptophan 2,3-dioxygenase, GST alpha and CYP3A4) (Duret et al. 2007).
8.3.3 Hepatocyte proliferation induced by gene transfer
The availability of in vitro proliferating hepatocytes that maintain many or ideally all of their differentiated in vivo functions would greatly advance research in hepatology as well as pharmacology and toxicology. Therefore, numerous studies have been performed to immortalize hepatocytes, particularly human hepatocytes (e.g. Tsuruga et al. 2008; Wege et al. 2003; Kobayashi et al. 2001). For example, human reverse transcriptase (hTERT), E5/E7, SV40, inactivation of the p16/RB and/or p53 pathways have been used successfully to induce hepatocyte proliferation. In addition to permanent expression, reversible strategies of hepatocyte immortalization have also been tested (Kobayashi et al. 2001). A general difficulty of these approaches has been that hepatocytes tend to dedifferentiate in vitro even under “mild” genetic manipulations. So far it has been impossible to maintain all (or even most) functions and gene expression levels similar to that of hepatocytes in vivo.
Recently, a new approach on generation of proliferating human hepatocytes has been published (Burkard et al. 2012). The cells, called “upcyte hepatocytes,” show inducible CYP1A2 and 3A4 activities, albeit lower than freshly isolated human hepatocytes. Phase II enzyme activities (UDP glucuronidase, sulfotransferases and glutathione-S-transferases) were reported to be comparable to that of freshly isolated primary human hepatocytes (Burkard et al. 2012). The cells are able to produce urea and are sensitive to known hepatotoxins, suggesting that they represent a promising model. However, future experiments using functional readouts, as well as genome-wide gene expression analyses, will show how closely these in vitro proliferating human hepatocytes resemble freshly isolated human hepatocytes or human liver tissue and how stable they are during culture. A limitation of the technology is that the “proliferation-inducing genes” are part of a proprietary technology (Braspenning et al. 2010) that has not yet been published.
9 Use of in vitro systems for predicting metabolism and drug interactions
9.1 Prediction of hepatic drug clearance


9.1.1 Overview of prediction methodology status
During the last several years, the position of primary human hepatocytes as the prominent tool for prediction of hepatic clearance has been consolidated. Widespread commercial availability of cryopreserved human hepatocytes has underpinned their adoption for routine use. At the same time, continued methodological investigation has increased our understanding of both the application and limitations of this versatile in vitro system. However, there remain major challenges to the guaranteed achievement of reliable predictions of clearance using this human-liver-derived in vitro system. In particular, underprediction bias is inherent, although it is poorly resolved from other substantial uncertainties including wide phenotypic variation in drug-metabolizing enzyme expression. Although much prediction uncertainty may arise in vitro, investigation into the causes of bias has particularly focused on extrapolation methodology—where certain underlying principles remain under debate—highlighting the importance in understanding the limitations of extrapolation methodology for prediction of clearance from in vitro systems. In addition, increasing investigation into drug transport (both passive and active) using hepatocytes has highlighted the potential underlying complexity of measurements of clearance (CL) in this system.
9.1.2 In vitro–in vivo extrapolation: a work in progress
Extrapolation of intrinsic clearance (CLint) measurements using hepatocytes (or microsomes) to give predicted CLin vivo involves a widely established two-step mechanistic approach: physiological scaling from cell to whole liver and subsequent modeling of extraction from blood by the liver (Houston 1994; Pelkonen and Turpeinen 2007; Fagerholm 2007). Early application in rat studies indicated satisfactory accuracy with this methodology (Houston and Carlile 1997; Ito and Houston 2004), but more recent reports have showed a consistent tendency toward underprediction (more than several-fold) of human in vivo CLint from human hepatocytes (Riley et al. 2005; Brown et al. 2007; Stringer et al. 2008). As the use of human hepatocytes from liver donors has eclipsed the rat equivalent, both steps of the mechanistic extrapolation approach have received re-appraisal and suggested refinement in recent years. For the hepatocyte-to-liver scaling factor, a consensus has been reached (as for microsomes) based on a number of relevant studies providing a relatively unbiased standard value together with some indication of the associated uncertainty (Barter et al. 2007). Liver models, on the other hand, have continued to cause debate. Three alternative models, which differ in complexity only in relation to liver perfusion—the well-stirred (venous equilibrium) model, the parallel tube model and the dispersion model—predate the widespread use of human liver in vitro systems but remain accepted standards. There has been a level of consensus that the models are equally compatible with all but the most highly cleared drugs leading to pragmatic acceptance of the simplest of these, the well-stirred model (Ito and Houston 2005; Hallifax et al. 2010). Debate has instead been focused on the appropriateness of the fraction unbound in blood (fu) term (common to all models) which relies on the simple assumption of rapid equilibrium of unbound drug (the assumed mechanistic object of CL) either side of the hepatocyte plasma membrane. Concern has been raised in a number of reports in which in vitro intrinsic clearance measurements for some drugs were not directly dependent on the fraction unbound when serum (or isolated plasma protein) was included in the assay (Baba et al. 2002; Tang et al. 2002; Shibata et al. 2002; Blanchard et al. 2004, 2006). One particular explanation invokes the concept of facilitative uptake of protein-bound drug into hepatocytes—a process which would, at least partially, negate the unbound drug hypothesis (Burczynski et al. 2001; Poulin et al. 2012). Alternatively, it has been suggested that no equilibrium exists between drug bound in the hepatic sinusoids and drug taken up through the hepatocyte sinusoidal membrane (Baker and Parton 2007). In both cases, modeling of the respective mechanisms has been proposed but, to date, direct experimental support has been lacking. Also, both proposals have cited evidence of a trend of decreasing prediction accuracy with increasing binding to plasma protein to support the proposed impact of fu on prediction (Riley et al. 2005; Ring et al. 2011). However, a more extensive comparison of fu and prediction did not confirm such a trend (Hallifax et al. 2010; Hallifax and Houston 2012). Further elucidation of the role of binding to plasma protein in extraction of drug by the liver is required to clarify whether there is a need to modify the liver model component of the extrapolation process.
Measurement of intrinsic clearance by substrate depletion is favored over metabolite formation kinetics for routine assay, reflecting a need for pathway inclusivity as well as expediency (Obach and Reed-Hagen 2002; Komura et al. 2005; Mohutsky et al. 2006; Soars et al. 2007a). Although this approach seems appropriate for the primary hepatocyte model, the validity of the underlying assumptions, particularly regarding the combined impact of uptake clearance with metabolic clearance, remains under debate (Jones and Houston 2004, 2012). Soars et al. (2007a) proposed that total CLint could most accurately be estimated according to drug depletion from the medium, rather than (as conventionally) from the whole incubation. However, caution is required in the interpretation of substrate concentration–time profiles because of the potential impact of any substantial, but reversible, intracellular binding on the initial rate of depletion from the medium. Hence, dual incubations involving both media loss and total incubation loss are necessary to resolve mechanisms due to uptake rather than intracellular binding (Hallifax and Houston 2006; Jigorel and Houston 2012). Nevertheless, this approach reflects increasing awareness of involvement of processes other than metabolism, when using hepatocytes to predict CL and may represent a safe option when the mechanism of hepatic clearance is not unknown.
Moreover, it has become evident that the specific processes of drug disposition in the hepatocyte (in vivo and in vitro), including binding to protein (external and internal) and/or membranes, permeation (passive diffusion and active uptake/export) and metabolic turnover should ideally be quantified simultaneously (Lave et al. 2007; Webborn et al. 2007; Baker and Parton 2007) (Fig. 34). In recent years, the increasing incidence of drugs that are transporter substrates has led to the need to characterize all these processes, in particular resolve active uptake from passive uptake and, in some cases, metabolism (Shitara et al. 2006; Webborn et al. 2007; Paine et al. 2008; Grime et al. 2008; Badolo et al. 2010; Menochet et al. 2012). To this end, dynamic modeling of drug extraction from blood (or in vitro media) is inevitably favored over the conventional static modeling approach. Potentially, this methodology could also incorporate any critical artifactual differences in vitro (compared with in vivo) such as restricted removal of metabolites, diffusion through an external unstirred water layer (Lu et al. 2006) and/or modified cofactor supply—issues which have received relatively little attention.

Relation of predicted CLint, in vitro and CLint, in vivo for hepatocytes (a) and microsomes (b). Dashed lines represent unity, fitted power functions and (a) upper and lower limits of bias correction for hepatocytes. From: Hallifax et al. 2010
The advent of successful commercial software for whole body modeling such as SimCyp, which can incorporate inter-individual variability (physiological, CYP genotype and gastro-intestinal absorption) has made prediction of clearance integral with prediction of pharmacokinetics a routine procedure (Howgate et al. 2006; Lave et al. 2007). But as with the more traditional in-house physiologically based pharmacokinetic (PBPK) whole body models (practiced over a longer period), there has been little development of the liver component from the standard models (described above). Beyond the extrapolation modeling issues, successful methodology for prediction of CL will ultimately depend on resolving the biological variability in vitro—inherent in drug transporter and drug-metabolizing activity—with that in vivo. Currently, methodology is judged, at best, by average activities among livers from a range of donors and average CL measured for a range of clinical subjects, for drugs representative of the various physicochemical types. The implications of this situation are discussed below.
9.1.3 Current expectations in prediction from hepatocytes
Commercially available cryopreserved human hepatocytes, used in suspension, are the most established hepatic cell system for prediction of human clearance, are generally considered to be superior to alternative primary hepatocyte culture systems and have substantially replaced the previous microsome standard model (Blanchard et al. 2005; Griffin and Houston 2004; Soars et al. 2007b). At the same time, it has been recognized that predictions from primary hepatocytes are frequently inaccurate. A recent assessment of published predictions of CL found that human cryopreserved hepatocytes, on average, underpredicted in vivo CLint by about fourfold, whereas human liver microsomes underpredicted by about fivefold (Hallifax and Houston 2010), consolidating previous reports (Naritomi et al. 2003; Bachmann et al. 2003; Riley et al. 2005; Brown et al. 2007; Stringer et al. 2008). Some tendency toward underprediction using microsomes is anticipated given their incomplete set of CL pathways (including phase II metabolism and uptake transport), although this extent of average underprediction suggests additional methodological shortcomings (Lam and Benet 2004; Parker and Houston 2008). However, while microsomal CLint was approximately proportional to in vivo CLint (throughout a wide range), CLint in hepatocytes tended to diverge from in vivo with increasing CLint from relatively unbiased predictions for low CL drugs to poorer predictions (relative to microsomes) for high CL drugs (Hallifax et al. 2010) (Fig. 35). This inconsistency between the systems implies that the causes of underprediction have a substantial in vitro component as opposed to possible extrapolation methodological bias, as discussed above.

Comparison of CLint in cryopreserved HepaRG cells and cryopreserved human hepatocytes. The solid line is the line of identity; the dashed line is the line of regression. From Zanelli et al. 2012
A major difficulty in identifying the general causes of underprediction of CL is the high degree of variance seen among a set of predictions (Blanchard et al. 2006; Hallifax and Houston 2009). Inter-individual variability in expression of drug-metabolizing enzymes (and transporters) is anticipated from the known genotypes but subsequent modulation by various factors (hormonal status, diet, environmental chemicals, etc.) leads to unpredictable phenotypes and hence problematical use of a population average (Shah 2005). For several CYP substrates, CL ranged about fourfold between clinical subjects, whereas in vitro, CYP activities were found to range from 30- to 100-fold (depending on the CYP) for either microsomes or hepatocytes (in a database of commercially available material), indicating a wide inherent in vitro variation (Hallifax and Houston 2009). Moreover, the in vitro activity of each of five major CYPs was found to be distributed log-normally, a characteristic which could further confound meaningful use of average values or the utility of multi-donor pools. Prediction based on modeling of genotypically defined variability (such as SimCyp) may also be confounded by this phenotypic variability.
Against a background of prediction reports involving unmatched clinical subjects and liver donors, a direct comparison of CLint between microsomes and hepatocytes from the same livers was reported by Foster et al. (2012). In this case, CLint was similar on average between the systems, for a range of drugs. However, CLint values from hepatocytes tended to exceed those from microsomes at low CLint (<10 ml/min/kg), while values from microsomes tended to exceed those from hepatocytes at higher rates. This trend, resolved from the experimental variance between CLint for several pathways, further suggests the existence of rate-limiting factors specifically associated with hepatocytes. As described above, the measurement of CLint using hepatocytes may yield an impure value which combines the influence of drug uptake (passive and active) and intracellular binding with drug metabolic turnover—from which CLint of unbound drug representing the situation in vivo must be resolved. Specific in vitro factors which could rate limit the measurement of CLint in hepatocytes would include cofactor exhaustion and/or passive permeability across the cell membrane; for the latter, however, there was no evidence found when the ratio of permeability to CLint, for several types of permeability assay, was compared with prediction of CLint (Hallifax and Houston 2012). In the current absence of any mechanistic solution(s) to the problem of underprediction of CL from hepatocytes, the use of an empirical correction of bias (according to the trend outlined above) helps to minimize prediction bias. Likewise, judicious selection of hepatocyte pools from a range of donors may help to minimize precision error. It would seem that a key limitation in prediction methodology to be addressed is the relationship between genotype and phenotype, both in vivo and in vitro.
9.1.4 Future development of the hepatocyte model for prediction of clearance
Currently, important limitations of the standard primary hepatocyte model for prediction of CL appear to be negative bias and high phenotypical variability, as discussed. Solving the bias would seem to necessitate resolution of the variability, the more fundamental problem. As yet, prediction performance can only be standardized using donor pools with the assumption that average in vitro phenotypes will match average clearance among clinical subjects. To overcome the unresolved relationship between genotype and phenotype (especially apparent among liver donors), further control of phenotypical expression is ideally required; an ideal hepatocyte (for use in suspension) would have activity predictable from a predefined genotype, preferably one reflecting an average expression of all pathways or typical subpopulation genotypes. Development toward such a standardized hepatocyte model is conceivably achievable via cell line system development (potentially offering custom phenotyping), especially considering recent advances in hepatocyte-like cells, such as those derived from hepatocellular carcinoma cell lines which have recently indicated potential for prediction of CL (Guillouzo et al. 2007). In particular, the HepG2 cell transfected (via adenovirus) separately with CYPs 1A2, 2C9 and 3A4 displayed CLint (based on relative activity factor scaling) comparable with in vivo and hence an improvement on that reported for cryopreserved hepatocytes (Donato et al. 2010). Alternatively, HepaRG cells, which, in culture, have previously been shown to express CYP activity comparable with primary hepatocytes (Aninat et al. 2006; Kanebratt et al. 2008a; Antherieu et al. 2010; Lubberstedt et al. 2011), now appear to be successfully cryopreservable; in a recent assessment, prediction of CLint for 26 CYP substrates was generally in close agreement with cryopreserved hepatocytes, indicating the potential of this novel product as a practical alternative in vitro system for routine use (Zanelli et al. 2012) (Fig. 36). Although a fully customized and widely available hepatocyte-like in vitro model may be some way off, these developments are encouraging for that goal.

Simulation of blood and liver concentration profiles based on a simple PBPK model shown in Fig. S6; see ESM
9.2 Drug–drug interactions: prediction of enzyme induction, inhibition, transporter and enzyme interplay, active uptake, and clearance


Drug–drug interactions (DDIs) can take place during any of the pharmacokinetic processes, such as absorption, distribution, metabolism and excretion, and can cause significant changes in drug efficacy as well as adverse events. Therefore, it has always been an important issue in drug development to predict the degree of DDIs based on the preclinical data. Among the various mechanisms of DDIs, those involving drug metabolism have long attracted much attention and the methods for their accurate prediction have been investigated by many researchers (Ito et al. 1998; Tucker et al. 2001; Yao and Levy 2002; Houston and Galetin 2010; Rostami-Hodjegan 2010).
Recently, as the role of drug transporters in pharmacokinetics has been explored, more and more cases of DDIs involving drug transporters have been recognized which could also be of clinical significance (Shitara et al. 2005; Zhang et al. 2008b; Grover and Benet 2010; Unadkat et al. 2010). Furthermore, some of the DDIs have been suggested to be caused by the inhibition of both metabolism and transport by a co-administered drug (Shitara and Sugiyama 2006; Yoshida et al. 2012). Attempts to predict the degree of these interactions have just started.
9.2.1 DDIs involving drug-metabolizing enzymes
Inhibition of drug metabolism can cause an increase in drug concentrations, depending on the potency of the inhibitor and its concentration. When an enzyme is competitively or non-competitively inhibited and the substrate concentration is much lower than its Km (Michaelis constant) value, the extent of reduction in metabolic activity (CLint; intrinsic clearance) can be expressed as 1 + [I]/Ki, where [I] is the inhibitor concentration around the enzyme and Ki is the inhibition constant which can be obtained in in vitro studies (Rowland and Matin 1973). In the case of interactions involving a mechanism-based inactivation of the enzyme, the CLint reduction depends also on the exposure time of the enzyme to the inhibitor and enzyme turnover, which can be characterized by the kinetic parameters for the enzyme inactivation (kinact and K′app) obtained from in vitro studies and k deg, the degradation rate constant for the enzyme (Silverman 1995; Mayhew et al. 2000).
The simple and convenient approach for predicting the magnitude of in vivo DDIs due to metabolic enzyme inhibition is to estimate the degree of AUC increase in the substrate in the presence of a co-administered inhibitor, compared with that in its absence, which can be calculated based on the CLint reduction (by either competitive inhibition or inactivation) along with the fraction metabolized by the inhibited enzyme (fm) (Ito et al. 2004, 2005; Brown et al. 2005; Zhang et al. 2007b; Obach et al. 2007). False-negative predictions of AUC increase caused by the competitive inhibition of hepatic enzymes can be avoided using a maximum concentration of inhibitor at the inlet to the liver (I in,max):
where I max, ka, Fa and Qh represent the maximum inhibitor concentration in the systemic circulation, absorption rate constant, fraction absorbed and the hepatic blood flow, respectively (Ito et al. 2002; Obach et al. 2006).
On the other hand, induction of drug-metabolizing enzymes can facilitate the drug elimination leading to a reduced concentration. The degree of enzyme induction can be characterized by the parameters such as EC50 (concentration causing half-maximal effect) and Emax (maximum effect) determined in in vitro studies. Fahmi and co-workers have proposed the following equation for predicting the net effect of competitive inhibition, inactivation and induction of the hepatic enzyme (except for CYP3A4 which exists also in the intestine) on the AUCpo (AUC after oral administration) of its substrate:
where A, B, and C represents the CLint change due to inactivation, induction and competitive inhibition of the enzyme, respectively (Fahmi et al. 2009). The draft guidance for industry recently issued by FDA also suggests the use of this equation as a “mechanistic static model” for prediction of the in vivo DDIs involving investigational drugs (FDA 2012).
For a more detailed evaluation of the DDIs than the AUC increase in substrates, the time profiles of the substrate concentration in the presence and absence of inhibitor can be simulated by using a PBPK model which describes the disposition of both substrate and inhibitor (Kanamitsu et al. 2000; Rowland et al. 2010). Kato and co-workers have shown that the AUC increase can be successfully predicted for most of the CYP-mediated interactions using PBPK modeling, while substantial overestimation was observed for the predictions using a fixed inhibitor concentration (I in,max). They suggest the use of in vivo Ki values, estimated from regression analyses of clinical DDI data, in order to make successful predictions (Kato et al. 2008). For mechanism-based inactivation of enzyme, the changes in midazolam concentration due to co-administration of macrolides with different inhibitory potency against CYP3A (erythromycin, clarithromycin and azithromycin) were successfully predicted based on a PBPK model for the substrate (midazolam), inhibitor (macrolides) and the active CYP3A content in the liver, using the kinetic parameters for the enzyme inactivation (k inact and K′app) obtained from in vitro studies together with the pharmacokinetic parameters for the drugs (Ito et al. 2003a). The use of PBPK models for predicting DDIs is expected to increase as the FDA draft guidance mentioned above has suggested the use of PBPK model (“dynamic model”) before conducting a clinical study for evaluating possible DDIs (FDA 2012).
9.2.2 DDIs involving drug transporters
In addition to the DDIs involving drug metabolism, where the enzyme activities are affected by co-administered drugs as described above, the importance of DDIs involving drug transporters is being increasingly recognized. Drug transporters are expressed throughout the body and an alteration in their function can result in changes in absorption, distribution and excretion of their substrates. For example, inhibition of organic anion-transporting polypeptides (OATPs), a hepatic uptake transporter, can lead to the reduction in hepatic clearance of the drug taken up by the transporter, which could result in an increase in its concentration in the systemic circulation. Inhibition of P-glycoprotein (P-gp) or breast cancer resistance protein (BCRP) could also result in reduced biliary/renal excretion of a drug as well as increased absorption from the intestinal tract.
Similar to the enzyme inhibition described above, the extent of reduction in transporter activity (CLint) in the presence of an inhibitor is expressed as 1 + [I]/K i in the case of competitive or non-competitive inhibition and a sufficiently low concentration of substrate. Here [I] is the inhibitor concentration around the transporter and Ki is the inhibition constant of the transporter which can be obtained from in vitro studies using hepatocytes, membrane vesicles, tissue slices or gene expression systems (Ueda et al. 2001; Shitara et al. 2005). If the substrate is eliminated mainly from the liver and the rate-limiting process is hepatic uptake, where the overall intrinsic clearance (CLint,all) can be approximated by the CLint for hepatic uptake, the AUC ratio after oral administration with and without an inhibitor can be estimated from 1 + [I]/K i for a hepatic uptake transporter, similar to the case of metabolic inhibition. In the FDA draft guidance (2012), it is recommended that the possibility of a new molecular entity as an OATP1B1/1B3 inhibitor should be investigated based on its effect on the AUC or maximum concentration (C max) of rosuvastatin, pravastatin or pitavastatin (ITC 2010; Giacomini et al. 2010; FDA 2012). The rate-limiting step for the overall elimination of these statins has been suggested to be the hepatic uptake process mediated by OATP1B1/1B3. In the above guidance, the use of the I in,max, originally proposed as the maximum inhibitor concentration to be used for the prediction of DDIs based on metabolic inhibition (see above) is also suggested as the inhibitor concentration associated with the inhibition of OATP1B1/1B3. The decision trees for the DDIs based on other major transporters are also presented in the above guidance (ITC 2010; Giacomini et al. 2010; FDA 2012).
9.2.3 Impact of enzyme and transporter inhibition on the overall pharmacokinetics
Although hepatic elimination of a drug can be affected by the inhibition of either hepatic uptake, metabolism, or biliary excretion by co-administered drugs, the degree of interaction (concentration change) largely depends on the contribution of each process to the hepatic elimination (Shitara et al. 2005; Kusuhara and Sugiyama 2009; Maeda et al. 2011). The overall intrinsic clearance (CLint,all) for hepatic elimination is expressed as follows:
where PSinf, PSeff and CLint represent the intrinsic clearance for hepatic uptake, efflux from hepatocytes to the blood and metabolism/biliary excretion, respectively.
For a drug with a CLint much larger than the PSeff (CLint ≫ PSeff), the CLint,all is approximated by PSinf, according to the above equation. In this case, the CLint,all is directly affected by inhibition of hepatic uptake transporter(s), while the inhibition of metabolism or biliary excretion has almost no impact on the CLint,all. As the blood AUC after oral administration of a drug which is completely absorbed from the gut and mainly eliminated from the liver is expressed as Dose/fbCLint,all based upon “well-stirred” model, where fb represents the unbound fraction in blood, a change in CLint,all directly results in a change in the blood AUC. A simulation study based on a simple flow model shown in Fig. S6 (see ESM) has demonstrated the different effects of inhibiting hepatic uptake and metabolism/excretion on the blood concentration profile (Fig. 37A, upper panel). As a case of this type of interaction, the plasma AUC of atorvastatin (substrate of both OATPs and CYP3A4) has been reported to greatly increase when co-administered with rifampicin (an inhibitor of OATPs) while showing little change when co-administered with itraconazole (an inhibitor of CYP3A4) (Maeda et al. 2011). This finding suggests that the hepatic clearance of atorvastatin is limited by the hepatic uptake process, not by the metabolic process.

PPARα transcriptional regulatory network and dose-dependent transition. Rectangular nodes indicate regulatory transcription factors (TFs), with the PPARα- RXRα heterodimer marked with a bold label. Each edge in the network indicates binding of a TF to the promoter of a target gene (circular nodes). a The “latent” network showing: (1) direct genomic binding by PPARα (thick black edges); (2) indirect genomic binding by PPARα (light blue edges); (3) non-genomic interactions (NGI) mediated by other TFs (dark blue edges). Dose-dependent evolution of the network indicated by expression levels of target genes at 72 h for PPARα ligand concentrations of b 0.001 μM and c 10 μM
In contrast, in the case of a drug with a CLint much smaller than the PSeff (CLint < < PSeff), the CLint,all is approximated by PSinf x CLint/PSeff and, thus, is affected by the inhibition of both hepatic uptake and metabolism/excretion. This is expected to result in the corresponding alteration in the blood AUC (Fig. 37B, upper panel). The maximum effect of inhibiting both hepatic uptake and metabolism/excretion occurs in this situation, where the reduction in CLint,all is the reduction in PSinf multiplied by that in CLint. This idea can be used for DDI predictions in which false-negative predictions need to be avoided (Ueda et al. 2001; Maeda et al. 2010; Yoshida et al. 2012).
On the other hand, the AUC in the liver (AUCh) is expressed as follows, indicating that it is affected by the inhibition of metabolism/excretion but not hepatic uptake, irrespective of the rate-limiting process (Watanabe et al. 2009; Maeda et al. 2010):
This is also depicted by the simulation study shown in Fig. 37 (A and B, lower panels). It is clear from these figures that the inhibition of hepatic uptake has no effect on the AUCh but does affect the concentration profiles and C max in the liver, reflecting the delay in the hepatic uptake process. It should be noted that all these considerations are based on the assumption that the drug is eliminated mainly from the liver: for example, the AUCh is affected also by the hepatic uptake inhibition when the renal excretion of the drug is not negligible (Watanabe et al. 2009; Kusuhara and Sugiyama 2009).
This type of “static” approach has been shown recently by Yoshida et al. (2012) to be useful for the prediction of transporter-mediated DDIs with in vitro inhibition parameters, which enables the pharmaceutical researcher to discuss the need for clinical DDI studies in early drug development phases, even if only a limited number of pharmacokinetic parameters are available. On the other hand, the FDA has demonstrated the usefulness of PBPK model (“dynamic” approach) for evaluating the pharmacokinetic changes (including DDIs) in the patients with renal impairment, which could facilitate drug development and regulatory decision making on whether, when and how to conduct additional clinical trials (Zhao et al. 2012).
10 Use of in vitro systems for predicting liver toxicity
Liver toxicity is a major reason of post-market attrition of approved drugs, accounting for 50 % of the cases of acute liver failure (Lee 2003). Occurrence of drug-induced hepatotoxicity is attributable to the poor predictivity of preclinical animal studies, which can be explained by several reasons, including differences in drug metabolism existing between man and experimental species. To improve and accelerate the process of lead identification and optimization, high-/medium-throughput cell-based assays have been incorporated in early phases of drug development. In vitro screenings, in combination with preclinical in vivo studies, may help guide the selection of drug candidates with minimal hepatotoxicity risk, heightening the predictive capacity for human hepatotoxicity. In this section, mechanistic studies on the mechanisms of compound toxicity, apoptosis, steatosis and idiosyncratic DILI are described.
10.1 Studying the role of the aryl hydrocarbon receptor and dioxin toxicity in primary hepatocytes


Aryl hydrocarbon receptor (AhR) ligands, especially the persistent polychlorinated dibenzo-p-dioxins and dibenzofurans (PCDD/Fs), are human health concerns (Denison et al. 2011; EPA 2012). Some non-persistent AhR ligands, on the other hand, are being assessed as potential pharmacological agents for treating cancer, allergy, asthma and inflammatory bowel disease (Esser 2012). In addition, a clear role for the AhR in normal biology is evidenced by abnormal organ/tissue development and function in AhR knockout mice, suggesting an important role for yet-to-be determined naturally occurring ligands(s) (Gonzalez et al. 1996; Gonzalez and Fernandez-Salaguero 1998; Fernandez-Salguero et al. 1996; Connor and Aylward 2006; Schecter et al. 1999).
Evidence for dioxin cancer and non-cancer toxicity is largely based on observations in laboratory rodent studies. Numerous human epidemiological studies of highly exposed communities and workers, however, have not observed similar effects as those reported in animal studies (Boffetta et al. 2011; Buffler et al. 2011). This discrepancy has created a need to identify useful human cell models to study the effects of dioxin-activated AhR of which primary hepatocytes are particularly well suited. Primary rodent and human hepatocytes have been employed to study the mode of action (MOA) of AhR-mediated liver cancer and its human relevance, the relative potencies of AhR ligands and their species sensitivities, and have potential utility in corroborating observations from human epidemiology studies. The following discussion focuses on AHR-mediated toxicity, and where primary hepatocyte and other liver cell studies have been and could be used further to evaluate the potential of AHR-mediated risks in humans.
10.1.1 Primary hepatocytes as models for understanding AhR-mediated liver tumor mode of action and the human relevance
2,3,7,8-Tetrachlorodibenzo-p-dioxin (TCDD) is one of the most-studied promoters of rodent liver tumors (Dragan and Schrenk 2000; Schwarz et al. 2000). The scientific community, generally views TCDD’s tumor promotion mode of action (MOA) to be threshold in nature (NAS 2006). Primary liver cells can help to answer important aspects of questions posed by threshold and human relevance/sensitivity controversies. Numerous PCDD/Fs initiation-tumor promotion studies have been conducted establishing sustained AhR activation as a necessary key event for the promotion and clonal expansion of altered hepatic foci (e.g. Pitot et al. 1987; Maronpot et al. 1993; Teeguarden et al. 1999; Knerr and Schrenk 2006). AhR activation has been exhaustively studied by evaluating dioxin-induced CYP1A induction, tumor promotion in constitutively active AhR models and AhR polymorphism rat models that are resistant toward dioxin (Viluksela et al. 1997, 2000; Pohjanvirta et al. 1999; Moennikes et al. 2004; Brunnberg et al. 2006). Sustained AhR activation promotes two different liver tumor lineages (Walker et al. 2006). On the hepatocyte side, mature hepatocytes divide to replace eliminated senescent T cells. Hepatocyte replication potentially creates initiated cells with fixed mutations, and the possibility of a new phenotype with autonomous growth potential unless committed to apoptosis. However, AhR activation within initiated cells can facilitate clonal expansion due to inhibition of intrafocal apoptosis (reviewed in Chopra and Schrenk 2011; Buchmann et al. (1994); Stinchcombe et al. (1995); Lue beck et al. (2000). Without AhR inhibition of intrafocal apoptosis, the phenotypically altered foci might likely undergo apoptosis, e.g. the reversibility of clonally expanded foci upon discontinuation of the tumor promoter. Additional key events related to hepatic adenoma development include increased cell proliferation, high-dose necrosis with regenerative repair, centrilobular zonal activation of the AhR, as well as mito-inhibition of mature hepatocytes that are usually required to replace old parenchymal cells, mitochondrial injury, steatosis, estrogen dependency, reactive oxygen, retinoid depletion, porphyria and disruption of gap junctions (Maronpot et al. 1993; Fox et al. 1993; Walker et al. 2006; Shertzer et al. 2006; Aly and Domenech 2009; Chang et al. 2005; Andersen et al. 1997; Lucier et al. 1991; Graham et al. 1988; Hassoun et al. 2000; Baker et al. 1995; Weiss et al. 2008; Munzel et al. 1996; Fattore et al. 2000; Schmidt et al. 2003; Mitchell et al. 2006; Huang and Elferink 2005). On the biliary side of the acinus, oval cell stimulation and portal fibrosis serve as important key event markers preceding the development of cholangiolar carcinomas (Maronpot et al. 1993; Bauman et al. 1995). It appears that the stem cell is pivotal to the development of cholangiolar cancer (Alison 2005; Alison et al. 2009). It is possible that stem cells could give rise to both hepatocellular and cholangiolar tumors following sustained AhR activation (Grisham 1997; Alison 2005; Marquardt et al. 2011; Turner et al. 2011; Gaudio et al. 2009). The key event evidence for stem cells is more limited than that for hepatocytes. Evidence for stellate cell involvement is entirely lacking although they are likely contributors to portal fibrosis and cholangiolar carcinoma (Friedman 2008; Senoo et al. 2010). Overall, the interaction between parenchymal and NPCs in explaining AhR-related liver tumor promotion is consistent with the integrated pathology of liver cancer and key events including hepatotoxicity, regenerative repair and fibrosis (Walisser et al. 2005; Fausto 2004; Pintilie et al. 2010).
Finally, there is a normal biological role of the AhR that must be accounted for in the tumor promotion MOA. Adaptive effects countering sustained AhR, such as Nrf2 induction pathways (Kohle and Bock 2006), which may be more likely at lower dosage of TCDD or in its basal state of activation, could act as a tumor suppressing activity (Fan et al. 2010b). Consequently, there are numerous key events, associative events and modulatory factor questions that primary liver cell studies could be applied toward in better defining the potential risk of liver cancer in humans exposed to PCDD/Fs. A number of options employing purified cultures of primary liver cells, or co-cultures of parenchymal and NPCs, could be explored to better understand the MOA and key events.
-
Numerous cell cycle genes have been identified with AhR activation such as PAI-1 and SOS (Huang and Elferink 2005; Pierre et al. 2011). Primary liver cell cultures could be used to evaluate AhR activation-dependent changes in growth regulatory genes and pathways allowing for both quantitative dose–response assessment, species sensitivities and relative potencies among the PCDD/F congeners (Sartor et al. 2009).
-
Cell cultures could be used to examine the expression of cell receptors, chemokines and cytokines following AhR activation that could explain inflammation and cell proliferation observed following sustained AhR activation and with AHR-induced hepatotoxicity observed in mice (Pande et al. 2005); immune changes associated with liver injury reviewed in (Adams et al. 2010).
-
One area that could be explored is the role of AhR-induced cell cycle inhibition (G1-S) reported following hepatectomy (Bauman et al. 1995; Fox et al. 1993; Hushka and Greenlee 1995; Mitchell et al. 2006). For example, AhR activation impairs E2F regulations of S-phase proteins and this may be a mechanism for explaining how AhR activation induces cell cycle delay (reviewed in Denison et al. 2011; Puga et al. 2000, 2002). Since the relationship between AhR activation and cell cycle factors, such as E2F, has been derived from hepatic cell lines, the use of primary liver cell cultures is necessary to establish relevance for normal parenchymal and NPCs. Or, Does AhR activation-induced inhibition of normal hepatocyte replacement, especially in aging rats where slowing of hepatocyte replication naturally occurs (reviewed by Schmucker and Sanchez 2011), add an additional burden on stem proliferation to replace the loss of aging hepatocytes? Maybe the role of the AhR on inhibiting hepatocyte replication in aging rats explains why tumors do not develop until after the first year of TCDD administration. Other reported pathways affected by the AhR amendable to further study in primary liver cell cultures include retinoblastoma (Elferink et al. 2001; Ge and Elferink 1998) and p53 (Paajarvi et al. 2005).
-
Does the AhR-dependent inhibition of cell cycle transition impact other liver cell types since AhR activity in a stem cell cell-line, for example, has been reported (Kim et al. 2009)? What is not known is whether AhR activation can inhibit oval cell proliferation or the infiltration and proliferation of endothelial progenitor cells that have migrated from the bone marrow (Wang et al. 2012a). By contrast, it has been reported that AhR activation in WB-344 stem cell lines exerts an apparent proliferative response with increased DNA synthesis (Munzel et al. 1996). Does this cell line respond similarly to normal oval cells? Would AhR-dependent inhibition of hepatocyte replication, especially in aging rats, coupled to increased rats of cell proliferation in oval cells, be one of the critical key events in the MOA? Does AhR activation in stem cells alter normal stem cell differentiation? Oval cells offer an important T-cell type to look into other cell cycle control pathways such as Wnt/beta-catenin (Apte et al. 2008).
-
The AhR plays a role in TGF-β expression in the liver (Gomez-Duran et al. 2009). On the one hand, the absence of AhR functioning in AhR knockout mice leads to liver fibrosis (Corchero et al. 2004). These investigators have also shown that primary hepatocytes isolated from AhR knockout mice express greater amounts of TGF-β protein and this may be the reason for smaller livers exhibiting greater apoptosis in AhR knockout mice (Zaher et al. 1998). On the other hand, sustained AhR activation in wild-type rodents results in periportal fibrosis (Hailey et al. 2005). Purified primary liver cells, or co-cultures treated with dioxin, could be used to examine the role of TGF-β and its role in inducing stellate cells to proliferate and produce fibrosis or in TGF-β role in delaying hepatocyte proliferation, increasing apoptosis or facilitating hepatocytes to undergo epithelial to mesenchymal transition (reviewed by Dooley and ten Dijke 2012).
-
TCDD activation of the AhR results in retinoid depletion in rat liver (Hakansson and Hanberg 1989; Kelley et al. 2000; Schmidt et al. 2003). It has been proposed that stellate cells differentiate into a myelofibrolast-like phenotype, producing collagen fibrosis, while losing their vitamin A content (Ramadori and Saile 2002; Glaser et al. 2009; Shmarakov et al. 2010). Could TCDD activation of AhR in quiescent stellate cells trigger their myofibroblast conversion and biliary fibrotic deposition? Retinoid depletion may represent a key event component triggering stellate cell differentiation in myelofibrolasts and increased periportal collagen deposition reported in the two-year NTP 2006 TCDD cancer bioassays (Hailey et al. 2005).
-
Could the separation of zone 1 hepatocytes from zone 3 hepatocytes, with or without co-cultures of various NPCs, provide information on the unique perivenous AhR activation with respect to the MOA? For example, periportal hepatocytes are more responsive to EGF-induced DNA synthesis than perivenous hepatocytes and the polyploidal hepatocytes bordering the central vein, where AhR activation first manifests with TCDD administration in rodents, and are almost non-responsive to EGF (Gebhardt and Jonitza 1991). In intact female rats, following diethylnitrosamine initiation and hepatectomy, EGF receptor expression is distributed along mid-zonal to centrilobular regions of the liver (Sewall et al. 1993). Since TCDD administration causes downregulation of the EGF receptor (Sewall et al. 1993), zone-specific hepatocyte studies may provide insights on the importance of zonal activation involving EGF and its receptor, especially as a modulatory factor of sustained AhR activation leading to tumor promotion.
These preceding ideas are just a few high-level examples that could be examined with primary liver cells in order to more clearly elucidate the liver tumor MOA of sustained AhR activation.
10.1.2 Human sensitivity to dioxins
It is generally believed that humans are less sensitive than rats to dioxin (Connor and Aylward 2006; Moriguchi et al. 2003). This reduced sensitivity is partially explained by the human AhR having a tenfold reduced binding affinity to TCDD than rats (Connor and Aylward 2006). Primary hepatocyte studies corroborate this viewpoint and suggest even less human sensitivity relative to rats (Schrenk et al. 1995; Silkworth et al. 2008; Budinsky et al. 2010; Carlson et al. 2009; Black et al. 2012; Le Vee et al. 2010; Schrenk et al. 1994). Much of the sensitivity comparison is based on CYP1A induction. However, the apparent conservation of AhR-induced phase I and phase II enzyme across species, e.g. CYP1A induction may not really be a species differentiation pathway, and the lack of involvement of these enzymes in the liver tumor promotion MOA raise the possibility that humans are even less sensitive, overall to the carcinogenic potential of PCDD/Fs, than rats as suggested by the CYP1A induction results. Thus, comparing human to rodent sensitivity based on hepatocyte studies of CYP1A induction is conservative but may not convey the true differences between humans and rodents. The reduced human sensitivity relative to rats has been reported for the transcriptomic response to dioxins. Human primary hepatocytes are less sensitive than rats depending on how gene change comparisons are made (Black et al. 2012). Figure S7 (see ESM) shows the genomic response of orthologous and non-orthologous genes with a fold change of 1.5 or greater and a false discovery rate p value <0.05 (adapted from Black et al. (2012). The estimated EC50 values were 0.32 nM (95 % CI 0.16–0.62) and 1.38 nM (95 % CI 0.81–2.3) for rat and human hepatocytes, respectively, indicating humans, on a global genomic response level, were 4 times less responsive. Of course, this includes the core battery genes (e.g. CYP1A) which may not differentiate humans from rodents in a manner relevant to risk assessment (Nebert et al. 1993). In terms of efficacy, the human response was about 40 % of the rat response. When modeling the individual orthologues using the BMD methodology (Thomas et al. 2011), the human genes affected by TCDD were approximately 18-fold less sensitive than rats. When 208 human and 508 rat signaling pathways were compared (each comprised of four or more genes), the estimated benchmark dose model estimates were 10.63 and 0.39 nM for human and rat pathways, respectively, suggesting an approximate 27-fold reduced sensitivity in humans. These types of data could be used to develop species-specific uncertainty factors that would be applied toward extrapolation of rat toxicity data to humans, e.g. supporting an uncertainty factor of 1.0 or less. And, in the future event that in vitro data can be converted into estimates of an intake dose, the points of departure for transcriptional changes could be modeled to established tolerable intake levels of dioxin. Again, the limitation of these data is their acute nature, whereas the sustained AhR activation-dependent tumor MOA may not be reflected in these gene changes. Overall, future studies in human and rodent hepatocytes, in the event the genomic responses can be linked to the MOA phenotypic changes, will be important sources of data for reducing the uncertainty over human sensitivities to PCDD/Fs within risk assessment applications.
10.1.3 Relative potency of dioxins
Since dioxin exposure always occurs as a mixture, where only 17 of the 210 PCDD/Fs congeners have the necessary 2,3,7,8 chlorine substitutions required to activate the AhR, an additive means is desirable for assessing the risk of the dioxin mixture. The toxic equivalency factor (TEF)/toxic equivalency quotient (TEQ) methodology developed by the World Health Organization is the mixture’s additivity method that is relied upon to do so (Van den Berg et al. 2006). However, the TEF method has a number of important limitations that introduces variability and uncertainty in this application. For one, the TEFs, which reflect a single consensus value of a congener’s potency, relative to TCDD, and the TEF value is entirely derived from diverse toxicity studies done in laboratory animals, many of which are CYP1A induction results. In addition, it has been shown that the TEF estimate for PCDD/Fs generally reflects the upper range of the relative potency values representing the collection of studies for a particular congener (Haws et al. 2006). It has been proposed that a probabilistic treatment of the relative potency distribution data sets may provide a better depiction of the true relative potency when applying TEFs in risk assessment. Moreover, almost all of the animal data sets lack cancer bioassay comparisons between the PCDD/F congener and TCDD with just a few exceptions, e.g. 2,3,4,7,8-pentachlorodibenzofuran and hexachlorodibenzo-p-dioxin (Budinsky et al. 2006; NTP 1980). Therefore, the TEFs do not reflect the relative potency comparison across the PCDD/F AhR ligands in humans, the range of variability and uncertainty in overall relative potency of a congener or the critical risk end point of cancer. Limited studies of CYP1A induction in primary human hepatocytes suggest that the TEF values are too conservative but again, CYP1A induction may not accurately depict the gene networks associated with the tumor promotion MOA (Budinsky et al. 2010, 2012; Silkworth et al. 2008). Genomic data for TCDD, 2,3,7,8-tetrachlorodibenzofuran (TCDF) and 2,3,4,7,8-pentachlorodibenzofuran (4-PeCDF) reveal that TCDF and 4-PeCDF are 27-fold and 35-fold less potent than TCDD (Rowlands et al. 2011, 2012). This is based on benchmark dose estimates from transcriptional changes in human hepatocytes that were treated with TCDD, TCDF and 4-PeCDF with corresponding average BMD estimates of 0.27, 7.3 and 9.4 nM, respectively (Fig. S8; see ESM). Data such as these could be used to adjust the current 0.1 and 0.3 TEF values for TCDF and 4-PeCDF, respectively (Van den Berg et al. 2006). Future studies in primary hepatocyte cell cultures with emphasis on genomic pathways anchored to phenotypical changes in the MOA could add useful data in reducing the current uncertainty that exists in the TEF methodology. However, criteria and guidelines will be necessary for how to incorporate in vitro human data into the overall World Health Organization’s TEF method.
10.1.4 Replicating observations reported in human epidemiology studies: Improving Regulatory Values For PCDD/Fs
The US EPA has developed a TCDD-specific reference dose (RfD) that is based on sperm deficit and increased thyroid-stimulating hormone (TSH) data reported in the Mocarelli et al. (2008) and Baccarelli et al. (2008) studies. The US EPA modeled both of these end points as adverse observations despite neither end point being outside the normal clinical range or direct proof of clinical evidence of disease, e.g. infertility or hypothyroidism. However, the desire to use human data over animal data is to be applauded but the uncertainties in this effort need to be carefully revealed and incorporated into risk assessment. With respect to primary hepatocyte studies, the RfD hinges on a fairly simple MOA for how TCDD induction of human UGT isoforms enhances thyroxine (T4) glucuronidation and clearance and how specific UGT isoform induction could increase the risk of hypothyroidism and developmental delays in infants (Kohn et al. 1996; Nishimura et al. 2005; Viluksela et al. 2004). AhR exerts a developmental and physiological role in the liver in response to natural AhR ligands that occur endogenously, e.g. bilirubin, or in the diet (indoles). This is supported by the fact that AhR knockout mouse has defects such as small, fibrotic livers with patent ductus venosus and impaired bile acid metabolism and excretion. Basal activity of the AhR, in response to endogenous ligands, is necessary to reduce apoptosis of hepatocytes. Without the AhR activity, the fetal liver undergoes more apoptosis, is smaller at birth and develops fibrosis, presumably as a result of growth factors trying to stimulate hepatocyte growth. The current thinking is that AhR-activation-induced UGT activity results in clearance of T4 with negative feedback release of TSH from the pituitary gland. The presumption is that elevated TSH levels reported in rat studies due to increased UGT induction and increased T4 glucuronidation are relevant for humans and pose similar quantitative dose–response relationships (Kohn et al. 1996; EPA 2012; Van Birgelen et al. 1995). Since hepatic UGT induction is at the core of this issue, the role of primary rat and human hepatocytes is an obvious tool for exploring uncertainties concerning EPA’s reference dose.
In conclusion, humans are still exposed to dioxins with the diet contributing almost the entire source of exposure (Lorber et al. 2009). Although the current dietary exposure is not associated with adverse health impacts, questions still remain on how sustained AhR activation could contribute to human risk and how levels of exposure should be controlled. On the other hand, there is a keen interest in modulating AhR activity in the treatment of various diseases. Research using primary liver cell cultures will be an important tool in addressing these interests.
10.2 PPARα pathway and hepatocarcinogenesis


High-throughput data sets, specifically transcriptome profiling and genome-wide location analysis, for a preliminary reconstruction of the PPARα signaling have been recently combined and transcriptional network in primary human hepatocytes. Primary human hepatocytes were treated for up to 72 h, with concentrations varying from 0.001 to 10 μM of the PPARα ligand, GW7647 (GW). A relatively small subset of 193 genes was differentially expressed by GW treatment in a time- and concentration- dependent manner, with more than 90 % being upregulated. The transcriptomic dose–response of four of these genes, Acox, Hmgcs2, Cpt1A and Cyp4A11, at 72 h, is shown in Fig. S9 (see ESM), along with validation by qRTPCR measurement.
A published genome-wide profile of PPARα binding using chromatin immunoprecipitation combined with microarray hybridization (ChIP-on-chip) in HepG2 human hepatoma cells was then used to identify differentially expressed genes that had PPARα bound to their promoter regions. In addition, a catalogue of direct binding targets of PPARα with functional PPREs in their promoter was used (Mandard et al. 2004; Heinaniemi et al. 2007; Rakhshandehroo et al. 2010) to assign differentially expressed genes to three groups based on their mechanism of regulation (Shen et al. 2011):
-
1.
Direct genomic binding (DGB), where PPARα induces gene transcription by binding to PPREs in the promoters of target genes, corresponding to the “canonical” mode of action.
-
2.
Indirect genomic binding (IDGB), whereby PPARα is bound to promoter regions of target genes, but not to PPREs—presumably through protein–protein interactions with other transcription factors that directly bind DNA. This “tethering” mechanism has been observed with other NRs like the GR and ER, where it may account for the regulation of 25–30 % of target genes (George et al. 2011; Heldring et al. 2007; So et al. 2007; Stender et al. 2010).
-
3.
Non-genomic interactions (NGI), where PPARα is not bound to the promoter region of a differentially expressed gene. These genes are presumably activated or repressed by other transcription factors activated by phosphorylation or cross talk with alternative signaling pathways.
Surprisingly, a fairly small number (Quistorff 1985) of the 193 differentially expressed genes showed evidence for PPARα binding in the ChIP-on-chip study, with an even smaller subset (Atzori et al. 2009) of these genes containing functional PPREs. Thus, the DGB and IDGB groups consisted of 12 and 24 genes, respectively—with the large majority of genes belonging to the NGI group. The non-PPARα transcription factors that regulate genes in groups (2) and (3) were identified from the TRANSFAC (Biobase Corporation, Beverly, MA) database of confirmed transcription factor–DNA interactions assembled from other genome-wide ChIP studies. Only those transcription factors known to be expressed in the liver were included.
All of these regulatory interactions were assembled to obtain the topology of the “latent” PPARα transcriptional regulatory network (Fig. 38). A small number of transcriptional “hubs” (highly connected transcription factors in the network)—ERα, HNF4α, STAT1, ETS1 and Sp1—regulate the majority of differentially expressed genes that did not show evidence of PPARα binding. Superposing the transcriptomic data from microarray studies onto this deduced network allowed us to characterize the time- and ligand concentration-dependent activation of the PPARα-responsive network. A comparison of the network showing differentially expressed genes at 72 h with 0.001 μM and 10 μM GW, respectively (Fig. 38b, c), shows a progressive recruitment of the hub transcription factors in addition to PPARα. This process is likely regulated by cross talk at the transcriptional level between PPARα and these transcription factors, as well as kinase-mediated phosphorylation cascades initiated by the ligand. Multiple kinases, including MEK, ERK1/2, PI3K, SRC and p38, have been shown to be activated by peroxisome proliferators, through either PPARα-dependent or PPARα-independent mechanisms (Gardner et al. 2003; Ledwith et al. 1996; Mounho and Thrall 1999; Pauley et al. 2002; Rokos and Ledwith 1997; Teruel et al. 2003). Protein–protein interaction databases reveal that a subset of these kinases (ERK1/2, SRC and p38) can also activate the majority of hub transcription factors identified in the network.

Activation of different death receptor signaling pathways depending on the culture conditions of hepatocytes. In the mouse liver and when kept in suspension right after isolation, hepatocytes undergo apoptosis in response to FasL in a manner dependent on the BH3-only protein Bid and mitochondrial outer membrane permeabilization (cytochrome c release) (so-called type II signaling). However, when plated on a stiff collagen monolayer or embedded into a soft collagen sandwich, the FasL signaling pathway switches to a more direct manner that bypasses mitochondria and cleaves and activates effector caspase-3 directly by death receptor-bound caspase-8 (type I signaling). Interestingly, TNFa signaling does not switch in collagen-cultured hepatocytes, as sensitization of FasL-induced apoptosis by a pretreatment with TNFa remains Bid/mitochondria (type II)-dependent
In summary, the current state of knowledge of the PPARα toxicity pathway is described, as well as an outline of an approach to map out this pathway by combining high-throughput data sets from human primary hepatocytes and human hepatoma cell lines. Currently there is no published genome-wide survey of PPARα binding in primary human cells. Other issues that could be clarified by surveying the PPARα pathway in human hepatocytes include:
-
1.
Intracellular localization of PPARα in the presence and absence of ligand.
-
2.
Distinguishing direct genomic versus indirect effects of PPARα activation.
-
3.
Assessing dose-dependent differential gene expression in individual hepatocytes rather than averaged cell populations for a better understanding of the activation mechanism of PPARα target genes (graded vs. switch-like, the latter suggesting involvement of upstream ultrasensitive kinase cascades).
10.3 Hepatocyte in vitro systems to study apoptosis in the liver
The liver has an extraordinary regeneration capacity. After injury, up to 70 % of the liver mass can be restored from the growth and proliferation of the remaining cells. Importantly, in the end, the organ reaches its normal size and contains all the cells necessary for proper functioning. To maintain this homeostasis, it is crucial that regulatory mechanisms for cell death and survival/proliferation are exactly balanced (Rathmell and Thompson 2002). Apoptosis is a tightly regulated form of physiological cell death involved in organ shaping during embryogenesis, tissue turnover in the adult as well as the removal of damaged, misplaced and used-up cells (Meier et al. 2000). Any dysfunction or deregulation of apoptosis can lead to pathological conditions, for example cancer, if mutated cells are not removed (Schattenberg et al. 2006; Schattenberg et al. 2011a).
Liver injury involves all cell types but cell death is mainly detected in the hepatocytes. Stellate cells are responsible for the induction of liver fibrosis following damage. Kupffer cells are considered to be protected from apoptosis but participate in the inflammatory reactions associated with the damage. Whereas the liver can recover from hepatectomy, some acute or chronic damages destroy up to 80–90 % of hepatocytes leading to hepatic failure and by consequence hepatic encephalopathy (mental status changes) and impaired protein synthesis (determined by serum albumin and prothrombin in the blood). Triggers for hepatic failure are alcoholic and non-alcoholic steatosis, overdose of acetaminophen or other toxic products, idiosyncratic reactions to medication, ischemic injury, viral hepatitis (A and B, less so for C), acute fatty liver of pregnancy or Wilson’s disease (hereditary copper accumulation) (Yoon and Gores 2002; Martins et al. 2008; Sun and Karin 2008). In all these cases, hepatocytes do not only die by apoptosis but also by necrosis, a more pathological form of cell death leading to cell lysis (Natori et al. 2001; Feldstein et al. 2003; Ribeiro et al. 2004). Usually hepatocellular death begins in the centrizonal area and progresses toward portal tracts of the liver. It was previously generally accepted that apoptotic cells are removed by phagocytosis without stimulating inflammatory reactions, whereas necrosis is often associated with a variable degree of parenchymal inflammation that is often proportional to the duration of the disease. However, it was recently reported that also apoptosis promotes inflammation in the liver (Malhi et al. 2006, 2010; Ogasawara et al. 1993; Matsumura et al. 2000). Engulfment of apoptotic bodies by Kupffer cells resulted in the expression of the death ligands TNFα, TNFα-related apoptosis-inducing ligand (TRAIL) and FasL leading to a continuation and enhancement of apoptosis in hepatocytes, but also the activation of hepatic stellate cells. Once activated, the latter cells aid in the removal of apoptotic bodies and provoke hepatic fibrosis. Hence, excessive apoptosis now plays a key role in hepatic inflammation and fibrogenesis. Necrosis is especially significant in ischemia/reperfusion injury and acute drug-induced hepatotoxicity. Moreover, the same death-initiating stimulus (e.g. FasL/CD95L) can lead to apoptosis and necrosis (Ogasawara et al. 1993; Matsumura et al. 2000). For these reasons, an understanding of how liver cells die and how such cell death can be modulated is of immense clinical relevance (Malhi et al. 2006).
Damaged hepatocytes can undergo apoptosis by the extrinsic or intrinsic signaling pathways. The extrinsic pathway involves so-called death receptors, which are stimulated by members of the TNFα super family. The major trigger in the liver is FasL (or CD95L). Injection of agonistic anti-Fas antibodies (Jo2) into mice provoke massive hepatocellular cell death, hepatic failure and consequent death of the animals (Ogasawara et al. 1993) due to stimulating its receptor Fas (CD95 or Apo-1) highly expressed on hepatocytes (Ni et al. 1994; Saile et al. 1997; Muschen et al. 1998; Cardier et al. 1999; Ueno et al. 2000). Physiologically, FasL is expressed on the surface of cytotoxic T cells or NK cells (Kagi et al. 1994; Berke 1995; Tacke et al. 2009), which are especially activated by the infection with viruses (hepatitis A, B and C viruses). The infected hepatocytes are then killed by the stimulation of a caspase cascade after FasL/Fas binding (details see below). By contrast, TNFα and TRAIL do not primarily induce apoptosis neither in vivo nor in isolated primary hepatocytes (Malhi and Gores 2008). In the liver, TNFα is mainly produced by Kupffer cells, but also monocytes and T cells, and occasionally by hepatocytes (Malhi et al. 2010; Akazawa and Gores 2007). TNFα participates in inflammatory reactions, with the main purpose of rapidly fighting off bacterial infections. Therefore, TNFα primarily keeps cells alive via activating the NFkappaB signaling pathway and producing survival factors, such as Bcl-2, Bcl-xL, c-FLIP and others (Wullaert et al. 2007; Liedtke and Trautwein 2011; Schattenberg et al. 2011b). Consequently, TNFα becomes pro-apoptotic for hepatocytes when NFkappaB is inhibited. Thus, combined treatment of mice with lipopolysaccharide, which increases TNFα production by macrophages and Kupffer cells, and the hepatocyte-specific transcription inhibitor D-galactosamine (GalN) lead to apoptosis of hepatocytes (Nowak et al. 2000; Koide et al. 2009a). In vitro, the same effect can be obtained by combining TNFα and the transcription inhibitor actinomycin D (ActD) or the translation inhibitor cycloheximide (CHX). Recently, it was demonstrated that chronic HCV infection also suppresses NFkappaB activation and therefore enhances TNFα-induced cell death (Park et al. 2012). Under chronic inflammatory conditions, TNFα may, however, sensitize cells to FasL-induced apoptosis in an NF-kappaB-independent manner, as it has recently been suggested by Schmich et al. (2011) (see below).
TRAIL, which is also not cytotoxic to hepatocytes per se, can also sensitize the cells to FasL-induced apoptosis. Furthermore, it was reported to be induced and facilitate hepatocellular apoptosis by acetaminophen as TRAIL −/− mice were protected against the hepatotoxic action of this drug (Badmann et al. 2011). Finally, the group of Gregory Gores published that bile acids improperly manufactured or secreted during cholestasis become cytotoxic by increasing the surface expression of death receptors, thereby sensitizing hepatocytes for death receptor-induced apoptosis (Higuchi et al. 2001). A similar sensitization was reported by his group for high levels of circulating fatty acids during the metabolic syndrome (obesity, diabetes), leading to a non-alcoholic fatty liver injury and hepatocyte cell death (Malhi et al. 2007).
The cytokines, FasL, TNF or TRAIL, specifically bind to their related receptors present on the hepatocyte surface, namely Fas, TNF receptor type 1 (TNF-R1, p55/65, CD120a) or TRAIL receptor type 1 (TRAIL-R1, DR4) and type 2 (TRAIL-R2, DR5), respectively (Yoon and Gores 2002; Schattenberg et al. 2006). To induce cell death, the bound receptor tri- or multimerizes and recruits from the cytoplasm the adaptor molecule FADD and monomeric pro-caspases-8 (and pro-caspase-10 in humans) forming the death-inducing signaling complex (DISC) (Kischkel et al. 1995; Peter and Krammer 2003; Chang et al. 2003; Strasser et al. 2009). By their close proximity on the DISC, the pro-caspase-8 monomers dimerize, are activated by autoproteolysis and either directly cleave and activate the effector, caspase-3, or the BH3-only protein Bid (Scaffidi et al. 1998). For unknown reasons, the direct caspase-3 activation, the so-called type I pathway, is insufficient to induce death ligand-induced apoptosis in hepatocytes, although it effectively kills infected target cells by CTLs and lymphocytes by activation-induced cell death (Strasser et al. 1995, 2009). This might be due to the fact that hepatocytes express high levels of the caspase-3 inhibitor XIAP, which binds to the caspase-8 processed p19 form of caspase-3 preventing its autoprocessing to the highly active p17 form. Indeed hepatocytes from XIAP −/− mice show accelerated FasL-induced apoptosis through the direct type I pathway (Jost et al. 2009). Therefore, hepatocytes link the extrinsic to the intrinsic, mitochondrial pathway (the so-called type II pathway) for signal amplification and the neutralization of XIAP. After cleaving Bid into tBid by caspase-8, the latter protein migrates to mitochondria where it either interacts with Bcl-2-like survival factors (Bcl-2, Bcl-xL, Mcl-1) to release Bax and Bak or directly binds to Bax/Bak to activate them (Li et al. 1998b; Desagher et al. 1999; Wei et al. 2000; Gavathiotis et al. 2008; Gallenne et al. 2009; Llambi et al. 2011). Activation of Bax and Bak involves a conformational change at their N-termini that allows their oligomerization and pore formation on the mitochondrial outer membrane (MOM) (Desagher et al. 1999; Nechushtan et al. 1999; Griffiths et al. 1999; Borner 2003). This membrane permeabilization, called MOMP, leads to the release of cytochrome c and other apoptogenic factors into the cytoplasm (Youle and Strasser 2008). Cytochrome c binds to the adaptor APAF-1 which then recruits monomeric pro-caspase-9 into a heptameric wheel structure called the apoptosome. By autoprocessing, pro-caspase-9 is activated and cleaves and activates caspase-3 (Green and Kroemer 2004). In addition, XIAP is neutralized by its binding to Smac/DIABLO which is co-released with cytochrome c from mitochondria, and thereby caspase-3 can be fully activated and the apoptotic signal is amplified (Kaufmann et al. 2012; Huang et al. 2004; Vaux and Silke 2003). Active caspase-3 cleaves hundreds of cellular substrates involved in metabolism, DNA repair, DNA fragmentation and cytoskeletal rearrangements to dismantle the cell by a regulated process (Luthi and Martin 2007). The crucial involvement of the mitochondrial, type II pathway in FasL-induced hepatic apoptosis was demonstrated by the finding that Bcl-2 transgenic and Bid-/- mice were completely protected against fulminant hepatitis and death due to anti-Fas antibody injection (Jo 2) (see above) (Lacronique et al. 1996; Yin et al. 1999).
Interestingly, FasL does not only cause liver damage during infections and excessive drug exposure but also participates in the opposite response, namely liver regeneration. Mice harboring an inactive Fas mutation (lpr) exhibit reduced liver regeneration after hepatectomy or damage with CCl4 (Desbarats and Newell 2000). Surprisingly, the same effect was observed in animals in which caspase-8 had been conditionally knocked out in hepatocytes (Kang et al. 2004, 2008). These findings indicate that the same Fas/caspase-8 signaling pathway can be used for hepatocyte apoptosis and proliferation. However, the caspase-8 substrates are likely to be different. The reason for the opposing activities of the Fas/caspase-8 system is unknown. Either the dose of FasL, its route of delivery (membrane bound or soluble), its cellular source or the co-stimulation with other mitogenic factors such as HGF, EGF or TGF-β play a role in the switch from apoptosis to mitogenesis.
As mentioned above, TNFαα has been assigned a dual role, being involved not only in apoptosis but also in survival pathways resulting in hepatocyte protection and proliferation (Schattenberg et al. 2011a; Guicciardi and Gores 2009; Wullaert et al. 2007). TNFα mediates its effects through two different receptors, TNFR1 and TNFR2. Since TNFR2 lacks a functional death domain, only TNFR1 can initiate apoptosis. TNFα signaling starts by binding to TNFR1, a membrane-bound complex I consisting of TNFR1, receptor-interacting protein 1 (RIP1), TNF-receptor-associated factor 2 (TRAF2) and TNFR1-associated death domain protein (TRADD). Complex I rapidly signals to the activation of the survival transcription factor NF-kappaB and the c-Jun N-terminal kinase (JNK) (Micheau and Tschopp 2003; Papa et al. 2006). However, triggering TNFR1 can also lead to apoptosis when FADD and procaspase-8 bind to complex I forming the cytosolic complex II (DISC) whose assembly is critically dependent on receptor endocytosis (Wullaert et al. 2007; Micheau and Tschopp 2003; Guicciardi and Gores 2009). Under normal conditions, complex II formation is blocked by c-FLIP and NF-kappaB survival signaling (Karin and Lin 2002). Hence, activation of NF-kappaB, which regulates various antiapoptotic genes besides c-FLIP, such as Bcl-xL, XIAP, and cIAP1 and 2, is probably the main reason why TNFα alone does not induce cell death in most cells. Recently, it was shown that when caspase-8 is inhibited or deleted, TNFα induces necroptosis, a programmed form of necrotic cell death, which may be crucial for non-apoptotic liver injury (Liedtke and Trautwein 2011; Feoktistova et al. 2011; Gunther et al. 2011; O’Donnell et al. 2011; Duprez et al. 2012). This cell death is mediated by RIP1 and RIP3 protein kinases associated with the TNFR1 (Vandenabeele et al. 2010). Hence, caspase-8 is not only a mediator of FasL- and TNFα-induced apoptosis, but also protects the liver from TNFα-induced necroptosis.
While activation of NF-kappaB by TNFα promotes survival, JNK signaling has different impacts on the fate of hepatocytes (Papa et al. 2009; Malhi et al. 2010). Transient activation of JNK by the TNFR1 complex I is rapidly terminated by MAPK phosphatases (MKPs), whose genes are regulated by NF-kappaB promoting proliferation. However, inhibition of the activity of MKPs by ROS leads to sustained activation of JNK and to cell death (Papa et al. 2006; Kamata et al. 2005; Nakano et al. 2006). ROS are assumed to originate from mitochondria, but recent reports also suggest a possible involvement of the plasma membrane–associated NADPH oxidase as an ROS producer after TNFα treatment (Yazdanpanah et al. 2009). Moreover, JNK can also directly activate the E3 ubiquitin ligase Itch, which is involved in c-FLIP degradation (Chang et al. 2006b). Activated JNK has been shown to mediate TNFα-induced apoptosis either through a caspase-8-independent cleavage of Bid at a distinct site (jBid) (Deng et al. 2003) or through phosphorylation and/or transcriptional induction of Bim (Papa et al. 2009; Schmich et al. 2011). The latter mechanism also appears to be exploited by TRAIL for its sensitizing effect on FasL-induced liver damage and lethality (Corazza et al. 2006). In summary, TNFα-mediated induction of apoptosis is tightly regulated by a complex signaling network.
10.3.1 FasL-induced apoptosis signaling differs between isolated, collagen-plated and in vivo liver residing hepatocytes
Freshly isolated mouse hepatocytes all died within 4–8 h when treated with low dose of FasL (50–100 ng/ml) in suspension (Walter et al. 2008). The cells displayed the typical hallmarks of apoptosis (Kerr et al. 1972; Leverrier and Ridley 2001), such as membrane blebbing, phosphatidylserine exposure, caspase-3 processing to the active p17 form and increased caspase-3/-7 (DEVDase) activity, as well as cleavage of caspase-3 substrates such as PARP. All these features were entirely blocked in primary hepatocytes from Bid-/- mice. In addition, while wt hepatocytes showed release of cytochrome c and Smac/DIABLO, both processes were blocked in Bid-/- cells. These data indicated that directly after isolation, hepatocytes behaved as in vivo, i.e. they underwent apoptosis in response to FasL in a type II, Bid- and mitochondria-dependent, manner (Fig. 39). By contrast, when the isolated murine hepatocytes were plated on a collagen I monolayer, the time kinetic of FasL-induced apoptosis was slower and the apoptotic signaling changed from Bid- and mitochondria-dependent type II to the direct, Bid- and mitochondria-independent type I pathway (Fig. 39). In addition to the apoptosis features seen in suspension cells, the polyhedral shape of healthy plated hepatocytes changed after 4 h of FasL treatment, the cells got smaller, showed the typical membrane blebbing and detached from the plate (Walter et al. 2008; Ferreira et al. 2012). Due to the larger cytoplasmic area of plated hepatocytes, it was also possible to perform immunofluorescence analysis using antibodies against the active form of caspase-3 (Jones et al. 1998; Walter et al. 2008) or mouse cytochrome c (Jemmerson et al. 1999), and GFP-annexin-V as a measure of PS exposure. Moreover, nuclear/DNA fragmentation could be monitored by DAPI or Hoechst 33342 staining. These analyses clearly showed that both wt and Bid-/- exhibited GFP-annexin-V staining and caspase-3 activation followed by nuclear fragmentation and detachment from the plate, but no cytochrome c release. Thus, all features of apoptosis could be faithfully measured in primary mouse hepatocytes cultured on a collagen I monolayer but the FasL-induced signaling switched from the type II to the type I manner.

Induction of lipid accumulation in hepatocytes in vitro. Oil red O staining of primary human hepatocytes (PHHs) incubated with b: palmitate (0.2 mM) or (a) FFA-free BSA, which served as a control
A variety of technical problems were encountered, which were specific for the collagen-plated hepatocytes. Firstly, it was impossible to quantify apoptosis by GFP-annexin-V/PI FACS analysis because the cells rapidly lysed upon detachment with either scraping or the treatment with trypsin or collagenase. Therefore, general cell death assays were used, such as MTT or CellTiterGlo™ (chemoluminescence), which determine the extent of cell survival based on mitochondrial activity, as well as an ELISA assay which quantifies DNA fragmentation (Walter et al. 2008; Schmich et al. 2011). Secondly, hepatocytes contain a high amount of proteases. Therefore, cell lysates (especially subcellular fractions) were prepared in the presence of lots of protease inhibitors and either immediately processed for further experiments or snap-frozen in liquid nitrogen. Thirdly, due to the marked autofluorescence of hepatocytes, the antibodies for immunofluorescence had to be highly specific with minor cross-reactivities (for example cytochrome c) (Jemmerson et al. 1999; Walter et al. 2008).
Interestingly, as observed for FasL, Godoy et al. (2009) showed that the signaling pathway in response to TGF-β was disturbed when primary mouse hepatocytes were plated on a stiff collagen monolayer. This culturing provoked a typical epithelial-mesenchymal transition (EMT) and this was associated with a complete resistance to TGF-β-induced apoptosis. However, when the primary hepatocytes were cultured in a soft collagen sandwich where polarity and the epithelial phenotype were maintained, they showed the typical feature of apoptosis in response to TGF-β (Godoy et al. 2009). It therefore seems that the microenvironment, in particular the kind of ECM and eventually also the lack of other cell types, influences the differentiation state and apoptosis sensitivity of primary hepatocytes. Unfortunately, the collagen sandwich culturing did not reverse the type II to type I switch of FasL-induced apoptosis signaling observed on stiff collagen monolayers (unpublished data). This was also true when the primary mouse hepatocytes were plated on Matrigel™, a combination of collagen I, collagen IV and other basal lamina components such as laminin and heparan sulfate proteoglycans (LeCluyse et al. 1996; Semler et al. 2000; Walter et al. 2008). Results described here therefore indicate that the FasL signaling switch did not depend on the differentiation or polarity state of primary hepatocytes but most likely on collagen itself or the lack of other cell types in the neighborhood. One idea is the development of spheroid cultures whose survival would be independent of collagen, but dependent on cell–cell interactions in a 3D manner. This culturing technique has been successfully used to grow and analyze the signaling pathways of primary mammary cancer cells by biochemical and immunohistochemical methods (Schurigt et al. 2008; Sevenich et al. 2010).
10.3.2 Apoptosis in hepatocytes by a systems biology approach
In order to properly investigate the molecular mechanisms involved during apoptosis and/or regeneration in the liver, studies must be performed under conditions as close to the in vivo situation as possible. It is difficult to obtain healthy liver cells from humans, as they usually come from biopsies of normal tissue surrounding tumors or fatty liver from patients. Studies to optimize the isolation of human liver cells (see section “Isolated human hepatocytes”) and to establish an in vitro steatosis model (see section “Hepatocellular lipid accumulation and non-alcoholic fatty liver disease”) are showing some progress; nevertheless, to date, apoptosis studies have not yet been consistently reported in human primary hepatocytes. Since the apoptotic machinery is highly conserved among species, a valuable model system is mouse or rat-derived hepatocytes. Rodents are easily accessible for studies involving hepatectomy or drug-induced liver damage. They can be genetically modified and hepatocytes as well as other liver cells can be easily isolated in appreciable numbers under standardized, reproducible conditions. These primary cell cultures are expected to simulate, at least in part, the signaling mechanisms occurring in vivo because the cells are isolated from the living organism and kept in culture for a limited amount of time.
Freshly isolated hepatocytes can be kept in suspension for up to 4 h and still preserve their metabolic function. This system is technically low demanding and is suitable for screening of metabolites, analysis of interspecies differences and rapid signaling pathways (Gebhardt et al. 2003). However, to study biological responses such as cell proliferation, differentiation or apoptosis, which take longer to implement, suspension hepatocytes cultures are not suitable as the cells start to spontaneously die by apoptosis after 4–6 h post-isolation. Therefore, culture conditions and standardized procedures were established to plate freshly isolated mouse and rat hepatocytes and other liver cells immediately on a stiff collagen I or Matrigel layer, on which they adhere and can be cultured and experimentally assessed for a few days (Ni et al. 1994; Klingmuller et al. 2006; Walter et al. 2008; Gebhardt et al. 2003). Under these conditions, the primary hepatocytes can be distinguished from established hepatocyte cell lines in many features (Clayton and Darnell 1983; Hengstler et al. 2000a; Ruhnke et al. 2005). Nevertheless, they do not exactly behave as in vivo because their microenvironment is absent. Sandwich cultures exhibit biological responses and signaling pathways similar to those seen in the liver in vivo (Hengstler et al. 2000a; Godoy et al. 2009; di Mambro et al. 2011). Although optimal in vitro culturing system that reproduces type II FasL signaling in vivo has not yet been established, the collagen monolayer hepatocyte culture system has been used to better understand the regulation of the type I pathway that is present in most of the Fas-sensitive cells such as lymphocytes (Strasser et al. 1995, 2009). One major question has been how type I signaling is amplified when mitochondria do not participate and therefore the caspase-3 inhibitor XIAP is not neutralized. Eissing et al. (2004) proposed a mathematical model in both type I and type II FasL signaling pathways that caspase-3 feeds back on caspase-8 to cleave the partially processed and active p43 form at the DISC into a fully processed, highly active p18 form in the cytoplasm, thereby further processing and activating caspase-3. By using two selective caspase-3 inhibitors (AB06 and AB13), the caspase-3 to caspase-8 feedback loop was shown to exist (Ferreira et al. 2012). However, this loop did not seem to activate caspase-8 further but rather diverted the protease to other substrates or inactivated it by complete degradation. This is consistent with two recent reports showing that caspase-8 variants mutated in the autocleavage site converting p43 to p18 exert a more sustained rather than a lower caspase-8 activity (Hughes et al. 2009; Oberst et al. 2010). Because caspase-8 also participates in mitogenic signaling in response to FasL (refer to liver regeneration), it is well possible that this activity has to be eliminated by degrading caspase-8 in a caspase-3-dependent manner in order to fully commit a cell to apoptosis. In addition, by using AB06 and AB13, previous reports that active caspase-3 cleaves Bid into tBid and effectively degrades its own inhibitor XIAP were confirmed (Tang et al. 2000; Lee et al. 2000). These are clearly positive feedback loops, which amplify type I signaling without the participation of XIAP neutralizing proteins such as Smac/DIABLO.
10.3.3 Modeling the TNFα-induced apoptosis pathway in hepatocytes combining FasL/TNFα and TNFα/ActD
As mentioned above, FasL is a critical mediator of cell death in chronic and acute liver diseases and induces apoptosis in primary hepatocytes in vitro. By contrast, the pro-inflammatory cytokine, TNFα, alone fails to provoke cell death in isolated hepatocytes but contributes to hepatocyte apoptosis during liver diseases associated with chronic inflammation, such as steatohepatitis (Malhi and Gores 2008). In accordance with these in vivo results, it was recently demonstrated that TNFα sensitizes primary murine hepatocytes cultured on collagen to FasL-induced apoptosis (Schmich et al. 2011). Using hepatocytes from various knockout mice, the TNFα/FasL sensitizing effect was shown to be Bid-dependent but XIAP-independent. Moreover, JNK activation and Bim played a crucial role. The mitochondrial amplification loop was activated by the interplay of Bim and Bid resulting in the induction of cytochrome c release, a hallmark of type II apoptosis. Thus, TNFα was confirmed to be capable of restoring type II signaling in primary hepatocytes cultured on collagen by engaging the JNK/Bim apoptotic pathway (Fig. 39). The mechanism of TNFα-induced sensitization was supported by a mathematical model that correctly reproduced the most critical interactions associated with Bid and Bim, the prominent role of XIAP as a caspase-3 buffer, as well as the neutralization function of the Bcl-2-like survival factors.
A second mathematical model describing the cross talk of TNFα with the transcriptional inhibitor actinomycin D was developed, and both models were combined with an existing NF-kappaB model from Lipniacki et al. (2004). Whereas it has already been known that only the combination of TNFα and actinomycin D, but not TNFα alone can induce apoptosis in primary hepatocytes (as mentioned above), this mathematical model gives insights into the dynamical interplay between TNFα and FasL pathways, NF-kappaB and ROS. The model confirms the crucial role of ROS for the sustained activation of JNK during death-receptor-induced apoptosis (Schlatter et al. 2011).
10.3.4 Conclusions and future challenges in apoptosis research
Although a great deal about the causative agents and the resulting liver pathologies are elucidated, the entire surge of death triggers are still unknown, their cellular source and their MOA, especially in combination with the various co-stimuli present in such a complex liver organ. For example, we need to know more about when and where FasL is produced within the liver in response to inflammatory stimuli, drugs, toxins or various pathogens. In addition, how exactly does FasL cooperate with TNFα and/or TRAIL and under which conditions can TNFα be a crucial pro-apoptotic molecule, which aggravates liver failure? Due to the stimulation of multiple signaling pathways for apoptosis, necrosis or survival, TNFα has pleiotropic actions on the liver, depending on where it is produced, on which cells it acts and with which other signaling pathways it cooperates, the principle of which was revealed using in vitro models (Walter et al. 2008; Schmich et al. 2011). Another interesting future study field will be why FasL can also trigger hepatocyte proliferation during liver regeneration. What distinguishes it from its apoptotic mechanism and how can this knowledge be exploited to improve liver regeneration after excessive damage? For all these aspects, it would be ideal to have reproducible in vitro systems for easy handling. However, as mentioned above, this is not an easy task since hepatocytes, and most likely also their non-parenchymal counterparts, can change signaling properties when cultured on collagen or other ECM components. Would it be better to improve the survival of suspension cells after their isolation from the liver tissue, keeping them alive for longer than 8–12 h? Or is the solution to co-culture hepatocytes with combinations of all the other, NPCs in vitro, thereby reconstructing a whole liver organ from scratch? The latter approach is the big challenge of the Virtual Liver Network, which combines mathematical modeling with data mining (Systems Biology) to better understand the complex biology of the liver.
10.4 Hepatocellular lipid accumulation and non-alcoholic fatty liver disease


Non-alcoholic fatty liver disease (NAFLD) has emerged as a considerable public health concern as its major risk factors, obesity and insulin resistance, reach epidemic proportions worldwide. Thus, NAFLD is a clinicopathological condition of emerging importance, and it is now recognized as the most common cause of abnormal liver tests. NAFLD starts with hepatic steatosis, which until recently was regarded as a benign condition. However, histological studies of biopsies taken from patients with NAFLD indicate that a significant number of patients progress to non-alcoholic steatohepatitis (NASH) that leads to liver fibrosis and finally cirrhosis (Powell et al. 1990). The “two-hit model” has been suggested to describe the development and progression of “simple” fatty liver and NASH, respectively (Day and James 1998). The first hit causes hepatic steatosis, i.e. an imbalance between hepatocellular lipid uptake on the one side and combustion and secretion on the other side. According to the two-hit-hypothesis of NASH, hepatic steatosis is a prerequisite for subsequent events (“second hits”), involving environmental and genetic factors that lead to progressive hepatic inflammation and fibrosis.
In an in vitro model, cellular lipid accumulation was induced in primary human hepatocytes by adding free fatty acids (FFAs) to the culture medium (Wobser et al. 2009). FFAs appear to be the major mediators of excessive hepatic lipid accumulation. The rate of hepatic FFA uptake is not regulated, and therefore, is proportional to plasma FFA concentrations (Teli et al. 1995). In humans with NAFLD, circulating FFAs are commonly elevated, and their plasma levels correlate with disease severity (Nehra et al. 2001). In their model, Wobser et al. (2009) used palmitate (C16:0), the most prevalent long-chain saturated fatty acid found in the circulation where it is bound to albumin in physiological ratio of 2:1. In states of insulin resistance and obesity, serum fatty acid levels are commonly elevated, yielding ratios as high as 7.5:1 (Kleinfeld et al. 1996). Thus, human hepatocytes were incubated with palmitate complexed to bovine serum albumin in a molar ratio of 6.7:1, thereby mimicking hyperlipidemic conditions. Exposure to palmitate induced an accumulation of cytosolic lipid droplets in human hepatocytes, as detected by confocal microscopy after staining with Oil Red O (Fig. 40). Colorimetric analysis revealed a dose-dependent increase in intracellular triglyceride concentration in hepatocytes exposed to 0.1–0.4 mM palmitate (Fig. 41). Measurement of the (residual) palmitate concentration in the supernatant revealed a complete uptake of palmitate by hepatocytes incubated for 24 h with palmitate at a concentration of 0.1 or 0.2 mM, and after 24-h incubation with 0.4 mM palmitate, approximately 85 % of the palmitate was taken up by the hepatocytes. Importantly, the viability of human hepatocytes was not affected by the stimulation with palmitate in a concentration of up to 0.4 mM. This in vitro model of hepatocellular lipid accumulation has been applied already in several subsequent studies to assess the effect of hepatic steatosis on the expression of defined genes and signal transduction pathways (Wanninger et al. 2011; Schnabl et al. 2011; Kirovski et al. 2010). Notably, changes observed in human hepatocytes in response to in vitro-induced steatosis were in line with elevated expression levels in human NAFLD tissue compared to normal hepatic tissue (Wanninger et al. 2011; Schnabl et al. 2011; Kirovski et al. 2010). Furthermore, palmitate dose dependently induced ROS formation in human hepatocytes in this model (Schnabl et al. 2011). Oxidative stress has been suggested to be major consequence of cellular lipid overload, and to contribute significantly to inflammatory liver damage and fibrogenesis in NASH, when the capacity of hepatocytes to safely store excess FFAs in form of triglyceride in lipid droplets is depleted (Rombouts and Marra 2010). Together, these findings indicate that palmitate-induced lipid accumulation in human hepatocytes in vitro is a suitable model to resemble the in vivo situation in human NAFLD.

Dose-dependent induction of cellular triglyceride accumulation in hepatocytes in vitro. Colorimetric quantification of the intracellular triglyceride concentration in primary human hepatocytes exposed to 0.1–0.4 mM palmitate (*P < 0.05 compared to control)

Mechanisms of drug-induced liver injury (DILI). 1 Detoxification of chemically reactive metabolites (CRM) by conjugation with glutathione. However, high demand or reduced replenishment of glutathione can prevent such detoxification, leaving the liver at increased risk of injury. 2 Altered calcium homeostasis due to chemically reactive metabolite (CRM) presence can cause actin disassembly, cell membrane blebbing and lysis. 3 CRM may bind to transport pumps or actin around the bile canaliculi preventing bile export. 4 CRM binding to mitochondrial proteins may reduce ATP formation, produce ROS, and open the MPTP causing apoptosis. Apoptosis is ATP dependent. Due to the lack of ATP formation necrosis occurs. 5 Immune stimulation via the hapten or prohapten mechanisms leading to either humoral (B cell) or cell-mediated (T-cell) reactions. B cells produce antibodies that cause inflammation and cell damage; T-cell release cytotoxic cytokines causing apoptosis. 6 The same as the aforementioned immune activation, however, this occurs by the PI mechanism using the parent drug. 7 TNF receptor sensitivity may be heightened increasing responsiveness to TNF, leading to reduced NF-kappaβ, and apoptotic caspase activation. DME drug-metabolizing enzyme, CRM chemically reactive metabolite, ROS reactive oxygen species, MPTP mitochondrial permeability transition pore, APC antigen-presenting cell, MRP2 multidrug resistance protein 2, NF-kappaβ nuclear factor kappa beta (from Lee 2003; Kaplowitz 2004; Bleibel et al. 2007)
In humans, the severity of hepatic steatosis correlates with the stage of liver fibrosis in a wide range of liver diseases (Bosserhoff and Hellerbrand 2011). However, it remains unclear whether hepatocellular lipid accumulation per se can initiate hepatic inflammation and fibrogenesis. To address this question, the in vitro model of hepatic steatosis was extended to hepatic stellate cells (HSCs). Activated HSCs are the effector cells of hepatic fibrosis in response to chronic liver injury, and also in NAFLD, HSC activation is the central pathophysiological mechanism underlying hepatic fibrosis (Rombouts and Marra 2010). During hepatic injury, HSCs undergo a phenotypic transformation from a quiescent retinoid-storing cell to a highly proliferative myofibroblast-like cell type, a process termed activation. Activated HSCs express large amounts of ECM, including collagen type I, fibronectins and proteoglycans. Deposition of ECM is further enhanced by the production of tissue inhibitors of metalloproteinases (TIMPs), which prevent the degradation of ECM, leading to a net accumulation of ECM with a gradual disruption of normal liver architecture. The activation process of HSCs is characterized further by the release a large number of cytokines among which TGF-β is considered as the main fibrogenic cytokine. De novo expression of pro-inflammatory cytokines and chemokines enhances hepatic fibrogenesis further by recruiting leukocytes and perpetuating the inflammatory response (Bataller and Brenner 2005; Friedman 2004). The activation process of HSCs can be simulated by culturing freshly isolated (quiescent) HSC on plastic. Under these culture conditions, HSCs start to be activated within 2–3 days and undergo the activation process to fully activated myofibroblast like activated HSCs within 7–10 days in vitro (Bataller and Brenner 2005). This in vitro model of HSC activation and the in vitro model of hepatic steatosis were combined to assess the effect of steatotic hepatocytes on the in vitro activation process of HSC (Wobser et al. 2009). First, conditioned medium (CM) was generated from human hepatocytes from the same donor stimulated with either 0.2 mM palmitate or BSA as control. Subsequently, human HSCs were isolated and cultured in vitro. Two days after isolation, HSCs were exposed to CM from lipid-loaded or control human hepatocytes. The experimental setting assessing the effects of CM from control and steatotic human hepatocytes on HSCs is depicted schematically in Fig. 42. HSCs exposed to CM from steatotic hepatocytes for 3 days revealed significantly higher expression of collagen type I and alpha smooth muscle actin (α-sma), an established marker of HSC activation (Bataller and Brenner 2005). These findings clearly indicate that exposure to CM from lipid-loaded human hepatocytes accelerated the activation of HSCs in vitro.

Mechanisms of immune stimulation by drugs. a Hapten theory—a drug binds to self-proteins causing the immune system to recognize the protein–hapten complex as foreign. This may be followed by antigen uptake and processing by APCs creating peptides which are then covalently bound on MHC molecules on the APC surface for presentation to T cells. b Prohapten theory—the same process as for the hapten mechanism but the drug is first metabolized to a CRM which then acts as the hapten. c The parent drug is directly expressed in a MHC-dependent, non-covalent fashion to T cells (from Pichler et al. 2006)
In a second approach, the in vitro model of hepatic steatosis was used to assess the effect of hepatic steatosis on fully activated HSCs (Wobser et al. 2009). Here, activated human HSCs were exposed to CM from steatotic or control hepatocytes, as illustrated in Fig. 42. Compared to CM from control hepatocytes, stimulation with CM from steatotic hepatocytes induced a significantly higher expression of TIMPs and TGF-β. Moreover, CM of steatotic hepatocytes enhanced proliferation and resistance to apoptosis of activated HSC. Furthermore, CM from lipid-loaded hepatocytes induced NF-kappaB-dependent pro-inflammatory gene expression in activated hepatic stellate cells (Wobser et al. 2009).
Noteworthy, removal of proteins with a molecular weight above 5 kDa from the CM with cut-off spin column before stimulating HSCs abolished the stimulatory effect of CM from steatotic hepatocytes on profibrogenic and pro-inflammatory gene expression (Wobser et al. 2009). Together, these findings showed that lipid accumulation in human hepatocytes leads to the secretion of soluble factors, which enhance pro-fibrogenic and pro-inflammatory phenotype of HSCs. Further analysis applying this model may lead to the identification of this or these soluble factor(s), which may lead to the identification of new therapeutic targets or novel markers for the progression of NAFLD. Furthermore, the combined in vitro model of (conditioned medium from) steatotic hepatocytes and HSCs can be used to study the interaction of these two critical cell types in NAFLD progression and for screening of pharmaceuticals.
10.5 Idiosyncratic DILI


A range of drugs, from antibiotics to NSAIDs, have been shown to cause DILI, an issue that in severe instances can cause acute liver disease and death (Hussaini and Farrington 2007). DILI has been reported to not only be the leading cause of drug withdrawal from the market, but also in early cessation of clinical trials (Holt and Ju 2006). In the USA, DILI is responsible for over half of all acute liver failures, with idiosyncratic DILI (iDILI) accounting for approximately 12 % of these (Amacher 2012). iDILI is a particularly worrying form as these reactions are unpredictable based upon drug dosing or known pharmacology (Holt and Ju 2006). iDILI represents a substantial clinical problem as it can arise from drugs that are very commonly prescribed and thus represents a widespread issue. Some of the associated drugs are listed in Table 8. In a study of patients with DILI listed in a Spanish registry over the course of a decade, the greatest links to DILI were with the commonly prescribed drugs atorvastatin and amoxicillin–clavulanate (Andrade et al. 2004). Approximately 500 deaths occur in France per year out of 8,000 total DILI cases (Chalasani and Bjornsson 2010), which when extrapolated to a worldwide level represents a significant number of deaths. An average of 15 % of acute liver failure, in combination with studies between Sweden and the USA, was categorized as iDILI. Most patients will undergo liver transplant, as without this, mortality averages 70 % (Björnsson and Olsson 2005). An overall frequency of between 1 in 10,000 and 100,000 patients (Stirnimann et al. 2010) makes iDILI very hard to identify before a drug enters the market. It has been estimated that a trial would require a minimum of 30,000 patients, much larger than any clinical trial, to detect an association with iDILI based on a frequency of 1/10,000 (Holt and Ju 2006).
In this section, the possible mechanisms of DILI and in particular iDILI are described, as well as developments in the understanding the risk factors that make some patients susceptible to iDILI rather than others. The in vitro models available and those of the future, as well as possible biomarkers to indicate injury will also be reported.
10.5.1 Mechanisms of DILI
There are two forms of liver injury which may occur; the more severe form being hepatocellular and associated with elevated ALT and 10 % mortality, and the lesser cholestatic injury where elevated alkaline phosphatase (ALP) is seen (Hussaini and Farrington 2007). Cholestatic injury is defined as when serum ALP levels are >2 ULN, or the ALT serum activity: ALP serum activity ratio (R) is ≤2. Hepatocellular damage is when ALT is >2 ULN or R ≥ 5. Mixed injury is a combination of the two such that the ALT >2 ULN and 2 < R <5 (Amacher 2012). The pathomechanism of DILI relies on toxic drugs or metabolites that are electrophilic or free radical in nature, which bind cellular proteins or induce oxidative stress (Kaplowitz 2004). A number of recognized methods of cell injury are possible which could cause the large-scale damage seen in DILI, as seen in Fig. 42. These include; FasL or TNFα, and their presence may promote caspase activation and apoptosis, reduced mitochondrial ATP production and thus reduced fatty acid oxidation. This leads to increased ROS formation, cell blebbing and lysis due to actin fibril breakdown as a result of altered calcium management. Further disruption of actin filaments may disrupt normal bile export pump function, causing cholestasis (Lee 2003). The proposed cause of cholestatic DILI is intracellular actin or transport pump dysfunction (Hussaini and Farrington 2007), leading to the buildup of bile acids, toxic drugs and toxic metabolites.
Metabolism and adduct formation are well defined for many drugs which cause iDILI, but for many the pathomechanism is still unknown. The two general mechanisms of iDILI, which show tremendous overlap, are immune- and metabolism-mediated forms, which will be discussed. However, when discussing the liver- and immune-mediated injury, it is necessary to state that tolerance to an antigen is the natural response of the liver rather than a damaging immune response. This could be due to a variety of mechanisms, including the fact that the liver is a site for activated T-cell apoptosis. Kupffer cells, the resident hepatic antigen-presenting cells, can produce prostaglandins and actually suppress the activation of T cells (You et al. 2008). This damage limitation concept is worth bearing in mind when considering an immune response which occurs within the liver and against the liver, as this has to be overcome for injury to occur.
10.5.2 Metabolism-mediated iDILI
There is a wide repertoire of enzymes and transporters in the human body whose role it is to metabolize or transport xenobiotics, respectively, and all have the potential to cause iDILI through the presence of polymorphic variants. The idea of metabolites playing a central role in the mechanism of iDILI is logical, considering that the liver is a major site of metabolism and so is highly exposed to drug metabolites (Ju and Reilly 2012). A recent study found that patients were much more likely to develop liver failure and fatal DILI where the medicated drug underwent hepatic metabolism (Lammert et al. 2010). It is also easy to comprehend how reduced efflux transporter efficiency within the liver could cause the buildup of bile and contribute to damage. It should be possible to design out such factors during drug development, but the link seen in clinics between chemically reactive metabolite (CRM) formation in vitro and adverse effects is weak, meaning that design alone cannot guarantee a safe drug (Park et al. 2011).
Strong evidence for products of metabolism being involved with idiosyncratic liver injury lies with a group of anesthetics. Desflurane, isoflurane and halothane are all structurally similar and are all linked to hepatotoxicity but to different extents. All three are metabolized, albeit to a different degree, to the same hepatotoxic metabolite. Desflurane fulminant hepatic necrosis occurs in less than 1 in 10,000,000 patients and 0.02–0.2 % of this drug is metabolized; isoflurane causes hepatic necrosis in less than 1 in 1,000,000 and 0.2–2.0 % of the drug is metabolized, and most injury is seen with halothane with 1 in 35,000 patients being affected and 25–50 % of this drug is metabolized. This illustrates how drug metabolites can be the cause of severe liver injury as metabolite formation is proportional to injury sustained (Ju and Reilly 2012).
Metabolism of drugs occurs by either phase I CYP enzyme reactions followed by phase II, phase I alone, or occasionally phase II alone. Phase I reactions are involved in the formation of CRMs and phase II are commonly detoxification reactions (Lammert et al. 2010). The majority of CRM are electrophiles, which will react with nucleophilic entities, including protein amino and sulfhydryl groups (Lee and Lewis 2011). CYP enzymes are abundant in the liver, and CYP3A4, 2C9, 2D6, 2C19, and 1A2 enzymes, which are major CYP isoforms, metabolize >90 % of currently marketed drugs that undergo metabolism (Amacher 2012). There are two proposed mechanisms of metabolism-mediated toxicity. Toxicity may arise when metabolism of a toxic drug occurs through an enzyme isoform with impaired function and so the drug builds up in the liver, or alternatively if this isoform causes the drug to be metabolized by another pathway that creates a toxic metabolite (Amacher 2012).
One indication that metabolism of drugs is a critical step in iDILI was provided in a 2005 study, in which >50 % of drugs in the study with hepatotoxicity black box warnings were known to form CRMs, as were >80 % of the drugs that had been withdrawn for liver injury (Walgren et al. 2005). Another indication is that the centrilobular zone, which contains a high concentration of CYP enzymes, is often the most severely affected in some drug-specific cases of DILI. Phase II reactions have also been implicated, for instance glucuronidation in a rodent model of diclofenac-induced injury (Lammert et al. 2010). The UGT2B7*2 isoform has been found with greater frequency in patients with diclofenac-induced liver injury than without (Amacher 2012). The fact that in drugs with greater hepatic metabolism, it was shown that there is a significantly increased risk of liver failure and death from DILI (p = 0.004, p = 0.001, respectively) (Lammert et al. 2010) and that a CRM has been detected for all known iDILI-causing drugs (Lee and Lewis 2011) further promotes the metabolic theory.
NSAIDs are just one of many drugs that undergo biotransformation due to the action of the polymorphic CYP2C19 and CYP2C9 enzymes. It was due to their polymorphic nature that it could easily be conceived that a specific polymorphic variant could alter drug metabolism and cause a rare form of DILI. These associations were proved invalid when no association was seen in a Spanish registry of DILI in cases with drugs metabolized by these enzymes (Pachkoria et al. 2007). In fact, a large number of studies looking at associations with CYP enzyme particular polymorphisms follow a similar route or only identify relatively weak associations. For instance, weak significance was found when comparing diclofenac DILI and CYP2C8 with specific interest in the CYP2C8*4 variant allele (Daly et al. 2007).
It is not only enzymes that have been examined, but also transport pumps found within the liver that aid the hepatic export of toxins, a mechanism which may be deregulated in iDILI. This includes pumps such as the BSEP, MRP2 and P-glycoprotein (Amacher 2012). Reduced efficiency or complete inhibition of these pumps can lead to the buildup of bile acids, metabolites and drugs, which concentrates any accompanying toxicities and may damage the liver (Amacher 2012). Mutations in the BSEP gene lead to severe progressive liver disease (Strautniecks et al. 2008). This highlights the fact that BSEP constitutes a bottle neck for export of bile salts into the canalicular space. The BSEP variant p.V444A seems to be a susceptibility factor for drug-induced cholestasis (Gradhand et al. 2008) In addition, p.G855 W and p.D676T were found individuals with drug-induced cholestasis. However, the only specific linkages are of Gly855Arg with ethinylestradiol, and Asp676Tyr with fluvastatin-induced liver injury (Russmann et al. 2010). MRP2 has also been associated with certain herbal medicine-induced DILI. It was also discovered that a mechanism to induce MRP2 activation, activated in cholestatic conditions, is removed by a specific mutation and as such could promote the onset of cholestasis (Russmann et al. 2010). Another transporter class, the OATPs, have also been indicated in DILI. They are involved in regulation of NR activation in the liver, such as PXR, which if induced will activate CYP3A4 transcription, thus possibly affecting drug metabolism of known DILI-indicated drugs (Russmann et al. 2010). Specific mutations in PXR have also been identified unsurprisingly as causing increased CYP3A4 induction and are therefore another genetic factor to consider in iDILI (Lamba et al. 2008).
10.5.3 Immune-mediated iDILI
The liver contains a large number of immune cells and an immune aspect could also play a role in the pathomechanism of iDILI (see sections “Immune-mediated iDILI models” and “Non-parenchymal cells and their role in hepatotoxicity” for more details on the role of NPCs in DILI). A quarter of NPCs in the liver are lymphocytes, with the CD8+ T-cell population roughly 3.5 times greater than that of CD4+ (Ju and Reilly 2012), a ratio that is reversed in the circulation where the CD4+ population is greater by 1.8-fold. The occurrence of DILI is 0.01–0.1 %; however, the DILI-associated genetic variants have a much greater prevalence (Russmann et al. 2010), thus indicating that multiple genetic aspects may play a role. Little is known about immune-mediated iDILI and very few drugs have established links to this etiology. Genome-Wide Association Studies (GWAS) and Candidate Gene Association Studies (CGAS) that have allowed the detection of genes implicated in iDILI are vital tools in this field. They do, however, give a high false-positive reading, and rely on gene frequency and so associations with low-frequency genes may not be identified (Au et al. 2011).
Recognition that drugs could stimulate the immune system to promote cellular injury was an interesting theory to account for DILI. However, to make progress in this field, knowledge of how drugs could act as antigens to promote such a response was required. When a correlation between in vitro protein reactivity and in vivo sensitization to the tested compounds was seen by Landsteiner in 1935, it was proposed that drugs could bind host proteins and subsequently stimulate T cells (Sanderson et al. 2006). This conversion of small, non-immunogenic drugs which are <1,000 Da into immunostimulatory neoantigens was termed the hapten hypothesis (Fig. 43). When a neoantigen is formed, it may cause damage itself through protein binding; however, antigen-presenting cells (APC) may promote T-cell activation (Andrews and Daly 2008). Indeed it has been shown in vitro that T cells can be stimulated by using drug–protein complexes presented by APC (Martin et al. 2010). Hepatocytes covalently express the antigen on major histocompatibility complex (MHC) class I molecules to stimulate an immune response, and liver damage ensues. Expression may also be seen on Kupffer cells by MHC class II molecules (Bleibel et al. 2007), which present to T-helper cell (Th) 1 and Th2 CD4+ T cells to stimulate a subsequent antibody or cell-mediated reaction (Andrade et al. 2004). The prohapten theory is a similar explanation for immune activation; however, it deems drug metabolites responsible for neoantigen formation (Fig. 43).

In vivo: in vitro correlation of gene expression alterations (from Heise et al. 2012). Aflatoxin B1 (AB1), 2-nitrofluorene (2-NF), methapyrilene (MP) and piperonyl-butoxide (PBO) were tested after oral administration to male Wistar rats (gene expression analysis 24 h after administration) and in sandwich cultures of hepatocytes isolated from male Wistar rats (incubation period: 24 h). In vitro, the test compounds were used at three concentrations (C1: low; C2: intermediate; C3: high, corresponding to the in vitro EC20). 22 Genes were analyzed that either belong to the group of “stress response genes” or represent “proliferation associated genes”

Schematic representation of potential immune cell participation in liver injury induced by hepatotoxic drugs (see Table 8 for details). Upon direct chemical-induced damage, only a small fraction of parenchymal cells (hepatocytes) are killed, releasing death-associated molecular patterns (DAMPs) such as CpG-rich DNA, which are detected by TLR9 expressed in LSEC, HSC and Kupffer cells. In turn, these cells release cytokines (e.g. TNFα, IL-1) which trigger the secretion of chemokines (e.g. Cxcl1) that recruit NK cells and neutrophils. These leukocytes infiltrate the parenchyma at the site of initial injury, where they further extend tissue damage by their cytotoxic arsenal (e.g. IFNγ, Fas-L in NK cells; hypochlorous acid, proteases in neutrophils). Afterward, circulating monocytes are recruited to the site of injury by chemokines (e.g. Cxcl2, RANTES, Mcp-1), where they become infiltrating macrophages (IM). These IM can resolve the cytotoxic immune milieu, by inducing apoptosis of infiltrating neutrophils and by actively removing cell debris. At the same time, HSC become activated and promote tissue repair by deposition of extracellular matrix (collagen-). If there is a single-acute injury, the inflammatory process will regress and the parenchyma will be reconstituted, mainly due to hepatocyte proliferation. However, if the damage is repeated chronically, activated HSC proliferate leading to fibrotic scarring, characterized by extensive collagen I deposition in the parenchyma

Identification of DILI compounds. It was found that a threshold of 100 times the average single-dose human therapeutic Cmax represented a reasonable threshold that differentiated positive (toxic) versus negative (non-toxic) drugs for idiosyncratic DILI. Sandwich-cultured human hepatocytes were treated with drugs for 24 h before subject to staining by a mixture of fluorescent probes for nuclei/lipids, reactive oxygen species, mitochondria and reduced glutathione. The negative controls included famotidine, fluoxetine and vehicle controls. The positive drugs included drugs that cause DILI in the clinic, e.g. nimesulide, telithromycin, nefazodone and perhexiline (for further experimental details, please refer to Xu et al. 2008)

CP-724,714 was found to completely abolish the activity of bile salt efflux pump (BSEP) in sandwich-cultured primary human hepatocyte cultures compared to vehicle-treated controls. The nuclei were stained with Hoechst. The bile canaliculi were stained by cholyl lysyl fluorescein (CLF), a substrate for BSEP. The clinical development of CP-724,714, a small molecule Her2 inhibitor for oncology indications, was stopped in phase 2 due to jaundice and cholestatic liver damage (for further experimental details, refer to Xu et al. 2012)

Left: Hepatocytes on collagen (I) spot after 5 days in culture (from Jones et al. 2009). Right Corresponding situation in the monolayer culture system

Left Stack of typical experimental images in confocal microscopy (Blue DAPI, Red DokaMS, Green DPPIV). Right Three-dimensional reconstruction and segmentation of all structures relevant to the in vivo model (Red Sinusoids, Blue Cell nuclei)

This scheme illustrates the general strategy of how architectural parameters obtained by image analysis of confocal micrographs (left) are used together with a quantification of dynamic processes in the liver (top row: regeneration after intoxication with CCl4; brown: hepatocytes, blue: central necrosis) to construct a dynamic model of the in vivo situation (bottom row: regeneration after intoxication in the model; light rose: quiescent hepatocytes, dark rose: proliferating hepatocytes, brown: glutamine synthetase positive hepatocytes, red: sinusoids, central and portal vein, blue: portal artery). Left picture: confocal micrographs after image processing; blue: hepatocytes nuclei, white: sinusoids

Overview over the hepatocyte isolation process. The procedure can be applied to livers of humans, rats, mice and other species

Liver cell isolation setup. a Ready-to-use sterile work area with sterile drape sheet, glass and plastic dishes, scalpel, forceps, cell scraper, gauze and cannula for perfusion. b Perfusion system with water bath, thermostat, peristaltic pump and Buchner funnel. c Plastic funnel with aseptic gauze and 50-ml tubes for the filtration of the cell suspension after the isolation procedure

a Resected liver piece on a sterile work area in the surgical suite showing a colorectal liver metastasis (see arrow) after right-lateral hemihepatectomy. b Preparation of the piece of liver tissue for the perfusion procedure using an amputation knife
The pharmacological interaction of drugs with immune receptors (PI) concept is a relatively new theory (Fig. 43) which does not rely on covalent binding of peptides to MHC molecules to stimulate the immune response, but rather a non-covalent direct binding of the parent drug to the T-cell receptor or MHC triggering a response (Pichler et al. 2006). The hapten and prohapten theories state that a protein carrier is necessary for a drug to become immunogenic in a hypersensitive fashion and that drugs that cannot form a hapten will not become immunogenic. Drugs that are not metabolized in the skin and were deemed unable to undergo haptenization had been used in patch tests and shown to stimulate an immune response (Pichler et al. 2006). The PI concept was then developed around the identification that sulfamethoxazole could directly stimulate T cells. Sulfamethoxazole was found to stimulate the T-cell receptor via interaction with the MHC causing T-cell activation, even when APC were fixed and so antigen processing could not occur (Schnyder et al. 1997).
Immune-mediated DILI is identified by immunological traits seen during exposure such as a positive lymphocyte transformation assay, the presence of inflammatory infiltrates (Carey and van Pelt 2005), the presence of antibodies against the drug such as for tienilic acid (Adams et al. 2010), and increased reaction severity upon re-challenge of the drug (Lee 2003). A delayed time for onset for many drugs is also thought to be associated with the time required to develop a T-cell population before injury.
10.5.4 Polymorphic MHC associations
MHC molecules are involved in the expression of antigens to T cells through binding of the T-cell receptor, and act as the primary signal of T-cell activation. There are three MHC molecule classes but only MHC classes I and II for T-cell-mediated DILI are discussed here. MHC class I molecules, which present antigens to CD8+ cells, include HLA-A, HLA-B and HLA-C loci, and are expressed on the majority of nucleated cells. MHC class II, on the other hand, encompasses HLA-DR, HLA-DQ, and HLA-DP, which present to CD4 + cells, and is expressed only on APC such as dendritic cells (Neefjes et al. 2011; Bharadwaj et al. 2012). Although the type of MHC expression results in different T-cell subsets expanding, overall activation leads to T-cell proliferation and antigenic elimination. It is well known that certain HLA molecules are highly polymorphic with more than 1,000 variants for HLA-B alone. Many variants may often have different peptide-binding capabilities, or the ability to bind different peptide fragments (Bharadwaj et al. 2012), which are the proposed reasons behind why some variants stimulate a response against a drug when the majority do not.
HLA genetic variability is of great importance in the search for a cause of immune-mediated iDILI well defined by the strong association observed between a specific HLA allele and abacavir hypersensitivity (Mallal et al. 2002). Abacavir caused acute hypersensitivity, which manifested itself after a median of 11 days into a variety of symptoms including lethargy, fever and rashes. Time to onset corresponding to time to activate the immune system and the presence of CD8+ cells recovered from a patient rash (Phillips et al. 2002) gave important evidence for the role of T cells in immune-mediated DILI. One study found a CD8+-specific T-cell response in vitro in a hypersensitive patient, thus indicating the importance of CD8+ mechanism of cell injury (Bharadwaj et al. 2012). An in vitro study specifically showing T-cell activation by abacavir (Chessman et al. 2008) confirmed these data. This response was only seen in HLA-B*5701 individuals, including those who were drug naive, and not in individuals with other HLA-B variants thus confirming the specific association between abacavir-induced liver injury and HLA-B*5701. This link is now well established and there is also reasoning as to why abacavir is specific to this allele only. The F pocket, an important site for peptide anchoring during expression to T cells, is located in the antigen-binding region of the MHC class I molecule. This position contains a position 9 polymorphism and so where in other alleles tryptophan or phenylalanine is present, HLA-B*5701 has a tyrosine which is believed to alter the repertoire of peptides that can be expressed and so accounts for the HLA specificity (Chessman et al. 2008). With a 47.9 % positive predictive value and 100 % negative predictive value, genetic pretesting is currently in place for abacavir patients as to identify those who should be treated with other medications. This has reduced the incidence of hypersensitivity with the drug from 2.7 to 0 % (Russmann et al. 2010).
The association of iDILI with specific HLA type thus indicating a T-cell-mediated etiology has been successfully identified in a range of other drugs too (Table 9). A paper from 2011 stated that the World Health Organisation (WHO) adverse Drug Reaction database had recorded almost 1,500 cases of DILI due to flucloxacillin (Lee and Lewis 2011). It is a beta-lactamase resistant antibiotic and well known to cause iDILI. Usage increased between 1991 and 2006 despite a warning in 1992 from the UK medicine control agency about the associated DILI (Li et al. 2009b), thus indicating its popularity and the wide-scale risk to patients prescribed the drug for S. Aureus infections (Robles et al. 2010). Flucloxacillin DILI has been associated with the same allele, HLA-B*5701, as in abacavir DILI and with an odds ratio of 80.6, represents the greatest genetic risk factor for iDILI ever (Russmann et al. 2010). There is also much clinical evidence to suggest an immune pathomechanism similar to that of abacavir, with inflammatory infiltrates and eosinophilia observed (Park et al. 2005), and a similar period before reaction is seen as in abacavir DILI. However, structural dissimilarity confuses the reasoning behind both drugs having the specific HLA-B*5701 association (Daly et al. 2009). There is also evidence from studies such that Th1 and Th2 responses were detected by cytokine ElISpot analysis in T-cell clones generated from a flucloxacillin hypersensitive patient (Spanou et al. 2006), and although only reported for one patient, a lymphocyte transformation test positive result has been reported (Victorino et al. 1987). The HLA-B*5701 genotype was identified as a potential risk factor in the DILIGEN trial whose aim was specifically to identify genetic associations for flucloxacillin-mediated DILI. The trial involved 51 patients with flucloxacillin DILI and looked at possible associations between disease and 866,399 makers in a GWAS. The HLA-B*5701 association was indirectly observed through linkage disequilibrium between this HLA allele and rs2395029[G] (Daly et al. 2009). Flucloxacillin appears not to affect hepatocytes or biliary epithelial cells, however, once metabolized to the hydroxyl metabolite, a reaction involving CYP3A4, biliary epithelial toxicity occurs. Just 10 % of a standard dose is metabolized to this product by CYP3A4, an enzyme whose expression is modified by flucloxacillin, which could have further implications in disease etiology (Andrews et al. 2010). This metabolite, before the HLA association was made, had been shown to undergo very specific haptenization to serum albumin in which fewer than 20 % of the lysine residue on albumin become bound (Pichler et al. 2011). As discussed, haptenization is a method of immune stimulation and so the idea of an immune etiology for flucloxacillin liver injury was there, but the HLA association has given this idea greater strength.
It should also be pointed out that only 1/500–1,000 HLA-B*5701-positive individuals progress to flucloxacillin-mediated DILI (Alfirevic and Pirmohamed 2010), thus illustrating the complexity of genetic linkages to such issues. Although not as good an indicator as in abacavir DILI where 70 % of patients with the genotype will develop liver injury (Waters et al. 2007), a large reduction is seen if compared to the 1/15,000 risk without consideration of the genotype reported in one study (Devereaux et al. 1995). The HLA-B*5701 allele is present as a common haplotype, which contains other HLA alleles including DRB10701, and C4A6 among others (Almeida et al. 2008). The ST6GAL1 gene was also indicated as having a flucloxacillin-mediated DILI association in the DILIGEN study (Russmann et al. 2010) along with polymorphisms that lead to elevated IL-4 and reduced IL-10 (Andrews and Daly 2008). Therefore, it is clear that iDILI is unlikely to have just one association and indeed may have multiple genetic influences.
Many other drugs have also been found with HLA associations. Antiepileptic drugs are commonly linked to DILI, and one of the best examples is carbamazepine. Ten percent of the total number of adverse reactions due to carbamazepine were listed as hepatic in a Swedish study (Björnsson 2008). Such hypersensitivity can have fatal consequences, and it has been noted that in such cases, symptoms are often not present (Kalapos 2002). Another established linkage is that of HLA*DRB*0701 to ximelagatran-induced liver injury. This was found in a study of 74 cases of ximelagatran DILI based upon results from both a CGAS and genome-wide tag SNP scan (Kindmark et al. 2008).
10.5.5 Intracellular signaling networks controlling DILI
Due to its general ease of use and amenability to high-throughput assays, hepatocyte cell culture, especially immortalized cell lines, is a standard approach to study different aspects of liver function and to predict hepatotoxicity of a number of drugs. However, in order to extrapolate results from in vitro hepatocyte studies to the in vivo condition in humans, it is essential to understand the effect of culture conditions on signaling pathways involved in drug-induced hepatocyte cell death. Here, current concepts on drug-induced cell signaling in hepatocytes in culture with a focus on acetaminophen toxicity explore the role of culture conditions on modulating these events.
Generally, when cultured hepatocytes are being used to screen for drug toxicity, the assumption is that using a cell viability marker will identify potential hepatotoxic agents. However, in order to extrapolate results from in vitro cell culture experiments to the in vivo system, it is essential that mechanistic indices are validated. For example, chemical-induced oxidant stress and its involvement in cell death is an area where significant differences exist between in vitro and in vivo data, leading to substantial controversies in the literature regarding mechanisms of cell injury and mode of cell death (Jaeschke et al. 2012a). Also, in spite of the numerous publications on the importance of oxidant stress in most disease processes, no beneficial effect of an antioxidant has been demonstrated in these human diseases (Jaeschke 2011). A key reason for these discrepancies is the gap in understanding of mechanisms of oxidant stress-induced cell injury, especially due to results obtained in experimental in vitro systems with limited relevance to in vivo conditions and human pathophysiology. As an illustration of the issue, the quinone redox-cycling agent menadione, which is metabolized by cytosolic flavoprotein reductase and produces superoxide and hydrogen peroxide in cultured cells, has been shown to induce oxidative stress in mitochondria (Xu and Arriaga 2009) and causes caspase-dependent apoptosis in the rat hepatocyte cell line RALA255 (Jones et al. 2000) and in primary rat hepatocytes (Conde de la Rosa et al. 2006). Paraquat, which also is a redox-cycling agent producing superoxide, causes apoptosis in primary rat hepatocytes (Conde de la Rosa et al. 2006) and in the HepG2 cell line (Liu et al. 2006b). These types of experiments led to the widely accepted dogma that “oxidant stress causes apoptosis” (Singh and Czaja 2007). By contrast, diquat- or menadione-induced oxidant stress in vivo causes oncotic necrosis in rat liver not apoptotic cell death (Hong et al. 2009). Although the MAP kinase c-jun-N-terminal kinase (JNK) is activated by oxidant stress in vivo (Hong et al. 2009) and in cultured cells (Conde de la Rosa et al. 2006), only cultured rat cells are protected by a JNK inhibitor. Another example is the role of lipid peroxidation in acetaminophen (APAP) toxicity. APAP-induced cell death in vivo is dependent on mitochondrial ROS and peroxynitrite formation (Bajt et al. 2006), but no lipid peroxidation is evident and vitamin E is not protective (Knight et al. 2003). However, in primary hepatocytes, vitamin E protects against APAP–induced cell injury (Nagai et al. 2002; Yan et al. 2010). The importance of validating in vitro data in vivo is illustrated in the case of APAP, where key mechanistic features of APAP hepatotoxicity seen in mice in vivo, such as depletion of GSH, mitochondrial dysfunction and production of peroxynitrite can be replicated in isolated primary mouse hepatocytes and in a metabolically competent hepatoma cell line (HepaRG) after exposure to APAP (Bajt et al. 2004; McGill et al. 2011). Another example is the case of troglitazone hepatotoxicity, where troglitazone hepatotoxicity has been demonstrated in human hepatocytes cultured as monolayers (Kostrubsky et al. 2000), and rat hepatocytes in culture were shown to be susceptible to troglitazone toxicity (Toyoda et al. 2001). However, no hepatotoxicity of troglitazone alone was evident when administered to rats (Li et al. 2002b), though it increased APAP toxicity in that model (Li et al. 2002b).
10.5.6 Modes of drug-induced hepatocyte cell death and the signaling involved
Cell death has traditionally been categorized into two distinct types. The programmed mode of cell death with well-defined mediators was termed apoptosis in contrast to necrosis, which was considered to be unregulated cell death. This paradigm is gradually changing in light of recent evidence which suggests that necrosis is not just a single catastrophic event but involves disturbances of cellular homeostasis, which can be amplified through intracellular signaling events ultimately resulting in necrotic cell death. Interestingly, there are a number of mediators and signaling mechanisms that are shared between apoptosis and necrosis pathways. Initiation of apoptotic cell death can be through either of two pathways; an extrinsic pathway mediated by receptors in the cell surface or an intrinsic pathway mediated by mitochondrial dysfunction (Schattenberg et al. 2006), which is more relevant to drug-induced toxicity. In fact, mitochondrial oxidant stress and subsequent signaling events are among the many common features of apoptosis and necrosis. Though a number of drugs have been shown to induce mitochondrial oxidant stress and subsequent mitochondrial dysfunction, mechanistically it is still unclear in a number of cases whether these organelles are direct drug targets or merely affected bystanders (Jaeschke et al. 2012a). At least in the case of certain drugs such as APAP, extensive studies over the last decades have shown that the mitochondria are central to the mechanism of hepatotoxicity, though the initiating events antecedent to this is formation of the reactive metabolite NAPQI (Jaeschke and Bajt 2006). Therapeutic doses of acetaminophen are typically conjugated to glucuronic acid or sulfate by transferases and the small amounts of the reactive metabolite NAPQI formed by CYP2E1 are neutralized by reaction with GSH (Dahlin et al. 1984). APAP hepatotoxicity is initiated when concentrations of the drug overwhelm the capacity of the conjugation systems, resulting in accumulation of NAPQI, and its formation of protein adducts with cellular proteins, especially in the mitochondria (Jollow et al. 1973; Jaeschke et al. 2012a). These cellular events, coupled with translocation of cytosolic Bax to the mitochondria, then result in generation of mitochondrial superoxide, which along with nitric oxide forms peroxynitrite, a highly reactive radical species (Cover et al. 2005). The increase in mitochondrial peroxynitrite causes nitration of target proteins such as SOD2 (Agarwal et al. 2011), which seems to be critical in moderating APAP-induced hepatocellular injury (Ramachandran et al. 2011). The mitochondrial oxidative and nitrosative stress induced by NAPQI protein binding then initiates a cascade of amplifying events, which include activation of JNK, its translocation to the mitochondria and ultimately, initiation of the mitochondrial permeability transition (MPT). This event then results in the release of mitochondrial factors such as cytochrome c, apoptosis-inducing factor (AIF) and endonuclease G into the cytosol. The subsequent translocation of AIF and endonuclease G into the nucleus then initiates the characteristic DNA fragmentation and oncotic necrosis induced by APAP overdose (Bajt et al. 2006). A number of events in this pathway, such as mitochondrial Bax translocation, the activation of the MPT and the release of cytochrome c and AIF from the mitochondria, were initially thought to be unique features of apoptosis. However, these events are now recognized to also occur during necrotic cell death (Jaeschke 2006). In fact, activation of the mitochondrial permeability transition is now considered to occur mainly in necrosis (Baines 2011), during which the release of cytochrome c has also been demonstrated (Jaeschke and Bajt 2006; Bajt et al. 2008). The described intracellular events and mechanisms after APAP exposure are very similar in primary mouse hepatocytes (Bajt et al. 2004, 2006; Burke et al. 2010; Kon et al. 2004, 2010; Ni et al. 2012; Reid et al. 2005), human HepaRG cells (McGill et al. 2011) and in human patients (McGill et al. 2012) compared to the in vivo mouse model.
In addition to APAP, mitochondrial dysfunction is also seen in hepatocytes exposed to a number of other drugs and chemicals. A study in immortalized human hepatocytes (HC-04) demonstrated that troglitazone produced mitochondrial oxidant stress and shifted the redox ratio of mitochondrial Trx2 toward the oxidized state. This then results in activation of apoptosis signaling kinase 1 (ASK1), leading to mitochondrial permeabilization (Lim et al. 2008). Troglitazone has also been shown to induce degradation of PGC-1α, which is thought to function in conjunction with the nuclear hormone receptors estrogen-related receptor-alpha and gamma to regulate mitochondrial mass and oxidative phosphorylation, resulting in a reduction in mitochondrial mass (Liao et al. 2010). Acetyl salicylic acid has been shown to induce mitochondrial dysfunction, oxidant stress and induction of apoptosis in HepG2 cells (Raza et al. 2011).
10.6 Hepatotoxicity models
10.6.1 Toxicogenomics, a rapidly evolving subdiscipline of toxicology
The development of molecular biology and, more specifically, genomic tools has progressed rapidly over the last decade, not only technically but also methodically and analytically. The ability to analyze and understand molecular mechanisms has allowed a greater insight into the extreme complexity of molecular relationships. Although the scientific literature is crowded with detailed new findings and molecular details, there is a consensus that we have just started to scratch the surface. One of the key challenges of future development will be to make sense out of all the data generated with these modern techniques.
It is widely accepted that the adverse effect evoked by a toxicant can be captured by analyzing an organism’s genome, because through various mechanisms such compounds alter cellular homeostasis which the cell tries to maintain by switching on/off the expression of specific genes. There are sophisticated new and established tools that allow one to understand how an organism or cells respond at the gene expression level to stressors. These relationships can be very complex, but the understanding of molecular pathways and interactions will have an enormous impact on our ability to assess the risk from exposure to toxicants.
Toxicogenomics can be defined as a scientific subdiscipline that combines toxicology (the study of the nature and effects of poisons) with genomics (the investigation of the way that our genetic makeup, the genome, translates into biological functions). It is the study of the structure and output of the genome as it responds to adverse xenobiotic exposure and the identification of their putative mechanisms of action. Therefore, the field of toxicogenomics is a highly interdisciplinary field combining knowledge of chemistry, molecular biology, mathematics and statistics (Khor et al. 2006; Nuwaysir et al. 1999; Chin and Kong 2002). In the field of toxicology, a profound knowledge of the compound-induced adverse reactions on the molecular level is crucial. A multitude of toxicogenomics studies have been published showing the elucidation of molecular mechanisms, the discovery of novel biomarkers, as well as how gene expression analysis can influence risk assessment. As an example, the work of Afshari et al. (2011) gives a comprehensive overview on the history, development and recent issues.
Although the relationships between changes in gene expression and adverse effects are not fully understood at this time, there is a belief that changes in the gene expression pattern may prove to be useful in predicting a specific toxic outcome. This would allow the extrapolation of toxic effects from known model compounds to unknown compounds by comparison of their expression profiles (Hamadeh et al. 2002a, b; Zidek et al. 2007; Ellinger-Ziegelbauer et al. 2004; Hrach et al. 2011). The development of specific databases based on expression profiles of reference compounds and the use of ever improving statistical methods to discriminate compounds on the basis of their gene expression profiles will result in highly informative gene clusters which can be used to predict the class membership of new unknown compounds (Hamadeh et al. 2002a). To date, studies employing such predictive models are based on in vivo data and are mainly focused on acute toxicity (Hamadeh et al. 2002b; Zidek et al. 2007; Ellinger-Ziegelbauer et al. 2008; Ruepp et al. 2005). Using these modern techniques of data generation and analysis, together with established in vitro systems, it should be possible to predict subsequent adverse effects early in a compounds development. This would lead a much more efficient and streamlined drug discovery/development process and also overcome the ethical, time and financial bottleneck of animal use.
10.6.1.1 Possibilities and limitations of in vitro systems for toxicogenomics
Multiple cell culture models are being used to evaluate the potential of drug-induced liver toxicity of a new drug or chemical candidate. The advantages and limitations of these “screening” tools are very apparent (and described elsewhere in detail within this paper). There is currently great progress in the development and standardization of stable in vitro liver cell culture techniques. Hepatocytes are of particular interest as they have a central function in the metabolic fate and the process of detoxification and toxification of xenobiotics. Unfortunately, they have not been amenable for longer-term in vitro experiments as they undergo the process of dedifferentiation upon perfusion and culturing. This has restricted their use to mechanistic studies or short-term metabolic and acute toxicity testing. Recent studies have demonstrated the possibility to maintain hepatocytes in their differentiated state with a high enzymatic activity for longer time by using 3D ECM and supplementing the culture medium with certain factors (Tuschl and Mueller 2006; Tuschl et al. 2009; Godoy et al. 2009). Even though these in vitro systems are continuously being improved (in both predictability and complexity), we are still far away from reliably predicting in vivo effects and their application in toxicogenomics is still considered as problematic. This criticism has its background in studies where little overlap between gene expression alterations induced in the liver in vivo and in cultured hepatocytes has been reported (Kienhuis et al. 2009). For example, acetaminophen altered the expression of 1,349 genes in rat liver in vivo, 368 genes in rat hepatocytes cultured in a standard medium and 1,289 genes in rat hepatocytes cultured in a modified medium containing enzyme inducers (Heise et al. 2012). However, only 18 (1.4 %) and 2 (0.5 %) of the genes altered in vitro (in hepatocytes cultured in modified and standard medium, respectively) were analogously altered in the same direction in vivo. Not a single gene altered in both in vitro systems was also altered in vivo. This negative result prompted another study that systematically compared gene expression alterations in vitro using the improved rat hepatocyte sandwich culture system and livers of rats exposed in vivo (Heise et al. 2012). In this study, 22 genes that were up- or downregulated in livers of rats after oral administration of the liver carcinogens, aflatoxin B1 (AB1), 2-nitrofluorene (2-NF), methapyrilene (MP) and piperonyl-butoxide (PBO), were analyzed (Heise et al. 2012). The functions of the 22 genes have been classified as (1) stress response, DNA repair or metabolism associated or (2) associated with proliferating cells. Subsequently, rat hepatocyte sandwich cultures were exposed to AB1, 2-NF, MP and PBO for 24 h and expression of the aforementioned genes was determined by RT-qRPC. Significant correlations between the degree of test compound-induced gene expression alterations in vivo and in vitro were obtained for the metabolism, stress and DNA repair associated genes at concentrations covering a range from cytotoxic to non-toxic/in vivo relevant concentrations (Fig. 44). In contrast to the stress associated genes, no significant in vivo/in vitro correlation was obtained for the genes associated with proliferating cells. The reason for this discrepancy is that in contrast to the liver in vivo, hepatocytes cultured in sandwich culture do not show replacement proliferation. This example illustrates that not all groups of genes altered in response to toxic compounds in vivo show a similar response also in cultured hepatocytes. Nevertheless, the remaining in vivo and in vitro overlap may still be large enough to allow identification of toxic pathways. For the establishment of classifiers, more important than the exact overlap to the in vivo situation is the consistent reproducibility of the effects found in vitro after compound treatment (as discussed later in this chapter).
10.6.1.2 The relevance of pharmacokinetics
Recently, other in vivo/in vitro discrepancies have been described by comparing gene expression in cultured hepatocytes (described by Beekman et al. 2006) and the rat liver in vivo study of Ellinger-Ziegelbauer et al. (2008). In the inter-laboratory study of Beekman et al. (2006), four independent laboratories observed that the non-genotoxic rat liver carcinogen methapyrilene increases RNA levels of the DNA damage response gene protein phosphatase 1 (GADD34) and decreases expression of the metabolizing enzymes SULT1A1 and 4-aminobutyrate aminotransferase (ABAT) in cultured rat hepatocytes (Schug et al. 2012). This was later confirmed by other authors (Schug et al. 2008; Heise et al. 2012). However, in the in vivo studies of Ellinger-Ziegelbauer et al. (2004, 2008), methapyrilene did not significantly alter expression of GADD34, SULT1A1 or ABAT in livers of rats at any tested doses and time points (summarized in Schug et al. 2012). Should this in vivo/in vitro discrepancy be true, it would mean that the in vitro system with cultured hepatocytes is capable of producing false-positive data. Under such circumstances, it would seem naive to invest research efforts into in vitro gene expression profiling studies aimed at classifying different classes of hepatotoxic compounds. Therefore, this seemingly contradictory case was revisited in a recently publication (Schug et al. 2012). Interestingly, the discrepancy was not a result of false positive in vitro data but could be explained by different pharmacokinetics in vitro and in vivo. Because of its relatively short half-life of approximately 2.8 h in rats, orally administered methapyrilene in vivo soon decreases below concentrations that can cause gene expression alterations. This corresponded to the time curve of GADD34, ABAT and SULT1A1 RNA levels in the liver: RNA levels were altered 1, 6 and 12 h after methapyrilene administration but return to control levels after 24 and 72 h (Schug et al. 2012). By contrast, methapyrilene concentrations in vitro decrease at a much slower rate. This explains why GADD34, ABAT and SULT1A1 are still deregulated after a 24-h exposure period in vitro but not in vivo. It should also be considered that the earliest analyzed time point in the previous in vivo studies was 24 h after methapyrilene administration. In conclusion, the previously observed in vitro/in vivo discrepancy is not a result of false positive in vitro data but can be explained by different pharmacokinetics in vitro and in vivo. Therefore, although the currently available hepatocyte in vitro systems still clearly differ from the in vivo situation, they nevertheless reflect some of the in vivo responses correctly and should therefore be applied for establishment of in vitro classifiers of hepatotoxicity.
10.6.1.3 In vitro classifiers of hepatotoxicity
Cha et al. (2010) have recently identified a classifier for hepatotoxicity prediction, specifically for non-steroidal anti-inflammatory drugs (NSAIDs) by analyzing differential gene expression profiles in HepG2 cells. A hepatotoxicity prediction model based on 8 positive compounds was built and 77 specific genes identified as being predictive. These genes and pathways, commonly regulated by hepatotoxicants, may be indicative of the early characterization of hepatotoxicity and possibly predictive of later hepatotoxicity onset. Four test compounds, including hepatotoxic and non-hepatotoxic NSAIDs, were used for validating the prediction model and the accuracy was 100 %. Even though these results are promising, the gene expression of HepG2 cells does vary greatly from the situation in the liver. The reliability of this small data set and the relevance of the gene signature for the situation in hepatocytes or in vivo will have to be confirmed in the future. Cheng et al. (2011) published a study in which a cell-based molecular predictor of hepatotoxicity was developed (based on in vivo rat and human in vitro data), and tested this signature against data from more than 160 diverse compounds. Here they were able to predict in vivo acute hepatotoxicity from an in vitro cell model.
In a recent publication, in vitro and molecular techniques were combined to establish a new in vitro model for toxicological screening (Hrach et al. 2011). Similar techniques have been reported before; however, the combination used by here was novel and the data set used was more comprehensive than other smaller studies, which addressed only very specific questions (Boess et al. 2003; Braeuning et al. 2006). The key objective of this study was to determine whether it is possible to distinguish between hepatotoxic and non-hepatotoxic compound–based gene expression data from long term exposed in vitro cultured rat hepatocytes.
Before being able to address such complex issues, the cell culture method used must allow longer-term culturing of hepatocytes. Being extensively discussed in the scientific literature, this is still a key objective and topic of scientific research. As discussed earlier in this review, adding a third dimension into the culture system of primary rat hepatocytes has proven to help maintain the cells in a viable and metabolically active state for longer (Tuschl and Mueller 2006; Tuschl et al. 2009). A comprehensive genomic time course analysis showed that after an initial adaptation phase, gene expression stabilized in sandwich culture. This is of particular importance when compound-specific gene expression changes after treatment are assessed.
Sandwich-cultured rat hepatocytes were treated with well-known hepatotoxic and non-hepatotoxic model compounds in a proof-of-concept study. Gene expression data were collected and used as a training set to build a classification model, using four different clustering algorithms. Ranking of genes according to their contribution to the classification and misclassification rates were calculated, and a classifier composed of 724 genes was found that could discriminate between the two compound groups (Fig. 44)—and therefore, in principal, predict human drug toxicity. Furthermore, the model was challenged with another, unknown, model compound and proved its discriminative capability (Hrach et al. 2011). The best results were obtained with samples dosed for 9 days and including both high and a low concentration of the test compounds in the model. In this case, the misclassification rate was reduced to only 7.5 %.
The intention of these experiments was to test the ability to compute a predictive model based on pattern analysis of transcriptomic data from in vitro experiments with rat hepatocytes—without previous mechanistic knowledge. Nevertheless, the whole data set or the descriptive subset of genes selected can be used for subsequent mechanistic analysis to identify compound-specific mechanisms or subsets of genes specific for a particular mode of action.
In the last few decades, many genes have been proposed as predictive biomarkers, although only a few of them have been shown to be really decisive. The identification of gene signatures and networks seems to be promising as they contain more information and therefore are more reliable than single gene biomarkers (Khor et al. 2006). Ideally, a prediction model would be able to classify novel compounds based on new, in vitro generated, gene expression data by applying previously determined classifiers and gene networks independently from mechanistic analyses. This would largely contribute to candidate selection and therefore contribute to the improvement of the drug/chemical discovery and development process. The ability to conduct mechanistic studies with the same data generated for the model can prove itself valuable in later stages of development. The data shown in Fig. 44 are extremely promising, but require further validation and refining. Being aware that there are multiple mechanisms of liver toxicity leading to a variety of perturbations in gene expression, there is a need for validation of the data of this feasibility study. Further compounds covering every end point of liver toxicity needs to be introduced into the data set to substantiate the classifier. The aim, in the end, will be a solid classifier comprising a set of genes highly saturated with genes being predictive for liver toxicity end points. Besides the robustness, reliability and predictivity, the gene set building the classifier should consist of a manageable number of genes measurable in a standard method (e.g. Taqman) to allow broad acceptance.

a A buttoned cannula is placed in a blood vessel and fixed with tissue glue. b The first perfusion step is carried out in order to remove residual blood and to warm up the tissue. c Recirculation of Collagenase P-containing perfusion solution for digestion of the liver tissue during perfusion step II. d The digested liver tissue is gently tweezed and cut into two halves with a scalpel, before the cells are released into the surrounding stop solution
Although still on an experimental level, with many parameters still to be considered, this (and other recent reports) example shows that once a reliable and stable cell culture system has been established, the combination of whole genome analysis and in vitro cell culture can contribute to early detection of specific target organ toxicities. Utilizing in vitro models will make it possible to build large databases with time-matched gene expression data of cells treated with many reference compounds and drug candidates. Furthermore, the insecurity of extrapolating the results between species may be overcome by the possibility to conduct these experiments with human cells, as well as the potential to explain the species differences which are too often seen in preclinical animal studies.
10.6.1.4 Hepatocytes and the influence of culture conditions on cellular signaling
The applicability of results from in vitro studies to in vivo situations is directly dependent on the degree of similarity between the in vitro experimental condition and the in vivo environment. Differing conditions would render data non-reproducible in vivo and result in controversies on mechanisms of disease and potential therapeutic targets as mentioned earlier regarding lipid peroxidation in APAP hepatotoxicity. Though oxidative stress is known to play a role in drug toxicity, hepatocyte responses to oxidative stress vary depending on cell type and experimental condition.
In the context of oxidative stress, a major difference between the hepatocyte environment in vivo and in vitro culture conditions is the oxygen tension. Primary cultures of hepatocytes are typically carried out at normoxia or 21 % oxygen, while hepatocytes in the liver are exposed to an oxygen gradient of 9–11 % (zone 1) to 5–7 % (zone 3) (Broughan et al. 2008). It is therefore possible that hepatocytes in culture are exposed to additional oxidant stress, which affects the mode of cell death and intracellular signaling mechanisms (Halliwell 2003). In fact, it appears that the threshold of ROS-induced toxicity is much lower in cultured cells leading to apoptosis and under more severe conditions to necrosis (Conde de la Rosa et al. 2006). On the other hand, much of the oxidant stress in vivo is more effectively detoxified and only when the multi-layered antioxidant system is overwhelmed do the cells die by oncotic necrosis (Hong et al. 2009). The modulation of cell signaling mechanisms relevant to cell death by oxygen tension is illustrated by the fact that in the case of APAP-induced cell necrosis, the higher oxygen concentrations in cell culture lead to higher mitochondrial oxidant stress, and accelerated mitochondrial dysfunction and APAP-induced cell death at 21 % oxygen compared to 10 % oxygen (Yan et al. 2010). The interesting point here is that it was not the baseline oxidant stress which was affected under hyperoxic (21 %) conditions but the APAP-induced mitochondrial ROS formation. This suggested that primary cultured hepatocytes exposed to drugs under 21 % oxygen show an enhanced oxidant stress, which can lead to injury mechanisms involving Fenton-type reactions and lipid peroxidation. In the case of acetaminophen, this mechanism is irrelevant in vivo (Knight et al. 2003) and in primary hepatocytes under 10 % oxygen (Yan et al. 2010), which mimic closer in vivo conditions. Thus, when cells are incubated in room air (21 % oxygen), there is a risk for exacerbation of oxidant stress mechanisms in the pathophysiology.
In addition to oxygen levels, the other issues affecting data in vitro is physical culture conditions. While the majority of hepatocyte culture in vitro is carried out after plating the cells and allowing them to adhere, a few studies use cells in suspension (Burke et al. 2010). This could probably be justified in cases where drug metabolism is important and CYP activity loss with time is an issue. However, the major drawback is that incubating cells in suspension could severely affect their susceptibility to cell death signals. In fact, comparing APAP toxicity in adherent versus suspended cells shows a 4–5-fold higher cell death in suspended cells independent of the dose of APAP used (Ramachandran and Jaeschke, unpublished). It has also been shown that hepatocyte spheroids in culture generate ROS with time (Lillegard et al. 2011), which could confound studies on cell death signaling involving free radicals.
Another factor affecting cell signaling is the matrix used when culturing cells. Culturing hepatocytes on dry stiff collagen induces resistance to TGF-β-induced apoptosis (Godoy et al. 2009, 2010). A study comparing toxicity of troglitazone between gel-entrapped human and rat hepatocytes cultures demonstrated that human hepatocytes were more susceptible to the drug in this system compared to the rat hepatocytes, an effect not seen in monolayer culture (Shen et al. 2012).
10.6.2 iDILI biomarkers
Attempts have been made to discover biomarkers, which could identify drugs or patients at risk of developing idiosyncratic toxicity. Altered gene expression profiles in vitro have been suggested as predictive markers of toxicity (Lambert et al. 2009; Cheng et al. 2011) (section “Toxicogenomics, a rapidly evolving subdiscipline of toxicology”), which could distinguish between toxic and subtoxic doses of drugs; however, this may not be applicable to iDILI. This is because it is more likely to be the starting gene expression or protein profile of the patient rather than the response to the drug, which pre-disposes the individual to iDILI.
In vivo models have so far identified a number of potential biomarkers, including inflammatory mediators that are selectively upregulated prior to liver injury, which could potentially be of prognostic value in humans (Deng et al. 2009). In vivo, one study attempted to model idiosyncratic hepatotoxicity mediated by oxidative stress by incubating isolated rodent hepatocytes with a number of drugs known to cause iDILI (Tafazoli et al. 2005). The pro-oxidant environment increased hepatocyte sensitivity to drug-induced toxicity, suggesting that biomarkers of oxidative stress may also be indicative of risk of iDILI. Since cytokines are implicated in the mechanism of idiosyncratic toxicity, it has been suggested that the identification of a “cytokine fingerprint” in preclinical models could translate to a predictive tool in humans (Lacour et al. 2005). Other studies have sought to find protein biomarkers in vitro. Protein kinase C inhibitor protein 1 (PKCIP-1) and macrophage migration inhibitory factor (MIF) were found in conditioned medium of hepatic models, only when the cells had been exposed to drugs linked with iDILI (Gao et al. 2004). In this study, PKCIP-1 correlated with known toxicity profiles of all 20 drugs tested, and MIF was correct in 19/20 with one false-negative result.
10.6.3 Immune-mediated iDILI models
Work carried out in a number of studies has revealed genetic linkages with DILI and have also hinted at the involvement of underlying inflammatory diseases as possible risks (see section “Immune-mediated iDILI”). These observations have aided in our understanding of the mechanism of liver injury for a number of drugs. The possible involvement of pre-existing inflammatory states has received much attention in animal models of hepatotoxicity. In comparison with control drugs, lipopolysaccharide-mediated inflammation has been shown to shift the toxicity curve to the left for a number of idiosyncratic drugs such as trovafloxacin (Shaw et al. 2009) and chlorpromazine (Buchweitz et al. 2002), which therefore cause damage at much lower doses. Data from in vivo studies have been developed upon and transferred into in vitro systems where it was found that combinations of inflammatory cytokines can increase the sensitivity of primary hepatocytes and liver cell lines to iDILI drugs (Cosgrove et al. 2009). Such results have been seen with ranitidine (Tukov et al. 2007), chlorpromazine (Gandhi et al. 2010) and sulindac (Zou et al. 2009). This underlying inflammatory cytokine risk may be the result of stimuli unrelated to the drug, for instance a bacterial or viral infection, or the result of a drug-mediated inflammatory response. The formation of a hepatocyte model which incorporates a pro-inflammatory environment so as to study these effects would only require a simple addition to systems already in place and could be of help in the study of hepatotoxic drugs where the pathomechanism includes inflammatory signals. For some drugs however, an inflammatory background may play an important but not obligatory role, with rare and specific genetic trait or traits, playing the more major roles. The development of models allowing the comparison of different phenotypes in patients who have experienced idiosyncratic reactions may improve the prediction of a drug’s potential to cause liver injury in cases where particular genotypes are at risk. The supply of human hepatocytes is a potential worry; however, hepatocyte differentiation from stem cells could be a solution and is currently driving the field of embryonic stem cell research reviewed in (Baxter et al. 2010) and described in section “Embryonic stem cell-derived hepatocytes.” The ethical concerns of using human embryo-derived stem cells is further driving research into isolating stem cells from adult tissues (Tanaka et al. 2011), and inducing pluripotency in terminally differentiated adult somatic cell sources (Huang et al. 2011; Sekiya and Suzuki 2011). It is this exciting induced pluripotent stem cell (iPSC) work that could potentially derive liver-like cell lines for preclinical screening assays directly from patients who have experienced iDILI (Tiscornia et al. 2011). Cell banks from different patient cohorts would be valuable in the weighting of genetic versus environmental factors that can synergize to produce the rare conditions required for hepatic damage by a drug at otherwise safe doses. However, modeling iDILI in vitro remains a huge challenge due to the complex physiological environment that predisposes the liver to injury, and the multicellular series of events, which lead to injury.
In vitro models have also been developed to look at T-cell stimulation applicable to iDILI. A recently published paper reports on the generation of dendritic cells from peripheral blood mononuclear cells in vitro, which are subsequently used to stimulate drug naive T cells with sulfamethoxazole. Proliferation assays and cytokine detection assays were then used to detect a response (Faulkner et al. 2012). Such an assay could be used to detect HLA allele-specific T-cell stimulation in vitro, which is of potential prognostic use.
10.6.4 Role of NPCs in immune-mediated DILI
The characteristics and transporter function of a number of NPCs and their contribution to hepatotoxicity are described in section “Non-parenchymal cells and their role in hepatotoxicity.” Here, the role of the immune response and NPCs in drug-induced hepatotoxicity is described. Even considering our understanding of this complex and dynamic process is only partial, some basic principles can clearly be recognized that call for a re-evaluation of in vitro systems aimed to reproduce aspects of liver toxicity in vivo. It is clear that a starting cue comes from chemically induced hepatocyte damage, which results in release of DAMPs that are detected by TLR in LSECs and HSCs. This induces the release of chemokines and cytokines which results in the recruitment of neutrophils and NK cells (Fig. 45). These leukocytes have the potential to exert cytolytic activity against hepatocytes. Neutrophils may release their chemical arsenal in the form of proteases and enzymes that generate ROS. Likewise, NK cells attack hepatocytes by their inherent cytotoxic activity via FasL and release of their granules containing perforin and granzyme (Fig. 45). Although the roles of neutrophils and NK cells have been well validated in several models of liver damage such as ischemia–reperfusion and biliary obstruction (Notas et al. 2009; Jaeschke et al. 2012b), their role in DILI remains controversial (Jaeschke et al. 2012b). This is largely due to off target effects in the experimental approaches such as pre-conditioning the liver by antibody-based neutrophil depletion (Liu et al. 2004; Ishida et al. 2006; Jaeschke and Liu 2007; Jaeschke et al. 2012a, b), or NK cell activation by DMSO used in acetaminophen solutions (Masson et al. 2008; Jaeschke et al. 2012b). Clearly, there is a need for more refined experimental strategies to accurately identify the role of these cells in hepatotoxicity. Current advances in the field of live tissue imaging using genetically labeled fluorescent cells allows direct visualization of immune cells for extensive time periods (McDonald et al. 2010). Such techniques in combination with knockout strains are beginning to shed light in this complex scenario (McDonald et al. 2010). Furthermore, even if neutrophils and NK cells were convincingly demonstrated not to contribute to acetaminophen toxicity, this does not exclude a potential role of the innate immune system in hepatotoxicity induced by other drugs and compounds.
For Kupffer cells and macrophages, it seems that their role in acetaminophen-induced hepatotoxicity is well understood. In this model, depletion approaches demonstrate that these cells promote tissue regeneration (Holt et al. 2008; Campion et al. 2008). However, these cells might play different roles in hepatotoxicity induced by other drugs. Recent investigations have shown that macrophages are not a single cell type, and the identification of macrophage-subpopulations is revealing distinct classes with sometimes opposing roles: M1 or classically activated macrophages, which are triggered by Th1 cytokines and bacterial molecular components such as lipopolysaccharide, and M2 or alternatively activated macrophages, which are generated in response to Th2 cytokines. In acetaminophen-injured liver, the infiltrating macrophages are M2, and their role seems to be promoting tissue regeneration by secreting anti-inflammatory cytokines (IL-10, IL-13) and TGF-β which can promote wound closure by inducing HSC proliferation and differentiation. As for neutrophils and NK cells, more investigations are needed to determine their contribution to drug-induced liver injury.
Further controversy arises when dealing with HSCs. These cells express TLR4 and TLR9, and in addition, they can secrete potent chemoattractants for macrophages (Mcp-1, RANTES) and neutrophils (Cxcl1/Gro1). Secretion of these chemokines in HSCs can be induced by TNFα and IL-1β, indicating that HSCs can initiate and promote an inflammatory response that might aggravate the initial damage inflicted by drugs. However, HSCs can also secrete TGF-β and ECM proteins (e.g. collagen I) which leads to wound closure and resolution of inflammation. The lack of efficient cell depletion strategies for HSC makes it difficult to assess their contribution to hepatotoxicity in vivo.
In the case of LSECs, it can be expected that in an initial phase, they would promote the inflammatory process, by sensing cell debris from damaged hepatocytes via TLR (e.g. TLR9), followed by secretion of chemokines and expression of cell adhesion molecules that recruit neutrophils to the site of damage. However, it remains to be elucidated whether they also play a role in recruitment of macrophages that can favor the regeneration process. For LSECs, a cell depletion strategy would not be practical, since it would result in extensive hemorrhage and initiation of an inflammatory process.
Obviously, there is still a need for animal experiments to understand and characterize all the mechanisms involved in hepatotoxicity. Moreover, current knowledge encourages the development of co-culture systems with hepatocytes and NPCs. Understanding the precise role of cytokines, chemokines and leukocytes in vivo has the potential to implement such systems in vitro. Those approaches should reproduce the direct damage to hepatocytes and the cytokine-chemokine synthesis and secretion in NPCs. Eventually, inclusion of potentially harmful leukocytes (e.g. NK cells, neutrophils) might reflect the cytolytic component of inflammatory cells. These approaches may increase the sensitivity for hepatotoxic assays in vitro while better reflecting the most important mechanisms in drug-induced hepatotoxicity.
Finally, priority should be given to establishment of in vitro systems that reflect a true quiescent in vivo-like state, which can be triggered into an inflammatory milieu only by the addition of hepatotoxic compounds. Noteworthy, culture of primary LSEC induces per se synthesis and secretion of cytokines, and exposure to CpG-DNA enhances this feature (Martin-Armas et al. 2006). Likewise, culture of primary HSCs induces features of in vivo-activated HSCs (Dooley et al. 2001). Primary hepatocytes also undergo an activation process during culture that not only represses the expression of metabolic genes, but also triggers signaling pathways typically induced in the regenerating liver (Zellmer et al. 2010). Thus, a strong effort must be focused on improving in vitro systems for primary liver cells.
In conclusion, understanding the role of the immune system and NPCs in drug-induced hepatotoxicity is fundamental for our interpretation of molecular mechanisms of toxicity and for establishing new and improved in vitro systems for toxicity testing.
10.6.5 Use of primary cells versus transformed cells for hepatotoxicity testing
While primary hepatocytes and their cultures are simple and versatile in vitro systems, they have a major drawback for use in studies where metabolic activation of the drug is important. Due to the loss of CYP activity with time and significant interspecies variations between humans, mice and rats in drug toxicity, such as for APAP (Jemnitz et al. 2008) using human hepatocytes for study of APAP toxicity, would have the most relevance to human pathophysiology. However, availability of livers that yield hepatocytes suitable for preparing primary cultures remains a problem and individual cultures of human hepatocytes exhibit variable responses to known inducers of CYPs (Aninat et al. 2006). In addition, primary human hepatocytes have scarce and unpredictable availability, limited growth activity and lifespan, and undergo early phenotypic alterations (Aninat et al. 2006). A viable alternative in this scenario is the recently derived HepaRG cell line, which was initially isolated from the liver of a patient with hepatocellular carcinoma and are bipotent progenitor stem cells expressing markers of both hepatocytes and bile duct epithelial cells (Parent et al. 2004). In the presence of EGF, HepaRG cells show a prominent differentiation pattern toward hepatocyte-like cells, though smaller amount of biliary epithelial-like cells also persist (Parent et al. 2004). HepaRG cells have been shown to stably express transcripts for the P450 system (Josse et al. 2008), and exposure to prototypical inducers resulted in induction of CYPs, including CYP3A4 (Kanebratt et al. 2008b), the major CYP enzyme form catalyzing APAP oxidation to NAPQI in the human liver (Laine et al. 2009). These cells have been used to study metabolism of drugs such as midazolam, naloxone and clozapine and it was shown that their metabolism in HepaRG cells was similar to human hepatocytes (Kanebratt et al. 2008a), suggesting that HepaRG cells closely resemble primary human hepatocytes and are metabolically competent. However, it has to be kept in mind that HepaRG cells are also transformed cells and signaling events may be altered due to that fact. A study comparing signaling networks between normal and transformed hepatocytes showed a number of significant differences in cell signaling pathways, including a shift in insulin receptor signaling from a metabolic function in the normal liver to a pro-survival function in transformed cells that involve elevated PI3K/AKT and GSK3 phosphorylation (Saez-Rodriguez et al. 2011). Cell signaling networks determined from biochemical data also revealed profound differences in Toll-like receptor and inflammatory signaling between normal and transformed hepatocytes (Alexopoulos et al. 2010). It has also been shown that TGF-β signaling to AKT and EGFR is different in adult rat hepatocytes and hepatoma cells (Caja et al. 2007). Hence, it is essential that key features of drug-induced cell signaling be validated in vivo at least in rodents before extrapolations from studies on transformed cells are made. Key mechanistic aspects of APAP toxicity have been demonstrated, such as GSH depletion, protein adduct formation, mitochondrial dysfunction and nuclear DNA fragmentation, which have been validated in mice (Jaeschke et al. 2012a) and humans (McGill et al. 2012), also occur in HepaRG cells in culture (McGill et al. 2011), suggesting that these cells could be a useful model for understanding mechanisms of APAP-induced hepatotoxicity and evaluating therapeutic intervention strategies.
In contrast to primary cells and HepaRG cells, most hepatoma cells (HepG2, Hep3B, HuH7, etc.) are characterized by very low levels of all drug metabolism enzymes and transporter proteins. Despite these shortcomings, these cells have been extensively used in mechanistic studies of APAP-induced cell death (e.g. Macanas-Pirard et al. 2005) and in proteomics and genomics experiments (Van Summeren et al. 2011; Prot et al. 2011). Although detrimental effects including cell death can be induced in hepatoma cells by APAP, in the absence of reactive metabolite formation, gene and protein expression changes and signaling mechanisms of cell death obtained in these cells have little relevance for the pathophysiology in animals or humans (Jaeschke et al. 2011).
10.6.6 Tools for high-throughput assays used in chemical screening
Future uses for primary liver cell models might also include high-throughput screening assays in programs such as the USEPA ToxCast program (Judson et al. 2011; Shah et al. 2011). There is an ongoing effort in toxicology to find cheaper and faster ways to identify potentially toxic chemicals without using large numbers of animals. As a result, several large governmental programs have been launched in Europe and the US including ToxCast™ launched in 2007 that is anticipated to be a new approach for prioritizing large numbers of chemicals that need toxicity testing. Currently, there are over 600 in vitro assays included in ToxCast, most being cell-based assays. Primary human hepatocyte cultures have been used as a model system in ToxCast to characterize the concentration and time response of the ToxCast chemicals for changes in expression of genes regulated by NRs, including the AhR. These gene expression data can be used to rank order chemicals for further testing based on their relative potencies for gene induction. In addition, the results from the AHR-induced genes in primary human hepatocytes are being used with other ToxCast assay results in an attempt to develop predictive modeling for in vivo toxicity.
10.6.7 High-throughput screening and prediction models for DILI and the use of image analysis


The key mechanisms leading to DILI include: CYP-mediated activation of toxicants to reactive metabolites, oxidative stress overcoming antioxidant defense systems, mitochondrial injury and pathogenesis of steatohepatitis, membrane transport and pathogenesis of drug-induced cholestasis (Kaplowitz and Deleve 2002). To recapitulate the underlying biological processes, a necessary in vitro system to screen for these key mechanisms should at a minimum possess the following characteristics: (a) a normal repertoire of drug activation and detoxification enzymes, (b) oxidative and antioxidant defense systems, (c) uptake and efflux transporters, and (d) healthy mitochondria. Primary cultures of human hepatocytes, from either freshly isolated or cryopreserved cell sources, represent the best currently available in vitro model that met these criteria. Specifically, hepatocytes cultured in the sandwiched configuration with both top and bottom layers of ECM maintain balanced drug metabolism (Mathijs et al. 2009) and transport (Bi et al. 2006). Since the degree to which how much drug load hepatocytes “see” intracellularly and the degree drug is metabolized or activated dictate the ultimate prediction of drug-induced toxicity, sandwiched hepatocyte culture represents the current state of the art of in vitro models for hepatotoxicity studies (Swift et al. 2010).
It is known that a single drug and/or its metabolite can cause DILI by more than one mechanism. For example, acetaminophen forms reactive metabolite but also induces oxidative stress and mitochondrial injury (Reid et al. 2005), troglitazone can induce mitochondrial injury but also interferes with BSEP (Masubuchi 2006). Therefore, an in vitro screen focusing on a single mechanism is unlikely to be sufficient for studying DILI. Proper evaluation of hepatotoxic potential requires a combined measure of multiple indicators of cellular health. In the past few years, several mechanism-specific measurements have been developed based on the concept of “phenotypic anchoring screens.” These screens rely on key modes of action that are central to the most common mechanisms of DILI, e.g. ROS generation and GSH depletion as occurs during oxidative stress, mitochondrial membrane potential change as occurs during mitochondrial injury, inhibition of BSEP as occurs during drug-induced intrahepatic cholestasis (Boelsterli 2003). At a practical level, these phenotypic screens further employed a panel of optimized fluorescent probes to measure these modes of action specifically (Xu et al. 2012). The concept of phenotypic screens can be extended to include other toxicologically relevant end points by using additional fluorescent or other markers to probe other pathophysiological processes including steatosis, phospholipidosis, apoptosis, endoplasmic reticulum (ER) stress, protein trafficking and transport dysfunctions.
The accuracy and efficiency of conducting and obtaining data from phenotypic screens has been greatly facilitated by automated fluorescent microscopes equipped with a charge-coupled device (CCD) camera, and a computer algorithm capable of performing rapid image analysis. With today’s state of the art image analysis systems, microscopic-quality images of specimens can be saved, multiple measurements on toxicological mechanisms of interest can be obtained, all with the same speed of a traditional light-based plate reader. The richer biology revealed by the image-based screens far surpasses the knowledge gained from non-image-based screens, as a picture is often worth a thousand words. While a combination of optimized hepatocyte cultures (via sandwiched culture) and phenotypic screens (via automated image analysis) is a powerful advancement in the study of DILI, the technology has to confront a set of key questions that challenges all in vitro tests. That is: Where does the test draw a line between positive (toxic) versus negative (non-toxic) response? How good is such a prediction? How can such a prediction be applied in the real world? How can such a test be further improved to account for additional modes of action of hepatotoxicants?
The phenotypic screens utilizing sandwiched human hepatocytes were validated with over 300 drugs and chemicals, including over 100 drugs that were considered non- or less hepatotoxic (Xu et al. 2008). In particular, drugs that showed transient increase in liver-derived alanine aminotransferase (ALT) activity in serum without causing serious hepatotoxicity in the clinic were included as less hepatotoxic controls. This less hepatotoxic list includes clinically beneficial drugs such as tacrine, simvastatin, aspirin, fluoxetine, propranolol, raloxifene, paroxetine and buspirone. The inclusion of these real-world drugs as negative controls made it possible to truly assess the test’s low false-positive rate. On the other hand, DILI-positive drugs included those: (a) withdrawn from the market mainly due to DILI (e.g. troglitazone), (b) not marketed in the USA mainly due to DILI (e.g. nimesulide), (c) received black-box warnings from the FDA mainly due to DILI (e.g. dantrolene), (d) marketed with hepatotoxic warnings in their labels (e.g. telithromycin), 5) other drugs with at least 10 independent published clinical reports of DILI that met the criteria of Hy’s Law (e.g. sulindac and diclofenac). The use of many such “real-world” hepatotoxic drugs led to the conclusion that at least half of the idiosyncratic DILI drugs can be identified by in vitro tests utilizing primary human hepatocytes and image-based screens. It was also found that a threshold of 100 times the average single-dose human therapeutic C max represented a reasonable threshold that differentiates positive (toxic) versus negative (non-toxic) drugs for idiosyncratic DILI (Fig. 46).
The 100× C max can be rationalized as follows:
-
1.
there is likely a span of 6× difference between an average single-dose human therapeutic C max, versus a multi-dose steady-state C max for certain outlier patients in a large patient population, for an orally administered drug;
-
2.
there is likely a span of another 6× difference in the systemic C max versus liver C max for an orally administered drug, due to first-pass effect of the liver;
-
3.
another threefold safety scaling factor to account for toxicodynamic variability in a large patient population;
-
4.
Hence, 6 × 6 × 3–100-fold scaling factor may be necessary in order to detect those rare DILI events in a simple and uniform in vitro test.
In applying the test in the “real-world” setting, it was found that drugs that failed in clinical trials due to DILI (i.e. not the low-frequency idiosyncratic DILI but still detrimental to a drug development program nevertheless) can generate a positive (toxic) signals at concentrations less than 100× clinical C max (Feng et al. 2009). This makes sense from the scaling rationale described above. Another realization is that when clinical C max is not yet available for a new drug candidate, it can be replaced with predicted efficacious concentrations (C eff). Furthermore, when comparing drugs modulating the same biological target, such a comparison based on predicted C eff can be very effective in differentiating toxic from safer drug candidates (Xu et al. 2012).
Several improvements have been accomplished or envisioned by extending the phenotypic screening concept described above. These include measuring hepatobiliary transport processes, or toxicities requiring inflammatory conditions or extended period of drug exposure. To study the mechanism of inhibition of bile acid transport, a fluorescent bile acid (cholyl lysyl fluorescein or CLF) was employed in the screen. In normal healthy hepatocyte sandwich cultures, CLF is taken up by the hepatocytes and transported to the bile canaliculi space, as shown in the top-right panel in Fig. 47. At 3× clinical C max, CP-724,714 completely abolished this process. The inhibition of bile acid transport by CP-724,714 was more potent than erythromycin estolate or cyclosporine A, when compared to their clinical C max values (Fig. 47). The clinical development of CP-724,714, a small molecule targeting Her2 expressing tumors, was stopped in phase 2 due to jaundice and cholestatic liver damage. In another study, in order to mimic the effects of inflammatory conditions which may sensitize the liver cell for more drug-induced injury, a mixture of common inflammatory cytokines were added to hepatocyte cultures and their effects on DILI are studied (Cosgrove et al. 2009). The authors screened 90 drugs for cytokine effect in human hepatocytes and found that a significantly larger fraction of the idiosyncratic hepatotoxicants (19 %) synergized with cytokine addition than did the non-hepatotoxic drugs (3 %). Drug–cytokine synergy was observed for trovafloxacin but not levofloxacin, matching similar observation in a lipopolysaccharide-administered rodent model of hepatotoxicity (Shaw et al. 2007). Furthermore, it is now possible to culture and maintain differentiated liver functions up to 3 weeks (Wang et al. 2008b). These longer-term models made it possible to further investigate the mechanism of chronic DILI caused by drugs including nucleoside reverse transcriptase inhibitors (NRTIs) (Kline et al. 2009). It can be expected that with better understanding of mechanisms underlying DILI, further advances in hepatocyte culture systems and image-based or other high-content biomarker measurements, our predictivity toward idiosyncratic DILI can only improve.
10.6.8 Use of tissue imaging, image analysis and mathematical modeling to model in vitro and in vivo liver architecture


The main target of medical research is the understanding of disease and repair mechanisms in human in order to improve diagnosis and treatment of patients with liver disease. A fundamental question is in how far information collected in vitro can be used to extrapolate to disease and regeneration mechanisms in vivo. In this Section, the application of a mathematical model of in vivo tissue is illustrated, as well as the pre-calibration of the model by in vitro experiments and re-adjusted with in vivo experiments in order to guide an experimental strategy of in vivo experiments optimized to efficiently unveil disease and repair mechanisms. For this purpose, the example of liver regeneration after drug-induced pericentral damage has been used. A process chain composed of imaging and image analysis is used to quantitatively calibrate model and model parameters of the in vivo mathematical model. While extensive modeling work has been performed on the intra-cellular scales, unveiling the activity pattern of signal transduction pathways and the metabolism of liver cells, including the PBPK models representing different compartments of the body to investigate drug action, the precise spatio-temporal dynamics of liver tissue in disease progression and regeneration is still not well understood (Hoehme et al. 2010). Recently, Hoehme et al. (2010) established a model based on a process chain integrating data from image analysis to mimic regeneration after drug-induced pericentral damage. Within this review, the general conceptual idea underlying that approach is sketched. Of particular, importance is how far mathematical models can be pre-constructed based on in vitro experiments and then re-adjusted by specifically chosen in vivo experiments to complement missing information not accessible in vitro but necessary to better understand the organizational principles and processes underlying a particular disease or repair process of interest. The regeneration after CCl4-induced pericentral damage in mouse is considered here, but the conceptual approach can be applied equally to other tissue organization processes.
The procedure consists of two fundamental steps: (1) the setup of a pre-calibrated mathematical model based on in vitro experiments. At this stage, the model is capable to capture the observed and expected phenotypes and behaviors of hepatocytes in culture; (2) the re-adjustment and/or extension of the mathematical model based on imaging and image analysis, as well as of iterative re-adjustment of the mathematical model from step (1) until a given in vivo process can be quantitatively explained. In an iterative process and by comparison with experimentally obtained process parameters, the resulting model is then adapted until the experimental observations in in vivo 3D tissue architectures can be reproduced. The iterations are guided by mathematical model predictions followed by experimental testing of the predictions named “model-guided experimental strategy.” Ultimately, the strategy shall be used to predict the behavior of the modeled system in not yet observed or experimentally not accessible situations.
10.6.8.1 Initial in vitro model
Already spatiotemporal in vitro tissue modeling is a challenging task. Individual cells behave as entities capable of migrating, growing and dividing, responding on signals in their environment and modifying their environment. Quantitative modeling requires understanding of biomechanical and biological cell properties and of how these properties may change as a response of external signals or cell internal machinery. One of the difficulties in constructing spatiotemporal models on tissue scale is that important components such as material parameters of individual cells may affect the multi-cellular organisation and hence have to be included in the model. In the last years, however, more and more methods have been established that are at least partly capable of providing this information. Bio-mechanical parameters as the Young modulus, the Poisson ratio or viscous parameters can now be estimated by optical stretcher experiments, atomic force microscopy, magnetic bead experiments or ultrasound-based methods.
In addition to these bio-mechanical parameters of individual cells, the experimental observation of growth dynamics and morphologies of cell clusters in vitro, for example growing on collagen substrates (Jones et al. 2009), (Fig. 48, left panel) or within sandwich cultures (Swift et al. 2010), can lead to important insights and can be used to further parameterize an initial mathematical model of a hepatocyte population in vitro. Microscopic imaging of growing cell cultures typically allows measurements of cell number, cell density or even individual cell positions over time. By quantifying the dynamics of population growth, a distribution of cell cycle times, which is an important cell-biological model parameter, can be derived. BrdU or Ki67 staining permits localization of proliferating cells. Furthermore, cell density measurements allow the quantification of typical cell sizes and their distribution within the cell population. Depending on the spatial and temporal resolution of the imaging techniques, which in typical experiments can range from days down to milliseconds when rapid time-lapse microscopy is utilized, cell diffusion constants can be approximated by tracking the movement of individual cells or analyzing border properties of the cell population (Block et al. 2007).
This information from measurements addressing material parameters and biological migration, growth and division parameters can be condensed to set up a mathematical model of monolayers. The used model framework should in the next step permit extensions of the model to the in vivo situation. The complex in vivo architecture (see below) favors a model type where each cell is represented individually as basic modeling unit (“single-cell-based model” or “agent-based model”) (Block et al. 2007; Drasdo et al. 2007; Anderson et al. 2007). In the mathematical model described by Drasdo (2005) and Drasdo et al. (2007) and Galle et al. (2005), each individual cell is represented by an isotropic, elastic and adhesive object of limited compressibility and deformability. Model hepatocytes are capable of active migration, growth and division and are defined by cell kinetic, biophysical and cell biological parameters that in principle can all be obtained by experimental measurements. As introduced by Galle et al. (2005) for monolayers, and Drasdo et al. (2007) for multi-cellular spheroids, cell movement was simulated by a stochastic equation of motion for the position of each cell. This equation mimics friction, adhesion and repulsion forces with the substrate and other cells, and the micro-motility of each cell (Galle et al. 2005) (for an explanation of the equation, see section “Appendix 3”).
As cells in hepatocyte suspensions have a spherical shape and hepatocyte shapes from confocal micrographs resemble deformed spheres (Hoehme et al. 2010), each model cell can be assumed to be intrinsically spherical. “Intrinsic” means that the cell is spherical in isolation but can be deformed or compressed if it interacts with other cells. For cell division, it is assumed that a cell starting from an initial volume first doubles its volume, and then deforms at constant volume into a dumb-bell, before it divides into two cells of the original initial volume. It is considered that cell cycle entrance is inhibited if the cell experiences a too strong pressure (Drasdo and Hoehme 2012). With such a model, multi-cellular phenotypes of hepatocytes (Fig. 48, right panel) or other cell types in monolayer and multi-cellular spheroids, in liquid suspension as well as in more tissue—like environment could be successfully mimicked (Drasdo and Hoehme 2012; Drasdo 2005; Galle et al. 2005; Drasdo et al. 2007).
Establishing such an initial model in a relatively controlled in vitro situation has the advantage that many structures and factors that potentially influence hepatocyte behavior in vivo can be excluded. Thereby, in vitro models can more easily be tested even though at the expense of lacking mechanisms representing 3D architecture and signaling in vivo. For example, NPCs, blood vessels, the bile canaliculi network and ECM, may drastically influence the bio-mechanical and bio-chemical behavior of disease and regeneration processes hence studying the main parenchyma in vitro is certainly an oversimplification for most tissue organization—degeneration as well as regeneration—processes in liver. For this reason, the next step illustrates how the initial in vitro model was extended in order to capture the more complex yet more realistic in vivo situation during liver regeneration after CCl4 intoxication in mouse.
10.6.8.2 Toward in vivo
In order to develop a mathematical model that realistically represents key spatiotemporal features of a tissue under study, the static tissue architecture as well as changes of that architecture in the process of interest—here: liver regeneration—must be taken into account. A number of invasive and noninvasive methods are available to quantify the 3D tissue structure in vivo. For example, bright field microscopy can be used with histological sections to reconstruct the tissue architecture. This technique has the advantage that large regions of tissue can be imaged in high resolution and for arbitrary z-depth only limited by the cutting process. The physical cutting, however, is also the major disadvantage of this method as it inevitably produces artifacts such as inhomogeneously, unisotropically distributed deformations of the cut tissue. Although there are a number of image processing methods available to counteract these artifacts (Braumann and Kuska 2006), the accuracy of the reconstruction remains limiting at high resolutions and the effects of the cutting cannot be fully compensated. Furthermore, the minimal thickness of histological tissue slices is approximately 5 μm as thinner slices would drastically increase deformation artifacts and generate tissue rupture. This thickness, however, largely prevents the full reconstruction of connectivity of the sinusoidal network and would not allow capturing the 3D structure of the bile canaliculi network, whose average diameter is approximately 1–2 μm.
Another widely applied method is confocal microscopy where a post-processing by image registration techniques is not necessary due to the use of optical sectioning without the need for physical cutting. In confocal imaging, the maximal z-depth of around 120 μm down to which an image can be obtained is limited by the penetration depth of both light and antibodies. By using two-photon excitation microscopy, this maximal imaging depth can be increased to up to 1 mm (Denk et al. 1990). Despite this limitation, it is still possible to reconstruct and statistically quantify liver cells (hepatocytes and NPCs), the sinusoidal network (as well as the bile canaliculi network that is not shown here) in great detail (Fig. 49) (Hoehme et al. 2010). With this information, an extended spatiotemporal in vivo model on the scale of the liver lobule that integrates statistical information from a large number of data sets and therefore in a sense constitutes a representative model tissue can be constructed. In order to construct architecturally valid models on lobe and organ scale, however, a quantification of larger blood vessels (above the scale of the sinusoids) that define the 3D shape of the lobules in the liver is required, too. Confocal microscopy cannot capture the structure of these macroscopic vessels because of the limited z-depth that can be imaged. Noninvasive techniques as microtomography (Elliott and Dover 1982), however, are able to capture the entire liver. Although compared to bright field or confocal microscopy, the acquired data sets have significantly lower resolution they may be used to obtain the complementary information of the 3D architecture of macroscopic hepatic vessels. By integrating both microscopic and macroscopic architectural parameters, spatiotemporal models may be constructed that represent the correct tissue architecture across multiple scales from lobule up to organ scale.
Based on the additional information emerging from the complex liver lobule architecture, the initial mathematical model, developed from in vitro data in step (1), must be extended to account for elements that are known to have an important impact in the in vivo situation as for example cell polarity and the liver blood vessels. Polarized model cells can change their orientation leading to anisotropic adhesion. In case of anisotropic adhesion, cell orientation changes may compromise tissue architecture hence cell orientation changes may become a crucial element. For simplicity, in the report by Hoehme et al. (2010), cell orientation changes were modeled by energy minimization (using the so-called Metropolis algorithm) instead of numerically integrating equations for the torques. However, the cell–cell interaction energy can be obtained if the cell–cell force is known (Block et al. 2007) (see also the paragraph on the Metropolis algorithm in “Appendix 3”).
In the report by Hoehme et al. (2010), the summary effect of all processes and components is modeled—such as of the bile canaliculi network—contributing to hepatocyte polarity by a polar cell–cell adhesion. The equation of motion for each cell for the in vitro situation (equation (1)) is modified by adding terms taking into account forces between hepatocytes and sinusoids, and friction between hepatocytes and the extra-cellular matrix localized in the space of Dissé. The sinusoidal network and the larger hepatic vessels are represented by chains of spherical subelements linked by springs. For each subelement, an equation of motion similar to that for cells is solved whereby the micro-motility term is dropped. With these model extensions—anisotropic cell–cell adhesion, the sinusoids, as well as the cell-sinusoid interactions—a representative initial state for the in vivo mathematical model can now be set up.
10.6.8.3 Model-guided experimental strategy
So far, the constructed spatiotemporal model for the in vivo situation only contains direct information on static tissue architecture and thus lacks parameterization to capture dynamic, i.e. processes information. Process parameters can be quantified by similar imaging and analysis methods used to obtain the architectural parameters. For example, in order to realistically model regeneration of liver after intoxication or partial hepatectomy, quantification of cell proliferation and cell death is needed (Hoehme et al. 2007, 2010). The proliferation pattern is usually obtained by analyzing BrdU, PCNA or Ki67-stained histological slices or tissue blocks imaged using confocal microscopy. The necrotic region that forms after intoxication can be captured by detecting changes in the tissue phenotype and captured by measurement of the necrotic area and the number of hepatocytes after intoxication and during the regeneration process (Fig. 50).
Experimentally, information on dynamic processes can typically only be obtained for a number of discrete time points, while the model generates continuous information. Therefore, the mathematical model must not only be able to reproduce the experimentally observed systems behavior at the points of time of the experiments but also be able to extrapolate the systems behavior between the experimentally observed time points. The process parameters may be partly used to parameterize the mathematical model (as the proliferation pattern described by Hoehme et al. (2010) was used to determine the cell cycle entrance rate in space and time) or to compare the results of model simulations on the cellular and tissue scale to the experimental data and therefore to verify the model (the number of hepatocytes, the size of the necrotic area and the exchange area between hepatocytes and blood (Hoehme et al. 2010) was used to compare mathematical model and experiments in vivo). If the model results do not completely capture the experimentally observed phenotypes or behavior by modifying the model parameters within biologically valid ranges, important structures, mechanisms or processes that are required to correctly capture the specific in vivo situation may be missing in the model. For example, Hoehme et al. (2010) reported that including sinusoids and cell polarity turned out to be insufficient to explain the experimental results on liver regeneration after CCl4 intoxication. In this case, the model can be used to generate predictions of what these missing model elements could be. The predictions then guide further experiments aimed at verifying or falsifying them by follow-up experiments. In case the predicted new model elements could be validated, they are included in the model and the iteration is restarted testing whether the extended model is now able to correctly capture the experimentally observed situation. Hoehme et al. (2010) reported that active directed migration toward the necrotic zone and hepatocyte alignment during division along sinusoids (“HSA”) were identified by the model to be candidate mechanisms necessary to correctly reproduce the process parameters, number of hepatocytes, lesion size and hepatocytes–blood exchange area. The existence of active directed migration toward the necrotic zone was supported by bright field micrographs, HSA could subsequently be validated experimentally by analyzing confocal scans of sinusoids and dividing hepatocytes. Hence, this iterative strategy of modeling and experimentation can lead to the discovery of yet unknown mechanisms and processes.
10.6.9 Use of mathematical modeling to liver metabolic pathways and cellular behavior


Mathematical modeling of biological systems has advanced to a branch of modern molecular and cellular biology. Mathematical models can be descriptive (e.g. fitting a phenomenological regression function to a data set) or mechanistic, i.e., relating complex properties of a biological system such as growth, spatial movement or morphogenesis to the properties of the constituting components and the interactions among them. In the post-genomic era, the integrative and heuristic function of mathematical models is of increasing importance as biological experimentation has reached a new quality. This holds in particular for molecular and cellular biology, where efficient methods of DNA and RNA sequencing and protein structure analysis, quantification of molecule levels by high-throughput techniques such as transcriptomics, monitoring of the spatiotemporal movement of macromolecular complexes and cellular organelles in single cell by fluorescence spectroscopy provide data for virtual all layers of hierarchical organization spanning between the genotype and the phenotype.
Putting a variety of data from different spatial and temporal scales into a consistent and logical relationship requires also a novel quality of mathematical models (Koide et al. 2009b). Traditionally, mathematical models in molecular and cellular biology have focused on a specific level of cellular organization and therein on well-studied subsystems with a small (2–30) number of interacting components. The methodological benefit of such “reductionist” approach is obvious. However, explaining the behavior of cells, tissues and organs as a whole in terms of the underlying molecular processes—the ultimate goal of systems biology—requires the development of multi-scale models comprising a large set of different biological entities. Currently, however, the development of multi-scale cell models is hampered by the fact that the enormous experimental progress achieved in making large-scale molecular snapshots of the cell was not flanked by an equally intensive elucidation of the biochemical processes unifying these molecular snapshots to a dynamic picture. The exception is metabolism, where during several decades of biochemical research, profound knowledge on structural and kinetic properties of numerous enzymes has been accumulated enabling the development of detailed mechanistic models for selected subsystems (see below). By contrast, the detailed kinetic characterization of molecular processes involved in gene regulation and signal transduction is still in its infancy, thus preventing the creation of truly mechanistic models. Therefore, alternative modeling techniques like constraint optimization methods have become more and more popular during the last 15 years. The following section provides a short overview on the main classes of metabolic models currently applied in liver biology and discusses their utility for in vitro studies of hepatocyte metabolism.
10.6.9.1 Stoichiometric networks
Stoichiometric metabolic networks are basically reaction graphs defined by a set of chemical compounds (metabolites) forming the nodes of the graph and processes (biochemical chemical reactions and transport processes through membranes, in the following referred to as “reactions”) converting the metabolites into each other, i.e. forming the edges of the graph. Algebraically, a network model is given by the so-called stoichiometric matrix (S ij ), whereby S ij is an integer denoting how many molecules of metabolite (i) are formed (S ij > 0) or utilized (S ij < 0) in reaction (j).
Definition of the stoichiometric network is the compulsory first step in metabolic modeling. It may taken into account various information sources of different credibility to demonstrate the presence of a reaction in a given tissue or cell type, ranging from clear-cut evidences derived from biochemical studies of individual reactions (in vitro assays) to rather uncertain inferences solely based on gene expression data and genome-based sequence comparisons (Haggart et al. 2011). Size and completeness of the network are mainly governed by the specific biochemical issues addressed by modeling and experimentation. For studies on the central metabolism of hepatocytes, a medium-scale network as used in (Orman et al. 2011) to study the metabolic response of perfused livers to various oxygenation conditions will be sufficient in many cases. This network comprises glycogen synthesis and degradation, glycolysis and gluconeogenesis, fatty acid synthesis and β-degradation. For studies linking the central metabolism to more “peripheral” pathways like nucleotide salvage metabolism or amino acid metabolism, large-scale networks are available. Gille et al. (2010) constructed a comprehensive metabolic network of the human hepatocyte comprising 777 metabolites in six intracellular and two extracellular compartments and 2,539 reactions. The network was based on available liver-specific gene expression data and intensive literature search for biochemical evidences supporting the presence of reactions in human hepatocytes. A similarly large network comprising 1,360 metabolites and 1,827 reactions was proposed by Jerby et al. (2010). These authors used an algorithm that exploits transcriptomic, proteomic, metabolomic and phenotypic data to extract liver-specific reactions from the generic human network Recon1 (Duarte et al. 2007). A third reconstruction of a human liver-specific metabolic network used primarily proteomics data (Zhao et al. 2010a). However, unlike the two other reconstructions, it was never tested for completeness, consistency and functionality.
10.6.9.2 Topological models of stoichiometric networks
Some basic properties of a metabolic network can be tested without development of sophisticated mathematical models. The concept of elementary flux modes allows identifying all subsystems which at steady state may operate as an independent module (Kaleta et al. 2009; Schuster et al. 1999). The number of elementary modes present in a metabolic subsystem was also used to investigate the structural robustness of the amino acid metabolism of hepatocytes networks against multiple knockouts (Behre et al. 2008). Several algorithms are available to check whether or not a reaction or transport process is essential, i.e. cannot be removed (=“in silico knockout”) from the network without compromising its functionality. Because the essentiality of a reaction depends on the availability of external substrates and thus on the composition of the external medium, it is an interesting problem of topological network analysis to predict minimal sets of external substrates allowing the network to produce a prescribed output and to check such predictions experimentally (Klamt 2006). A special variant of essentiality analysis with particular relevance for network-based drug design allows to determine a minimal set of reactions, the so-called minimal cut set (Klamt 2006; Klamt and Gilles 2004), that have to be simultaneously silenced in order to compromise a predefined function of the network.
10.6.9.3 Metabolic flux analysis
Metabolic flux analysis (MFA) aims at the determination of reaction rates (often called “fluxes”) in a metabolic network. MFA represents a relatively simple type of mathematical modeling that goes without deeper knowledge of kinetic and regulatory properties of enzymes and transporters. A serious experimental restriction of MFA is that the network has to be in a steady state, i.e. time-dependent changes in the internal metabolite concentrations should be negligibly small over the time interval of the study.
Under this condition, the steady-state condition can be used to calculate the unknown fluxes \( v_{j} \) from a smaller set of measured independent fluxes. The number N* of these independent fluxes that have to be experimentally determined is given by the rank of the stoichiometric matrix. As the choice of the independent fluxes is not unequivocal, the modeler and the experimentalist together can agree on a list of independent fluxes that can be comfortably determined (preferentially exchange fluxes that can be easily measured by monitoring the respective concentration changes in the external medium) and which from the computational point of view allow to infer the remaining fluxes with a minimal error. Numerous examples for MFA applied to liver cells can be found in the report by Orman et al. (2012). Note that if the number of measured fluxes is smaller than the number of independent fluxes N*, MFA has to be complemented by flux-balance analysis (see below) to determine all fluxes.
A special and more advanced type of MFA consists in the determination of fluxes by means of radioactive tracer experiments. After administration of a substrates labeled at defined heavy atoms position by an isotope (C13, C14, N15,…), the labeling of internal metabolites is monitored in a time-dependent manner. These time-courses obey a first-order differential equation comprising the unknown fluxes as free adjustable parameters (Sauer 2006). Maier et al. (2008) applied this method to determine fluxes in glycolysis, pentose-phosphate pathway (PPP) and citric acid cycle (TCA) in a hepatoma cell line grown in aerobic batch cultures.
10.6.9.4 Constraint optimization methods
This modeling technique is commonly referred to as flux-balance analysis (FBA) as it presumes all internal fluxes to be balanced (steady-state condition). This method has greatly advanced during the past 15 years as it provides predictions of stationary metabolic fluxes in large-scale networks for which experimental information is insufficient to apply MFA or kinetic modeling. The basic idea of FBA is to determine the distribution of fluxes in the network by solving an optimization problem, i.e. minimizing (or maximizing) a physiological objective function that depends on the metabolic fluxes. A vague justification of this approach may be taken from the consideration that natural evolution has shaped the regulation of enzymes and transporters in a way that allows an optimal performance of the metabolic network.
The outcome of FBA depends sensitively upon the choice of the objective function. For the metabolism of microbial systems characterized by fast growth, the maximization of biomass production is typically used as optimization criterion. For hepatocytes and other complex eukaryotic cell types, growth is only one out of a multitude of possible objectives to be accomplished by an “optimal” metabolism. Accordingly, some FBA studies on hepatocyte metabolism (Nolan et al. 2006; Uygun et al. 2007) applied a multi-level approach where the distribution of intracellular fluxes optimizes simultaneously a set of relevant metabolic functions as, for example, maximization of oxygen uptake and synthesis of urea. The principle of flux minimization (Holzhutter 2004) has been used to determine in a large-scale metabolic network of hepatocytes, the rate with which ammonia is converted in varying proportions into urea, alanine and glutamine (Gille et al. 2010). The oxygen consumption rates inferred from these flux distributions were in good concordance with the fact that ammonia detoxification is zonated, i.e. shifts from predominant urea production in well-oxygenated periportal hepatocytes to almost exclusive glutamine synthesis in poorly oxygenated pericentral hepatocytes. Generally, however, it has to be emphasized that owing to the incomplete knowledge of all metabolic objectives and their relative importance in a given metabolic state of the hepatocyte and, furthermore, the idealized assumption of a perfect metabolic optimization renders flux predictions by FBA fairly hypothetical and certainly less reliable compared to MFA or kinetic modeling techniques.
10.6.9.5 Kinetic models of hepatocyte metabolism
MFA and FBA merely determine stationary fluxes in the metabolic network without being able to account for these fluxes by the regulatory features of the underlying enzymes and transporters. To really understand metabolic regulation and on that basis to design new experiments with high informational gain, it requires the development of mechanistic mathematical models. These mechanistic (kinetic) models use the formalism of chemical kinetics (ordinary or partial differential equations) to relate the fluxes and metabolite concentrations to the kinetic and regulatory properties of the underlying reactions. They allow in silico simulations of stationary states as well as time-dependent metabolic changes elicited by variations in substrate supply, transient siRNA knockdown of enzymes or membrane transporters, enzyme inhibition by drugs and toxins or administration of hormones, to name only a few possible applications.
Up to now, relatively few kinetic models of hepatocyte metabolism have been developed, each of them focusing on a small number of reactions pertinent to the specific metabolic function of interest. For example, Bartel and Holzhütter (1990) modeled the adenine nucleotide salvage metabolism of hepatocytes and simulated the impact of anoxia and subsequent re-oxygenation on variations in the total adenine nucleotide pool of the cell. Chalhoub et al. (2007a, b) used kinetic models to study the interdependence of carbohydrate and lipid metabolism. Beard and Qian (2005) investigated the impairment of hepatic glucose production in von Gierke’s and Hers’ diseases. Maier et al. (2010) analyzed the control of glycolysis in HepG2 cells under conditions of glucose deprivation by fitting a kinetic model to the measured concentrations of 25 extra- and intracellular intermediates. A kinetic model of ammonia detoxification in the liver lobule was constructed by Ohno et al. (2008) which accounts for the strict zonation of this metabolic function. Surprisingly, despite the fact that a large body of our current knowledge on metabolic regulation in higher vertebrates has been gathered by studies in isolated hepatocytes, liver slices, liver homogenates and liver perfusion systems, up to now, no comprehensive kinetic model of the central metabolism of liver cells is available. However, in the German systems biology program, “Virtual Liver” work is in progress that aims at the establishment of a kinetic model of the full central metabolism of human hepatocytes which is supposed to serve as an integral part of a multi-scale liver model developed (Holzhutter et al. 2012).
11 Final conclusions
Many in vitro and in vivo models have been developed to investigate the complex interactions between pathways and functions of the liver, as well as mechanisms of action of chemically induced liver injury—these models form the basis of this review. In order to achieve a better liver model, a clear understanding of its structure is needed. The liver is not composed of just one cell, although this is an obvious choice for hepatic-specific effects, and even hepatocytes themselves have different phenotypes depending on their zonal location. For years, hepatocytes have been isolated and separated from their neighboring cells, yet current thinking is to reunite them in in vitro models to reproduce in vivo results. The advances in isolation and culture techniques have meant that the research into different NPCs has increased, along with our understanding of their importance in overall liver function and responses to toxins. The selection of liver models is ever-increasing, ranging from perfusion of intact livers, liver slices and isolated cells to co-cultures of multiple cell types and 3D “organoid” models and bioreactors. The availability of human cells has increased with the improvements in cryopreservation techniques; however, perhaps more effort has been invested in recent years into understanding differentiation and the genes involved in this process. This has meant that high-quality alternatives to primary human hepatocytes may now be a reality. Metabolically competent cell lines, precursor cells and stem cells feature prominently as the most promising models for investigating diseases, toxicity and metabolic functions, although these will require further optimization to represent complete replacements for primary hepatocytes. Multiple international projects are running to investigate mechanisms of liver injury and establishing novel models which are more predictive than current standard regulatory studies. Models—in vivo, in vitro and in silico—for apoptosis, steatosis, idiosyncratic DILI and hepatocarcinogenesis are now extensively described, along with high-throughput models that aim to be more practical for the pharmaceutical and chemical industries.
Clearly, there is a wealth of information that has been generated in the past decade—much has been learnt, but it is a certainty that more will come! It is the hope that this review has encompassed the most important recent advances in understanding liver functions and developing more relevant models and has given food for thought for future research.
References
Abe T, Unno M, Onogawa T, Tokui T, Kondo TN, Nakagomi R, Adachi H, Fujiwara K, Okabe M, Suzuki T, Nunoki K, Sato E, Kakyo M, Nishio T, Sugita J, Asano N, Tanemoto M, Seki M, Date F, Ono K, Kondo Y, Shiiba K, Suzuki M, Ohtani H, Shimosegawa T, Iinuma K, Nagura H, Ito S, Matsuno S (2001) LST-2, a human liver-specific organic anion transporter, determines methotrexate sensitivity in gastrointestinal cancers. Gastroenterology 120:1689–1699
Abramovitch S, Dahan-Bachar L, Sharvit E, Weisman Y, Bentov A, Brazowski E, Reif S (2011) Vitamin D inhibits proliferation and profibrotic marker expression in hepatic stellate cells and decreases thioacetamide-induced liver fibrosis in rats. Gut 60:1728–1737
Abshagen K, Eipel C, Kalff JC, Menger MD, Vollmar B (2007) Loss of NF-kappaB activation in Kupffer cell-depleted mice impairs liver regeneration after partial hepatectomy. Am J Physiol Gastrointest Liver Physiol 292:G1570–G1577
Abshagen K, Eipel C, Kalff JC, Menger MD, Vollmar B (2008) Kupffer cells are mandatory for adequate liver regeneration by mediating hyperperfusion via modulation of vasoactive proteins. Microcirculation 15:37–47
Abu-Absi SF, Friend JR, Hansen LK, Hu WS (2002) Structural polarity and functional bile canaliculi in rat hepatocyte spheroids. Exp Cell Res 274:56–67
Abu-Absi SF, Hansen LK, Hu WS (2004) Three-dimensional co-culture of hepatocytes and stellate cells. Cytotechnology 45:125–140
Adams DH, Ju C, Ramaiah SK, Uetrecht J, Jaeschke H (2010) Mechanisms of immune-mediated liver injury. Toxicol Sci 115:307–321
Adams RM, Wang M, Crane AM, Brown B, Darlington GJ, Ledley FD (1995) Effective cryopreservation and long-term storage of primary human hepatocytes with recovery of viability, differentiation, and replicative potential. Cell Transpl 4:579–586
Afshari CA, Hamadeh HK, Bushel PR (2011) The evolution of bioinformatics in toxicology: advancing toxicogenomics. Toxicol Sci 120(Suppl 1):S225–S237
Agarwal S, Holton KL, Lanza R (2008) Efficient differentiation of functional hepatocytes from human embryonic stem cells. Stem Cells 26:1117–1127
Agarwal R, Macmillan-Crow LA, Rafferty TM, Saba H, Roberts DW, Fifer EK, James LP, Hinson JA (2011) Acetaminophen-induced hepatotoxicity in mice occurs with inhibition of activity and nitration of mitochondrial manganese superoxide dismutase. J Pharmacol Exp Ther 337:110–116
Aithal GP, Ramsay L, Daly AK, Sonchit N, Leathart JB, Alexander G, Kenna JG, Caldwell J, Day CP (2004) Hepatic adducts, circulating antibodies, and cytokine polymorphisms in patients with diclofenac hepatotoxicity. Hepatology 39(5):1430–1440
Akazawa Y, Gores GJ (2007) Death receptor-mediated liver injury. Semin Liver Dis 27:327–338
Akita H, Suzuki H, Hirohashi T, Takikawa H, Sugiyama Y (2002) Transport activity of human MRP3 expressed in Sf9 cells: comparative studies with rat MRP3. Pharm Res 19:34–41
Akiyama TE, Baumann CT, Sakai S, Hager GL, Gonzalez FJ (2002) Selective intranuclear redistribution of PPAR isoforms by RXR alpha. Mol Endocrinol 16:707–721
Alexandre E, Viollon-Abadie C, David P, Gandillet A, Coassolo P, Heyd B, Mantion G, Wolf P, Bachellier P, Jaeck D, Richert L (2002) Cryopreservation of adult human hepatocytes obtained from resected liver biopsies. Cryobiology 44:103–113
Alexopoulos LG, Saez-Rodriguez J, Cosgrove BD, Lauffenburger DA, Sorger PK (2010) Networks inferred from biochemical data reveal profound differences in toll-like receptor and inflammatory signaling between normal and transformed hepatocytes. Mol Cell Proteomics 9:1849–1865
Alfirevic A, Pirmohamed M (2010) Drug induced hypersensitivity and the HLA complex. Pharmaceuticals 4
Alison MR (2005) Liver stem cells: implications for hepatocarcinogenesis. Stem Cell Rev 1:253–60
Alison MR, Islam S, Lim S (2009) Stem cells in liver regeneration, fibrosis and cancer: the good, the bad and the ugly. J Pathol 217:282–298
Allen MP, Tildersley DJ (1987) Computer simulation of liquids. Oxford Science, Oxford
Allen JW, Bhatia SN (2003) Formation of steady-state oxygen gradients in vitro: application to liver zonation. Biotechnol Bioeng 82:253–262
Allen JW, Khetani SR, Bhatia SN (2005) In vitro zonation and toxicity in a hepatocyte bioreactor. Toxicol Sci 84:110–119
Almeida CA, Martin AM, Nolan D, Lucas A, Cameron PU, James I, Phillips E, Mallal S (2008) Cytokine profiling in abacavir hypersensitivity patients. Antivir Ther 13:281–288
Alpini G, Phillips JO, Vroman B, Larusso NF (1994) Recent advances in the isolation of liver cells. Hepatology 20:494–514
Alpini G, Glaser S, Baiocchi L, Francis H, Xia X, Lesage G (2005) Secretin activation of the apical Na + -dependent bile acid transporter is associated with cholehepatic shunting in rats. Hepatology 41:1037–1045
Alvarez-Sanchez R, Montavon F, Hartung T, Pahler A (2006) Thiazolidinedione bioactivation: a comparison of the bioactivation potentials of troglitazone, rosiglitazone, and pioglitazone using stable isotope-labeled analogues and liquid chromatography tandem mass spectrometry. Chem Res Toxicol 19:1106–1116
Aly HA, Domenech O (2009) Cytotoxicity and mitochondrial dysfunction of 2,3,7,8-tetrachlorodibenzo-p-dioxin (TCDD) in isolated rat hepatocytes. Toxicol Lett 191:79–87
Aly HH, Oshiumi H, Shime H, Matsumoto M, Wakita T, Shimotohno K, Seya T (2011) Development of mouse hepatocyte lines permissive for hepatitis C virus (HCV). PLoS One 6:e21284
Amacher DE (2012) The primary role of hepatic metabolism in idiosyncratic drug-induced liver injury. Expert Opin Drug Metab Toxicol 8:335–347
Amann T, Maegdefrau U, Hartmann A, Agaimy A, Marienhagen J, Weiss TS, Stoeltzing O, Warnecke C, Scholmerich J, Oefner PJ, Kreutz M, Bosserhoff AK, Hellerbrand C (2009) GLUT1 expression is increased in hepatocellular carcinoma and promotes tumorigenesis. Am J Pathol 174:1544–1552
Ananthanarayanan M, Ng OC, Boyer JL, Suchy FJ (1994) Characterization of cloned rat liver Na(+)-bile acid cotransporter using peptide and fusion protein antibodies. Am J Physiol 267:G637–G643
Andersen ME, Birnbaum LS, Barton HA, Eklund CR (1997) Regional hepatic CYP1A1 and CYP1A2 induction with 2,3,7,8-tetrachlorodibenzo-p-dioxin evaluated with a multicompartment geometric model of hepatic zonation. Toxicol Appl Pharmacol 144:145–155
Anderson ARA, Chaplain MAJ, Rejniak KA (eds) (2007) Single-cell based models in biology and medicine. Birkhäuser, Basel, Switzerland
Andrade RJ, Lucena MI, Alonso A, Garcia-Cortes M, Garcia-Ruiz E, Benitez R, Fernandez MC, Pelaez G, Romero M, Corpas R, Duran JA, Jimenez M, Rodrigo L, Nogueras F, Martin-Vivaldi R, Navarro JM, Salmeron J, de la Cuesta FS, Hidalgo R (2004) HLA class II genotype influences the type of liver injury in drug-induced idiosyncratic liver disease. Hepatology 39:1603–1612
Andrade RJ, Agúndez JA, Lucena MI, Martínez C, Cueto R, García-Martín E (2009) Pharmacogenomics in drug induced liver injury. Curr Drug Metab 10(9):956–970
Andrews E, Armstrong M, Tugwood J, Swan D, Glaves P, Pirmohamed M, Aithal GP, Wright MC, Day CP, Daly AK (2010) A role for the pregnane X receptor in flucloxacillin-induced liver injury. Hepatology 51:1656–1664
Andrews E, Daly AK (2008) Flucloxacillin-induced liver injury. Toxicology 254:158–163
Angelin B, Bjorkhem I, Einarsson K, Ewerth S (1982) Hepatic uptake of bile acids in man. Fasting and postprandial concentrations of individual bile acids in portal venous and systemic blood serum. J Clin Invest 70:724–731
Angrish MM, Jones AD, Harkema JR, Zacharewski TR (2011) Aryl hydrocarbon receptor-mediated induction of Stearoyl-CoA desaturase 1 alters hepatic fatty acid composition in TCDD-elicited steatosis. Toxicol Sci 124(2):299–310
Aninat C, Piton A, Glaise D, le Charpentier T, Langouet S, Morel F, Guguen-Guillouzo C, Guillouzo A (2006) Expression of cytochromes P450, conjugating enzymes and nuclear receptors in human hepatoma HepaRG cells. Drug Metab Dispos 34:75–83
Antherieu S, Chesne C, Li R, Camus S, Lahoz A, Picazo L, Turpeinen M, Tolonen A, Uusitalo J, Guguen-Guillouzo C, Guillouzo A (2010) Stable expression, activity, and inducibility of cytochromes P450 in differentiated HepaRG cells. Drug Metab Dispos 38:516–525
Anzai N, Ichida K, Jutabha P, Kimura T, Babu E, Jin CJ, Srivastava S, Kitamura K, Hisatome I, Endou H, Sakurai H (2008) Plasma urate level is directly regulated by a voltage-driven urate efflux transporter URATv1 (SLC2A9) in humans. J Biol Chem 283:26834–26838
Aoyama K, Yoshinari K, Kim HJ, Nagata K, Yamazoe Y (2009) Simultaneous expression of plural forms of human cytochrome P450 at desired ratios in HepG2 cells: adenovirus-mediated tool for cytochrome P450 reconstitution. Drug Metab Pharmacokinet 24:209–217
Apte U, Thompson MD, Cui S, Liu B, Cieply B, Monga SP (2008) Wnt/beta-catenin signaling mediates oval cell response in rodents. Hepatology 47:288–295
Apte U, Zeng G, Thompson MD, Muller P, Micsenyi A, Cieply B, Kaestner KH, Monga SP (2007) beta-Catenin is critical for early postnatal liver growth. Am J Physiol Gastrointest Liver Physiol 292:G1578–G1585
Aravalli RN, Cressman EN, Steer CJ (2012) Hepatic differentiation of porcine induced pluripotent stem cells in vitro. Vet J
Archer S, Li TT, Evans AT, Britland ST, Morgan H (1999) Cell reactions to dielectrophoretic manipulation. Biochem Biophys Res Commun 257:687–698
Arikura J, Kobayashi N, Okitsu T, Noguchi H, Totsugawa T, Watanabe T, Matsumura T, Maruyama M, Kosaka Y, Tanaka N, Onodera K, Kasai S (2002) UW solution: a promising tool for cryopreservation of primarily isolated rat hepatocytes. J Hepatobiliary Pancreat Surg 9:742–749
Asgari S, Moslem M, Bagheri-lankarani K, Pournasr B, Miryounesi M, Baharvand H (2011) Differentiation and transplantation of human induced pluripotent stem cell-derived hepatocyte-like cells. stem cell rev
Ashby J, Brady A, Elcombe CR, Elliott BM, Ishmael J, Odum J, Tugwood JD, Kettle S, Purchase IF (1994) Mechanistically-based human hazard assessment of peroxisome proliferator-induced hepatocarcinogenesis. Hum Exp Toxicol 13(Suppl 2):S1–S117
Atzori L, Poli G, Perra A (2009) Hepatic stellate cell: a star cell in the liver. Int J Biochem Cell Biol 41:1639–1642
Au JS, Navarro VJ, Rossi S (2011) Review article: Drug-induced liver injury–its pathophysiology and evolving diagnostic tools. Aliment Pharmacol Ther 34:11–20
Auth MK, Okamoto M, Ishida Y, Keogh A, Auth SH, Gerlach J, Encke A, McMaster P, Strain AJ (1998) Maintained function of primary human hepatocytes by cellular interactions in coculture: implications for liver support systems. Transpl Int 11(Suppl 1):S439–S443
Aydinlik H, Nguyen TD, Moennikes O, Buchmann A, Schwarz M (2001) Selective pressure during tumor promotion by phenobarbital leads to clonal outgrowth of beta-catenin-mutated mouse liver tumors. Oncogene 20:7812–7816
Baba T, Touchi A, Ito K, Yamaguchi Y, Yamazoe Y, Ohno Y, Sugiyama Y (2002) Effects of serum albumin and liver cytosol on CYP2C9- and CYP3A4-mediated drug metabolism. Drug Metab Pharmacokinet 17:522–531
Baccarelli A, Giacomini SM, Corbetta C, Landi MT, Bonzini M, Consonni D, Grillo P, Patterson DG, Pesatori AC, Bertazzi PA (2008) Neonatal thyroid function in Seveso 25 years after maternal exposure to dioxin. PLoS Med 5:e161
Bachmann K, Byers J, Ghosh R (2003) Prediction of in vivo hepatic clearance from in vitro data using cryopreserved human hepatocytes. Xenobiotica 33:475–483
Bacon BR, O’grady JG, Di bisceglie AM, Lake JR (2006) Comprehensive clinical hepatology. Elsevier Health Sciences. ISBN:0-323-03675-9
Badagnani I, Castro RA, Taylor TR, Brett CM, Huang CC, Stryke D, Kawamoto M, Johns SJ, Ferrin TE, Carlson EJ, Burchard EG, Giacomini KM (2006) Interaction of methotrexate with organic-anion transporting polypeptide 1A2 and its genetic variants. J Pharmacol Exp Ther 318:521–529
Bader A, Knop E, Kern A, Boker K, Fruhauf N, Crome O, Esselmann H, Pape C, Kempka G, Sewing KF (1996) 3-D coculture of hepatic sinusoidal cells with primary hepatocytes-design of an organotypical model. Exp Cell Res 226:223–233
Badmann A, Keough A, Kaufmann T, Bouillet P, Brunner T, Corazza N (2011) Role of TRAIL and the pro-apoptotic Bcl-2 homolog Bim in acetaminophen-induced liver damage. Cell Death Dis 2:e171
Badolo L, Rasmussen LM, Hansen HR, Sveigaard C (2010) Screening of OATP1B1/3 and OCT1 inhibitors in cryopreserved hepatocytes in suspension. Eur J Pharm Sci 40:282–288
Badolo L, Trancart MM, Gustavsson L, Chesne C (2011) Effect of cryopreservation on the activity of OATP1B1/3 and OCT1 in isolated human hepatocytes. Chem Biol Interact 190:165–170
Bai J, Cederbaum AI (2004) Adenovirus mediated overexpression of CYP2E1 increases sensitivity of HepG2 cells to acetaminophen induced cytotoxicity. Mol Cell Biochem 262:165–176
Bain DL, Heneghan AF, Connaghan-Jones KD, Miura MT (2007) Nuclear receptor structure: implications for function. Annu Rev Physiol 69:201–20
Baines CP (2011) The mitochondrial permeability transition pore and the cardiac necrotic program. Pediatr Cardiol 32:258–262
Bajt ML, Cover C, Lemasters JJ, Jaeschke H (2006) Nuclear translocation of endonuclease G and apoptosis-inducing factor during acetaminophen-induced liver cell injury. Toxicol Sci 94:217–225
Bajt ML, Farhood A, Lemasters JJ, Jaeschke H (2008) Mitochondrial B\ax translocation accelerates DNA fragmentation and cell necrosis in a murine model of acetaminophen hepatotoxicity. J Pharmacol Exp Ther 324:8–14
Bajt ML, Knight TR, Lemasters JJ, Jaeschke H (2004) Acetaminophen-induced oxidant stress and cell injury in cultured mouse hepatocytes: protection by N-acetyl cysteine. Toxicol Sci 80:343–349
Baker M, Parton T (2007) Kinetic determinants of hepatic clearance: plasma protein binding and hepatic uptake. Xenobiotica 37:1110–34
Baker SD, Verweij J, Cusatis GA, van Schaik RH, Marsh S, Orwick SJ, Franke RM, Hu S, Schuetz EG, Lamba V, Messersmith WA, Wolff AC, Carducci MA, Sparreboom A (2009) Pharmacogenetic pathway analysis of docetaxel elimination. Clin Pharmacol Ther 85:155–163
Baker SJ, Markowitz S, Fearon ER, Willson JK, Vogelstein B (1990) Suppression of human colorectal carcinoma cell growth by wild-type p53. Science 249:912–915
Baker TK, Carfagna MA, Gao H, Dow ER, Li Q, Searfoss GH, Ryan TP (2001) Temporal gene expression analysis of monolayer cultured rat hepatocytes. Chem Res Toxicol 14:1218–1231
Baker TK, Kwiatkowski AP, Madhukar BV, Klaunig JE (1995) Inhibition of gap junctional intercellular communication by 2,3,7,8-tetrachlorodibenzo-p-dioxin (TCDD) in rat hepatocytes. Carcinogenesis 16:2321–2326
Bakker J, Lin X, Nelson WG (2002) Methyl-CpG binding domain protein 2 represses transcription from hypermethylated pi-class glutathione S-transferase gene promoters in hepatocellular carcinoma cells. J Biol Chem 277:22573–22580
Ballestero MR, Monte MJ, Briz O, Jimenez F, Gonzalez-San Martin F, Marin JJ (2006) Expression of transporters potentially involved in the targeting of cytostatic bile acid derivatives to colon cancer and polyps. Biochem Pharmacol 72:729–738
Banks AT, Zimmerman HJ, Ishak KG, Harter JG (1995) Diclofenac-associated hepatotoxicity: analysis of 180 cases reported to the Food and Drug Administration as adverse reactions. Hepatology 22(3):820–827
Bankey PE, Hill S, Geldon D (1994) Sequential insult enhances liver macrophage-signaled hepatocyte dysfunction. J Surg Res 57:185–191
Bannister AJ, Zegerman P, Partridge JF, Miska EA, Thomas JO, Allshire RC, Kouzarides T (2001) Selective recognition of methylated lysine 9 on histone H3 by the HP1 chromo domain. Nature 410:120–124
Bao J, Shi Y, Sun H, Yin X, Yang R, Li L, Chen X, Bu H (2011) Construction of a portal implantable functional tissue-engineered liver using perfusion-decellularized matrix and hepatocytes in rats. Cell Transpl 20:753–766
Barbetta A, Massimi M, di Rosario B, Nardecchia S, de Colli M, Devirgiliis LC, Dentini M (2008) Emulsion templated scaffolds that include gelatin and glycosaminoglycans. Biomacromolecules 9:2844–2856
Barbier O, Torra IP, Sirvent A, Claudel T, Blanquart C, Duran-Sandoval D, Kuipers F, Kosykh V, Fruchart JC, Staels B (2003) FXR induces the UGT2B4 enzyme in hepatocytes: a potential mechanism of negative feedback control of FXR activity. Gastroenterology 124:1926–1940
Barcelo S, Mace K, Pfeifer AM, Chipman JK (1998) Production of DNA strand breaks by N-nitrosodimethylamine and 2-amino-3-methylimidazo[4,5-f]quinoline in THLE cells expressing human CYP isoenzymes and inhibition by sulforaphane. Mutat Res 402:111–120
Baribault H, Marceau N (1986) Dexamethasone and dimethylsulfoxide as distinct regulators of growth and differentiation of cultured suckling rat hepatocytes. J Cell Physiol 129:77–84
Barker N, Clevers H (2000) Catenins, Wnt signaling and cancer. Bioessays 22:961–965
Bartel DP (2004) MicroRNAs: genomics, biogenesis, mechanism, and function. Cell 116:281–297
Bartel DP, Chen CZ (2004) Micromanagers of gene expression: the potentially widespread influence of metazoan microRNAs. Nat Rev Genet 5:396–400
Bartel T, Holzhütter HG (1990) Mathematical modelling of the purine metabolism of the rat liver. Biochim Biophys Acta 1035:331–339
Barter ZE, Bayliss MK, Beaune PH, Boobis AR, Carlile DJ, Edwards RJ, Houston JB, Lake BG, Lipscomb JC, Pelkonen OR, Tucker GT, Rostami-Hodjegan A (2007) Scaling factors for the extrapolation of in vivo metabolic drug clearance from in vitro data: reaching a consensus on values of human microsomal protein and hepatocellularity per gram of liver. Curr Drug Metab 8:33–45
Bartles JR, Feracci HM, Stieger B, Hubbard AL (1987) Biogenesis of the rat hepatocyte plasma membrane in vivo: comparison of the pathways taken by apical and basolateral proteins using subcellular fractionation. J Cell Biol 105:1241–1251
Basma H, Soto-Gutierrez A, Yannam GR, Liu L, Ito R, Yamamoto T, Ellis E, Carson SD, Sato S, Chen Y, Muirhead D, Navarro-Alvarez N, Wong RJ, Roy-Chowdhury J, Platt JL, Mercer DF, Miller JD, Strom SC, Kobayashi N, Fox IJ (2009) Differentiation and transplantation of human embryonic stem cell-derived hepatocytes. Gastroenterology 136:990–999
Bataller R, Brenner DA (2005) Liver fibrosis. J Clin Invest 115:209–218
Batty N, Malouf GG, Issa JP (2009) Histone deacetylase inhibitors as anti-neoplastic agents. Cancer Lett 280:192–200
Bauer D, Wolfram N, Kahl GF, Hirsch-Ernst KI (2004) Transcriptional regulation of CYP2B1 induction in primary rat hepatocyte cultures: repression by epidermal growth factor is mediated via a distal enhancer region. Mol Pharmacol 65:172–180
Bauman JW, Goldsworthy TL, Dunn CS, Fox TR (1995) Inhibitory effects of 2,3,7,8-tetrachlorodibenzo-p-dioxin on rat hepatocyte proliferation induced by 2/3 partial hepatectomy. Cell Prolif 28:437–451
Bautista AP, Spolarics Z, Jaeschke H, Smith CW, Spitzer JJ (1994) Antineutrophil monoclonal antibody (1F12) alters superoxide anion release by neutrophils and Kupffer cells. J Leukoc Biol 55:328–335
Baverel G, Renault S, Faiz H, el Hage M, Gauthier C, Duplany A, Ferrier B, Martin G (2011) Protocols and applications of cellular metabolomics in safety studies using precision-cut tissue slices and carbon 13 NMR. Humana Press, Totowa
Baxter MA, Rowe C, Alder J, Harrison S, Hanley KP, Park BK, Kitteringham NR, Goldring CE, Hanley NA (2010) Generating hepatic cell lineages from pluripotent stem cells for drug toxicity screening. Stem Cell Res 5:4–22
Beard DA, Qian H (2005) Thermodynamic-based computational profiling of cellular regulatory control in hepatocyte metabolism. Am J Physiol Endocrinol Metab 288:E633–E644
Beck NB, Sidhu JS, Omiecinski CJ (2000) Baculovirus vectors repress phenobarbital-mediated gene induction and stimulate cytokine expression in primary cultures of rat hepatocytes. Gene Ther 7:1274–1283
Becker S, Reinehr R, Graf D, Vom DAHLS, Häussinger D (2007) Hydrophobic bile salts induce hepatocyte shrinkage via NADPH oxidase activation. Cell Physiol Biochem 19(1–4):89–98
Beekman JM, Boess F, Hildebrand H, Kalkuhl A, Suter L (2006) Gene expression analysis of the hepatotoxicant methapyrilene in primary rat hepatocytes: an interlaboratory study. Environ Health Perspect 114:92–99
Beerheide W, von Mach MA, Ringel M, Fleckenstein C, Schumann S, Renzing N, Hildebrandt A, Brenner W, Jensen O, Gebhard S, Reifenberg K, Bender J, Oesch F, Hengstler JG (2002) Downregulation of beta2-microglobulin in human cord blood somatic stem cells after transplantation into livers of SCID-mice: an escape mechanism of stem cells? Biochem Biophys Res Commun 294:1052–1063
Begue JM, Guguen-Guillouzo C, Pasdeloup N, Guillouzo A (1984) Prolonged maintenance of active cytochrome P-450 in adult rat hepatocytes co-cultured with another liver cell type. Hepatology 4:839–842
Behre J, Wilhelm T, von Kamp A, Ruppin E, Schuster S (2008) Structural robustness of metabolic networks with respect to multiple knockouts. J Theor Biol 252:433–441
Beigel J, Fella K, Kramer PJ, Kroeger M, Hewitt P (2008) Genomics and proteomics analysis of cultured primary rat hepatocytes. Toxicol In Vitro 22:171–181
Belzer FO, Kalayoglu M, D’Alessandro AM, Pirsch JD, Sollinger HW, Hoffmann R, Boudjema K, Southard JH (1990) Organ preservation: experience with University of Wisconsin solution and plans for the future. Clin Transpl 4:73–77
Benhamouche S, Decaens T, Godard C, Chambrey R, Rickman DS, Moinard C, Vasseur-Cognet M, Kuo CJ, Kahn A, Perret C, Colnot S (2006) Apc tumor suppressor gene is the “zonation-keeper” of mouse liver. Dev Cell 10:759–770
Beraza N, Ludde T, Assmus U, Roskams T, Vander borght S, Trautwein C (2007) Hepatocyte-specific IKK gamma/NEMO expression determines the degree of liver injury. Gastroenterology 132:2504–2517
Berendsen TA, Izamis ML, Xu H, Liu Q, Hertl M, Berthiaume F, Yarmush ML, Uygun K (2011) Hepatocyte viability and adenosine triphosphate content decrease linearly over time during conventional cold storage of rat liver grafts. Transpl Proc 43:1484–1488
Bergwerk AJ, Shi X, Ford AC, Kanai N, Jacquemin E, Burk RD, Bai S, Novikoff PM, Stieger B, Meier PJ, Schuster VL, Wolkoff AW (1996) Immunologic distribution of an organic anion transport protein in rat liver and kidney. Am J Physiol 271:G231–G238
Berke G (1995) The CTL’s kiss of death. Cell 81:9–12
Berry MN, Friend DS (1969) High-yield preparation of isolated rat liver parenchymal cells: a biochemical and fine structural study. J Cell Biol 43:506–520
Berry MN, Grivell AR, Grivell MB, Phillips JW (1997) Isolated hepatocytes–past, present and future. Cell Biol Toxicol 13:223–233
Berthiaume F, Moghe PV, Toner M, Yarmush ML (1996) Effect of extracellular matrix topology on cell structure, function, and physiological responsiveness: hepatocytes cultured in a sandwich configuration. Faseb J 10:1471–484
Bessems M, t’ Hart NA, Tolba R, Doorschodt BM, Leuvenink HG, Ploeg RJ, Minor T, Vangulik TM (2006) The isolated perfused rat liver: standardization of a time-honoured model. Lab Anim 40:236–246
Bezerra JA, Balistreri WF (2000) The unique nature of the pediatric liver. Clin Liver Dis 4:xi–xv
Bhalla S, Ozalp C, Fang S, Xiang L, Kemper JK (2004) Ligand-activated pregnane X receptor interferes with HNF-4 signaling by targeting a common coactivator PGC-1alpha. Functional implications in hepatic cholesterol and glucose metabolism. J Biol Chem 279:45139–45147
Bhandari RN, Riccalton LA, Lewis AL, Fry JR, Hammond AH, Tendler SJ, Shakesheff KM (2001) Liver tissue engineering: a role for co-culture systems in modifying hepatocyte function and viability. Tissue Eng 7:345–357
Bharadwaj M, Illing P, Theodossis A, Purcell AW, Rossjohn J, McCluskey J (2012) Drug hypersensitivity and human leukocyte antigens of the major histocompatibility complex. Annu Rev Pharmacol Toxicol 52:401–431
Bhatia SN, Balis UJ, Yarmush ML, Toner M (1999) Effect of cell-cell interactions in preservation of cellular phenotype: cocultivation of hepatocytes and nonparenchymal cells. Faseb J 13:1883–900
Bhogal RH, Hodson J, Bartlett DC, Weston CJ, Curbishley SM, Haughton E, Williams KT, Reynolds GM, Newsome PN, Adams DH, Afford SC (2011) Isolation of primary human hepatocytes from normal and diseased liver tissue: a one hundred liver experience. PLoS One 6:e18222
Bi YA, Kazolias D, Duignan DB (2006) Use of cryopreserved human hepatocytes in sandwich culture to measure hepatobiliary transport. Drug Metab Dispos 34:1658–1665
Billiar TR, Curran RD, Stuehr DJ, West MA, Bentz BG, Simmons RL (1989) An L-arginine-dependent mechanism mediates Kupffer cell inhibition of hepatocyte protein synthesis in vitro. J Exp Med 169:1467–1472
Billiar TR, Curran RD, Ferrari FK, Williams DL, Simmons RL (1990) Kupffer cell:hepatocyte cocultures release nitric oxide in response to bacterial endotoxin. J Surg Res 48:349–353
Billiar TR, Lysz TW, Curran RD, Bentz BG, Machiedo GW, Simmons RL (1990) Hepatocyte modulation of Kupffer cell prostaglandin E2 production in vitro. J Leukoc Biol 47:305–311
Billiar TR, Curran RD, Williams DL, Kispert PH (1992) Liver nonparenchymal cells are stimulated to provide interleukin 6 for induction of the hepatic acute-phase response in endotoxemia but not in remote localized inflammation. Arch Surg 127:31–36; discussion 36–37
Bissell DM, Arenson DM, Maher JJ, Roll FJ (1987) Support of cultured hepatocytes by a laminin-rich gel. Evidence for a functionally significant subendothelial matrix in normal rat liver. J Clin Invest 79:801–812
Björnsson E (2008) Hepatotoxicity associated with antiepileptic drugs. Acta Neurol Scand 118:281–290
Björnsson E, Olsson R (2005) Outcome and prognostic markers in severe drug-induced liver disease. Hepatology 42:481–489
Björnsson E, Jacobsen EI, Kalaitzakis E (2012) Hepatotoxicity associated with statins: reports of idiosyncratic liver injury post-marketing. J Hepatol 56(2):374–380
Black MB, Budinsky RA, Dombkowski A, Cukovic D, Lecluyse EL, Ferguson SS, Thomas RS, Rowlands JC (2012) Cross-species comparisons of transcriptomic alterations in human and rat primary hepatocytes exposed to 2,3,7,8-tetrachlorodibenzo-p-dioxin. Toxicol Sci 127:199–215
Blanchard N, Alexandre E, Abadie C, Lave T, Heyd B, Mantion G, Jaeck D, Richert L, Coassolo P (2005) Comparison of clearance predictions using primary cultures and suspensions of human hepatocytes. Xenobiotica 35:1–15
Blanchard N, Hewitt NJ, Silber P, Jones H, Coassolo P, Lave T (2006) Prediction of hepatic clearance using cryopreserved human hepatocytes: a comparison of serum and serum-free incubations. J Pharm Pharmacol 58:633–641
Blanchard N, Richert L, Notter B, Delobel F, David P, Coassolo P, Lave T (2004) Impact of serum on clearance predictions obtained from suspensions and primary cultures of rat hepatocytes. Eur J Pharm Sci 23:189–199
Bleibel W, Kim S, D’Silva K, Lemmer ER (2007) Drug-induced liver injury: review article. Dig Dis Sci 52:2463–2471
Block GD, Locker J, Bowen WC, Petersen BE, Katyal S, Strom SC, Riley T, Howard TA, Michalopoulos GK (1996) Population expansion, clonal growth, and specific differentiation patterns in primary cultures of hepatocytes induced by HGF/SF, EGF and TGF alpha in a chemically defined (HGM) medium. J Cell Biol 132:1133–1149
Block M, Scholl E, Drasdo D (2007) Classifying the expansion kinetics and critical surface dynamics of growing cell populations. Phys Rev Lett 99:248101
Bode JG (2011) Inflammation and liver regeneration. In: Häussinger D (ed) Liver regneration. DeGruyter Verlag, Berlin
Bode JG, Albrecht U, Häussinger D, Heinrich PC, Schaper F (2011) Hepatic acute phase proteins–regulation by IL-6- and IL-1-type cytokines involving STAT3 and its crosstalk with NF-kappaB-dependent signaling. Eur J Cell Biol 91:496–505
Bode JG, Heinrich PC (2001) Interleukin-6 signaling during the acute-phase response of the liver. In: Arias IM, Boyer JL, Chisari FV, Fausto N, Schachter D, Shafritz DA (eds) The liver: biology and pathobiology, 4th edn. Lippincott Williams Wilkins, Philadelphia, pp 565–580
Boelsterli UA (2003) Idiosyncratic drug hepatotoxicity revisited: new insights from mechanistic toxicology. Toxicol Mech Methods 13:3–20
Boess F, Kamber M, Romer S, Gasser R, Muller D, Albertini S, Suter L (2003) Gene expression in two hepatic cell lines, cultured primary hepatocytes, and liver slices compared to the in vivo liver gene expression in rats: possible implications for toxicogenomics use of in vitro systems. Toxicol Sci 73:386–402
Boffetta P, Mundt KA, Adami HO, Cole P, Mandel JS (2011) TCDD and cancer: a critical review of epidemiologic studies. Crit Rev Toxicol 41:622–636
Bohme M, Muller M, Leier I, Jedlitschky G, Keppler D (1994) Cholestasis caused by inhibition of the adenosine triphosphate-dependent bile salt transport in rat liver. Gastroenterology 107:255–265
Boini KM, Graf D, Hennige AM, Koka S, Kempe DS, Wang K, Ackermann TF, Foller M, Vallon V, Pfeifer K, Schleicher E, Ullrich S, Haring HU, Häussinger D, Lang F (2009) Enhanced insulin sensitivity of gene-targeted mice lacking functional KCNQ1. Am J Physiol Regul Integr Comp Physiol 296:R1695–R1701
Boini KM, Graf D, Kuhl D, Häussinger D, Lang F (2009) SGK1 dependence of insulin induced hypokalemia. Pflugers Arch 457:955–961
Bojar H, Basler M, Fuchs F, Dreyfurst R, Staib W, Broelsch C (1976) Preparation of parenchymal and non-parenchymal cells from adult human liver–morphological and biochemical characteristics. J Clin Chem Clin Biochem 14:527–532
Bokhari M, Carnachan RJ, Cameron NR, Przyborski SA (2007) Novel cell culture device enabling three-dimensional cell growth and improved cell function. Biochem Biophys Res Commun 354:1095–1100
Bokhari M, Carnachan RJ, Cameron NR, Przyborski SA (2007) Culture of HepG2 liver cells on three dimensional polystyrene scaffolds enhances cell structure and function during toxicological challenge. J Anat 211:567–576
Bolleyn J, Fraczek J, Vinken M, Lizarraga D, Gaj S, van Delft JH, Rogiers V, Vanhaecke T (2011) Effect of Trichostatin A on miRNA expression in cultures of primary rat hepatocytes. Toxicol In Vitro 25:1173–1182
Bonasio R, Tu S, Reinberg D (2010) Molecular signals of epigenetic states. Science 330:612–616
Borgius LJ, Steffensen KR, Gustafsson JA, Treuter E (2002) Glucocorticoid signaling is perturbed by the atypical orphan receptor and corepressor SHP. J Biol Chem 277:49761–49766
Borlak J, Klutcka T (2004) Expression of basolateral and canalicular transporters in rat liver and cultures of primary hepatocytes. Xenobiotica 34:935–947
Borner C (2003) The Bcl-2 protein family: sensors and checkpoints for life-or-death decisions. Mol Immunol 39:615–647
Borst P, de Wolf C, van de Wetering K (2007) Multidrug resistance-associated proteins 3, 4, and 5. Pflugers Arch 453:661–673
Bort R, Mace K, Boobis A, Gomez-Lechon MJ, Pfeifer A, Castell J (1999) Hepatic metabolism of diclofenac: role of human CYP in the minor oxidative pathways. Biochem Pharmacol 58:787–796
Bosserhoff A, Hellerbrand C (2011) Obesity and fatty liver are ‘grease’ for the machinery of hepatic fibrosis. Dig Dis 29:377–83
Botham KM, Fresnedo O, Romero JR, Ochoa B (1998) Zonal distribution of chylomicron remnant uptake in rat liver parenchymal cells. Gen Physiol Biophys 17:79–94
Bourdi M, Masubuchi Y, Reilly TP, Amouzadeh HR, Martin JL, George JW, Shah AG, Pohl LR (2002) Protection against acetaminophen-induced liver injury and lethality by interleukin 10: role of inducible nitric oxide synthase. Hepatology 35:289–298
Bouwens L, Baekeland M, de Zanger R, Wisse E (1986) Quantitation, tissue distribution and proliferation kinetics of Kupffer cells in normal rat liver. Hepatology 6:718–722
Boyce FM, Bucher NL (1996) Baculovirus-mediated gene transfer into mammalian cells. Proc Natl Acad Sci USA 93:2348–2352
Boyer JL, Graf J, Meier PJ (1992) Hepatic transport systems regulating pHi, cell volume, and bile secretion. Annu Rev Physiol 54:415–438
Braakman I, Groothuis GM, Meijer DK (1987) Acinar redistribution and heterogeneity in transport of the organic cation rhodamine B in rat liver. Hepatology 7(5):849–855
Braeuning A (2009) Regulation of cytochrome P450 expression by Ras- and beta-catenin-dependent signaling. Curr Drug Metab 10:138–158
Braeuning A (2012) Interplay of β-catenin with xenobiotic-sensing receptors and its role in glutathione S-transferase expression. Curr Drug Metab 13(2):203–214
Braeuning A, Buchmann A (2009) The glycogen synthase kinase inhibitor 3-(2,4-dichlorophenyl)-4-(1-methyl-1H-indol-3-yl)-1H-pyrrole-2,5-dione (SB216763) is a partial agonist of the aryl hydrocarbon receptor. Drug Metab Dispos 37:1576–1580
Braeuning A, Schwarz M (2010) Zonation of heme synthesis enzymes in mouse liver and their regulation by beta-catenin and Ha-ras. Biol Chem 391:1305–1313
Braeuning A, Schwarz M (2010) Beta-Catenin as a multilayer modulator of zonal cytochrome P450 expression in mouse liver. Biol Chem 391:139–148
Braeuning A, Ittrich C, Kohle C, Hailfinger S, Bonin M, Buchmann A, Schwarz M (2006) Differential gene expression in periportal and perivenous mouse hepatocytes. Febs J 273:5051–5061
Braeuning A, Ittrich C, Kohle C, Buchmann A, Schwarz M (2007) Zonal gene expression in mouse liver resembles expression patterns of Ha-ras and beta-catenin mutated hepatomas. Drug Metab Dispos 35:503–507
Braeuning A, Menzel M, Kleinschnitz EM, Harada N, Tamai Y, Kohle C, Buchmann A, Schwarz M (2007) Serum components and activated Ha-ras antagonize expression of perivenous marker genes stimulated by beta-catenin signaling in mouse hepatocytes. Febs J 274:4766–4777
Braeuning A, Sanna R, Huelsken J, Schwarz M (2009) Inducibility of drug-metabolizing enzymes by xenobiotics in mice with liver-specific knockout of Ctnnb1. Drug Metab Dispos 37:1138–1145
Braeuning A, Singh Y, Rignall B, Buchmann A, Hammad S, Othman A, von Recklinghausen I, Godoy P, Hoehme S, Drasdo D, Hengstler JG, Schwarz M (2010) Phenotype and growth behavior of residual beta-catenin-positive hepatocytes in livers of beta-catenin-deficient mice. Histochem Cell Biol 134:469–481
Braeuning A, Kohle C, Buchmann A, Schwarz M (2011) Coordinate regulation of cytochrome P450 1a1 expression in mouse liver by the aryl hydrocarbon receptor and the beta-catenin pathway. Toxicol Sci 122:16–25
Braissant O, Foufelle F, Scotto C, Dauca M, Wahli W (1996) Differential expression of peroxisome proliferator-activated receptors (PPARs): tissue distribution of PPAR-alpha, -beta, and -gamma in the adult rat. Endocrinology 137:354–366
Braiterman LT, Hubbard AL (2009) Hepatocyte surface polarity: its dynamic maintenance and establishment. In: The liver. Wiley, New York, pp 73–105
Braspenning J, Holder S, Kuepper H (2010) Propagation of primary cells and use thereof. Patent EP2185690, 05–19
Braumann UD, Kuska JP (2006) A new equation for nonlinear image registration with control over the vortex structure in the displacement field. In: Proceedings of the IEEE international conference on image processing. IEEE Signal Processing Society, pp 329–332
Brendel K, Fisher RL, Krumdieck CL, Gandolfi AJ (1990) Precision-cut rat liver slices in dynamic organ culture for structure-toxicity studies. J Am Coll Toxicol 9:621
Brendel C, Schoonjans K, Botrugno OA, Treuter E, Auwerx J (2002) The small heterodimer partner interacts with the liver X receptor alpha and represses its transcriptional activity. Mol Endocrinol 16:2065–2076
Briz O, Serrano MA, Macias RI, Gonzalez-Gallego J, Marin JJ (2003) Role of organic anion-transporting polypeptides, OATP-A, OATP-C and OATP-8, in the human placenta-maternal liver tandem excretory pathway for foetal bilirubin. Biochem J 371:897–905
Bronger H, Konig J, Kopplow K, Steiner HH, Ahmadi R, Herold-Mende C, Keppler D, Nies AT (2005) ABCC drug efflux pumps and organic anion uptake transporters in human gliomas and the blood-tumor barrier. Cancer Res 65:11419–11428
Brophy CM, Luebke-Wheeler JL, Amiot BP, Khan H, Remmel RP, Rinaldo P, Nyberg SL (2009) Rat hepatocyte spheroids formed by rocked technique maintain differentiated hepatocyte gene expression and function. Hepatology 49:578–586
Broughan TA, Naukam R, Tan C, van de Wiele CJ, Refai H, Teague TK (2008) Effects of hepatic zonal oxygen levels on hepatocyte stress responses. J Surg Res 145:150–160
Brown HS, Griffin M, Houston JB (2007) Evaluation of cryopreserved human hepatocytes as an alternative in vitro system to microsomes for the prediction of metabolic clearance. Drug Metab Dispos 35:293–301
Brown HS, Ito K, Galetin A, Houston JB (2005) Prediction of in vivo drug-drug interactions from in vitro data: impact of incorporating parallel pathways of drug elimination and inhibitor absorption rate constant. Br J Clin Pharmacol 60:508–518
Brown ME, Rondon E, Rajesh D, Mack A, Lewis R, Feng X, Zitur LJ, Learish RD, Nuwaysir EF (2010) Derivation of induced pluripotent stem cells from human peripheral blood T lymphocytes. PLoS One 5:e11373
Brun P, Castagliuolo I, Pinzani M, Palu G, Martines D (2005) Exposure to bacterial cell wall products triggers an inflammatory phenotype in hepatic stellate cells. Am J Physiol Gastrointest Liver Physiol 289:G571–G578
Brunham LR, Kruit JK, Pape TD, Parks JS, Kuipers F, Hayden MR (2006) Tissue-specific induction of intestinal ABCA1 expression with a liver X receptor agonist raises plasma HDL cholesterol levels. Circ Res 99:672–674
Brunnberg S, Andersson P, Lindstam M, Paulson I, Poellinger L, Hanberg A (2006) The constitutively active Ah receptor (CA-Ahr) mouse as a potential model for dioxin exposure–effects in vital organs. Toxicology 224:191–201
Bücher T, Sies H (1976) Mitochondrial and cytosolic redox states in perfused rat liver: methods and problems in metabolic compartmentation. In: Tager jm WJ, Söling D (eds) Use of isolated liver cells and kidney tubules in metabolic studies. North Holland Publishing Company/American Elsevier, New York/Amsterdam
Buchmann A, Schwarz M, Schmitt R, Wolf CR, Oesch F, Kunz W (1987) Development of cytochrome P-450-altered preneoplastic and neoplastic lesions during nitrosamine-induced hepatocarcinogenesis in the rat. Cancer Res 47:2911–2918
Buchmann A, Stinchcombe S, Korner W, Hagenmaier H, Bock KW (1994) Effects of 2,3,7,8-tetrachloro- and 1,2,3,4,6,7,8-heptachlorodibenzo-p-dioxin on the proliferation of preneoplastic liver cells in the rat. Carcinogenesis 15:1143–1150
Buchweitz JP, Ganey PE, Bursian SJ, Roth RA (2002) Underlying endotoxemia augments toxic responses to chlorpromazine: is there a relationship to drug idiosyncrasy? J Pharmacol Exp Ther 300:460–467
Budinsky RA, Lecluyse EL, Ferguson SS, Rowlands JC, Simon T (2010) Human and rat primary hepatocyte CYP1A1 and 1A2 induction with 2,3,7,8-tetrachlorodibenzo-p-dioxin, 2,3,7,8-tetrachlorodibenzofuran, and 2,3,4,7,8-pentachlorodibenzofuran. Toxicol Sci 118:224–235
Budinsky RA, Paustenbach D, Fontaine D, Landenberger B, Starr TB (2006) Recommended relative potency factors for 2,3,4,7,8-pentachlorodibenzofuran: the impact of different dose metrics. Toxicol Sci 91:275–285
Budinsky RA, Schrenk D, Simon T, Van den Berg M, Maier A, Silkworth JB, Aylward L, Brix A, Gasiewicz T, Kaminski N, Perdew G, Starr TB, Walker NJ, Rowlands JC (2012) Mode of action and dose-response framework analysis for receptor-mediated toxicity: the aryl hydrocarbon receptor as a case study. Crit Rev Toxicol (in press)
Buffler PA, Ginevan ME, Mandel JS, Watkins DK (2011) The Air Force health study: an epidemiologic retrospective. Ann Epidemiol 21:673–687
Bulera SJ, Haas MJ, Sattler CA, Li Y, Pitot HC (1997) Cell lines with heterogeneous phenotypes result from a single isolation of albumin-sv40 T-antigen transgenic rat hepatocytes. Hepatology 25:1192–1203
Burckhardt G, Burckhardt BC (2011) In vitro and in vivo evidence of the importance of organic anion transporters (OATs) in drug therapy. Springer, Berlin
Burczynski FJ, Wang GQ, Elmadhoun B, She YM, Roberts MS, Standing KG (2001) Hepatocyte [3H]-palmitate uptake: effect of albumin surface charge modification. Can J Physiol Pharmacol 79:868–875
Burger HJ, Gebhardt R, Mayer C, Mecke D (1989) Different capacities for amino acid transport in periportal and perivenous hepatocytes isolated by digitonin/collagenase perfusion. Hepatology 9:22–28
Burk O, Arnold KA, Geick A, Tegude H, Eichelbaum M (2005) A role for constitutive androstane receptor in the regulation of human intestinal MDR1 expression. Biol Chem 386:503–513
Burkard A, Dahn C, Heinz S, Zutavern A, Sonntag-Buck V, Maltman D, Przyborski S, Hewitt NJ, Braspenning J (2012) Generation of proliferating human hepatocytes using upcyte((R)) technology: characterisation and applications in induction and cytotoxicity assays. Xenobiotica
Burke AS, Macmillan-Crow LA, Hinson JA (2010) Reactive nitrogen species in acetaminophen-induced mitochondrial damage and toxicity in mouse hepatocytes. Chem Res Toxicol 23:1286–1292
Burke ZD, Tosh D (2006) The Wnt/beta-catenin pathway: master regulator of liver zonation? Bioessays 28:1072–1077
Burns KA, Vanden Heuvel JP (2007) Modulation of PPAR activity via phosphorylation. Biochim Biophys Acta 1771:952–60
Bursch W, Chabicovsky M, Wastl U, Grasl-Kraupp B, Bukowska K, Taper H, Schulte-Hermann R (2005) Apoptosis in stages of mouse hepatocarcinogenesis: failure to counterbalance cell proliferation and to account for strain differences in tumor susceptibility. Toxicol Sci 85:515–529
Cai J, Zhao Y, Liu Y, Ye F, Song Z, Qin H, Meng S, Chen Y, Zhou R, Song X, Guo Y, Ding M, Deng H (2007) Directed differentiation of human embryonic stem cells into functional hepatic cells. Hepatology 45:1229–1239
Cailhier JF, Partolina M, Vuthoori S, Wu S, Ko K, Watson S, Savill J, Hughes J, Lang RA (2005) Conditional macrophage ablation demonstrates that resident macrophages initiate acute peritoneal inflammation. J Immunol 174:2336–2342
Caja L, Ortiz C, Bertran E, Murillo MM, Miro-Obradors MJ, Palacios E, Fabregat I (2007) Differential intracellular signalling induced by TGF-beta in rat adult hepatocytes and hepatoma cells: implications in liver carcinogenesis. Cell Signal 19:683–694
Calkin AC, Tontonoz P (2012) Transcriptional integration of metabolism by the nuclear sterol-activated receptors LXR and FXR. Nat Rev Mol Cell Biol 13:213–224
Calmus Y, Guechot J, Podevin P, Bonnefis MT, Giboudeau J, Poupon R (1992) Differential effects of chenodeoxycholic and ursodeoxycholic acids on interleukin 1, interleukin 6 and tumor necrosis factor-alpha production by monocytes. Hepatology 16:719–723
Campbell MJ, Adorini L (2006) The vitamin D receptor as a therapeutic target. Expert Opin Ther Targets 10:735–748
Campion SN, Johnson R, Aleksunes LM, Goedken MJ, van Rooijen N, Scheffer GL, Cherrington NJ, Manautou JE (2008) Hepatic Mrp4 induction following acetaminophen exposure is dependent on Kupffer cell function. Am J Physiol Gastrointest Liver Physiol 295:G294–G304
Canaple L, Nurdin N, Angelova N, Saugy D, Hunkeler D, Desvergne B (2001) Maintenance of primary murine hepatocyte functions in multicomponent polymer capsules–in vitro cryopreservation studies. J Hepatol 34:11–18
Cancado EL, Leitao RM, Carrilho FJ, Laudanna AA (1998) Unexpected clinical remission of cholestasis after rifampicin therapy in patients with normal or slightly increased levels of gamma-glutamyl transpeptidase. Am J Gastroenterol 93:1510–1517
Cantore M, Reinehr R, Sommerfeld A, Becker M, Häussinger D (2011) The Src family kinase Fyn mediates hyperosmolarity-induced Mrp2 and Bsep retrieval from canalicular membrane. J Biol Chem 286:45014–45029
Cardier JE, Schulte T, Kammer H, Kwak J, Cardier M (1999) Fas (CD95, APO-1) antigen expression and function in murine liver endothelial cells: implications for the regulation of apoptosis in liver endothelial cells. Faseb J 13:1950–1960
Carey MA, van Pelt FN (2005) Immunochemical detection of flucloxacillin adduct formation in livers of treated rats. Toxicology 216:41–48
Carlson EA, McCulloch C, Koganti A, Goodwin SB, Sutter TR, Silkworth JB (2009) Divergent transcriptomic responses to aryl hydrocarbon receptor agonists between rat and human primary hepatocytes. Toxicol Sci 112:257–272
Carmo H, Hengstler JG, de Boer D, Ringel M, Remiao F, Carvalho F, Fernandes E, dos Reys LA, Oesch F, de Lourdes Bastos M (2005) Metabolic pathways of 4-bromo-2,5-dimethoxyphenethylamine (2C-B): analysis of phase I metabolism with hepatocytes of six species including human. Toxicology 206:75–89
Carnachan RJ, Bokhari M, Przyborski SA, Cameron NR (2006) Tailoring the morphology of emulsion-templated porous polymers. Soft Matter 2:608–616
Carr DF, Alfirevic A, Tugwood JD, Barratt BJ, Sherwood J, Smith J, Pirmohamed M, Park BK (2007) Molecular and genetic association of interleukin-6 in tacrine-induced hepatotoxicity. Pharmacogenet Genomics 17(11):961–972
Carraro A, Hsu WM, Kulig KM, Cheung WS, Miller ML, Weinberg EJ, Swart EF, Kaazempur-Mofrad M, Borenstein JT, Vacanti JP, Neville C (2008) In vitro analysis of a hepatic device with intrinsic microvascular-based channels. Biomed Microdevices 10:795–805
Cascorbi I (2011) P-glycoprotein: tissue distribution, substrates, and functional consequences of genetic variations. Handb Exp Pharmacol 201:261–283
Cassio D, Hamon-Benais C, Guerin M, Lecoq O (1991) Hybrid cell lines constitute a potential reservoir of polarized cells: isolation and study of highly differentiated hepatoma-derived hybrid cells able to form functional bile canaliculi in vitro. J Cell Biol 115:1397–1408
Casteleijn E, Kuiper J, van Rooij HC, Kamps JA, Koster JF, van Berkel TJ (1988) Endotoxin stimulates glycogenolysis in the liver by means of intercellular communication. J Biol Chem 263:6953–6955
Castell JV, Hernandez D, Gomez-Foix AM, Guillen I, Donato T, Gomez-Lechon MJ (1997) Adenovirus-mediated gene transfer into human hepatocytes: analysis of the biochemical functionality of transduced cells. Gene Ther 4:455–464
Castell JV, Jover R, Martinez-Jimenez CP, Gomez-Lechon MJ (2006) Hepatocyte cell lines: their use, scope and limitations in drug metabolism studies. Expert Opin Drug Metab Toxicol 2:183–212
Castilho-Fernandes A, de Almeida DC, Fontes AM, Melo FU, Picanço-Castro V, Freitas MC, Orellana MD, Palma PV, Hackett PB, Friedman SL, Covas DT (2011) Human hepatic stellate cell line (LX-2) exhibits characteristics of bone marrow-derived mesenchymal stem cells. Exp Mol Pathol 91:664–672
Cattley RC, Deluca J, Elcombe C, Fenner-Crisp P, Lake BG, Marsman DS, Pastoor TA, Popp JA, Robinson DE, Schwetz B, Tugwood J, Wahli W (1998) Do peroxisome proliferating compounds pose a hepatocarcinogenic hazard to humans? Regul Toxicol Pharmacol 27:47–60
Cattori V, Eckhardt U, Hagenbuch B (1999) Molecular cloning and functional characterization of two alternatively spliced Ntcp isoforms from mouse liver1. Biochim Biophys Acta 1445:154–159
Cattori V, van Montfoort JE, Stieger B, Landmann L, Meijer DK, Winterhalter KH, Meier PJ, Hagenbuch B (2001) Localization of organic anion transporting polypeptide 4 (Oatp4) in rat liver and comparison of its substrate specificity with Oatp1, Oatp2 and Oatp3. Pflugers Arch 443:188–195
Ceppi P, Mudduluru G, Kumarswamy R, Rapa I, Scagliotti GV, Papotti M, Allgayer H (2010) Loss of miR-200c expression induces an aggressive, invasive, and chemoresistant phenotype in non-small cell lung cancer. Mol Cancer Res 8:1207–1216
Cha HJ, Ko MJ, Ahn SM, Ahn JI, Shin HJ, Jeong HS, Kim HS, Choi SO, Kim EJ (2010) Identification of classifier genes for hepatotoxicity prediction in non steroidal anti inflammatory drugs. Mol Cell Toxicol 6:247–253
Chai J, Luo D, Wu X, Wang H, He Y, Li Q, Zhang Y, Chen L, Peng ZH, Xiao T, Wang R, Chen W (2011) Changes of organic anion transporter MRP4 and related nuclear receptors in human obstructive cholestasis. J Gastrointest Surg 15:996–1004
Chalasani N, Bjornsson E (2010) Risk factors for idiosyncratic drug-induced liver injury. Gastroenterology 138:2246–2259
Chalhoub E, Hanson RW, Belovich JM (2007) A computer model of gluconeogenesis and lipid metabolism in the perfused liver. Am J Physiol Endocrinol Metab 293:E1676–E1686
Chalhoub E, Xie L, Balasubramanian V, Kim J, Belovich J (2007) A distributed model of carbohydrate transport and metabolism in the liver during rest and high-intensity exercise. Ann Biomed Eng 35:474–491
Chan C, Berthiaume F, Nath BD, Tilles AW, Toner M, Yarmush ML (2004) Hepatic tissue engineering for adjunct and temporary liver support: critical technologies. Liver Transpl 10:1331–1342
Chan C, Berthiaume F, Washizu J, Toner M, Yarmush ML (2002) Metabolic pre-conditioning of cultured cells in physiological levels of insulin: generating resistance to the lipid-accumulating effects of plasma in hepatocytes. Biotechnol Bioeng 78:753–760
Chang LJ, Gay EE (2001) The molecular genetics of lentiviral vectors–current and future perspectives. Curr Gene Ther 1:237–251
Chang DW, Xing Z, Capacio VL, Peter ME, Yang X (2003) Interdimer processing mechanism of procaspase-8 activation. Embo J 22:4132–4142
Chang J, Nicolas E, Marks D, Sander C, Lerro A, Buendia MA, Xu C, Mason WS, Moloshok T, Bort R, Zaret KS, Taylor JM (2004) miR-122, a mammalian liver-specific microRNA, is processed from hcr mRNA and may downregulate the high affinity cationic amino acid transporter CAT-1. RNA Biol 1:106–113
Chang H, Wang YJ, Chang LW, Lin P (2005) A histochemical and pathological study on the interrelationship between TCDD-induced AhR expression, AhR activation, and hepatotoxicity in mice. J Toxicol Environ Health A 68:1567–1579
Chang Y, Moody DE, McCance-Katz EF (2006) Novel metabolites of buprenorphine detected in human liver microsomes and human urine. Drug Metab Dispos 34:440–448
Chang L, Kamata H, Solinas G, Luo JL, Maeda S, Venuprasad K, Liu YC, Karin M (2006) The E3 ubiquitin ligase itch couples JNK activation to TNFalpha-induced cell death by inducing c-FLIP(L) turnover. Cell 124:601–613
Chang TT, Hughes-Fulford M (2009) Monolayer and spheroid culture of human liver hepatocellular carcinoma cell line cells demonstrate distinct global gene expression patterns and functional phenotypes. Tissue Eng Part A 15:559–567
Chen D, Park Y, Kemper B (1994) Differential protein binding and transcriptional activities of HNF-4 elements in three closely related CYP2C genes. DNA Cell Biol 13:771–779
Chen W, Chiang JY (2003) Regulation of human sterol 27-hydroxylase gene (CYP27A1) by bile acids and hepatocyte nuclear factor 4alpha (HNF4alpha). Gene 313:71–82
Chen Q, Kon J, Ooe H, Sasaki K, Mitaka T (2007) Selective proliferation of rat hepatocyte progenitor cells in serum-free culture. Nat Protoc 2:1197–1205
Chen C, Stock JL, Liu X, Shi J, van Deusen JW, Dimattia DA, Dullea RG, de Morais SM (2008) Utility of a novel Oatp1b2 knockout mouse model for evaluating the role of Oatp1b2 in the hepatic uptake of model compounds. Drug Metab Dispos 36:1840–1845
Chen GY, Nunez G (2010) Sterile inflammation: sensing and reacting to damage. Nat Rev Immunol 10:826–837
Chen AA, Thomas DK, Ong LL, Schwartz RE, Golub TR, Bhatia SN (2011) Humanized mice with ectopic artificial liver tissues. Proc Natl Acad Sci USA 108:11842–11847
Chen YF, Tseng CY, Wang HW, Kuo HC, Yang VW, Lee OK (2012) Rapid generation of mature hepatocyte-like cells from human induced pluripotent stem cells by an efficient three-step protocol. Hepatology 55(4):1193–1203
Cheng SH, Rich DP, Marshall J, Gregory RJ, Welsh MJ, Smith AE (1991) Phosphorylation of the R domain by cAMP-dependent protein kinase regulates the CFTR chloride channel. Cell 66:1027–1036
Cheng X, Blumenthal RM (2008) Mammalian DNA methyltransferases: a structural perspective. Structure 16:341–350
Cheng J, Zhou L, Xie QF, Xie HY, Wei XY, Gao F, Xing CY, Xu X, Li LJ, Zheng SS (2010) The impact of miR-34a on protein output in hepatocellular carcinoma HepG2 cells. Proteomics 10:1557–1572
Cheng F, Theodorescu D, Schulman IG, Lee JK (2011) In vitro transcriptomic prediction of hepatotoxicity for early drug discovery. J Theor Biol 290:27–36
Chesire DR, Dunn TA, Ewing CM, Luo J, Isaacs WB (2004) Identification of aryl hydrocarbon receptor as a putative Wnt/beta-catenin pathway target gene in prostate cancer cells. Cancer Res 64:2523–2533
Chessman D, Kostenko L, Lethborg T, Purcell AW, Williamson NA, Chen Z, Kjer-Nielsen L, Mifsud NA, Tait BD, Holdsworth R, Almeida CA, Nolan D, Macdonald WA, Archbold JK, Kellerher AD, Marriott D, Mallal S, Bharadwaj M, Rossjohn J, McCluskey J (2008) Human leukocyte antigen class I-restricted activation of CD8 + T cells provides the immunogenetic basis of a systemic drug hypersensitivity. Immunity 28:822–832
Chia SM, Lin PC, Yu H (2005) TGF-beta1 regulation in hepatocyte-NIH3T3 co-culture is important for the enhanced hepatocyte function in 3D microenvironment. Biotechnol Bioeng 89:565–573
Chiang JY, Kimmel R, Weinberger C, Stroup D (2000) Farnesoid X receptor responds to bile acids and represses cholesterol 7alpha-hydroxylase gene (CYP7A1) transcription. J Biol Chem 275:10918–10924
Chiang JY, Kimmel R, Stroup D (2001) Regulation of cholesterol 7alpha-hydroxylase gene (CYP7A1) transcription by the liver orphan receptor (LXRalpha). Gene 262:257–65
Chiang JY (2003) Bile acid regulation of hepatic physiology: III. Bile acids and nuclear receptors. Am J Physiol Gastrointest Liver Physiol 284:G349–G356
Chiang JY (2009) Hepatocyte nuclear factor 4alpha regulation of bile acid and drug metabolism. Expert Opin Drug Metab Toxicol 5:137–147
Chin KV, Kong AN (2002) Application of DNA microarrays in pharmacogenomics and toxicogenomics. Pharm Res 19:1773–1778
Cho CH, Berthiaume F, Tilles AW, Yarmush ML (2008) A new technique for primary hepatocyte expansion in vitro. Biotechnol Bioeng 101:345–356
Cho CH, Park J, Nagrath D, Tilles AW, Berthiaume F, Toner M, Yarmush ML (2007) Oxygen uptake rates and liver-specific functions of hepatocyte and 3T3 fibroblast co-cultures. Biotechnol Bioeng 97:188–199
Cho CH, Park J, Tilles AW, Berthiaume F, Toner M, Yarmush ML (2010) Layered patterning of hepatocytes in co-culture systems using microfabricated stencils. Biotechniques 48:47–52
Cho CS, Goto M, Kobayashi A, Kobayashi K, Akaike T (1996) Effect of ligand orientation on hepatocyte attachment onto the poly(N-p-vinylbenzyl-o-beta-D-galactopyranosyl-D-gluconamide) as a model ligand of asialoglycoprotein. J Biomater Sci Polym Ed 7:1097–1104
Cho CS, Seo SJ, Park IK, Kim SH, Kim TH, Hoshiba T, Harada I, Akaike T (2006) Galactose-carrying polymers as extracellular matrices for liver tissue engineering. Biomaterials 27:576–585
Chopra M, Schrenk D (2011) Dioxin toxicity, aryl hydrocarbon receptor signaling, and apoptosis-persistent pollutants affect programmed cell death. Crit Rev Toxicol 41:292–320
Choudhuri S (2010) Small noncoding RNAs: biogenesis, function, and emerging significance in toxicology. J Biochem Mol Toxicol 24:195–216
Chow EC, Durk MR, Cummins CL, Pang KS (2011) 1Alpha,25-dihydroxyvitamin D3 up-regulates P-glycoprotein via the vitamin D receptor and not farnesoid X receptor in both fxr(−/−) and fxr(+/+) mice and increased renal and brain efflux of digoxin in mice in vivo. J Pharmacol Exp Ther 337:846–859
Chu YS, Dufour S, Thiery JP, Perez E, Pincet F (2005) Johnson-Kendall-Roberts theory applied to living cells. Phys Rev Lett 94(2):028102
Chu XY, Kato Y, Niinuma K, Sudo KI, Hakusui H, Sugiyama Y (1997) Multispecific organic anion transporter is responsible for the biliary excretion of the camptothecin derivative irinotecan and its metabolites in rats. J Pharmacol Exp Ther 281:304–314
Chu CC, Pan KL, Yao HT, Hsu JT (2011) Development of a whole-cell screening system for evaluation of the human CYP1A2-mediated metabolism. Biotechnol Bioeng 108:2932–2940
Chua KN, Lim WS, Zhang P, Lu H, Wen J, Ramakrishna S, Leong KW, Mao HQ (2005) Stable immobilization of rat hepatocyte spheroids on galactosylated nanofiber scaffold. Biomaterials 26:2537–2547
Chuang YH, Lian ZX, Yang GX, Shu SA, Moritoki Y, Ridgway WM, Ansari AA, Kronenberg M, Flavell RA, Gao B, Gershwin ME (2008) Natural killer T cells exacerbate liver injury in a transforming growth factor beta receptor II dominant-negative mouse model of primary biliary cirrhosis. Hepatology 47:571–580
Chung JY, Cho JY, Yu KS, Kim JR, Oh DS, Jung HR, Lim KS, Moon KH, Shin SG, Jang IJ (2005) Effect of OATP1B1 (SLCO1B1) variant alleles on the pharmacokinetics of pitavastatin in healthy volunteers. Clin Pharmacol Ther 78:342–350
Chung TW, Yang J, Akaike T, Cho KY, Nah JW, Kim SI, Cho CS (2002) Preparation of alginate/galactosylated chitosan scaffold for hepatocyte attachment. Biomaterials 23:2827–2834
Clayton DF, Darnell JE Jr (1983) Changes in liver-specific compared to common gene transcription during primary culture of mouse hepatocytes. Mol Cell Biol 3:1552–1561
Clayton DF, Harrelson AL, Darnell JE Jr (1985) Dependence of liver-specific transcription on tissue organization. Mol Cell Biol 5:2623–2632
Cohen SM, Storer RD, Criswell KA, Doerrer NG, Dellarco VL, Pegg DG, Wojcinski ZW, Malarkey DE, Jacobs AC, Klaunig JE, Swenberg JA, Cook JC (2009) Hemangiosarcoma in rodents: mode-of-action evaluation and human relevance. Toxicol Sci 111:4–18
Coleman R (1987) Biochemistry of bile secretion. Biochem J 244:249–261
Colletti M, Cicchini C, Conigliaro A, Santangelo L, Alonzi T, Pasquini E, Tripodi M, Amicone L (2009) Convergence of Wnt signaling on the HNF4alpha-driven transcription in controlling liver zonation. Gastroenterology 137:660–672
Colnot S, Decaens T, Niwa-Kawakita M, Godard C, Hamard G, Kahn A, Giovannini M, Perret C (2004) Liver-targeted disruption of Apc in mice activates beta-catenin signaling and leads to hepatocellular carcinomas. Proc Natl Acad Sci USA 101:17216–17221
Comar JF, Suzuki-Kemmelmeier F, Constantin J, Bracht A (2010) Hepatic zonation of carbon and nitrogen fluxes derived from glutamine and ammonia transformations. J Biomed Sci 17:1
Conde de La Rosa L, Schoemaker MH, Vrenken TE, Buist-Homan M, Havinga R, Jansen PL, Moshage H (2006) Superoxide anions and hydrogen peroxide induce hepatocyte death by different mechanisms: involvement of JNK and ERK MAP kinases. J Hepatol 44:918–929
Condreay JP, Witherspoon SM, Clay WC, Kost TA (1999) Transient and stable gene expression in mammalian cells transduced with a recombinant baculovirus vector. Proc Natl Acad Sci USA 96:127–132
Connolly EC, van Doorslaer K, Rogler LE, Rogler CE (2011) Overexpression of miR-21 promotes an in vitro metastatic phenotype by targeting the tumor suppressor RHOB. Mol Cancer Res 8:691–700
Connor KT, Aylward LL (2006) Human response to dioxin: aryl hydrocarbon receptor (AhR) molecular structure, function, and dose-response data for enzyme induction indicate an impaired human AhR. J Toxicol Environ Health B Crit Rev 9:147–171
Corazza N, Jakob S, Schaer C, Frese S, Keogh A, Stroka D, Kassahn D, Torgler R, Mueller C, Schneider P, Brunner T (2006) TRAIL receptor-mediated JNK activation and Bim phosphorylation critically regulate Fas-mediated liver damage and lethality. J Clin Invest 116:2493–2499
Corchero J, Granvil CP, Akiyama TE, Hayhurst GP, Pimprale S, Feigenbaum L, Idle JR, Gonzalez FJ (2001) The CYP2D6 humanized mouse: effect of the human CYP2D6 transgene and HNF4alpha on the disposition of debrisoquine in the mouse. Mol Pharmacol 60:1260–1267
Corchero J, Martin-Partido G, Dallas SL, Fernandez-Salguero PM (2004) Liver portal fibrosis in dioxin receptor-null mice that overexpress the latent transforming growth factor-beta-binding protein-1. Int J Exp Pathol 85:295–302
Cosgrove BD, King BM, Hasan MA, Alexopoulos LG, Farazi PA, Hendriks BS, Griffith LG, Sorger PK, Tidor B, Xu JJ, Lauffenburger DA (2009) Synergistic drug-cytokine induction of hepatocellular death as an in vitro approach for the study of inflammation-associated idiosyncratic drug hepatotoxicity. Toxicol Appl Pharmacol 237:317–330
Coundouris JA, Grant MH, Engeset J, Petrie JC, Hawksworth GM (1993) Cryopreservation of human adult hepatocytes for use in drug metabolism and toxicity studies. Xenobiotica 23:1399–1409
Courjault-Gautier F, Antoine B, Bens M, Vallet V, Cluzeaud F, Pringault E, Kahn A, Toutain H, Vandewalle A (1997) Activity and inducibility of drug-metabolizing enzymes in immortalized hepatocyte-like cells (mhPKT) derived from a L-PK/Tag1 transgenic mouse. Exp Cell Res 234:362–372
Cover C, Mansouri A, Knight TR, Bajt ML, Lemasters JJ, Pessayre D, Jaeschke H (2005) Peroxynitrite-induced mitochondrial and endonuclease-mediated nuclear DNA damage in acetaminophen hepatotoxicity. J Pharmacol Exp Ther 315:879–887
Cover C, Liu J, Farhood A, Malle E, Waalkes MP, Bajt ML, Jaeschke H (2006) Pathophysiological role of the acute inflammatory response during acetaminophen hepatotoxicity. Toxicol Appl Pharmacol 216(1):98–107
Craddock AL, Love MW, Daniel RW, Kirby LC, Walters HC, Wong MH, Dawson PA (1998) Expression and transport properties of the human ileal and renal sodium-dependent bile acid transporter. Am J Physiol 274:G157–G169
Crespi CL, Miller VP (1999) The use of heterologously expressed drug metabolizing enzymes–state of the art and prospects for the future. Pharmacol Ther 84:121–131
Crestani M, de Fabiani E, Caruso D, Mitro N, Gilardi F, Vigil Chacon AB, Patelli R, Godio C, Galli G (2004) LXR (liver X receptor) and HNF-4 (hepatocyte nuclear factor-4): key regulators in reverse cholesterol transport. Biochem Soc Trans 32:92–96
Crispe IN (2009) The liver as a lymphoid organ. Annu Rev Immunol 27:147–163
Csanaky IL, Lu H, Zhang Y, Ogura K, Choudhuri S, Klaassen CD (2011) Organic anion-transporting polypeptide 1b2 (Oatp1b2) is important for the hepatic uptake of unconjugated bile acids: Studies in Oatp1b2-null mice. Hepatology 53:272–281
Cui Y, Konig J, Buchholz JK, Spring H, Leier I, Keppler D (1999) Drug resistance and ATP-dependent conjugate transport mediated by the apical multidrug resistance protein, MRP2, permanently expressed in human and canine cells. Mol Pharmacol 55:929–37
Cui Y, Konig J, Leier I, Buchholz U, Keppler D (2001) Hepatic uptake of bilirubin and its conjugates by the human organic anion transporter SLC21A6. J Biol Chem 276:9626–9630
Curcio E, Salerno S, Barbieri G, de Bartolo L, Drioli E, Bader A (2007) Mass transfer and metabolic reactions in hepatocyte spheroids cultured in rotating wall gas-permeable membrane system. Biomaterials 28:5487–5497
Curran RD, Billiar TR, West MA, Bentz BG, Simmons RL (1988) Effect of interleukin 2 on Kupffer cell activation. Interleukin 2 primes and activates Kupffer cells to suppress hepatocyte protein synthesis in vitro. Arch Surg 123:1373–1378
Cvetkovic M, Leake B, Fromm MF, Wilkinson GR, Kim RB (1999) OATP and P-glycoprotein transporters mediate the cellular uptake and excretion of fexofenadine. Drug Metab Dispos 27:866–871
D’Aldebert E, Biyeyeme Bi Mve MJ, Mergey M, Wendum D, Firrincieli D, Coilly A, Fouassier L, Corpechot C, Poupon R, Housset C, Chignard N (2009) Bile salts control the antimicrobial peptide cathelicidin through nuclear receptors in the human biliary epithelium. Gastroenterology 136:1435–1443
D’Amour KA, Bang AG, Eliazer S, Kelly OG, Agulnick AD, Smart NG, Moorman MA, Kroon E, Carpenter MK, Baetge EE (2006) Production of pancreatic hormone-expressing endocrine cells from human embryonic stem cells. Nat Biotechnol 24:1392–1401
Dahlin DC, Miwa GT, Lu AY, Nelson SD (1984) N-acetyl-p-benzoquinone imine: a cytochrome P-450-mediated oxidation product of acetaminophen. Proc Natl Acad Sci USA 81:1327–1331
Daley WP, Peters SB, Larsen M (2008) Extracellular matrix dynamics in development and regenerative medicine. J Cell Sci 121:255–264
Dalton PD, Woodfield T, Hutmacher DW (2009) Snapshot: Polymer scaffolds for tissue engineering. Biomaterials 30:701–702
Daly AK, Aithal GP, Leathart JB, Swainsbury RA, Dang TS, Day CP (2007) Genetic susceptibility to diclofenac-induced hepatotoxicity: contribution of UGT2B7, CYP2C8, and ABCC2 genotypes. Gastroenterology 132:272–281
Daly AK, Donaldson PT, Bhatnagar P, Shen Y, Pe’Er I, Floratos A, Daly MJ, Goldstein DB, John S, Nelson MR, Graham J, Park BK, Dillon JF, Bernal W, Cordell HJ, Pirmohamed M, Aithal GP, Day CP (2009) HLA-B*5701 genotype is a major determinant of drug-induced liver injury due to flucloxacillin. Nat Genet 41:816–819
Dambach DM, Andrews BA, Moulin F (2005) New technologies and screening strategies for hepatotoxicity: use of in vitro models. Toxicol Pathol 33:17–26
Dan YY, Riehle KJ, Lazaro C, Teoh N, Haque J, Campbell JS, Fausto N (2006) Isolation of multipotent progenitor cells from human fetal liver capable of differentiating into liver and mesenchymal lineages. Proc Natl Acad Sci USA 103:9912–9917
Dannenberg LO, Chen HJ, Tian H, Edenberg HJ (2006) Differential regulation of the alcohol dehydrogenase 1B (ADH1B) and ADH1C genes by DNA methylation and histone deacetylation. Alcohol Clin Exp Res 30:928–937
Dannenberg LO, Edenberg HJ (2006) Epigenetics of gene expression in human hepatoma cells: expression profiling the response to inhibition of DNA methylation and histone deacetylation. BMC Genomics 7:181
Darr TB, Hubel A (2001) Postthaw viability of precultured hepatocytes. Cryobiology 42:11–20
Davit-Spraul A, Gonzales E, Baussan C, Jacquemin E (2009) Progressive familial intrahepatic cholestasis. Orphanet J Rare Dis 4:1
Dawson PA, Mychaleckyj JC, Fossey SC, Mihic SJ, Craddock AL, Bowden DW (2001) Sequence and functional analysis of GLUT10: a glucose transporter in the Type 2 diabetes-linked region of chromosome 20q12-13.1. Mol Genet Metab 74:186–199
Dawson PA, Lan T, Rao A (2009) Bile acid transporters. J Lipid Res 50:2340–2357
Dawson S, Stahl S, Paul N, Barber J, Kenna JG (2012) In vitro inhibition of the bile salt export pump correlates with risk of cholestatic drug-induced liver injury in humans. Drug Metab Dispos 40:130–138
Day CP, James OF (1998) Steatohepatitis: a tale of two “hits”? Gastroenterology 114:842–845
de Bartolo L, Salerno S, Morelli S, Giorno L, Rende M, Memoli B, Procino A, Andreucci VE, Bader A, Drioli E (2006) Long-term maintenance of human hepatocytes in oxygen-permeable membrane bioreactor. Biomaterials 27:4794–4803
de Bruyn T, Ye ZW, Peeters A, Sahi J, Baes M, Augustijns PF, Annaert PP (2011) Determination of OATP-, NTCP- and OCT-mediated substrate uptake activities in individual and pooled batches of cryopreserved human hepatocytes. Eur J Pharm Sci 43:297–307
de Graaf IA, de Kanter R, de Jager MH, Camacho R, Langenkamp E, van de Kerkhof EG, Groothuis GM (2006) Empirical validation of a rat in vitro organ slice model as a tool for in vivo clearance prediction. Drug Metab Dispos 34:591–599
de Graaf IA, Groothuis GM, Olinga P (2007) Precision-cut tissue slices as a tool to predict metabolism of novel drugs. Expert Opin Drug Metab Toxicol 3:879–898
de Graaf IA, Draaisma AL, Schoeman O, Fahy GM, Groothuis GM, Koster HJ (2007) Cryopreservation of rat precision-cut liver and kidney slices by rapid freezing and vitrification. Cryobiology 54:1–12
de Graaf IA, Olinga P, de Jager MH, Merema MT, de Kanter R, van de Kerkhof EG, Groothuis GM (2010) Preparation and incubation of precision-cut liver and intestinal slices for application in drug metabolism and toxicity studies. Nat Protoc 5:1540–1551
de la Cruz CC, Kirmizis A, Simon MD, Isono K, Koseki H, Panning B (2007) The polycomb group protein SUZ12 regulates histone H3 lysine 9 methylation and HP1 alpha distribution. Chromosome Res 15:299–314
Deakin JA, Blaum BS, Gallagher JT, Uhrin D, Lyon M (2009) The binding properties of minimal oligosaccharides reveal a common heparan sulfate/dermatan sulfate-binding site in hepatocyte growth factor/scatter factor that can accommodate a wide variety of sulfation patterns. J Biol Chem 284:6311–6321
Decaens T, Godard C, de Reynies A, Rickman DS, Tronche F, Couty JP, Perret C, Colnot S (2008) Stabilization of beta-catenin affects mouse embryonic liver growth and hepatoblast fate. Hepatology 47:247–258
Del Castillo-Olivares A, Campos JA, Pandak WM, Gil G (2004) The role of alpha1-fetoprotein transcription factor/LRH-1 in bile acid biosynthesis: a known nuclear receptor activator that can act as a suppressor of bile acid biosynthesis. J Biol Chem 279:16813–16821
Delacour D, Jacob R (2006) Apical protein transport. Cell Mol Life Sci 63:2491–2505
Deleve LD (1996) Cellular target of cyclophosphamide toxicity in the murine liver: role of glutathione and site of metabolic activation. Hepatology 24:830–837
Deng X, Luyendyk JP, Ganey PE, Roth RA (2009) Inflammatory stress and idiosyncratic hepatotoxicity: hints from animal models. Pharmacol Rev 61:262–282
Deng Y, Ren X, Yang L, Lin Y, Wu X (2003) A JNK-dependent pathway is required for TNFalpha-induced apoptosis. Cell 115:61–70
Denison MS, Soshilov AA, He G, Degroot DE, Zhao B (2011) Exactly the same but different: promiscuity and diversity in the molecular mechanisms of action of the aryl hydrocarbon (dioxin) receptor. Toxicol Sci 124:1–22
Denk W, Strickler JH, Webb WW (1990) Two-photon laser scanning fluorescence microscopy. Science 248:73–76
Desagher S, Osen-Sand A, Nichols A, Eskes R, Montessuit S, Lauper S, Maundrell K, Antonsson B, Martinou JC (1999) Bid-induced conformational change of Bax is responsible for mitochondrial cytochrome c release during apoptosis. J Cell Biol 144:891–901
Desbarats J, Newell MK (2000) Fas engagement accelerates liver regeneration after partial hepatectomy. Nat Med 6:920–923
Deshpande RR, Koch-Kirsch Y, Maas R, John GT, Krause C, Heinzle E (2005) Microplates with integrated oxygen sensors for kinetic cell respiration measurement and cytotoxicity testing in primary and secondary cell lines. Assay Drug Dev Technol 3:299–307
Devereaux BM, Crawford DH, Purcell P, Powell LW, Roeser HP (1995) Flucloxacillin associated cholestatic hepatitis. An Australian and Swedish epidemic? Eur J Clin Pharmacol 49:81–85
di Mambro AJ, Parker R, McCune A, Gordon F, Dayan CM, Collins P (2011) In vitro steroid resistance correlates with outcome in severe alcoholic hepatitis. Hepatology 53:1316–1322
Ding BS, Nolan DJ, Butler JM, James D, Babazadeh AO, Rosenwaks Z, Mittal V, Kobayashi H, Shido K, Lyden D, Sato TN, Rabbany SY, Rafii S (2010) Inductive angiocrine signals from sinusoidal endothelium are required for liver regeneration. Nature 468:310–315
Direnzo J, Soderstrom M, Kurokawa R, Ogliastro MH, Ricote M, Ingrey S, Horlein A, Rosenfeld MG, Glass CK (1997) Peroxisome proliferator-activated receptors and retinoic acid receptors differentially control the interactions of retinoid X receptor heterodimers with ligands, coactivators, and corepressors. Mol Cell Biol 17:2166–2176
Docoslis A, Kalogerakis N, Behie LA (1999) Dielectrophoretic forces can be safely used to retain viable cells in perfusion cultures of animal cells. Cytotechnology 30:133–142
Doege H, Schurmann A, Bahrenberg G, Brauers A, Joost HG (2000) GLUT8, a novel member of the sugar transport facilitator family with glucose transport activity. J Biol Chem 275:16275–16280
Dombrowski SM, Desai SY, Marroni M, Cucullo L, Goodrich K, Bingaman W, Mayberg MR, Bengez L, Janigro D (2001) Overexpression of multiple drug resistance genes in endothelial cells from patients with refractory epilepsy. Epilepsia 42:1501–1506
Donaldson PT, Daly AK, Henderson J, Graham J, Pirmohamed M, Bernal W, Day CP, Aithal GP (2010) Human leucocyte antigen class II genotype in susceptibility and resistance to co-amoxiclav-induced liver injury. J Hepatol 53(6):1049–1053
Donato MT, Hallifax D, Picazo L, Castell JV, Houston JB, Gomez-Lechon MJ, Lahoz A (2010) Metabolite formation kinetics and intrinsic clearance of phenacetin, tolbutamide, alprazolam, and midazolam in adenoviral cytochrome P450-transfected HepG2 cells and comparison with hepatocytes and in vivo. Drug Metab Dispos 38:1449–1455
Donato MT, Lahoz A, Montero S, Bonora A, Pareja E, Mir J, Castell JV, Gomez-Lechon MJ (2008) Functional assessment of the quality of human hepatocyte preparations for cell transplantation. Cell Transpl 17:1211–1219
Donato MT, Lahoz A, Castell JV, Gomez-Lechon MJ (2008) Cell lines: a tool for in vitro drug metabolism studies. Curr Drug Metab 9:1–11
Donner MG, Keppler D (2001) Up-regulation of basolateral multidrug resistance protein 3 (Mrp3) in cholestatic rat liver. Hepatology 34:351–359
Dooley S, Streckert M, Delvoux B, Gressner AM (2001) Expression of Smads during in vitro transdifferentiation of hepatic stellate cells to myofibroblasts. Biochem Biophys Res Commun 283:554–562
Dooley S, ten Dijke P (2012) TGF-beta in progression of liver disease. Cell Tissue Res 347:245–256
Dorko K, Freeswick PD, Bartoli F, Cicalese L, Bardsley BA, Tzakis A, Nussler AK (1994) A new technique for isolating and culturing human hepatocytes from whole or split livers not used for transplantation. Cell Transplant 3:387–395
Dou M, de Sousa G, Lacarelle B, Placidi M, de La Porte PL, Domingo M, Lafont H, Rahmani R (1992) Thawed human hepatocytes in primary culture. Cryobiology 29:454–469
Dowell P, Ishmael JE, Avram D, Peterson VJ, Nevrivy DJ, Leid M (1997) p300 functions as a coactivator for the peroxisome proliferator-activated receptor alpha. J Biol Chem 272:33435–33443
Dowell P, Ishmael JE, Avram D, Peterson VJ, Nevrivy DJ, Leid M (1999) Identification of nuclear receptor corepressor as a peroxisome proliferator-activated receptor alpha interacting protein. J Biol Chem 274:15901–15907
Dragan YP, Schrenk D (2000) Animal studies addressing the carcinogenicity of TCDD (or related compounds) with an emphasis on tumour promotion. Food Addit Contam 17:289–302
Drasdo D (2005) Coarse Graining in Simulated Cell Populations. Adv. Complex Syst 2&3:319–363
Drasdo D, Hoehme S, Block M (2007) On the role of physics in the growth and pattern formation of multi-cellular systems: what can we learn from individual-cell based models? J Stat Phys 128(59):287–345
Drasdo D, Hoehme S (2012) Modeling the impact of granular embedding media, and pulling versus pushing cells on growing cell clones. New J Phys 14:055025
Dresser GK, Kim RB, Bailey DG (2005) Effect of grapefruit juice volume on the reduction of fexofenadine bioavailability: possible role of organic anion transporting polypeptides. Clin Pharmacol Ther 77:170–177
Drewes T, Senkel S, Holewa B, Ryffel GU (1996) Human hepatocyte nuclear factor 4 isoforms are encoded by distinct and differentially expressed genes. Mol Cell Biol 16:925–931
Drocourt L, Ourlin JC, Pascussi JM, Maurel P, Vilarem MJ (2002) Expression of CYP3A4, CYP2B6, and CYP2C9 is regulated by the vitamin D receptor pathway in primary human hepatocytes. J Biol Chem 277:25125–25132
Duan Y, Catana A, Meng Y, Yamamoto N, He S, Gupta S, Gambhir SS, Zern MA (2007) Differentiation and enrichment of hepatocyte-like cells from human embryonic stem cells in vitro and in vivo. Stem Cells 25:3058–3068
Duarte NC, Becker SA, Jamshidi N, Thiele I, Mo ML, Vo TD, Srivas R, Palsson BO (2007) Global reconstruction of the human metabolic network based on genomic and bibliomic data. Proc Natl Acad Sci USA 104:1777–1782
Duffield JS, Forbes SJ, Constandinou CM, Clay S, Partolina M, Vuthoori S, Wu S, Lang R, Iredale JP (2005) Selective depletion of macrophages reveals distinct, opposing roles during liver injury and repair. J Clin Invest 115:56–65
Dunn JC, Tompkins RG, Yarmush ML (1991) Long-term in vitro function of adult hepatocytes in a collagen sandwich configuration. Biotechnol Prog 7:237–245
Dunn JC, Tompkins RG, Yarmush ML (1992) Hepatocytes in collagen sandwich: evidence for transcriptional and translational regulation. J Cell Biol 116:1043–1053
Dunn JC, Yarmush ML, Koebe HG, Tompkins RG (1989) Hepatocyte function and extracellular matrix geometry: long-term culture in a sandwich configuration. Faseb J 3:174–177
Duprez L, Bertrand MJ, Vanden Berghe T, Dondelinger Y, Festjens V, Vandenabeele P (2012) Intermediate domain of receptor-interacting protein kinase 1 (RIPK1) determines switch between necroptosis and RIPK1 kinase-dependent apoptosis. J Biol Chem 287:14863–14872
Duret C, Gerbal-Chaloin S, Ramos J, Fabre JM, Jacquet E, Navarro F, Blanc P, Sa-Cunha A, Maurel P, Daujat-Chavanieu M (2007) Isolation, characterization, and differentiation to hepatocyte-like cells of nonparenchymal epithelial cells from adult human liver. Stem Cells 25:1779–1790
Durrin LK, Mann RK, Kayne PS, Grunstein M (1991) Yeast histone H4 N-terminal sequence is required for promoter activation in vivo. Cell 65:1023–1031
Echchgadda I, Song CS, Roy AK, Chatterjee B (2004) Dehydroepiandrosterone sulfotransferase is a target for transcriptional induction by the vitamin D receptor. Mol Pharmacol 65:720–729
Eechoute K, Franke RM, Loos WJ, Scherkenbach LA, Boere I, Verweij J, Gurney H, Kim RB, Tirona RG, Mathijssen RH, Sparreboom A (2011) Environmental and genetic factors affecting transport of imatinib by OATP1A2. Clin Pharmacol Ther 89:816–820
Eichelbaum M, Ingelman-Sundberg M, Evans WE (2006) Pharmacogenomics and individualized drug therapy. Annu Rev Med 57:119–137
Einarsson K, Alvelius G, Hillebrant CG, Reihner E, Bjorkhem I (1996) Concentration of unsulfated lithocholic acid in portal and systemic venous plasma: evidence that lithocholic acid does not down regulate the hepatic cholesterol 7 alpha-hydroxylase activity in gallstone patients. Biochim Biophys Acta 1317:19–26
Eisenberg ML, Maker AV, Slezak LA, Nathan JD, Sritharan KC, Jena BP, Geibel JP, Andersen DK (2005) Insulin receptor (IR) and glucose transporter 2 (GLUT2) proteins form a complex on the rat hepatocyte membrane. Cell Physiol Biochem 15:51–58
Eissing T, Conzelmann H, Gilles ED, Allgower F, Bullinger E, Scheurich P (2004) Bistability analyses of a caspase activation model for receptor-induced apoptosis. J Biol Chem 279:36892–7
Elaut G, Henkens T, Papeleu P, Snykers S, Vinken M, Vanhaecke T, Rogiers V (2006) Molecular mechanisms underlying the dedifferentiation process of isolated hepatocytes and their cultures. Curr Drug Metab 7:629–660
Elferink CJ, Ge NL, Levine A (2001) Maximal aryl hydrocarbon receptor activity depends on an interaction with the retinoblastoma protein. Mol Pharmacol 59:664–673
Elferink MG, Olinga P, Draaisma AL, Merema MT, Bauerschmidt S, Polman J, Schoonen WG, Groothuis GM (2008) Microarray analysis in rat liver slices correctly predicts in vivo hepatotoxicity. Toxicol Appl Pharmacol 229:300–309
Elferink MG, Olinga P, Draaisma AL, Merema MT, Faber KN, Slooff MJ, Meijer DK, Groothuis GM (2004) LPS-induced downregulation of MRP2 and BSEP in human liver is due to a posttranscriptional process. Am J Physiol Gastrointest Liver Physiol 287:G1008–G1016
Elferink MG, Olinga P, van Leeuwen EM, Bauerschmidt S, Polman J, Schoonen WG, Heisterkamp SH, Groothuis GM (2011) Gene expression analysis of precision-cut human liver slices indicates stable expression of ADME-Tox related genes. Toxicol Appl Pharmacol 253:57–69
Ellinger-Ziegelbauer H, Gmuender H, Bandenburg A, Ahr HJ (2008) Prediction of a carcinogenic potential of rat hepatocarcinogens using toxicogenomics analysis of short-term in vivo studies. Mutat Res 637:23–39
Ellinger-Ziegelbauer H, Stuart B, Wahle B, Bomann W, Ahr HJ (2004) Characteristic expression profiles induced by genotoxic carcinogens in rat liver. Toxicol Sci 77:19–34
Elliott JC, Dover SD (1982) X-ray microtomography. J Microsc 126:211–213
Elmen J, Lindow M, Silahtaroglu A, Bak M, Christensen M, Lind-Thomsen A, Hedtjarn M, Hansen JB, Hansen HF, Straarup EM, McCullagh K, Kearney P, Kauppinen S (2008) Antagonism of microRNA-122 in mice by systemically administered LNA-antimiR leads to up-regulation of a large set of predicted target mRNAs in the liver. Nucleic Acids Res 36:1153–1162
Elmen J, Lindow M, Schutz S, Lawrence M, Petri A, Obad S, Lindholm M, Hedtjarn M, Hansen HF, Berger U, Gullans S, Kearney P, Sarnow P, Straarup EM, Kauppinen S (2008) LNA-mediated microRNA silencing in non-human primates. Nature 452:896–869
Eloranta JJ, Jung D, Kullak-Ublick GA (2006) The human Na + -taurocholate cotransporting polypeptide gene is activated by glucocorticoid receptor and peroxisome proliferator-activated receptor-gamma coactivator-1alpha, and suppressed by bile acids via a small heterodimer partner-dependent mechanism. Mol Endocrinol 20:65–79
Elvevold K, Smedsrod B, Martinez I (2008) The liver sinusoidal endothelial cell: a cell type of controversial and confusing identity. Am J Physiol Gastrointest Liver Physiol 294:G391–G400
Emoto C, Murase S, Iwasaki K (2006) Approach to the prediction of the contribution of major cytochrome P450 enzymes to drug metabolism in the early drug-discovery stage. Xenobiotica 36:671–683
EPA (2012) EPA’s reanalysis of key issues related to dioxin toxicity and response to NAS Comments. Environmental Protection Agency (EPA), Washington, DC
Esau C, Davis S, Murray SF, Yu XX, Pandey SK, Pear M, Watts L, Booten SL, Graham M, McKay R, Subramaniam A, Propp S, Lollo BA, Freier S, Bennett CF, Bhanot S, Monia BP (2006) miR-122 regulation of lipid metabolism revealed by in vivo antisense targeting. Cell Metab 3:87–98
Essa S, Denzer N, Mahlknecht U, Klein R, Collnot EM, Tilgen W, Reichrath J (2010) VDR microRNA expression and epigenetic silencing of vitamin D signaling in melanoma cells. J Steroid Biochem Mol Biol 121:110–113
Esser C (2012) Biology and function of the aryl hydrocarbon receptor: report of an international and interdisciplinary conference. Arch Toxicol 86:1323–1329
Esteller A (2008) Physiology of bile secretion. World J Gastroenterol 14:5641–5649
Evans WH (1980) A biochemical dissection of the functional polarity of the plasma membrane of the hepatocyte. Biochim Biophys Acta 604:27–64
Evers R, de Haas M, Sparidans R, Beijnen J, Wielinga PR, Lankelma J, Borst P (2000) Vinblastine and sulfinpyrazone export by the multidrug resistance protein MRP2 is associated with glutathione export. Br J Cancer 83:375–383
Evseenko DA, Paxton JW, Keelan JA (2006) ABC drug transporter expression and functional activity in trophoblast-like cell lines and differentiating primary trophoblast. Am J Physiol Regul Integr Comp Physiol 290:R1357–R1365
Eyhorn S, Schlayer HJ, Henninger HP, Dieter P, Hermann R, Woort-Menker M, Becker H, Schaefer HE, Decker K (1988) Rat hepatic sinusoidal endothelial cells in monolayer culture. Biochemical and ultrastructural characteristics. J Hepatol 6:23–35
Fadok VA, Bratton DL, Konowal A, Freed PW, Westcott JY, Henson PM (1998) Macrophages that have ingested apoptotic cells in vitro inhibit proinflammatory cytokine production through autocrine/paracrine mechanisms involving TGF-beta, PGE2, and PAF. J Clin Invest 101:890–898
Fagerholm U (2007) Prediction of human pharmacokinetics–evaluation of methods for prediction of hepatic metabolic clearance. J Pharm Pharmacol 59:803–828
Fahmi OA, Hurst S, Plowchalk D, Cook J, Guo F, Youdim K, Dickins M, Phipps A, Darekar A, Hyland R, Obach RS (2009) Comparison of different algorithms for predicting clinical drug-drug interactions, based on the use of CYP3A4 in vitro data: predictions of compounds as precipitants of interaction. Drug Metab Dispos 37:1658–1666
Fahrmayr C, Fromm MF, Konig J (2010) Hepatic OATP and OCT uptake transporters: their role for drug-drug interactions and pharmacogenetic aspects. Drug Metab Rev 42:380–401
Fallowfield JA, Mizuno M, Kendall TJ, Constandinou CM, Benyon RC, Duffield JS, Iredale JP (2007) Scar-associated macrophages are a major source of hepatic matrix metalloproteinase-13 and facilitate the resolution of murine hepatic fibrosis. J Immunol 178:5288–5295
Fan L, Tu X, Zhu Y, Zhou L, Pfeiffer T, Feltens R, Stoecker W, Zhong R (2005) Genetic association of vitamin D receptor polymorphisms with autoimmune hepatitis and primary biliary cirrhosis in the Chinese. J Gastroenterol Hepatol 20:249–255
Fan J, Liu S, Du Y, Morrison J, Shipman R, Pang KS (2009) Up-regulation of transporters and enzymes by the vitamin D receptor ligands, 1alpha,25-dihydroxyvitamin D3 and vitamin D analogs, in the Caco-2 cell monolayer. J Pharmacol Exp Ther 330:389–402
Fan J, Shang Y, Yuan Y, Yang J (2010) Preparation and characterization of chitosan/galactosylated hyaluronic acid scaffolds for primary hepatocytes culture. J Mater Sci Mater Med 21:319–327
Fan Y, Boivin GP, Knudsen ES, Nebert DW, Xia Y, Puga A (2010) The aryl hydrocarbon receptor functions as a tumor suppressor of liver carcinogenesis. Cancer Res 70:212–220
Fandy TE (2009) Development of DNA methyltransferase inhibitors for the treatment of neoplastic diseases. Curr Med Chem 16:2075–2085
Fardel O, Ratanasavanh D, Loyer P, Ketterer B, Guillouzo A (1992) Overexpression of the multidrug resistance gene product in adult rat hepatocytes during primary culture. Eur J Biochem 205:847–852
Fardel O, Morel F, Guillouzo A (1993) P-glycoprotein expression in human, mouse, hamster and rat hepatocytes in primary culture. Carcinogenesis 14:781–783
Fattore E, Trossvik C, Hakansson H (2000) Relative potency values derived from hepatic vitamin A reduction in male and female Sprague-Dawley rats following subchronic dietary exposure to individual polychlorinated dibenzo-p-dioxin and dibenzofuran congeners and a mixture thereof. Toxicol Appl Pharmacol 165:184–194
Faucette SR, Zhang TC, Moore R, Sueyoshi T, Omiecinski CJ, Lecluyse EL, Negishi M, Wang H (2007) Relative activation of human pregnane X receptor versus constitutive androstane receptor defines distinct classes of CYP2B6 and CYP3A4 inducers. J Pharmacol Exp Ther 320:72–80
Faulkner L, Martinsson K, Santoyo-Castelazo A, Cederbrant K, Schuppe-Koistinen I, Powell H, Tugwood J, Naisbitt DJ, Park BK (2012) The development of in vitro culture methods to characterize primary T-cell responses to drugs. Toxicol Sci 127:150–158
Fausto N (2004) Liver regeneration and repair: hepatocytes, progenitor cells, and stem cells. Hepatology 39:1477–87
FDA FADA (2012) Guidance for industry: drug interaction studies—study design, data analysis, implications for dosing, and labeling recommendations
Fedorovich NE, Schuurman W, Wijnberg HM, Prins HJ, van Weeren PR, Malda J, Alblas J, Dhert WJ (2012) Biofabrication of osteochondral tissue equivalents by printing topologically defined, cell-laden hydrogel scaffolds. Tissue Eng Part C Methods 18:33–44
Feige JN, Gelman L, Tudor C, Engelborghs Y, Wahli W, Desvergne B (2005) Fluorescence imaging reveals the nuclear behavior of peroxisome proliferator-activated receptor/retinoid X receptor heterodimers in the absence and presence of ligand. J Biol Chem 280:17880–17890
Feldstein AE, Canbay A, Angulo P, Taniai M, Burgart LJ, Lindor KD, Gores GJ (2003) Hepatocyte apoptosis and Fas expression are prominent features of human nonalcoholic steatohepatitis. Gastroenterology 125:437–443
Feng B, Xu JJ, Bi YA, Mireles R, Davidson R, Duignan DB, Campbell S, Kostrubsky VE, Dunn MC, Smith AR, Wang HF (2009) Role of hepatic transporters in the disposition and hepatotoxicity of a HER2 tyrosine kinase inhibitor CP-724,714. Toxicol Sci 108:492–500
Feoktistova M, Geserick P, Kellert B, Dimitrova DP, Langlais C, Hupe M, Cain K, Macfarlane M, Hacker G, Leverkus M (2011) cIAPs block Ripoptosome formation, a RIP1/caspase-8 containing intracellular cell death complex differentially regulated by cFLIP isoforms. Mol Cell 43:449–463
Fernandez-Salguero PM, Hilbert DM, Rudikoff S, Ward JM, Gonzalez FJ (1996) Aryl-hydrocarbon receptor-deficient mice are resistant to 2,3,7,8-tetrachlorodibenzo-p-dioxin-induced toxicity. Toxicol Appl Pharmacol 140:173–179
Ferreira KS, Kreutz C, Macnelly S, Neubert K, Haber A, Bogyo M, Timmer J, Borner C (2012) Caspase-3 feeds back on caspase-8, Bid and XIAP in type I Fas signaling in primary mouse hepatocytes. Apoptosis 17:503–515
Ferry N, Duplessis O, Houssin D, Danos O, Heard JM (1991) Retroviral-mediated gene transfer into hepatocytes in vivo. Proc Natl Acad Sci USA 88:8377–8381
Fickert P, Fuchsbichler A, Moustafa T, Wagner M, Zollner G, Halilbasic E, Stoger U, Arrese M, Pizarro M, Solis N, Carrasco G, Caligiuri A, Sombetzki M, Reisinger E, Tsybrovskyy O, Zatloukal K, Denk H, Jaeschke H, Pinzani M, Trauner M (2009) Farnesoid X receptor critically determines the fibrotic response in mice but is expressed to a low extent in human hepatic stellate cells and periductal myofibroblasts. Am J Pathol 175:2392–23405
Fiorucci S, Antonelli E, Rizzo G, Renga B, Mencarelli A, Riccardi L, Orlandi S, Pellicciari R, Morelli A (2004) The nuclear receptor SHP mediates inhibition of hepatic stellate cells by FXR and protects against liver fibrosis. Gastroenterology 127:1497–1512
Fiorucci S, Cipriani S, Mencarelli A, Renga B, Distrutti E, Baldelli F (2010) Counter-regulatory role of bile acid activated receptors in immunity and inflammation. Curr Mol Med 10:579–595
Fisher R, Ulreich JB, Nakazato PZ, Brendel K (2001) Histological and biochemical evaluation of precision-cut liver slices. Toxicol Methods (Taylor & Francis, 2001) 11
Fletcher J, Cui W, Samuel K, Black JR, Hannoun Z, Currie IS, Terrace JD, Payne C, Filippi C, Newsome P, Forbes SJ, Ross JA, Iredale JP, Hay DC (2008) The inhibitory role of stromal cell mesenchyme on human embryonic stem cell hepatocyte differentiation is overcome by Wnt3a treatment. Cloning Stem Cells 10:331–339
Fonsato V, Herrera MB, Buttiglieri S, Gatti S, Camussi G, Tetta C (2010) Use of a rotary bioartificial liver in the differentiation of human liver stem cells. Tissue Eng Part C Methods 16:123–132
Forman BM, Goode E, Chen J, Oro AE, Bradley DJ, Perlmann T, Noonan DJ, Burka LT, McMorris T, Lamph WW, Evans RM, Weinberger C (1995) Identification of a nuclear receptor that is activated by farnesol metabolites. Cell 81:687–693
Forman BM, Tzameli I, Choi HS, Chen J, Simha D, Seol W, Evans RM, Moore DD (1998) Androstane metabolites bind to and deactivate the nuclear receptor CAR-beta. Nature 395:612–615
Foster JA, Houston JB, Hallifax D (2012) Comparison of intrinsic clearances in human liver microsomes and suspended hepatocytes from the same donor livers: clearance-dependent relationship and implications for prediction of in vivo clearance. Xenobiotica 41:124–136
Foty RA, Steinberg MS (2005) The differential adhesion hypothesis: a direct evaluation. Dev Biol 278:255–263
Fox TR, Best LL, Goldsworthy SM, Mills JJ, Goldsworthy TL (1993) Gene expression and cell proliferation in rat liver after 2,3,7,8-tetrachlorodibenzo-p-dioxin exposure. Cancer Res 53:2265–22671
Fraczek J, Deleu S, Lukaszuk A, Doktorova T, Tourwe D, Geerts A, Vanhaecke T, Vanderkerken K, Rogiers V (2009) Screening of amide analogues of Trichostatin A in cultures of primary rat hepatocytes: search for potent and safe HDAC inhibitors. Invest New Drugs 27:338–346
Fraczek JE, Vinken M, Tourwe D, Vanhaecke T, Rogiers V (2011) Synergetic effects of DNA demethylation and histone deacetylase inhibition in primary rat hepatocytes. Invest New Drugs 30:1715–1724
Frederick DM, Jacinto EY, Patel NN, Rushmore TH, Tchao R, Harvison PJ (2011) Cytotoxicity of 3-(3,5-dichlorophenyl)-2,4-thiazolidinedione (DCPT) and analogues in wild type and CYP3A4 stably transfected HepG2 cells. Toxicol In Vitro 25:2113–2139
Friedman SL (2004) Mechanisms of disease: Mechanisms of hepatic fibrosis and therapeutic implications. Nat Clin Pract Gastroenterol Hepatol 1:98–105
Friedman SL (2008) Hepatic stellate cells: protean, multifunctional, and enigmatic cells of the liver. Physiol Rev 88:125–172
Friedrich J, Seidel C, Ebner R, Kunz-Schughart LA (2009) Spheroid-based drug screen: considerations and practical approach. Nat Protoc 4:309–324
Fromm MF, Kauffmann HM, Fritz P, Burk O, Kroemer HK, Warzok RW, Eichelbaum M, Siegmund W, Schrenk D (2000) The effect of rifampin treatment on intestinal expression of human MRP transporters. Am J Pathol 157:1575–1580
Fukai F, Suzuki Y, Nishizawa Y, Katayama T (1996) Transcellular biosynthesis of cysteinyl leukotrienes by Kupffer cell-hepatocyte cooperation in rat liver. Cell Biol Int 20:423–428
Fuks F, Hurd PJ, Wolf D, Nan X, Bird AP, Kouzarides T (2003) The methyl-CpG-binding protein MeCP2 links DNA methylation to histone methylation. J Biol Chem 278:4035–4040
Fukuda J, Nakazawa K (2011) Hepatocyte spheroid arrays inside microwells connected with microchannels. Biomicrofluidics 5:22205
Fukuda J, Sakai Y, Nakazawa K (2006) Novel hepatocyte culture system developed using microfabrication and collagen/polyethylene glycol microcontact printing. Biomaterials 27:1061–1070
Fukushima K, Ichimiya H, Higashijima H, Yamashita H, Kuroki S, Chijiiwa K, Tanaka M (1995) Regulation of bile acid synthesis in the rat: relationship between hepatic cholesterol 7 alpha-hydroxylase activity and portal bile acids. J Lipid Res 36:315–321
Funaoka M, Komatsu M, Toyoshima I, Mikami K, Ono T, Hoshino T, Kato J, Kuramitsu T, Ishii T, Masamune O (1999) Tauroursodeoxycholic acid enhances phagocytosis of the cultured rat Kupffer cell. J Gastroenterol Hepatol 14:652–628
Funatsu K, Ijima H, Nakazawa K, Yamashita Y, Shimada M, Sugimachi K (2001) Hybrid artificial liver using hepatocyte organoid culture. Artif Organs 25:194–200
Funk C (2008) The role of hepatic transporters in drug elimination. Expert Opin Drug Metab Toxicol 4:363–379
Gabay C, Kushner I (1999) Acute-phase proteins and other systemic responses to inflammation. N Engl J Med 340:448–454
Gabele E, Muhlbauer M, Dorn C, Weiss TS, Froh M, Schnabl B, Wiest R, Scholmerich J, Obermeier F, Hellerbrand C (2008) Role of TLR9 in hepatic stellate cells and experimental liver fibrosis. Biochem Biophys Res Commun 376:271–276
Gadaleta RM, van Erpecum KJ, Oldenburg B, Willemsen EC, Renooij W, Murzilli S, Klomp LW, Siersema PD, Schipper ME, Danese S, Penna G, Laverny G, Adorini L, Moschetta A, van Mil SW (2011) Farnesoid X receptor activation inhibits inflammation and preserves the intestinal barrier in inflammatory bowel disease. Gut 60:463–472
Galbiati G, Muraca M, Mitry RR, Hughes RD, Lehec SC, Puppi J, Sagias FG, Caruso M, Mieli-Vergani G, Dhawan A (2010) Bilirubin, a physiological antioxidant, can improve cryopreservation of human hepatocytes. J Pediatr Gastroenterol Nutr 50:691–693
Galle J, Loeffler M, Drasdo D (2005) Modeling the effect of deregulated proliferation and apoptosis on the growth dynamics of epithelial cell populations in vitro. Biophys J 88:62–75
Gallenne T, Gautier F, Oliver L, Hervouet E, Noel B, Hickman JA, Geneste O, Cartron PF, Vallette FM, Manon S, Juin P (2009) Bax activation by the BH3-only protein Puma promotes cell dependence on antiapoptotic Bcl-2 family members. J Cell Biol 185:279–290
Gandhi A, Guo T, Ghose R (2010) Role of c-Jun N-terminal kinase (JNK) in regulating tumor necrosis factor-alpha (TNF-alpha) mediated increase of acetaminophen (APAP) and chlorpromazine (CPZ) toxicity in murine hepatocytes. J Toxicol Sci 35:163–173
Gao J, Ann Garulacan J, Storm SM, Hefta SA, Opiteck GJ, Lin JH, Moulin F, Dambach DM (2004) Identification of in vitro protein biomarkers of idiosyncratic liver toxicity. Toxicol In Vitro 18:533–541
Gardemann A, Jahns U, Jungermann K (1991) Control of glycogenolysis and blood flow by arterial and portal norepinephrine in perfused liver. Am J Physiol 260:E762–E771
Gardner OS, Dewar BJ, Earp HS, Samet JM, Graves LM (2003) Dependence of peroxisome proliferator-activated receptor ligand-induced mitogen-activated protein kinase signaling on epidermal growth factor receptor transactivation. J Biol Chem 278:46261–46269
Gascon-Barre M, Demers C, Mirshahi A, Neron S, Zalzal S, Nanci A (2003) The normal liver harbors the vitamin D nuclear receptor in nonparenchymal and biliary epithelial cells. Hepatology 37:1034–1042
Gaudio E, Carpino G, Cardinale V, Franchitto A, Onori P, Alvaro D (2009) New insights into liver stem cells. Dig Liver Dis 41:455–462
Gavathiotis E, Suzuki M, Davis ML, Pitter K, Bird GH, Katz SG, Tu HC, Kim H, Cheng EH, Tjandra N, Walensky LD (2008) BAX activation is initiated at a novel interaction site. Nature 455:1076–1081
Ge NL, Elferink CJ (1998) A direct interaction between the aryl hydrocarbon receptor and retinoblastoma protein. Linking dioxin signaling to the cell cycle. J Biol Chem 273:22708–22713
Gebhardt R (1992) Metabolic zonation of the liver: regulation and implications for liver function. Pharmacol Ther 53:275–354
Gebhardt R (1998) Isolation of periportal and pericentral hepatocytes. In: Phillips IR, Shephard EA (eds) Methods in molecular biology, Vol 107: cytochrome P450 protocols. Humana Press Inc., Totowa, NJ, pp 319–328
Gebhardt R (2002) Co-cultivation of liver epithelial cells with hepatocytes. Methods Mol Biol 188:337–346
Gebhardt R, Mecke D (1979) Permissive effect of dexamethasone on glucagon induction of urea-cycle enzymes in perifused primary monolayer cultures of rat hepatocytes. Eur J Biochem 97:29–35
Gebhardt R, Mecke D (1979) Perifused monolayer cultures of rat hepatocytes as an improved in vitro system for studies on ureogenesis. Exp Cell Res 124:349–359
Gebhardt R, Mecke D (1983) Heterogeneous distribution of glutamine synthetase among rat liver parenchymal cells in situ and in primary culture. Embo J 2:567–570
Gebhardt R, Jonitza D (1991) Different proliferative responses of periportal and perivenous hepatocytes to EGF. Biochem Biophys Res Commun 181:1201–1207
Gebhardt R, Fischer S (1995) Enhanced sensitivity of perifused primary rat hepatocytes to mitogens and growth modulation by carcinogens. Toxicol In Vitro 9:445–451
Gebhardt R, Gaunitz F (1997) Cell-cell interactions in the regulation of the expression of hepatic enzymes. Cell Biol Toxicol 13:263–273
Gebhardt R, Ueberham E (2006) Zonal gene expression in murine liver: are tumors helping us to solve the mystery? Hepatology 44: 512; author reply 512–513
Gebhardt R, Hovhannisyan A (2010) Organ patterning in the adult stage: the role of Wnt/beta-catenin signaling in liver zonation and beyond. Dev Dyn 239:45–55
Gebhardt R, Wegner H, Alber J (1996) Perifusion of co-cultured hepatocytes: optimization of studies on drug metabolism and cytotoxicity in vitro. Cell Biol Toxicol 12:57–68
Gebhardt R, Schuler M, Schorner D (1998) The spontaneous induction of glutamine synthetase in pig hepatocytes cocultured with RL-ET-14 cells is completely inhibited by trijodothyronine and okadaic acid. Biochem Biophys Res Commun 246:895–898
Gebhardt R, Hengstler JG, Muller D, Glockner R, Buenning P, Laube B, Schmelzer E, Ullrich M, Utesch D, Hewitt N, Ringel M, Hilz BR, Bader A, Langsch A, Koose T, Burger HJ, Maas J, Oesch F (2003) New hepatocyte in vitro systems for drug metabolism: metabolic capacity and recommendations for application in basic research and drug development, standard operation procedures. Drug Metab Rev 35:145–213
Geick A, Eichelbaum M, Burk O (2001) Nuclear receptor response elements mediate induction of intestinal MDR1 by rifampin. J Biol Chem 276:14581–14587
Geissmann F, Jung S, Littman DR (2003) Blood monocytes consist of two principal subsets with distinct migratory properties. Immunity 19:71–82
Geissmann F, Manz MG, Jung S, Sieweke MH, Merad M, Ley K (2010) Development of monocytes, macrophages, and dendritic cells. Science 327:656–661
George CL, Lightman SL, Biddie SC (2011) Transcription factor interactions in genomic nuclear receptor function. Epigenomics 3:471–85
Gerbal-Chaloin S, Daujat M, Pascussi JM, Pichard-Garcia L, Vilarem MJ, Maurel P (2002) Transcriptional regulation of CYP2C9 gene. Role of glucocorticoid receptor and constitutive androstane receptor. J Biol Chem 277:209–217
Gerlach JC, Brombacher J, Kloppel K, Schnoy N, Neuhaus P (1994) Comparison of four methods for mass hepatocyte isolation from pig and human livers. Transplantation 57:1318–22
Gerloff T, Meier PJ, Stieger B (1998) Taurocholate induces preferential release of phosphatidylcholine from rat liver canalicular vesicles. Liver 18:306–312
Ghent CN, Carruthers SG (1988) Treatment of pruritus in primary biliary cirrhosis with rifampin. Results of a double-blind, crossover, randomized trial. Gastroenterology 94:488–493
Ghodsizadeh A, Taei A, Totonchi M, Seifinejad A, Gourabi H, Pournasr B, Aghdami N, Malekzadeh R, Almadani N, Salekdeh GH, Baharvand H (2010) Generation of liver disease-specific induced pluripotent stem cells along with efficient differentiation to functional hepatocyte-like cells. Stem Cell Rev 6:622–632
Giacomini KM, Huang SM, Tweedie DJ, Benet LZ, Brouwer KL, Chu X, Dahlin A, Evers R, Fischer V, Hillgren KM, Hoffmaster KA, Ishikawa T, Keppler D, Kim RB, Lee CA, Niemi M, Polli JW, Sugiyama Y, Swaan PW, Ware JA, Wright SH, Yee SW, Zamek-Gliszczynski MJ, Zhang L (2010) Membrane transporters in drug development. Nat Rev Drug Discov 9:215–236
Giera S, Braeuning A, Kohle C, Bursch W, Metzger U, Buchmann A, Schwarz M (2010) Wnt/beta-catenin signaling activates and determines hepatic zonal expression of glutathione S-transferases in mouse liver. Toxicol Sci 115:22–33
Gille C, Bolling C, Hoppe A, Bulik S, Hoffmann S, Hubner K, Karlstadt A, Ganeshan R, Konig M, Rother K, Weidlich M, Behre J, Holzhutter HG (2010) HepatoNet1: a comprehensive metabolic reconstruction of the human hepatocyte for the analysis of liver physiology. Mol Syst Biol 6:411
Gillette BM, Rossen NS, Das N, Leong D, Wang M, Dugar A, Sia SK (2011) Engineering extracellular matrix structure in 3D multiphase tissues. Biomaterials 32:8067–8076
Glaeser H, Bailey DG, Dresser GK, Gregor JC, Schwarz UI, McGrath JS, Jolicoeur E, Lee W, Leake BF, Tirona RG, Kim RB (2007) Intestinal drug transporter expression and the impact of grapefruit juice in humans. Clin Pharmacol Ther 81:362–370
Glaser SS, Gaudio E, Miller T, Alvaro D, Alpini G (2009) Cholangiocyte proliferation and liver fibrosis. Expert Rev Mol Med 11:e7
Glicklis R, Shapiro L, Agbaria R, Merchuk JC, Cohen S (2000) Hepatocyte behavior within three-dimensional porous alginate scaffolds. Biotechnol Bioeng 67:344–353
Gnerre C, Blattler S, Kaufmann MR, Looser R, Meyer UA (2004) Regulation of CYP3A4 by the bile acid receptor FXR: evidence for functional binding sites in the CYP3A4 gene. Pharmacogenetics 14:635–645
Gobinet J, Auzou G, Nicolas JC, Sultan C, Jalaguier S (2001) Characterization of the interaction between androgen receptor and a new transcriptional inhibitor, SHP. Biochemistry 40:15369–15377
Godoy P, Hengstler JG, Ilkavets I, Meyer C, Bachmann A, Muller A, Tuschl G, Mueller SO, Dooley S (2009) Extracellular matrix modulates sensitivity of hepatocytes to fibroblastoid dedifferentiation and transforming growth factor beta-induced apoptosis. Hepatology 49:2031–2043
Godoy P, Schug M, Bauer A, Hengstler JG (2010) Reversible manipulation of apoptosis sensitivity in cultured hepatocytes by matrix-mediated manipulation of signaling activities. Methods Mol Biol 640:139–155
Gohla A, Klement K, Piekorz RP, Pexa K, Vom Dahl S, Spicher K, Dreval V, Häussinger D, Birnbaumer L, Nurnberg B (2007) An obligatory requirement for the heterotrimeric G protein Gi3 in the antiautophagic action of insulin in the liver. Proc Natl Acad Sci USA 104:3003–3008
Goldin RD, Ratnayaka ID, Breach CS, Brown IN, Wickramasinghe SN (1996) Role of macrophages in acetaminophen (paracetamol)-induced hepatotoxicity. J Pathol 179:432–435
Goldring CE, Kitteringham NR, Jenkins R, Lovatt CA, Randle LE, Abdullah A, Owen A, Liu X, Butler PJ, Williams DP, Metcalfe P, Berens C, Hillen W, Foster B, Simpson A, McLellan L, Park BK (2006) Development of a transactivator in hepatoma cells that allows expression of phase I, phase II, and chemical defense genes. Am J Physiol Cell Physiol 290:C104–C115
Gomez-Duran A, Carvajal-Gonzalez JM, Mulero-Navarro S, Santiago-Josefat B, Puga A, Fernandez-Salguero PM (2009) Fitting a xenobiotic receptor into cell homeostasis: how the dioxin receptor interacts with TGFbeta signaling. Biochem Pharmacol 77:700–712
Gomez-Lechón MJ, Lopez P, Castell JV (1984) Biochemical functionality and recovery of hepatocytes after deep freezing storage. In Vitro 20:826–832
Gomez-Lechón MJ, Jover R, Donato T, Ponsoda X, Rodriguez C, Stenzel KG, Klocke R, Paul D, Guillen I, Bort R, Castell JV (1998) Long-term expression of differentiated functions in hepatocytes cultured in three-dimensional collagen matrix. J Cell Physiol 177:553–562
Gomez-Lechón MJ, Donato MT, Castell JV, Jover R (2003) Human hepatocytes as a tool for studying toxicity and drug metabolism. Curr Drug Metab 4:292–312
Gomez-Lechón MJ, Lahoz A, Jimenez N, V J, Donato MT (2006) Cryopreservation of rat, dog and human hepatocytes: influence of preculture and cryoprotectants on recovery, cytochrome P450 activities and induction upon thawing. Xenobiotica 36:457–472
Gomez-Lechón MJ, Lahoz A, Jimenez N, Bonora A, Castell JV, Donato MT (2008) Evaluation of drug-metabolizing and functional competence of human hepatocytes incubated under hypothermia in different media for clinical infusion. Cell Transplant 17:887–897
Gomez-Lechón MJ, Castell JV, Donato MT (2010) The use of hepatocytes to investigate drug toxicity. Methods Mol Biol 640:389–415
Gomez-Lechón MJ, Lahoz A, Gombau L, Castell JV, Donato MT (2010) In vitro evaluation of potential hepatotoxicity induced by drugs. Curr Pharm Des 16:1963–1977
Gonzalez FJ, Aoyama T, Gelboin HV (1991) Expression of mammalian cytochrome P450 using vaccinia virus. Methods Enzymol 206:85–92
Gonzalez FJ, Kimura S, Tamura S, Gelboin HV (1991) Expression of mammalian cytochrome P450 using baculovirus. Methods Enzymol 206:93–99
Gonzalez FJ, Korzekwa KR (1995) Cytochromes P450 expression systems. Annu Rev Pharmacol Toxicol 35:369–390
Gonzalez FJ, Fernandez-Salaguero P (1998) The aryl hydrocarbon receptor: studies using the AHR-null mice. Drug Metab Dispos 26:1194–1198
Gonzalez FJ, Fernandez-Salguero P, Ward JM (1996) The role of the aryl hydrocarbon receptor in animal development, physiological homeostasis and toxicity of TCDD. J Toxicol Sci 21:273–277
Gonzalez HE, Eugenin EA, Garces G, Solis N, Pizarro M, Accatino L, Saez JC (2002) Regulation of hepatic connexins in cholestasis: possible involvement of Kupffer cells and inflammatory mediators. Am J Physiol Gastrointest Liver Physiol 282:G991–G1001
Gonzalo T, Beljaars L, van de Bovenkamp M, Temming K, van Loenen AM, Reker-Smit C, Meijer DK, Lacombe M, Opdam F, Keri G, Orfi L, Poelstra K, Kok RJ (2007) Local inhibition of liver fibrosis by specific delivery of a platelet-derived growth factor kinase inhibitor to hepatic stellate cells. J Pharmacol Exp Ther 321:856–865
Goodwin B, Jones SA, Price RR, Watson MA, McKee DD, Moore LB, Galardi C, Wilson JG, Lewis MC, Roth ME, Maloney PR, Willson TM, Kliewer SA (2000) A regulatory cascade of the nuclear receptors FXR, SHP-1, and LRH-1 represses bile acid biosynthesis. Mol Cell 6:517–526
Goodwin B, Redinbo MR, Kliewer SA (2002) Regulation of cyp3a gene transcription by the pregnane x receptor. Annu Rev Pharmacol Toxicol 42:1–23
Goodwin B, Gauthier KC, Umetani M, Watson MA, Lochansky MI, Collins JL, Leitersdorf E, Mangelsdorf DJ, Kliewer SA, Repa JJ (2003) Identification of bile acid precursors as endogenous ligands for the nuclear xenobiotic pregnane X receptor. Proc Natl Acad Sci USA 100:223–228
Goral VN, Hsieh YC, Petzold ON, Clark JS, Yuen PK, Faris RA (2010) Perfusion-based microfluidic device for three-dimensional dynamic primary human hepatocyte cell culture in the absence of biological or synthetic matrices or coagulants. Lab Chip 10:3380–6
Gordon S (2003) Alternative activation of macrophages. Nat Rev Immunol 3:23–35
Gore SD (2009) In vitro basis for treatment with hypomethylating agents and histone deacetylase inhibitors: can epigenetic changes be used to monitor treatment? Leuk Res 33(Suppl 2):S2–S6
Goren I, Allmann N, Yogev N, Schurmann C, Linke A, Holdener M, Waisman A, Pfeilschifter J, Frank S (2009) A transgenic mouse model of inducible macrophage depletion: effects of diphtheria toxin-driven lysozyme M-specific cell lineage ablation on wound inflammatory, angiogenic, and contractive processes. Am J Pathol 175:132–147
Gores GJ, Kost LJ, Larusso NF (1986) The isolated perfused rat liver: conceptual and practical considerations. Hepatology 6:511–517
Goulet F, Normand C, Morin O (1988) Cellular interactions promote tissue-specific function, biomatrix deposition and junctional communication of primary cultured hepatocytes. Hepatology 8:1010–1018
Gradhand U, Lang T, Schaeffeler E, Glaeser H, Tegude H, Klein K, Fritz P, Jedlitschky G, Kroemer HK, Bachmakov I, Anwald B, Kerb R, Zanger UM, Eichelbaum M, Schwab M, Fromm MF (2008) Variability in human hepatic MRP4 expression: influence of cholestasis and genotype. Pharmacogenomics J 8:42–52
Graf D, Bode J (2012) Modulation of innate immunity and inflammation by bile acids and their receptors. In: Häussinger D, Keitel V, Kubitz R (eds) Hepatobiliary transport in health and disease. DeGruyter Publishing, Berlin, pp 103–116
Graham MJ, Lucier GW, Linko P, Maronpot RR, Goldstein JA (1988) Increases in cytochrome P-450 mediated 17 beta-estradiol 2-hydroxylase activity in rat liver microsomes after both acute administration and subchronic administration of 2,3,7,8-tetrachlorodibenzo-p-dioxin in a two-stage hepatocarcinogenesis model. Carcinogenesis 9:1935–1941
Green DR, Kroemer G (2004) The pathophysiology of mitochondrial cell death. Science 305:626–629
Gridelli B, Vizzini G, Pietrosi G, Luca A, Spada M, Gruttadauria S, Cintorino D, Amico G, Chinnici C, Miki T, Schmelzer E, Conaldi PG, Triolo F, Gerlach JC (2012) Efficient human fetal liver cell isolation protocol based on vascular perfusion for liver cell-based therapy and case report on cell transplantation. Liver Transpl 18:226–237
Griffin SJ, Houston JB (2004) Comparison of fresh and cryopreserved rat hepatocyte suspensions for the prediction of in vitro intrinsic clearance. Drug Metab Dispos 32:552–558
Griffith LG, Wu B, Cima MJ, Powers MJ, Chaignaud B, Vacanti JP (1997) In vitro organogenesis of liver tissue. Ann N Y Acad Sci 831:382–397
Griffiths GJ, Dubrez L, Morgan CP, Jones NA, Whitehouse J, Corfe BM, Dive C, Hickman JA (1999) Cell damage-induced conformational changes of the pro-apoptotic protein Bak in vivo precede the onset of apoptosis. J Cell Biol 144:903–914
Grime K, Webborn PJ, Riley RJ (2008) Functional consequences of active hepatic uptake on cytochrome P450 inhibition in rat and human hepatocytes. Drug Metab Dispos 36:1670–1678
Grisham JW (1997) Interspecies comparison of liver carcinogenesis: implications for cancer risk assessment. Carcinogenesis 18:59–81
Grondin M, Hamel F, Averill-Bates DA, Sarhan F (2009) Wheat proteins improve cryopreservation of rat hepatocytes. Biotechnol Bioeng 103:582–591
Groothuis GM, Hardonk MJ, Keulemans KP, Nieuwenhuis P, Meijer DK (1982) Autoradiographic and kinetic demonstration of acinar heterogeneity of taurocholate transport. Am J Physiol 243(6):G455–G462
Groothuis GM, Keulemans KP, Hardonk MJ, Meijer DK (1983) Acinar heterogeneity in hepatic transport of dibromosulfophthalein and ouabain studied by autoradiography, normal and retrograde perfusions and computer simulation. Biochem Pharmacol 32(20):3069–3078
Grover A, Benet LZ (2010) Transporter-based drug–drug interactions and their effect on distribution volumes. Springer, Berlin
Guguen-Guillouzo C, Guillouzo A (2010) General review on in vitro hepatocyte models and their applications. Methods Mol Biol 640:1–40
Guguen-Guillouzo C, Campion JP, Brissot P, Glaise D, Launois B, Bourel M, Guillouzo A (1982) High yield preparation of isolated human adult hepatocytes by enzymatic perfusion of the liver. Cell Biol Int Rep 6:625–628
Guguen-Guillouzo C, Clement B, Baffet G, Beaumont C, Morel-Chany E, Glaise D, Guillouzo A (1983) Maintenance and reversibility of active albumin secretion by adult rat hepatocytes co-cultured with another liver epithelial cell type. Exp Cell Res 143:47–54
Guicciardi ME, Gores GJ (2009) Life and death by death receptors. Faseb J 23:1625–1637
Guillouzo A, Corlu A, Aninat C, Glaise D, Morel F, Guguen-Guillouzo C (2007) The human hepatoma HepaRG cells: a highly differentiated model for studies of liver metabolism and toxicity of xenobiotics. Chem Biol Interact 168:66–73
Guillouzo A, Rialland L, Fautrel A, Guyomard C (1999) Survival and function of isolated hepatocytes after cryopreservation. Chem Biol Interact 121:7–16
Gunther C, Martini E, Wittkopf N, Amann K, Weigmann B, Neumann H, Waldner MJ, Hedrick SM, Tenzer S, Neurath MF, Becker C (2011) Caspase-8 regulates TNF-alpha-induced epithelial necroptosis and terminal ileitis. Nature 477:335–339
Guo C, Sah JF, Beard L, Willson JK, Markowitz SD, Guda K (2008) The noncoding RNA, miR-126, suppresses the growth of neoplastic cells by targeting phosphatidylinositol 3-kinase signaling and is frequently lost in colon cancers. Genes Chromosomes Cancer 47:939–946
Guo GL, Lambert G, Negishi M, Ward JM, Brewer HB Jr, Kliewer SA, Gonzalez FJ, Sinal CJ (2003) Complementary roles of farnesoid X receptor, pregnane X receptor, and constitutive androstane receptor in protection against bile acid toxicity. J Biol Chem 278:45062–45071
Guyot C, Lepreux S, Combe C, Sarrazy V, Billet F, Balabaud C, Bioulac-Sage P, Desmouliere A (2010) Fibrogenic cell phenotype modifications during remodelling of normal and pathological human liver in cultured slices. Liver Int 30:1529–1540
Guyot C, Stieger B (2011) Interaction of bile salts with rat canalicular membrane vesicles: evidence for bile salt resistant microdomains. J Hepatol 55:1368–1376
Hadi M, Chen Y, Starokozhko V, Merema MT, Groothuis GM (2012) Mouse precision-cut liver slices as an ex vivo model to study idiosyncratic drug-induced liver injury. Chem Res Toxicol 25(9):1938–1947
Hadi M, Westra IM, Starokozhko V, Dragovic S, Merema MT, Groothuis GM (2013) Human precision-cut liver slices as an ex vivo model to study idiosyncratic drug-induced liver injury. Chem Res Toxicol 26(5):710–720
Haenisch S, Laechelt S, Bruckmueller H, Werk A, Noack A, Bruhn O, Remmler C, Cascorbi I (2011) Down-regulation of ATP-binding cassette C2 protein expression in HepG2 cells after rifampicin treatment is mediated by microRNA-379. Mol Pharmacol 80:314–320
Hagenbuch B, Gui C (2008) Xenobiotic transporters of the human organic anion transporting polypeptides (OATP) family. Xenobiotica 38:778–801
Hagenbuch B, Meier PJ (1994) Molecular cloning, chromosomal localization, and functional characterization of a human liver Na +/bile acid cotransporter. J Clin Invest 93:1326–1331
Hagenbuch B, Meier PJ (2004) Organic anion transporting polypeptides of the OATP/ SLC21 family: phylogenetic classification as OATP/ SLCO superfamily, new nomenclature and molecular/functional properties. Pflugers Arch 447:653–665
Hagenbuch B, Scharschmidt BF, Meier PJ (1996) Effect of antisense oligonucleotides on the expression of hepatocellular bile acid and organic anion uptake systems in Xenopus laevis oocytes. Biochem J 316(Pt 3):901–904
Hagenbuch B, Stieger B, Foguet M, Lubbert H, Meier PJ (1991) Functional expression cloning and characterization of the hepatocyte Na +/bile acid cotransport system. Proc Natl Acad Sci USA 88:10629–10633
Hagens WI, Olinga P, Meijer DK, Groothuis GM, Beljaars L, Poelstra K (2006) Gliotoxin non-selectively induces apoptosis in fibrotic and normal livers. Liver Int 26:232–239
Haggart CR, Bartell JA, Saucerman JJ, Papin JA (2011) Whole-genome metabolic network reconstruction and constraint-based modeling. Methods Enzymol 500:411–433
Hailey JR, Walker NJ, Sells DM, Brix AE, Jokinen MP, Nyska A (2005) Classification of proliferative hepatocellular lesions in Harlan Sprague-Dawley rats chronically exposed to dioxin-like compounds. Toxicol Pathol 33:165–174
Hailfinger S, Jaworski M, Braeuning A, Buchmann A, Schwarz M (2006) Zonal gene expression in murine liver: lessons from tumors. Hepatology 43:407–414
Hakansson H, Hanberg A (1989) The distribution of [14C]-2,3,7,8-tetrachlorodibenzo-p-dioxin (TCDD) and its effect on the vitamin A content in parenchymal and stellate cells of rat liver. J Nutr 119:573–580
Hallifax D, Foster JA, Houston JB (2010) Prediction of human metabolic clearance from in vitro systems: retrospective analysis and prospective view. Pharm Res 27:2150–2161
Hallifax D, Houston JB (2006) Uptake and intracellular binding of lipophilic amine drugs by isolated rat hepatocytes and implications for prediction of in vivo metabolic clearance. Drug Metab Dispos 34:1829–1836
Hallifax D, Houston JB (2009) Methodological uncertainty in quantitative prediction of human hepatic clearance from in vitro experimental systems. Curr Drug Metab 10:307–321
Hallifax D, Foster JA, Houston JB (2010) Prediction of human metabolic clearance from in vitro systems: retrospective analysis and prospective view. Pharm Res 27:2150–2161
Hallifax D, Houston JB (2012) Evaluation of hepatic clearance prediction using in vitro data: Emphasis on fraction unbound in plasma and drug ionisation using a database of 107 drugs. J Pharm Sci 101:2645–2652
Hallifax D, Turlizzi E, Zanelli U, Houston JB (2012) Clearance-dependent underprediction of in vivo intrinsic clearance from human hepatocytes: comparison with permeabilities from artificial membrane (PAMPA) assay, in silico and caco-2 assay, for 65 drugs. Eur J Pharm Sci 45:570–574
Halliwell B (2003) Oxidative stress in cell culture: an under-appreciated problem? FEBS Lett 540:3–6
Halmos B, Szalay F, Cserniczky T, Nemesanszky E, Lakatos P, Barlage S, Schmitz G, Romics L, Csaszar A (2000) Association of primary biliary cirrhosis with vitamin D receptor BsmI genotype polymorphism in a Hungarian population. Dig Dis Sci 45:1091–1095
Hamada A, Sissung T, Price DK, Danesi R, Chau CH, Sharifi N, Venzon D, Maeda K, Nagao K, Sparreboom A, Mitsuya H, Dahut WL, Figg WD (2008) Effect of SLCO1B3 haplotype on testosterone transport and clinical outcome in Caucasian patients with androgen-independent prostatic cancer. Clin Cancer Res 14:3312–3318
Hamada E, Nishida T, Uchiyama Y, Nakamura J, Isahara K, Kazuo H, Huang TP, Momoi T, Ito T, Matsuda H (1999) Activation of Kupffer cells and caspase-3 involved in rat hepatocyte apoptosis induced by endotoxin. J Hepatol 30:807–818
Hamadeh HK, Bushel PR, Jayadev S, Disorbo O, Bennett L, Li L, Tennant R, Stoll R, Barrett JC, Paules RS, Blanchard K, Afshari CA (2002) Prediction of compound signature using high density gene expression profiling. Toxicol Sci 67:232–240
Hamadeh HK, Bushel PR, Jayadev S, Martin K, Disorbo O, Sieber S, Bennett L, Tennant R, Stoll R, Barrett JC, Blanchard K, Paules RS, Afshari CA (2002) Gene expression analysis reveals chemical-specific profiles. Toxicol Sci 67:219–231
Hamilton GA, Jolley SL, Gilbert D, Coon DJ, Barros S, Lecluyse EL (2001) Regulation of cell morphology and cytochrome P450 expression in human hepatocytes by extracellular matrix and cell-cell interactions. Cell Tissue Res 306:85–99
Hammond JS, Beckingham IJ, Shakesheff KM (2006) Scaffolds for liver tissue engineering. Expert Rev Med Devices 3:21–27
Han S, Chiang JY (2009) Mechanism of vitamin D receptor inhibition of cholesterol 7alpha-hydroxylase gene transcription in human hepatocytes. Drug Metab Dispos 37:469–478
Hanafy S, El-Kadi AO, Jamali F (2012) Effect of inflammation on molecular targets and drug transporters. J Pharm Pharm Sci 15(3):361–375
Hang H, Shi X, Gu G, Wu Y, Gu J, Ding Y (2010) In vitro analysis of cryopreserved alginate-poly-L-lysine-alginate-microencapsulated human hepatocytes. Liver Int 30:611–622
Hardonk MJ, Dijkhuis FW, Hulstaert CE, Koudstaal J (1992) Heterogeneity of rat liver and spleen macrophages in gadolinium chloride-induced elimination and repopulation. J Leukoc Biol 52:296–302
Harris CL, Toner M, Hubel A, Cravalho EG, Yarmush ML, Tompkins RG (1991) Cryopreservation of isolated hepatocytes: intracellular ice formation under various chemical and physical conditions. Cryobiology 28:436–444
Hartmann H, Beckh K, Jungermann K (1982) Direct control of glycogen metabolism in the perfused rat liver by the sympathetic innervation. Eur J Biochem 123:521–526
Hasirci V, Berthiaume F, Bondre SP, Gresser JD, Trantolo DJ, Toner M, Wise DL (2001) Expression of liver-specific functions by rat hepatocytes seeded in treated poly(lactic-co-glycolic) acid biodegradable foams. Tissue Eng 7:385–394
Hassoun EA, Li F, Abushaban A, Stohs SJ (2000) The relative abilities of TCDD and its congeners to induce oxidative stress in the hepatic and brain tissues of rats after subchronic exposure. Toxicology 145:103–113
Häussinger D (1983) Hepatocyte heterogeneity in glutamine and ammonia metabolism and the role of an intercellular glutamine cycle during ureogenesis in perfused rat liver. Eur J Biochem 133:269–275
Häussinger D (1986) Urea synthesis and CO2/HCO3- compartmentation in isolated perfused rat liver. Biol Chem Hoppe Seyler 367:741–750
Häussinger D (1987) Isolated perfused rat liver: an experimental model for studies on ammonium and amino acid metabolism. Infusionsther Klin Ernahr 14:174–178
Häussinger D (2012) Bile acid signaling in the liver and the biliary tree. In: Häussinger D, Keitel V, Kubitz R (eds) Hepatobiliary transport in health and disease. DeGruyter Publishing, Berlin, pp 85–102
Häussinger D, Gerok W (1984) Hepatocyte heterogeneity in ammonia metabolism: impairment of glutamine synthesis in CCl4 induced liver cell necrosis with no effect on urea synthesis. Chem Biol Interact 48:191–194
Häussinger D, Stehle T (1988) Hepatocyte heterogeneity in response to eicosanoids. The perivenous scavenger cell hypothesis. Eur J Biochem 175:395–403
Häussinger D, Kaiser S, Stehle T, Gerok W (1986) Liver carbonic anhydrase and urea synthesis. The effect of diuretics. Biochem Pharmacol 35:3317–3322
Häussinger D, Stehle T, Gerok W, Sies H (1987) Perivascular nerve stimulation and phenylephrine responses in rat liver. Metabolic effects, Ca2+ and K+ fluxes. Eur J Biochem 163:197–203
Häussinger D, Kurz AK, Wettstein M, Graf D, Vom DAHLS, Schliess F (2003) Involvement of integrins and Src in tauroursodeoxycholate-induced and swelling-induced choleresis. Gastroenterology 124(5):1476–187
Häussinger D, Reinehr R, Keitel V (2012) Bile acid signaling in the liver and the biliary tree. In: Häussinger D, Keitel V, Kubitz R (eds) Hepatobiliary Transport in Health and Disease. DeGruyter Publishing, Berlin, pp 85–102
Haws LC, Su SH, Harris M, Devito MJ, Walker NJ, Farland WH, Finley B, Birnbaum LS (2006) Development of a refined database of mammalian relative potency estimates for dioxin-like compounds. Toxicol Sci 89:4–30
He XX, Chang Y, Meng FY, Wang MY, Xie QH, Tang F, Li PY, Song YH, Lin JS (2011) MicroRNA-375 targets AEG-1 in hepatocellular carcinoma and suppresses liver cancer cell growth in vitro and in vivo. Oncogene 31:3357–3369
He Y, Sadahiro T, Noh SI, Wang H, Todo T, Chai NN, Klein AS, Wu GD (2009) Flow cytometric isolation and phenotypic characterization of two subsets of ED2(+) (CD163) hepatic macrophages in rats. Hepatol Res 39:1208–1218
Hebbes TR, Thorne AW, Crane-Robinson C (1988) A direct link between core histone acetylation and transcriptionally active chromatin. Embo J 7:1395–1402
Hediger MA, Romero MF, Peng JB, Rolfs A, Takanaga H, Bruford EA (2004) The ABCs of solute carriers: physiological, pathological and therapeutic implications of human membrane transport proteins. Introduction. Pflugers Arch 447:465–468
Heinaniemi M, Uski JO, Degenhardt T, Carlberg C (2007) Meta-analysis of primary target genes of peroxisome proliferator-activated receptors. Genome Biol 8:R147
Heise T, Schug M, Storm D, Ellinger-Ziegelbauer H, Ahr HJ, Hellwig B, Rahnenfuhrer J, Ghallab A, Guenther G, Sisnaiske J, Reif R, Godoy P, Mielke H, Gundert-Remy U, Lampen A, Oberemm A, Hengstler JG (2012) In vitro—in vivo correlation of gene expression alterations induced by liver carcinogens. Curr Med Chem 19:1721–1730
Heldring N, Pike A, Andersson S, Matthews J, Cheng G, Hartman J, Tujague M, Strom A, Treuter E, Warner M, Gustafsson JA (2007) Estrogen receptors: how do they signal and what are their targets. Physiol Rev 87:905–931
Hendriks B, Reichmann E (2002) Wnt signaling: a complex issue. Biol Res 35:277–286
Hengstler JG, Brulport M, Schormann W, Bauer A, Hermes M, Nussler AK, Fandrich F, Ruhnke M, Ungefroren H, Griffin L, Bockamp E, Oesch F, von Mach MA (2005) Generation of human hepatocytes by stem cell technology: definition of the hepatocyte. Expert Opin Drug Metab Toxicol 1:61–74
Hengstler JG, Ringel M, Biefang K, Hammel S, Milbert U, Gerl M, Klebach M, Diener B, Platt KL, Bottger T, Steinberg P, Oesch F (2000) Cultures with cryopreserved hepatocytes: applicability for studies of enzyme induction. Chem Biol Interact 125:51–73
Hengstler JG, Utesch D, Steinberg P, Platt KL, Diener B, Ringel M, Swales N, Fischer T, Biefang K, Gerl M, Bottger T, Oesch F (2000) Cryopreserved primary hepatocytes as a constantly available in vitro model for the evaluation of human and animal drug metabolism and enzyme induction. Drug Metab Rev 32:81–118
Henkens T, Papeleu P, Elaut G, Vinken M, Rogiers V, Vanhaecke T (2007) Trichostatin A, a critical factor in maintaining the functional differentiation of primary cultured rat hepatocytes. Toxicol Appl Pharmacol 218:64–71
Henkens T, Vinken M, Lukaszuk A, Tourwe D, Vanhaecke T, Rogiers V (2008) Differential effects of hydroxamate histone deacetylase inhibitors on cellular functionality and gap junctions in primary cultures of mitogen-stimulated hepatocytes. Toxicol Lett 178:37–43
Herrera MB, Bruno S, Buttiglieri S, Tetta C, Gatti S, Deregibus MC, Bussolati B, Camussi G (2006) Isolation and characterization of a stem cell population from adult human liver. Stem Cells 24:2840–2850
Hespeling U, Jungermann K, Puschel GP (1995) Feedback-inhibition of glucagon-stimulated glycogenolysis in hepatocyte/Kupffer cell cocultures by glucagon-elicited prostaglandin production in Kupffer cells. Hepatology 22:1577–1583
Hewitt NJ (2010) Optimisation of the cryopreservation of primary hepatocytes. Methods Mol Biol 640:83–105
Hewitt NJ, Lechon MJ, Houston JB, Hallifax D, Brown HS, Maurel P, Kenna JG, Gustavsson L, Lohmann C, Skonberg C, Guillouzo A, Tuschl G, Li AP, Lecluyse E, Groothuis GM, Hengstler JG (2007) Primary hepatocytes: current understanding of the regulation of metabolic enzymes and transporter proteins, and pharmaceutical practice for the use of hepatocytes in metabolism, enzyme induction, transporter, clearance, and hepatotoxicity studies. Drug Metab Rev 39:159–234
Higashiyama H, Kinoshita M, Asano S (2008) Immunolocalization of farnesoid X receptor (FXR) in mouse tissues using tissue microarray. Acta Histochem 110:86–93
Higuchi H, Bronk SF, Takikawa Y, Werneburg N, Takimoto R, El-Deiry W, Gores GJ (2001) The bile acid glycochenodeoxycholate induces trail-receptor 2/DR5 expression and apoptosis. J Biol Chem 276:38610–38618
Hirano M, Maeda K, Hayashi H, Kusuhara H, Sugiyama Y (2005) Bile salt export pump (BSEP/ABCB11) can transport a nonbile acid substrate, pravastatin. J Pharmacol Exp Ther 314:876–882
Hirata K, Takagi H, Yamamoto M, Matsumoto T, Nishiya T, Mori K, Shimizu S, Masumoto H, Okutani Y (2008) Ticlopidine-induced hepatotoxicity is associated with specific human leukocyte antigen genomic subtypes in Japanese patients: a preliminary case-control study. Pharmacogenomics J 8(1):29–33
Hirohashi T, Suzuki H, Ito K, Ogawa K, Kume K, Shimizu T, Sugiyama Y (1998) Hepatic expression of multidrug resistance-associated protein-like proteins maintained in Eisai hyperbilirubinemic rats. Mol Pharmacol 53:1068–1075
Hirohashi T, Suzuki H, Takikawa H, Sugiyama Y (2000) ATP-dependent transport of bile salts by rat multidrug resistance-associated protein 3 (Mrp3). J Biol Chem 275:2905–2910
Ho CT, Lin RZ, Chang WY, Chang HY, Liu CH (2006) Rapid heterogeneous liver-cell on-chip patterning via the enhanced field-induced dielectrophoresis trap. Lab Chip 6:724–734
Ho RH, Tirona RG, Leake BF, Glaeser H, Lee W, Lemke CJ, Wang Y, Kim RB (2006) Drug and bile acid transporters in rosuvastatin hepatic uptake: function, expression, and pharmacogenetics. Gastroenterology 130:1793–1806
Hochachka PW (1986) Defense strategies against hypoxia and hypothermia. Science 231:234–241
Hoebe KH, Witkamp RF, Fink-Gremmels J, van Miert AS, Monshouwer M (2001) Direct cell-to-cell contact between Kupffer cells and hepatocytes augments endotoxin-induced hepatic injury. Am J Physiol Gastrointest Liver Physiol 280:G720–G728
Hoehme S, Brulport M, Bauer A, Bedawy E, Schormann W, Hermes M, Puppe V, Gebhardt R, Zellmer S, Schwarz M, Bockamp E, Timmel T, Hengstler JG, Drasdo D (2010) Prediction and validation of cell alignment along microvessels as order principle to restore tissue architecture in liver regeneration. Proc Natl Acad Sci USA 107:10371–10376
Hoehme S, Hengstlerb JG, Brulportb M, Schäferc M, Bauerb A, Drasdoa D (2007) Mathematical modelling of liver regeneration after intoxication with CCl4. Chem Biol Interact 168:74–93
Hoffmaster KA, Turncliff RZ, Lecluyse EL, Kim RB, Meier PJ, Brouwer KL (2004) P-glycoprotein expression, localization, and function in sandwich-cultured primary rat and human hepatocytes: relevance to the hepatobiliary disposition of a model opioid peptide. Pharm Res 21:1294–1302
Hofmann AF (2009) The enterohepatic circulation of bile acids in mammals: form and functions. Front Biosci 14:2584–98
Hofmann AF, Small DM (1967) Detergent properties of bile salts: correlation with physiological function. Annu Rev Med 18:333–376
Hogan BL (1999) Morphogenesis. Cell 96:225–233
Hollister SJ (2005) Porous scaffold design for tissue engineering. Nat Mater 4:518–524
Holownia A, Braszko JJ (2004) Tamoxifen cytotoxicity in hepatoblastoma cells stably transfected with human CYP3A4. Biochem Pharmacol 67:1057–1064
Holstein A, Beil W (2009) Oral antidiabetic drug metabolism: pharmacogenomics and drug interactions. Expert Opin Drug Metab Toxicol 5:225–241
Holt MP, Cheng L, Ju C (2008) Identification and characterization of infiltrating macrophages in acetaminophen-induced liver injury. J Leukoc Biol 84:1410–1421
Holt MP, Ju C (2006) Mechanisms of drug-induced liver injury. Aaps J 8:E48–E54
Holy CE, Shoichet MS, Davies JE (2000) Engineering three-dimensional bone tissue in vitro using biodegradable scaffolds: investigating initial cell-seeding density and culture period. J Biomed Mater Res 51:376–382
Holzhutter HG (2004) The principle of flux minimization and its application to estimate stationary fluxes in metabolic networks. Eur J Biochem 271:2905–2922
Holzhutter HG, Drasdo D, Preusser T, Lippert J, Henney AM (2012) The virtual liver: a multidisciplinary, multilevel challenge for systems biology. Wiley Interdiscip Rev Syst Biol Med 4:221–235
Hong SR, Lee YM, Akaike T (2003) Evaluation of a galactose-carrying gelatin sponge for hepatocytes culture and transplantation. J Biomed Mater Res A 67:733–741
Hong JY, Lebofsky M, Farhood A, Jaeschke H (2009) Oxidant stress-induced liver injury in vivo: role of apoptosis, oncotic necrosis, and c-Jun NH2-terminal kinase activation. Am J Physiol Gastrointest Liver Physiol 296:G572–G5781
Hosomi H, Akai S, Minami K, Yoshikawa Y, Fukami T, Nakajima M, Yokoi T (2010) An in vitro drug-induced hepatotoxicity screening system using CYP3A4-expressing and gamma-glutamylcysteine synthetase knockdown cells. Toxicol In Vitro 24:1032–1038
Hosomi H, Fukami T, Iwamura A, Nakajima M, Yokoi T (2011) Development of a highly sensitive cytotoxicity assay system for CYP3A4-mediated metabolic activation. Drug Metab Dispos 39:1388–1395
Hou YT, Ijima H, Matsumoto S, Kubo T, Takei T, Sakai S, Kawakami K (2010) Effect of a hepatocyte growth factor/heparin-immobilized collagen system on albumin synthesis and spheroid formation by hepatocytes. J Biosci Bioeng 110:208–216
Hou YT, Ijima H, Takei T, Kawakami K (2011) Growth factor/heparin-immobilized collagen gel system enhances viability of transplanted hepatocytes and induces angiogenesis. J Biosci Bioeng 112:265–272
Houston JB (1994) Utility of in vitro drug metabolism data in predicting in vivo metabolic clearance. Biochem Pharmacol 47:1469–1479
Houston JB, Carlile DJ (1997) Prediction of hepatic clearance from microsomes, hepatocytes, and liver slices. Drug Metab Rev 29:891–922
Houston JB, Galetin A (2010) In vitro techniques to study drug-drug interactions of drug metabolism: cytochrome p450. Springer, New York
Houten SM, Volle DH, Cummins CL, Mangelsdorf DJ, Auwerx J (2007) In vivo imaging of farnesoid X receptor activity reveals the ileum as the primary bile acid signaling tissue. Mol Endocrinol 21:1312–323
Howard M, Jiang X, Stolz DB, Hill WG, Johnson JA, Watkins SC, Frizzell RA, Bruton CM, Robbins PD, Weisz OA (2000) Forskolin-induced apical membrane insertion of virally expressed, epitope-tagged CFTR in polarized MDCK cells. Am J Physiol Cell Physiol 279:C375–C382
Howgate EM, Rowland Yeo K, Proctor NJ, Tucker GT, Rostami-Hodjegan A (2006) Prediction of in vivo drug clearance from in vitro data. I: impact of inter-individual variability. Xenobiotica 36:473–497
Hrach J, Mueller SO, Hewitt P (2011) Development of an in vitro liver toxicity prediction model based on longer term primary rat hepatocyte culture. Toxicol Lett 206:189–196
Hsiang B, Zhu Y, Wang Z, Wu Y, Sasseville V, Yang WP, Kirchgessner TG (1999) A novel human hepatic organic anion transporting polypeptide (OATP2). Identification of a liver-specific human organic anion transporting polypeptide and identification of rat and human hydroxymethylglutaryl-CoA reductase inhibitor transporters. J Biol Chem 274:37161–37168
Hu G, Xu C, Staudinger JL (2010) Pregnane X receptor is SUMOylated to repress the inflammatory response. J Pharmacol Exp Ther 335:342–350
Hu M, Kurobe M, Jeong YJ, Fuerer C, Ghole S, Nusse R, Sylvester KG (2007) Wnt/beta-catenin signaling in murine hepatic transit amplifying progenitor cells. Gastroenterology 133:1579–1591
Hu T, Li C (2010) Convergence between Wnt-beta-catenin and EGFR signaling in cancer. Mol Cancer 9:236
Huang G, Elferink CJ (2005) Multiple mechanisms are involved in Ah receptor-mediated cell cycle arrest. Mol Pharmacol 67:88–96
Huang SM, Stifano T (2006) Drug interaction studies -study design, data analysis, and implications for dosing and labeling—DRAFT. GUIDANCE. FDA—Guidance for Industry
Huang YS, Chern HD, Su WJ, Wu JC, Lai SL, Yang SY, Chang FY, Lee SD (2002) Polymorphism of the N-acetyltransferase 2 gene as a susceptibility risk factor for antituberculosis drug-induced hepatitis. Hepatology 35(4):883–889
Huang YS, Chern HD, Su WJ, Wu JC, Chang SC, Chiang CH, Chang FY, Lee SD (2003) Cytochrome P450 2E1 genotype and the susceptibility to antituberculosis drug-induced hepatitis. Hepatology 37(4):924–930
Huang Y, Lu M, Wu H (2004) Antagonizing XIAP-mediated caspase-3 inhibition. Achilles’ heel of cancers? Cancer Cell 5:1–2
Huang W, Ma K, Zhang J, Qatanani M, Cuvillier J, Liu J, Dong B, Huang X, Moore DD (2006) Nuclear receptor-dependent bile acid signaling is required for normal liver regeneration. Science 312:233–236
Huang H, Oizumi S, Kojima N, Niino T, Sakai Y (2007) Avidin-biotin binding-based cell seeding and perfusion culture of liver-derived cells in a porous scaffold with a three-dimensional interconnected flow-channel network. Biomaterials 28:3815–3823
Huang YS, Su WJ, Huang YH, Chen CY, Chang FY, Lin HC, Lee SD (2007) Genetic polymorphisms of manganese superoxide dismutase, NAD(P)H:quinone oxidoreductase, glutathione S-transferase M1 and T1, and the susceptibility to drug-induced liver injury. J Hepatol 47(1):128–134
Huang P, He Z, Ji S, Sun H, Xiang D, Liu C, Hu Y, Wang X, Hui L (2011) Induction of functional hepatocyte-like cells from mouse fibroblasts by defined factors. Nature 475:386–389
Hubbard AL, Stieger B, Bartles JR (1989) Biogenesis of endogenous plasma membrane proteins in epithelial cells. Annu Rev Physiol 51:755–770
Hubel A, Conroy M, Darr TB (2000) Influence of preculture on the prefreeze and postthaw characteristics of hepatocytes. Biotechnol Bioeng 71:173–183
Huelsken J, Behrens J (2002) The Wnt signalling pathway. J Cell Sci 115:3977–3978
Hughes MA, Harper N, Butterworth M, Cain K, Cohen GM, Macfarlane M (2009) Reconstitution of the death-inducing signaling complex reveals a substrate switch that determines CD95-mediated death or survival. Mol Cell 35:265–279
Huh D, Hamilton GA, Ingber DE (2011) From 3D cell culture to organs-on-chips. Trends Cell Biol 21:745–754
Huisman MT, Chhatta AA, van Tellingen O, Beijnen JH, Schinkel AH (2005) MRP2 (ABCC2) transports taxanes and confers paclitaxel resistance and both processes are stimulated by probenecid. Int J Cancer 116:824–829
Huisman MT, Smit JW, Crommentuyn KM, Zelcer N, Wiltshire HR, Beijnen JH, Schinkel AH (2002) Multidrug resistance protein 2 (MRP2) transports HIV protease inhibitors, and transport can be enhanced by other drugs. Aids 16:2295–22301
Hulot JS, Villard E, Maguy A, Morel V, Mir L, Tostivint I, William-Faltaos D, Fernandez C, Hatem S, Deray G, Komajda M, Leblond V, Lechat P (2005) A mutation in the drug transporter gene ABCC2 associated with impaired methotrexate elimination. Pharmacogenet Genomics 15:277–285
Huls M, van den Heuvel JJ, Dijkman HB, Russel FG, Masereeuw R (2006) ABC transporter expression profiling after ischemic reperfusion injury in mouse kidney. Kidney Int 69:2186–2193
Hunt NC, Shelton RM, Grover L (2009) An alginate hydrogel matrix for the localised delivery of a fibroblast/keratinocyte co-culture. Biotechnol J. 4(5):730–737
Hushka DR, Greenlee WF (1995) 2,3,7,8-Tetrachlorodibenzo-p-dioxin inhibits DNA synthesis in rat primary hepatocytes. Mutat Res 333:89–99
Hussaini SH, Farrington EA (2007) Idiosyncratic drug-induced liver injury: an overview. Expert Opin Drug Saf 6:673–684
Ieiri I, Higuchi S, Sugiyama Y (2009) Genetic polymorphisms of uptake (OATP1B1, 1B3) and efflux (MRP2, BCRP) transporters: implications for inter-individual differences in the pharmacokinetics and pharmacodynamics of statins and other clinically relevant drugs. Expert Opin Drug Metab Toxicol 5(7):703–729
Ijima H (2010) Practical and functional culture technologies for primary hepatocytes. Biochemical Engineering Journal 48:332–336
Ilan Y, Saito H, Thummala NR, Chowdhury NR (1999) Adenovirus-mediated gene therapy of liver diseases. Semin Liver Dis 19:49–59
Imaeda AB, Watanabe A, Sohail MA, Mahmood S, Mohamadnejad M, Sutterwala FS, Flavell RA, Mehal WZ (2009) Acetaminophen-induced hepatotoxicity in mice is dependent on Tlr9 and the Nalp3 inflammasome. J Clin Invest 119:305–314
Inamori M, Mizumoto H, Kajiwara T (2009) An approach for formation of vascularized liver tissue by endothelial cell-covered hepatocyte spheroid integration. Tissue Eng Part A 15:2029–2037
Inoue C, Yamamoto H, Nakamura T, Ichihara A, Okamoto H (1989) Nicotinamide prolongs survival of primary cultured hepatocytes without involving loss of hepatocyte-specific functions. J Biol Chem 264:4747–4750
Ishida Y, Kondo T, Kimura A, Tsuneyama K, Takayasu T, Mukaida N (2006) Opposite roles of neutrophils and macrophages in the pathogenesis of acetaminophen-induced acute liver injury. Eur J Immunol 36:1028–1038
Ishigami M, Tokui T, Komai T, Tsukahara K, Yamazaki M, Sugiyama Y (1995) Evaluation of the uptake of pravastatin by perfused rat liver and primary cultured rat hepatocytes. Pharm Res 12:1741–1745
Ishiguro N, Maeda K, Saito A, Kishimoto W, Matsushima S, Ebner T, Roth W, Igarashi T, Sugiyama Y (2008) Establishment of a set of double transfectants coexpressing organic anion transporting polypeptide 1B3 and hepatic efflux transporters for the characterization of the hepatobiliary transport of telmisartan acylglucuronide. Drug Metab Dispos 36:796–805
Ismair MG, Hausler S, Stuermer CA, Guyot C, Meier PJ, Roth J, Stieger B (2009) ABC-transporters are localized in caveolin-1-positive and reggie-1-negative and reggie-2-negative microdomains of the canalicular membrane in rat hepatocytes. Hepatology 49:1673–1682
Ismair MG, Stieger B, Cattori V, Hagenbuch B, Fried M, Meier PJ, Kullak-Ublick GA (2001) Hepatic uptake of cholecystokinin octapeptide by organic anion-transporting polypeptides OATP4 and OATP8 of rat and human liver. Gastroenterology 121:1185–1190
Isom HC, Secott T, Georgoff I, Woodworth C, Mummaw J (1985) Maintenance of differentiated rat hepatocytes in primary culture. Proc Natl Acad Sci USA 82:3252–3256
ITC (International Transporter Consortium) (2010) Membrane transporters in drug development (Report from the FDA Critical Path Workshop). Nat Rev Drug Discov 9:215–236
Ito K, Chiba K, Horikawa M, Ishigami M, Mizuno N, Aoki J, Gotoh Y, Iwatsubo T, Kanamitsu S, Kato M, Kawahara I, Niinuma K, Nishino A, Sato N, Tsukamoto Y, Ueda K, Itoh T, Sugiyama Y (2002) Which concentration of the inhibitor should be used to predict in vivo drug interactions from in vitro data? AAPS PharmSci 4:E25
Ito K, Houston JB (2004) Comparison of the use of liver models for predicting drug clearance using in vitro kinetic data from hepatic microsomes and isolated hepatocytes. Pharm Res 21:785–792
Ito K, Houston JB (2005) Prediction of human drug clearance from in vitro and preclinical data using physiologically based and empirical approaches. Pharm Res 22:103–112
Ito K, Suzuki H, Hirohashi T, Kume K, Shimizu T, Sugiyama Y (1997) Molecular cloning of canalicular multispecific organic anion transporter defective in EHBR. Am J Physiol 272:G16–G22
Ito K, Iwatsubo T, Kanamitsu S, Ueda K, Suzuki H, Sugiyama Y (1998) Prediction of pharmacokinetic alterations caused by drug-drug interactions: metabolic interaction in the liver. Pharmacol Rev 50:387–412
Ito K, Ogihara K, Kanamitsu S, Itoh T (2003) Prediction of the in vivo interaction between midazolam and macrolides based on in vitro studies using human liver microsomes. Drug Metab Dispos 31:945–54
Ito Y, Bethea NW, Abril ER, McCuskey RS (2003) Early hepatic microvascular injury in response to acetaminophen toxicity. Microcirculation 10:391–400
Ito K, Brown HS, Houston JB (2004) Database analyses for the prediction of in vivo drug-drug interactions from in vitro data. Br J Clin Pharmacol 57:473–486
Ito K, Hallifax D, Obach RS, Houston JB (2005) Impact of parallel pathways of drug elimination and multiple cytochrome P450 involvement on drug-drug interactions: CYP2D6 paradigm. Drug Metab Dispos 33:837–844
Itoh M, Nakajima M, Higashi E, Yoshida R, Nagata K, Yamazoe Y, Yokoi T (2006) Induction of human CYP2A6 is mediated by the pregnane X receptor with peroxisome proliferator-activated receptor-gamma coactivator 1alpha. J Pharmacol Exp Ther 319:693–702
Iwakiri Y, Groszmann RJ (2007) Vascular endothelial dysfunction in cirrhosis. J Hepatol 46:927–934
Iwamura A, Fukami T, Hosomi H, Nakajima M, Yokoi T (2011) CYP2C9-mediated metabolic activation of losartan detected by a highly sensitive cell-based screening assay. Drug Metab Dispos 39(5):838–846
Iwamuro M, Komaki T, Kubota Y, Seita M, Kawamoto H, Yuasa T, Shahid JM, Hassan RA, Hassan WA, Nakaji S, Nishikawa Y, Kondo E, Yamamoto K, Fox IJ, Kobayashi N (2010) Hepatic differentiation of mouse iPS cells in vitro. Cell Transplant 19:841–847
Jacobson L, Middleton B, Holmgren J, Eirefelt S, Frojd M, Blomgren A, Gustavsson L (2007) An optimized automated assay for determination of metabolic stability using hepatocytes: assay validation, variance component analysis, and in vivo relevance. Assay Drug Dev Technol 5:403–415
Jacquemin E, Hagenbuch B, Stieger B, Wolkoff AW, Meier PJ (1994) Expression cloning of a rat liver Na(+)-independent organic anion transporter. Proc Natl Acad Sci USA 91:133–137
Jaeschke H (2003) Molecular mechanisms of hepatic ischemia-reperfusion injury and preconditioning. Am J Physiol Gastrointest Liver Physiol 284:G15–G26
Jaeschke H (2006) Mechanisms of Liver Injury. II. Mechanisms of neutrophil-induced liver cell injury during hepatic ischemia-reperfusion and other acute inflammatory conditions. Am J Physiol Gastrointest Liver Physiol 290:G1083–G1088
Jaeschke H (2011) Reactive oxygen and mechanisms of inflammatory liver injury: Present concepts. J Gastroenterol Hepatol 26(Suppl 1):173–179
Jaeschke H, Bajt ML (2006) Intracellular signaling mechanisms of acetaminophen-induced liver cell death. Toxicol Sci 89:31–41
Jaeschke H, Hasegawa T (2006) Role of neutrophils in acute inflammatory liver injury. Liver Int 26:912–919
Jaeschke H, Liu J (2007) Neutrophil depletion protects against murine acetaminophen hepatotoxicity: another perspective. Hepatology 45:1588–1589; author reply 1589
Jaeschke H, McGill MR, Ramachandran A (2011) Pathophysiological relevance of proteomics investigations of drug-induced hepatotoxicity in HepG2 cells. Toxicol Sci 121:428–430; author reply 431–433
Jaeschke H, McGill MR, Ramachandran A (2012a) Oxidant stress, mitochondria, and cell death mechanisms in drug-induced liver injury: lessons learned from acetaminophen hepatotoxicity. Drug Metab Rev 44:88–106
Jaeschke H, Williams CD, Ramachandran A, Bajt ML (2012b) Acetaminophen hepatotoxicity and repair: the role of sterile inflammation and innate immunity. Liver Int 32:8–20
Jakobsson T, Treuter E, Gustafsson JA, Steffensen KR (2012) Liver X receptor biology and pharmacology: new pathways, challenges and opportunities. Trends Pharmacol Sci 33:394–404
James LP, McCullough SS, Knight TR, Jaeschke H, Hinson JA (2003) Acetaminophen toxicity in mice lacking NADPH oxidase activity: role of peroxynitrite formation and mitochondrial oxidant stress. Free Radic Res 37:1289–1297
Janneh O, Jones E, Chandler B, Owen A, Khoo SH (2007) Inhibition of P-glycoprotein and multidrug resistance-associated proteins modulates the intracellular concentration of lopinavir in cultured CD4 T cells and primary human lymphocytes. J Antimicrob Chemother 60:987–993
Jansen PL (2000) Foreword: from classic bile physiology to cloned transporters. Semin Liver Dis 20:245–2450
Jansen PL, Peters WH, Lamers WH (1985) Hereditary chronic conjugated hyperbilirubinemia in mutant rats caused by defective hepatic anion transport. Hepatology 5:573–579
Jaworski M, Buchmann A, Bauer P, Riess O, Schwarz M (2005) B-raf and Ha-ras mutations in chemically induced mouse liver tumors. Oncogene 24:1290–1295
Jaworski M, Ittrich C, Hailfinger S, Bonin M, Buchmann A, Schwarz M, Kohle C (2007) Global gene expression in Ha-ras and B-raf mutated mouse liver tumors. Int J Cancer 121:1382–1385
Jemmerson R, Liu J, Hausauer D, Lam KP, Mondino A, Nelson RD (1999) A conformational change in cytochrome c of apoptotic and necrotic cells is detected by monoclonal antibody binding and mimicked by association of the native antigen with synthetic phospholipid vesicles. Biochemistry 38:3599–3609
Jemnitz K, Veres Z, Monostory K, Kobori L, Vereczkey L (2008) Interspecies differences in acetaminophen sensitivity of human, rat, and mouse primary hepatocytes. Toxicol In Vitro 22:961–967
Jemnitz K, Veres Z, Szabo M, Baranyai Z, Jakab F, Vereczkey L (2012) Differential inhibitory effect of cyclosporine A and bosentan on taurocholate uptake in human and rat hepatocytes as a function of culturing time. Toxicol In Vitro 26:174–181
Jerby L, Shlomi T, Ruppin E (2010) Computational reconstruction of tissue-specific metabolic models: application to human liver metabolism. Mol Syst Biol 6:401
Ji S, Lemasters JJ, Thurman RG (1980) A non-invasive method to study metabolic events within sublobular regions of hemoglobin-free perfused liver. FEBS Lett 113:37–42
Jiang G, Nepomuceno L, Hopkins K, Sladek FM (1995) Exclusive homodimerization of the orphan receptor hepatocyte nuclear factor 4 defines a new subclass of nuclear receptors. Mol Cell Biol 15:5131–5143
Jigorel E, Houston JB (2012) Utility of drug depletion-time profiles in isolated hepatocytes for accessing hepatic uptake clearance: identifying rate-limiting steps and role of passive processes. Drug Metab Dispos 40:1596–1602
Jigorel E, le Vee M, Boursier-Neyret C, Parmentier Y, Fardel O (2006) Differential regulation of sinusoidal and canalicular hepatic drug transporter expression by xenobiotics activating drug-sensing receptors in primary human hepatocytes. Drug Metab Dispos 34:1756–1763
Jindal R, Nahmias Y, Tilles AW, Berthiaume F, Yarmush ML (2009) Amino acid-mediated heterotypic interaction governs performance of a hepatic tissue model. Faseb J 23:2288–2298
Joannard F, Rissel M, Gilot D, Anderson A, Orfila-Lefeuvre L, Guillouzo A, Atfi A, Lagadic-Gossmann D (2006) Role for mitogen-activated protein kinases in phenobarbital-induced expression of cytochrome P450 2B in primary cultures of rat hepatocytes. Toxicol Lett 161:61–72
Johansson L, Thomsen JS, Damdimopoulos AE, Spyrou G, Gustafsson JA, Treuter E (1999) The orphan nuclear receptor SHP inhibits agonist-dependent transcriptional activity of estrogen receptors ERalpha and ERbeta. J Biol Chem 274:345–353
Johansson L, Bavner A, Thomsen JS, Farnegardh M, Gustafsson JA, Treuter E (2000) The orphan nuclear receptor SHP utilizes conserved LXXLL-related motifs for interactions with ligand-activated estrogen receptors. Mol Cell Biol 20:1124–1133
Johnson AD, Kavousi M, Smith AV, Chen MH, Dehghan A, Aspelund T, Lin JP, van Duijn CM, Harris TB, Cupples LA, Uitterlinden AG, Launer L, Hofman A, Rivadeneira F, Stricker B, Yang Q, O’Donnell CJ, Gudnason V, Witteman JC (2009) Genome-wide association meta-analysis for total serum bilirubin levels. Hum Mol Genet 18:2700–2710
Johnson PR, White SA, London NJ (1996) Collagenase and human islet isolation. Cell Transplant 5:437–52
Jollow DJ, Mitchell JR, Potter WZ, Davis DC, Gillette JR, Brodie BB (1973) Acetaminophen-induced hepatic necrosis. II. Role of covalent binding in vivo. J Pharmacol Exp Ther 187:195–202
Jones RA, Johnson VL, Buck NR, Dobrota M, Hinton RH, Chow SC, Kass GE (1998) Fas-mediated apoptosis in mouse hepatocytes involves the processing and activation of caspases. Hepatology 27:1632–42
Jones BE, Lo CR, Liu H, Pradhan Z, Garcia L, Srinivasan A, Valentino KL, Czaja MJ (2000) Role of caspases and NF-kappaB signaling in hydrogen peroxide- and superoxide-induced hepatocyte apoptosis. Am J Physiol Gastrointest Liver Physiol 278:G693–G699
Jones HM, Houston JB (2004) Substrate depletion approach for determining in vitro metabolic clearance: time dependencies in hepatocyte and microsomal incubations. Drug Metab Dispos 32:973–982
Jones CN, Tuleuova N, Lee JY, Ramanculov E, Reddi AH, Zern MA, Revzin A (2009) Cultivating liver cells on printed arrays of hepatocyte growth factor. Biomaterials 30:3733–3741
Jorgensen L, van Beek J, Lund S, Schousboe A, Badolo L (2007) Evidence of Oatp and Mdr1 in cryopreserved rat hepatocytes. Eur J Pharm Sci 30:181–189
Josse R, Aninat C, Glaise D, Dumont J, Fessard V, Morel F, Poul JM, Guguen-Guillouzo C, Guillouzo A (2008) Long-term functional stability of human HepaRG hepatocytes and use for chronic toxicity and genotoxicity studies. Drug Metab Dispos 36:1111–1118
Jost PJ, Grabow S, Gray D, McKenzie MD, Nachbur U, Huang DC, Bouillet P, Thomas HE, Borner C, Silke J, Strasser A, Kaufmann T (2009) XIAP discriminates between type I and type II FAS-induced apoptosis. Nature 460:1035–1039
Jover R, Bort R, Gomez-Lechon MJ, Castell JV (1998) Re-expression of C/EBP alpha induces CYP2B6, CYP2C9 and CYP2D6 genes in HepG2 cells. FEBS Lett 431:227–230
Ju C, Reilly T (2012) Role of immune reactions in drug-induced liver injury (DILI). Drug Metab Rev 44:107–115
Ju C, Reilly TP, Bourdi M, Radonovich MF, Brady JN, George JW, Pohl LR (2002) Protective role of Kupffer cells in acetaminophen-induced hepatic injury in mice. Chem Res Toxicol 15:1504–1513
Judson RS, Kavlock RJ, Setzer RW, Hubal EA, Martin MT, Knudsen TB, Houck KA, Thomas RS, Wetmore BA, Dix DJ (2011) Estimating toxicity-related biological pathway altering doses for high-throughput chemical risk assessment. Chem Res Toxicol 24:451–462
Jung D, Podvinec M, Meyer UA, Mangelsdorf DJ, Fried M, Meier PJ, Kullak-Ublick GA (2002) Human organic anion transporting polypeptide 8 promoter is transactivated by the farnesoid X receptor/bile acid receptor. Gastroenterology 122:1954–1966
Jung D, Kullak-Ublick GA (2003) Hepatocyte nuclear factor 1 alpha: a key mediator of the effect of bile acids on gene expression. Hepatology 37:622–631
Jung D, Mangelsdorf DJ, Meyer UA (2006) Pregnane X receptor is a target of farnesoid X receptor. J Biol Chem 281:19081–19091
Jung D, Elferink MG, Stellaard F, Groothuis GM (2007) Analysis of bile acid-induced regulation of FXR target genes in human liver slices. Liver Int 27:137–144
Jungermann K, Katz N (1982) Functional hepatocellular heterogeneity. Hepatology 2:385–395
Jungermann K, Kietzmann T (1996) Zonation of parenchymal and nonparenchymal metabolism in liver. Annu Rev Nutr 16:179–203
Jungermann K, Kietzmann T (1997) Role of oxygen in the zonation of carbohydrate metabolism and gene expression in liver. Kidney Int 51:402–412
Jungermann K, Kietzmann T (2000) Oxygen: modulator of metabolic zonation and disease of the liver. Hepatology 31:255–260
Kafert-Kasting S, Alexandrova K, Barthold M, Laube B, Friedrich G, Arseniev L, Hengstler JG (2006) Enzyme induction in cryopreserved human hepatocyte cultures. Toxicology 220:117–225
Kagi D, Vignaux F, Ledermann B, Burki K, Depraetere V, Nagata S, Hengartner H, Golstein P (1994) Fas and perforin pathways as major mechanisms of T cell-mediated cytotoxicity. Science 265:528–530
Kakizaki S, Takizawa D, Tojima H, Horiguchi N, Yamazaki Y, Mori M (2012) Nuclear receptors CAR and PXR; therapeutic targets for cholestatic liver disease. Front Biosci 17:2988–3005
Kalaany NY, Mangelsdorf DJ (2006) LXRS and FXR: the yin and yang of cholesterol and fat metabolism. Annu Rev Physiol 68:159–191
Kalapos MP (2002) Carbamazepine-provoked hepatotoxicity and possible aetiopathological role of glutathione in the events. Retrospective review of old data and call for new investigation. Adverse Drug React Toxicol Rev 21:123–141
Kaleta C, de Figueiredo LF, Schuster S (2009) Can the whole be less than the sum of its parts? Pathway analysis in genome-scale metabolic networks using elementary flux patterns. Genome Res 19:1872–1883
Kalliokoski A, Niemi M (2009) Impact of OATP transporters on pharmacokinetics. Br J Pharmacol 158:693–705
Kamata H, Honda S, Maeda S, Chang L, Hirata H, Karin M (2005) Reactive oxygen species promote TNFalpha-induced death and sustained JNK activation by inhibiting MAP kinase phosphatases. Cell 120:649–661
Kamiya A, Inoue Y, Gonzalez FJ (2003) Role of the hepatocyte nuclear factor 4alpha in control of the pregnane X receptor during fetal liver development. Hepatology 37:1375–1384
Kanamitsu S, Ito K, Sugiyama Y (2000) Quantitative prediction of in vivo drug-drug interactions from in vitro data based on physiological pharmacokinetics: use of maximum unbound concentration of inhibitor at the inlet to the liver. Pharm Res 17:336–343
Kane BJ, Zinner MJ, Yarmush ML, Toner M (2006) Liver-specific functional studies in a microfluidic array of primary mammalian hepatocytes. Anal Chem 78:4291–4298
Kanebratt KP, Andersson TB (2008) Evaluation of HepaRG cells as an in vitro model for human drug metabolism studies. Drug Metab Dispos 36:1444–1452
Kanebratt KP, Andersson TB (2008) HepaRG cells as an in vitro model for evaluation of cytochrome P450 induction in humans. Drug Metab Dispos 36:137–145
Kaneko A, Kato M, Endo C, Nakano K, Ishigai M, Takeda K (2010) Prediction of clinical CYP3A4 induction using cryopreserved human hepatocytes. Xenobiotica 40:791–799
Kang HW, Cho DW (2012) Development of an Indirect Stereolithography Technology for Scaffold Fabrication with a wide range of biomaterial selectivity. Tissue Eng Part C Methods
Kang TB, Ben-Moshe T, Varfolomeev EE, Pewzner-Jung Y, Yogev N, Jurewicz A, Waisman A, Brenner O, Haffner R, Gustafsson E, Ramakrishnan P, Lapidot T, Wallach D (2004) Caspase-8 serves both apoptotic and nonapoptotic roles. J Immunol 173:2976–2984
Kang TB, Oh GS, Scandella E, Bolinger B, Ludewig B, Kovalenko A, Wallach D (2008) Mutation of a self-processing site in caspase-8 compromises its apoptotic but not its nonapoptotic functions in bacterial artificial chromosome-transgenic mice. J Immunol 181:2522–2532
Kano A, Watanabe Y, Takeda N, Aizawa S, Akaike T (1997) Analysis of IFN-gamma-induced cell cycle arrest and cell death in hepatocytes. J Biochem 121:677–683
Kaplowitz N (2004) Drug-induced liver injury. Clin Infect Dis 38(Suppl 2):S44–8
Kaplowitz N, Deleve LD (2002) Drug-induced liver disease. Informa Healthcare, New York, USA
Karin M, Lin A (2002) NF-kappaB at the crossroads of life and death. Nat Immunol 3:221–227
Kartenbeck J, Leuschner U, Mayer R, Keppler D (1996) Absence of the canalicular isoform of the MRP gene-encoded conjugate export pump from the hepatocytes in Dubin-Johnson syndrome. Hepatology 23:1061–1066
Kasper HU, Konze E, Kutinova Canova N, Dienes HP, Dries V (2011) Cryopreservation of precision cut tissue slices (PCTS): investigation of morphology and reactivity. Exp Toxicol Pathol 63:575–580
Kassam A, Capone JP, Rachubinski RA (2001) The short heterodimer partner receptor differentially modulates peroxisome proliferator-activated receptor alpha-mediated transcription from the peroxisome proliferator-response elements of the genes encoding the peroxisomal beta-oxidation enzymes acyl-CoA oxidase and hydratase-dehydrogenase. Mol Cell Endocrinol 176:49–56
Kast HR, Goodwin B, Tarr PT, Jones SA, Anisfeld AM, Stoltz CM, Tontonoz P, Kliewer S, Willson TM, Edwards PA (2002) Regulation of multidrug resistance-associated protein 2 (ABCC2) by the nuclear receptors pregnane X receptor, farnesoid X-activated receptor, and constitutive androstane receptor. J Biol Chem 277:2908–2915
Kasuya J, Sudo R, Mitaka T, Ikeda M, Tanishita K (2011) Hepatic stellate cell-mediated three-dimensional hepatocyte and endothelial cell triculture model. Tissue Eng Part A 17:361–370
Kasuya J, Sudo R, Tamogami R, Masuda G, Mitaka T, Ikeda M, Tanishita K (2012) Reconstruction of 3D stacked hepatocyte tissues using degradable, microporous poly(d, l-lactide-co-glycolide) membranes. Biomaterials 33:2693–2700
Kataropoulou M, Henderson C, Grant MH (2005) Metabolic studies of hepatocytes cultured on collagen substrata modified to contain glycosaminoglycans. Tissue Eng 11:1263–1273
Kato M, Shitara Y, Sato H, Yoshisue K, Hirano M, Ikeda T, Sugiyama Y (2008) The quantitative prediction of CYP-mediated drug interaction by physiologically based pharmacokinetic modeling. Pharm Res 25:1891–1901
Kato S, Ishii T, Hara H, Sugiura N, Kimata K, Akamatsu N (1994) Hepatocyte growth factor immobilized onto culture substrates through heparin and matrigel enhances DNA synthesis in primary rat hepatocytes. Exp Cell Res 211:53–58
Kaufmann T, Strasser A, Jost PJ (2012) Fas death receptor signalling: roles of Bid and XIAP. Cell Death Differ 19:42–50
Kawajiri K, Kobayashi Y, Ohtake F, Ikuta T, Matsushima Y, Mimura J, Pettersson S, Pollenz RS, Sakaki T, Hirokawa T, Akiyama T, Kurosumi M, Poellinger L, Kato S, Fujii-Kuriyama Y (2009) Aryl hydrocarbon receptor suppresses intestinal carcinogenesis in ApcMin/+ mice with natural ligands. Proc Natl Acad Sci USA 106:13481–13486
Kawamata Y, Fujii R, Hosoya M, Harada M, Yoshida H, Miwa M, Fukusumi S, Habata Y, Itoh T, Shintani Y, Hinuma S, Fujisawa Y, Fujino M (2003) A G protein-coupled receptor responsive to bile acids. J Biol Chem 278:9435–9440
Kawashima S, Kobayashi K, Takama K, Higuchi T, Furihata T, Hosokawa M, Chiba K (2006) Involvement of hepatocyte nuclear factor 4alpha in the different expression level between CYP2C9 and CYP2C19 in the human liver. Drug Metab Dispos 34:1012–1018
Kehat I, Khimovich L, Caspi O, Gepstein A, Shofti R, Arbel G, Huber I, Satin J, Itskovitz-Eldor J, Gepstein L (2004) Electromechanical integration of cardiomyocytes derived from human embryonic stem cells. Nat Biotechnol 22:1282–1289
Keisu M, Andersson TB (2010) Drug-induced liver injury in humans: the case of ximelagatran. Handb Exp Pharmacol 196:407–418
Keitel V, Häussinger D (2011) TGR5 in the biliary tree. Dig Dis 29:45–7
Keitel V, Häussinger D (2012) Perspective: TGR5 (Gpbar-1) in liver physiology and disease. Clin Res Hepatol Gastroenterol
Keitel V, Burdelski M, Warskulat U, Kuhlkamp T, Keppler D, Häussinger D, Kubitz R (2005) Expression and localization of hepatobiliary transport proteins in progressive familial intrahepatic cholestasis. Hepatology 41:1160–1172
Keitel V, Reinehr R, Gatsios P, Rupprecht C, Gorg B, Selbach O, Häussinger D, Kubitz R (2007) The G-protein coupled bile salt receptor TGR5 is expressed in liver sinusoidal endothelial cells. Hepatology 45:695–704
Keitel V, Donner M, Winandy S, Kubitz R, Häussinger D (2008a) Expression and function of the bile acid receptor TGR5 in Kupffer cells. Biochem Biophys Res Commun 372:78–84
Keitel V, Kubitz R, Häussinger D (2008b) Endocrine and paracrine role of bile acids. World J Gastroenterol 14:5620–5629
Keitel V, Cupisti K, Ullmer C, Knoefel WT, Kubitz R, Häussinger D (2009) The membrane-bound bile acid receptor TGR5 is localized in the epithelium of human gallbladders. Hepatology 50:861–870
Keitel V, Ullmer C, Häussinger D (2010) The membrane-bound bile acid receptor TGR5 (Gpbar-1) is localized in the primary cilium of cholangiocytes. Biol Chem 391:785–789
Keller GA, West MA, Wilkes LA, Cerra FB, Simmons RL (1985) Modulation of hepatocyte protein synthesis by endotoxin-activated Kupffer cells. II. Mediation by soluble transferrable factors. Ann Surg 201:429–435
Keller GA, West MA, Harty JT, Wilkes LA, Cerra FB, Simmons RL (1985) Modulation of hepatocyte protein synthesis by endotoxin-activated Kupffer cells. III. Evidence for the role of a monokine similar to but not identical with interleukin-1. Ann Surg 201:436–443
Keller GA, West MA, Cerra FB, Simmons RL (1985) Multiple systems organ failure. Modulation of hepatocyte protein synthesis by endotoxin activated Kupffer cells. Ann Surg 201:87–95
Keller GA, West MA, Cerra FB, Simmons RL (1986) Macrophage-mediated modulation of hepatocyte protein synthesis. Effect of dexamethasone. Arch Surg 121:1199–1205
Kelley SK, Nilsson CB, Green MH, Green JB, Hakansson H (2000) Mobilization of vitamin A stores in rats after administration of 2,3, 7,8-tetrachlorodibenzo-p-dioxin: a kinetic analysis. Toxicol Sci 55:478–484
Kelm JM, Timmins NE, Brown CJ, Fussenegger M, Nielsen LK (2003) Method for generation of homogeneous multicellular tumor spheroids applicable to a wide variety of cell types. Biotechnol Bioeng 83:173–180
Kelm JM, Fussenegger M (2004) Microscale tissue engineering using gravity-enforced cell assembly. Trends Biotechnol 22:195–202
Kelm JM, Djonov V, Ittner LM, Fluri D, Born W, Hoerstrup SP, Fussenegger M (2006) Design of custom-shaped vascularized tissues using microtissue spheroids as minimal building units. Tissue Eng 12:2151–2160
Keppler D (2011) Multidrug resistance proteins (MRPs, ABCCs): importance for pathophysiology and drug therapy. Handb Exp Pharmacol 299–323
Kern A, Bader A, Pichlmayr R, Sewing KF (1997) Drug metabolism in hepatocyte sandwich cultures of rats and humans. Biochem Pharmacol 54:761–772
Kerr JF, Wyllie AH, Currie AR (1972) Apoptosis: a basic biological phenomenon with wide-ranging implications in tissue kinetics. Br J Cancer 26:239–257
Khan AA, Chow EC, Porte RJ, Pang KS, Groothuis GM (2009) Expression and regulation of the bile acid transporter, OSTalpha-OSTbeta in rat and human intestine and liver. Biopharm Drug Dispos 30:241–258
Khan AA, Chow EC, Van Loenen-Weemaes AM, Porte RJ, Pang KS, Groothuis GM (2009) Comparison of effects of VDR versus PXR, FXR and GR ligands on the regulation of CYP3A isozymes in rat and human intestine and liver. Eur J Pharm Sci 37:115–125
Khan MA, Ellis R, Inman MD, Bates JH, Sanderson MJ, Janssen LJ (2010) Influence of airway wall stiffness and parenchymal tethering on the dynamics of bronchoconstriction. Am J Physiol Lung Cell Mol Physiol 299:L98–L108
Khan AA, Dragt BS, Porte RJ, Groothuis GM (2010) Regulation of VDR expression in rat and human intestine and liver–consequences for CYP3A expression. Toxicol In Vitro 24:822–829
Khan AA, Chow EC, Porte RJ, Pang KS, Groothuis GM (2011) The role of lithocholic acid in the regulation of bile acid detoxication, synthesis, and transport proteins in rat and human intestine and liver slices. Toxicol In Vitro 25:80–90
Khetani SR, Bhatia SN (2008) Microscale culture of human liver cells for drug development. Nat Biotechnol 26:120–126
Khor TO, Ibrahim S, Kong AN (2006) Toxicogenomics in drug discovery and drug development: potential applications and future challenges. Pharm Res 23:1659–1664
Khuu DN, Najimi M, Sokal EM (2007) Epithelial cells with hepatobiliary phenotype: is it another stem cell candidate for healthy adult human liver? World J Gastroenterol 13:1554–1560
Kienhuis AS, van de Poll MC, Wortelboer H, van Herwijnen M, Gottschalk R, Dejong CH, Boorsma A, Paules RS, Kleinjans JC, Stierum RH, van Delft JH (2009) Parallelogram approach using rat-human in vitro and rat in vivo toxicogenomics predicts acetaminophen-induced hepatotoxicity in humans. Toxicol Sci 107:544–552
Kienhuis AS, Wortelboer HM, Maas WJ, van Herwijnen M, Kleinjans JC, van Delft JH, Stierum RH (2007) A sandwich-cultured rat hepatocyte system with increased metabolic competence evaluated by gene expression profiling. Toxicol In Vitro 21:892–901
Kietzmann T, Dimova EY, Flugel D, Scharf JG (2006) Oxygen: modulator of physiological and pathophysiological processes in the liver. Z Gastroenterol 44:67–76
Kietzmann T, Jungermann K (1997) Modulation by oxygen of zonal gene expression in liver studied in primary rat hepatocyte cultures. Cell Biol Toxicol 13:243–55
Kim JS, Southard JH (1999) Membrane stabilizing effects of calcium and taxol during the cold storage of isolated rat hepatocytes. Transplantation 68:938–943
Kim JH, Auerbach JM, Rodriguez-Gomez JA, Velasco I, Gavin D, Lumelsky N, Lee SH, Nguyen J, Sanchez-Pernaute R, Bankiewicz K, McKay R (2002) Dopamine neurons derived from embryonic stem cells function in an animal model of Parkinson’s disease. Nature 418:50–56
Kim MS, Shigenaga J, Moser A, Feingold K, Grunfeld C (2003) Repression of farnesoid X receptor during the acute phase response. J Biol Chem 278:8988–8995
Kim SH, Hoshiba T, Akaike T (2003) Effect of carbohydrates attached to polystyrene on hepatocyte morphology on sugar-derivatized polystyrene matrices. J Biomed Mater Res A 67:1351–1359
Kim JY, Ahn MR, Kim DK, Sheen YY (2004) Histone deacetylase inhibitor stimulate CYP3A4 proximal promoter activity in HepG2 cells. Arch Pharm Res 27:407–414
Kim I, Morimura K, Shah Y, Yang Q, Ward JM, Gonzalez FJ (2007) Spontaneous hepatocarcinogenesis in farnesoid X receptor-null mice. Carcinogenesis 28:940–946
Kim D, Rath O, Kolch W, Cho KH (2007) A hidden oncogenic positive feedback loop caused by crosstalk between Wnt and ERK pathways. Oncogene 26:4571–4579
Kim S, Dere E, Burgoon LD, Chang CC, Zacharewski TR (2009) Comparative analysis of AhR-mediated TCDD-elicited gene expression in human liver adult stem cells. Toxicol Sci 112:229–244
Kim M, Lee JY, Jones CN, Revzin A, Tae G (2010) Heparin-based hydrogel as a matrix for encapsulation and cultivation of primary hepatocytes. Biomaterials 31:3596–3603
Kim Y, Lasher CD, Milford LM, Murali TM, Rajagopalan P (2010) A comparative study of genome-wide transcriptional profiles of primary hepatocytes in collagen sandwich and monolayer cultures. Tissue Eng Part C Methods 16:1449–1460
Kim K, Doi A, Wen B, Ng K, Zhao R, Cahan P, Kim J, Aryee MJ, Ji H, Ehrlich LI, Yabuuchi A, Takeuchi A, Cunniff KC, Hongguang H, McKinney-Freeman S, Naveiras O, Yoon TJ, Irizarry RA, Jung N, Seita J, Hanna J, Murakami P, Jaenisch R, Weissleder R, Orkin SH, Weissman IL, Feinberg AP, Daley GQ (2010) Epigenetic memory in induced pluripotent stem cells. Nature 467:285–290
Kim BS, Park IK, Hoshiba T, Jiang HL, Choi YJ, Akaike T, Cho CS (2011) Design of artificial extracellular matrices for tissue engineering. Prog Polym Sci 36:238–268
Kimata T, Nagaki M, Tsukada Y, Ogiso T, Moriwaki H (2006) Hepatocyte nuclear factor-4alpha and -1 small interfering RNA inhibits hepatocyte differentiation induced by extracellular matrix. Hepatol Res 35:3–9
Kin T, Johnson PR, Shapiro AM, Lakey JR (2007) Factors influencing the collagenase digestion phase of human islet isolation. Transplantation 83:7–12
Kindmark A, Jawaid A, Harbron CG, Barratt BJ, Bengtsson OF, Andersson TB, Carlsson S, Cederbrant KE, Gibson NJ, Armstrong M, Lagerstrom-Fermer ME, Dellsen A, Brown EM, Thornton M, Dukes C, Jenkins SC, Firth MA, Harrod GO, Pinel TH, Billing-Clason SM, Cardon LR, March RE (2008) Genome-wide pharmacogenetic investigation of a hepatic adverse event without clinical signs of immunopathology suggests an underlying immune pathogenesis. Pharmacogenomics J 8:186–195
Kipp H, Arias IM (2002) Trafficking of canalicular ABC transporters in hepatocytes. Annu Rev Physiol 64:595–608
Kirovski G, Gabele E, Dorn C, Moleda L, Niessen C, Weiss TS, Wobser H, Schacherer D, Buechler C, Wasmuth HE, Hellerbrand C (2010) Hepatic steatosis causes induction of the chemokine RANTES in the absence of significant hepatic inflammation. Int J Clin Exp Pathol 3:675–680
Kis E, Ioja E, Nagy T, Szente L, Heredi-Szabo K, Krajcsi P (2009) Effect of membrane cholesterol on BSEP/Bsep activity: species specificity studies for substrates and inhibitors. Drug Metab Dispos 37:1878–1886
Kischkel FC, Hellbardt S, Behrmann I, Germer M, Pawlita M, Krammer PH, Peter ME (1995) Cytotoxicity-dependent APO-1 (Fas/CD95)-associated proteins form a death-inducing signaling complex (DISC) with the receptor. Embo J 14:5579–5588
Kitani H, Takenouchi T, Sato M, Yoshioka M, Yamanaka N (2010) A novel isolation method for macrophage-like cells from mixed primary cultures of adult rat liver cells. J Immunol Methods 360:47–55
Klamt S (2006) Generalized concept of minimal cut sets in biochemical networks. Biosystems 83:233–47
Klamt S, Gilles ED (2004) Minimal cut sets in biochemical reaction networks. Bioinformatics 20:226–234
Klassen LW, Thiele GM, Duryee MJ, Schaffert CS, Deveney AL, Hunter CD, Olinga P, Tuma DJ (2008) An in vitro method of alcoholic liver injury using precision-cut liver slices from rats. Biochem Pharmacol 76:426–436
Kleinfeld AM, Prothro D, Brown DL, Davis RC, Richieri GV, Demaria A (1996) Increases in serum unbound free fatty acid levels following coronary angioplasty. Am J Cardiol 78:1350–1354
Kleinman HK, McGarvey ML, Hassell JR, Star VL, Cannon FB, Laurie GW, Martin GR (1986) Basement membrane complexes with biological activity. Biochemistry 25:312–318
Kline ER, Bassit L, Hernandez-Santiago BI, Detorio MA, Liang B, Kleinhenz DJ, Walp ER, Dikalov S, Jones DP, Schinazi RF, Sutliff RL (2009) Long-term exposure to AZT, but not d4T, increases endothelial cell oxidative stress and mitochondrial dysfunction. Cardiovasc Toxicol 9:1–12
Klingmuller U, Bauer A, Bohl S, Nickel PJ, Breitkopf K, Dooley S, Zellmer S, Kern C, Merfort I, Sparna T, Donauer J, Walz G, Geyer M, Kreutz C, Hermes M, Gotschel F, Hecht A, Walter D, Egger L, Neubert K, Borner C, Brulport M, Schormann W, Sauer C, Baumann F, Preiss R, Macnelly S, Godoy P, Wiercinska E, Ciuclan L, Edelmann J, Zeilinger K, Heinrich M, Zanger UM, Gebhardt R, Maiwald T, Heinrich R, Timmer J, von Weizsacker F, Hengstler JG (2006) Primary mouse hepatocytes for systems biology approaches: a standardized in vitro system for modelling of signal transduction pathways. Syst Biol (Stevenage) 153:433–447
Kmiec Z (2001) Cooperation of liver cells in health and disease. Adv Anat Embryol Cell Biol 161:III–XIII, 1–151
Knerr S, Schrenk D (2006) Carcinogenicity of 2,3,7,8-tetrachlorodibenzo-p-dioxin in experimental models. Mol Nutr Food Res 50:897–907
Knight TR, Jaeschke H (2004) (2004) Peroxynitrite formation and sinusoidal endothelial cell injury during acetaminophen-induced hepatotoxicity in mice. Comp Hepatol 3(1):S46
Knight TR, Fariss MW, Farhood A, Jaeschke H (2003) Role of lipid peroxidation as a mechanism of liver injury after acetaminophen overdose in mice. Toxicol Sci 76:229–236
Knight E, Murray B, Carnachan R, Przyborski S (2011) Alvetex(R): polystyrene scaffold technology for routine three dimensional cell culture. Methods Mol Biol 695:323–340
Knobeloch D, Ehnert S, Schyschka L, Buchler P, Schoenberg M, Kleeff J, Thasler WE, Nussler NC, Godoy P, Hengstler J, Nussler AK (2012) Human hepatocytes: isolation, culture, and quality procedures. Methods Mol Biol 806:99–120
Kobayashi N, Noguchi H, Westerman KA, Watanabe T, Matsumura T, Totsugawa T, Fujiwara T, Leboulch P, Tanaka N (2001) Cre/loxP-based reversible immortalization of human hepatocytes. Cell Transpl 10(4–5):383–386
Koebe HG, Dahnhardt C, Muller-Hocker J, Wagner H, Schildberg FW (1996) Cryopreservation of porcine hepatocyte cultures. Cryobiology 33:127–141
Koebe HG, Dunn JC, Toner M, Sterling LM, Hubel A, Cravalho EG, Yarmush ML, Tompkins RG (1990) A new approach to the cryopreservation of hepatocytes in a sandwich culture configuration. Cryobiology 27:576–584
Koebe HG, Muhling B, Deglmann CJ, Schildberg FW (1999) Cryopreserved porcine hepatocyte cultures. Chem Biol Interact 121:99–115
Koebe HG, Pahernik S, Eyer P, Schildberg FW (1994) Collagen gel immobilization: a useful cell culture technique for long-term metabolic studies on human hepatocytes. Xenobiotica 24:95–107
Koepsell H, Endou H (2004) The SLC22 drug transporter family. Pflugers Arch 447:666–676
Koepsell H, Lips K, Volk C (2007) Polyspecific organic cation transporters: structure, function, physiological roles, and biopharmaceutical implications. Pharm Res 24:1227–1251
Kohle C, Bock KW (2006) Activation of coupled Ah receptor and Nrf2 gene batteries by dietary phytochemicals in relation to chemoprevention. Biochem Pharmacol 72:795–805
Kohn MC, Sewall CH, Lucier GW, Portier CJ (1996) A mechanistic model of effects of dioxin on thyroid hormones in the rat. Toxicol Appl Pharmacol 136:29–48
Koide N, Shinji T, Tanabe T, Asano K, Kawaguchi M, Sakaguchi K, Koide Y, Mori M, Tsuji T (1989) Continued high albumin production by multicellular spheroids of adult rat hepatocytes formed in the presence of liver-derived proteoglycans. Biochem Biophys Res Commun 161:385–391
Koike M, Matsushita M, Taguchi K, Uchino J (1996) Function of culturing monolayer hepatocytes by collagen gel coating and coculture with nonparenchymal cells. Artif Organs 20:186–192
Koike C, Moore R, Negishi M (2007) Extracellular signal-regulated kinase is an endogenous signal retaining the nuclear constitutive active/androstane receptor (CAR) in the cytoplasm of mouse primary hepatocytes. Mol Pharmacol 71(5):1217–1221
Koide N, Morikawa A, Naiki Y, Tumurkhuu G, Yoshida T, Ikeda H, Yokochi T (2009) Low susceptibility of NC/Nga mice to tumor necrosis factor-alpha-mediated lethality and hepatocellular damage with D-galactosamine sensitization. Clin Immunol 130:225–232
Koide T, Pang WL, Baliga NS (2009) The role of predictive modelling in rationally re-engineering biological systems. Nat Rev Microbiol 7:297–305
Koizumi T, Aoki T, Kobayashi Y, Yasuda D, Izumida Y, Jin Z, Nishino N, Shimizu Y, Kato H, Murai N, Niiya T, Enami Y, Mitamura K, Yamamoto T, Kusano M (2007) Long-term maintenance of the drug transport activity in cryopreservation of microencapsulated rat hepatocytes. Cell Transpl 16:67–73
Kojima R, Yoshimoto K, Takahashi E, Ichino M, Miyoshi H, Nagasaki Y (2009) Spheroid array of fetal mouse liver cells constructed on a PEG-gel micropatterned surface: upregulation of hepatic functions by co-culture with nonparenchymal liver cells. Lab Chip 9(14):1991–1993
Kolios G, Valatas V, Kouroumalis E (2006) Role of Kupffer cells in the pathogenesis of liver disease. World J Gastroenterol 12:7413–7420
Komura H, Kawase A, Iwaki M (2005) Application of substrate depletion assay for early prediction of nonlinear pharmacokinetics in drug discovery: assessment of nonlinearity of metoprolol, timolol, and propranolol. J Pharm Sci 94:2656–2666
Kon K, Kim JS, Jaeschke H, Lemasters JJ (2004) Mitochondrial permeability transition in acetaminophen-induced necrosis and apoptosis of cultured mouse hepatocytes. Hepatology 40:1170–1179
Kon K, Kim JS, Uchiyama A, Jaeschke H, Lemasters JJ (2010) Lysosomal iron mobilization and induction of the mitochondrial permeability transition in acetaminophen-induced toxicity to mouse hepatocytes. Toxicol Sci 117:101–108
Konig J, Nies AT, Cui Y, Leier I, Keppler D (1999) Conjugate export pumps of the multidrug resistance protein (MRP) family: localization, substrate specificity, and MRP2-mediated drug resistance. Biochim Biophys Acta 1461:377–394
Konig J, Cui Y, Nies AT, Keppler D (2000) A novel human organic anion transporting polypeptide localized to the basolateral hepatocyte membrane. Am J Physiol Gastrointest Liver Physiol 278:G156–G164
Konig J, Cui Y, Nies AT, Keppler D (2000) Localization and genomic organization of a new hepatocellular organic anion transporting polypeptide. J Biol Chem 275:23161–23168
Konig J, Seithel A, Gradhand U, Fromm MF (2006) Pharmacogenomics of human OATP transporters. Naunyn Schmiedebergs Arch Pharmacol 372:432–443
Konig J (2011) Uptake transporters of the human OATP family: molecular characteristics, substrates, their role in drug-drug interactions, and functional consequences of polymorphisms. Handb Exp Pharmacol 1–28
Kono H, Rock KL (2008) How dying cells alert the immune system to danger. Nat Rev Immunol 8:279–289
Kool M, de Haas M, Scheffer GL, Scheper RJ, van Eijk MJ, Juijn JA, Baas F, Borst P (1997) Analysis of expression of cMOAT (MRP2), MRP3, MRP4, and MRP5, homologues of the multidrug resistance-associated protein gene (MRP1), in human cancer cell lines. Cancer Res 57:3537–3547
Kordes C, Häussinger D (2013) Hepatic stem cell niches. J Clin Invest 23:1874–1880
Kordes C, Sawitza I, Häussinger D (2008) Canonical Wnt signaling maintains the quiescent stage of hepatic stellate cells. Biochem Biophys Res Commun 367:116–123
Kordes C, Sawitza I, Häussinger D (2009) Hepatic and pancreatic stellate cells in focus. Biol Chem 390:1003–1012
Kordes C, Sawitza I, Muller-Marbach A, Ale-Agha N, Keitel V, Klonowski-Stumpe H, Häussinger D (2007) CD133 + hepatic stellate cells are progenitor cells. Biochem Biophys Res Commun 352:410–417
Kordes C, Sawitza I, Götze S, Häussinger D (2012) Stellate cells from rat pancreas are stem cells and can contribute to liver regeneration. PLoS One 7:e51878
Kordes C, Sawitza I, Götze S, Häussinger D (2013) Hepatic stellate cells support hematopoiesis and are liver-resident mesenchymal stem cells. Cell Physiol Biochem 31:290–304
Korita PV, Wakai T, Shirai Y, Matsuda Y, Sakata J, Takamura M, Yano M, Sanpei A, Aoyagi Y, Hatakeyama K, Ajioka Y (2010) Multidrug resistance-associated protein 2 determines the efficacy of cisplatin in patients with hepatocellular carcinoma. Oncol Rep 23:965–972
Korpal M, Lee ES, Hu G, Kang Y (2008) The miR-200 family inhibits epithelial-mesenchymal transition and cancer cell migration by direct targeting of E-cadherin transcriptional repressors ZEB1 and ZEB2. J Biol Chem 283:14910–14914
Kost DP, Michalopoulos GK (1991) Effect of 2% dimethyl sulfoxide on the mitogenic properties of epidermal growth factor and hepatocyte growth factor in primary hepatocyte culture. J Cell Physiol 147:274–280
Kostrubsky VE, Sinclair JF, Ramachandran V, Venkataramanan R, Wen YH, Kindt E, Galchev V, Rose K, Sinz M, Strom SC (2000) The role of conjugation in hepatotoxicity of troglitazone in human and porcine hepatocyte cultures. Drug Metab Dispos 28:1192–1197
Kotani N, Maeda K, Watanabe T, Hiramatsu M, Gong LK, Bi YA, Takezawa T, Kusuhara H, Sugiyama Y (2011) Culture period-dependent changes in the uptake of transporter substrates in sandwich-cultured rat and human hepatocytes. Drug Metab Dispos 39:1503–1510
Krahenbuhl S, Talos C, Fischer S, Reichen J (1994) Toxicity of bile acids on the electron transport chain of isolated rat liver mitochondria. Hepatology 19:471–479
Kramer W, Stengelin S, Baringhaus KH, Enhsen A, Heuer H, Becker W, Corsiero D, Girbig F, Noll R, Weyland C (1999) Substrate specificity of the ileal and the hepatic Na(+)/bile acid cotransporters of the rabbit. I. Transport studies with membrane vesicles and cell lines expressing the cloned transporters. J Lipid Res 40:1604–1617
Krebs HA (1933) Untersuchungen über den Stoffwechsel der Aminosäuren im Tierkörper. Hoppe-Seyl Z 217:190
Kristensen LS, Nielsen HM, Hansen LL (2009) Epigenetics and cancer treatment. Eur J Pharmacol 625:131–142
Krizhanovsky V, Yon M, Dickins RA, Hearn S, Simon J, Miething C, Yee H, Zender L, Lowe SW (2008) Senescence of activated stellate cells limits liver fibrosis. Cell 134:657–667
Kruithof-de Julio M, Labruyere WT, Ruijter JM, Vermeulen JL, Stanulovic V, Stallen JM, Baldysiak-Figiel A, Gebhardt R, Lamers WH, Hakvoort TB (2005) The RL-ET-14 cell line mediates expression of glutamine synthetase through the upstream enhancer/promoter region. J Hepatol 43:126–131
Krumdieck CL, dos Santos JE, Ho KJ (1980) A new instrument for the rapid preparation of tissue slices. Anal Biochem 104:118–23
Krutzfeldt J, Rajewsky N, Braich R, Rajeev KG, Tuschl T, Manoharan M, Stoffel M (2005) Silencing of microRNAs in vivo with ‘antagomirs’. Nature 438:685–689
Küblbeck J, Reinisalo M, Mustonen R, Honkakoski P (2010) Up-regulation of CYP expression in hepatoma cells stably transfected by chimeric nuclear receptors. Eur J Pharm Sci 40(4):263–272
Kuiper J, Brouwer A, Knook DL, van Berkel TJC (1994) Kupffer and sinusoidal endothelial cells. In: Arias IM, Boyer JL, Fausto N, Jacoby WB, Schachler DA, Shafritz DA (eds) The liver: biology and pathobiology, 3rd edn. Raven Press, New York, pp 791–818
Kullak-Ublick GA, Glasa J, Boker C, Oswald M, Grutzner U, Hagenbuch B, Stieger B, Meier PJ, Beuers U, Kramer W, Wess G, Paumgartner G (1997) Chlorambucil-taurocholate is transported by bile acid carriers expressed in human hepatocellular carcinomas. Gastroenterology 113:1295–1305
Kullak-Ublick GA, Ismair MG, Stieger B, Landmann L, Huber R, Pizzagalli F, Fattinger K, Meier PJ, Hagenbuch B (2001) Organic anion-transporting polypeptide B (OATP-B) and its functional comparison with three other OATPs of human liver. Gastroenterology 120:525–533
Kullak-Ublick GA, Stieger B, Hagenbuch B, Meier PJ (2000) Hepatic transport of bile salts. Semin Liver Dis 20:273–292
Kullak-Ublick GA, Stieger B, Meier PJ (2004) Enterohepatic bile salt transporters in normal physiology and liver disease. Gastroenterology 126:322–342
Kuo FC, Darnell JE Jr (1991) Evidence that interaction of hepatocytes with the collecting (hepatic) veins triggers position-specific transcription of the glutamine synthetase and ornithine aminotransferase genes in the mouse liver. Mol Cell Biol 11:6050–6058
Kurose I, Miura S, Higuchi H, Watanabe N, Kamegaya Y, Takaishi M, Tomita K, Fukumura D, Kato S, Ishii H (1996) Increased nitric oxide synthase activity as a cause of mitochondrial dysfunction in rat hepatocytes: roles for tumor necrosis factor alpha. Hepatology 24:1185–1192
Kusano T, Aoki T, Yasuda D, Matsumoto S, Jin Z, Nishino N, Hayashi K, Odaira M, Yamada K, Koizumi T, Izumida Y, Mitamura K, Enami Y, Niiya T, Murai N, Kato H, Shimizu Y, Kou K, Furukawa Y, Matsusita M, Todo S, Shioda S, Kusano M (2008) Microencapsule technique protects hepatocytes from cryoinjury. Hepatol Res 38:593–600
Kusuhara H, Sugiyama Y (2009) In vitro-in vivo extrapolation of transporter-mediated clearance in the liver and kidney. Drug Metab Pharmacokinet 24:37–52
Lachner M, O’Carroll D, Rea S, Mechtler K, Jenuwein T (2001) Methylation of histone H3 lysine 9 creates a binding site for HP1 proteins. Nature 410:116–120
Lacour S, Gautier JC, Pallardy M, Roberts R (2005) Cytokines as potential biomarkers of liver toxicity. Cancer Biomark 1:29–39
Lacronique V, Mignon A, Fabre M, Viollet B, Rouquet N, Molina T, Porteu A, Henrion A, Bouscary D, Varlet P, Joulin V, Kahn A (1996) Bcl-2 protects from lethal hepatic apoptosis induced by an anti-Fas antibody in mice. Nat Med 2:80–86
Lagaye S, Shen H, Saunier B, Nascimbeni M, Gaston J, Bourdoncle P, Hannoun L, Massault, PP, Vallet-Pichard A, Mallet V, Pol S (2012) Efficient replication of primary or culture hepatitis C virus isolates in human liver slices: a relevant ex vivo model of liver infection. Hepatology
Lagos-Quintana M, Rauhut R, Yalcin A, Meyer J, Lendeckel W, Tuschl T (2002) Identification of tissue-specific microRNAs from mouse. Curr Biol 12:735–739
Lahoz A, Donato MT, Montero S, Castell JV, Gomez-Lechon MJ (2008) A new in vitro approach for the simultaneous determination of phase I and phase II enzymatic activities of human hepatocyte preparations. Rapid Commun Mass Spectrom 22:240–244
Laine JE, Auriola S, Pasanen M, Juvonen RO (2009) Acetaminophen bioactivation by human cytochrome P450 enzymes and animal microsomes. Xenobiotica 39:11–21
Lake BG, Price RJ, Giddings AM, Walters DG (2009) In vitro assays for induction of drug metabolism. Methods Mol Biol 481:47–58
Lako M, Lindsay S, Lincoln J, Cairns PM, Armstrong L, Hole N (2001) Characterisation of Wnt gene expression during the differentiation of murine embryonic stem cells in vitro: role of Wnt3 in enhancing haematopoietic differentiation. Mech Dev 103:49–59
Lam JL, Benet LZ (2004) Hepatic microsome studies are insufficient to characterize in vivo hepatic metabolic clearance and metabolic drug-drug interactions: studies of digoxin metabolism in primary rat hepatocytes versus microsomes. Drug Metab Dispos 32:1311–1316
Lam P, Wang R, Ling V (2005) Bile acid transport in sister of P-glycoprotein (ABCB11) knockout mice. Biochemistry 44:12598–605
Lamba JK, Lamba V, Yasuda K, Lin YS, Assem M, Thompson E, Strom S, Schuetz E (2004) Expression of constitutive androstane receptor splice variants in human tissues and their functional consequences. J Pharmacol Exp Ther 311:811–821
Lamba J, Lamba V, Strom S, Venkataramanan R, Schuetz E (2008) Novel single nucleotide polymorphisms in the promoter and intron 1 of human pregnane X receptor/NR1I2 and their association with CYP3A4 expression. Drug Metab Dispos 36:169–181
Lambert G, Amar MJ, Guo G, Brewer HB Jr, Gonzalez FJ, Sinal CJ (2003) The farnesoid X-receptor is an essential regulator of cholesterol homeostasis. J Biol Chem 278:2563–2570
Lambert CB, Spire C, Renaud MP, Claude N, Guillouzo A (2009) Reproducible chemical-induced changes in gene expression profiles in human hepatoma HepaRG cells under various experimental conditions. Toxicol In Vitro 23:466–475
Lamers W, Moorman A, Charles R (1989) The metabolic lobulus, a key to the architecture of the liver. In: Revisiones Sobre Biologia Celular, Springer, New York
Lammert C, Bjornsson E, Niklasson A, Chalasani N (2010) Oral medications with significant hepatic metabolism at higher risk for hepatic adverse events. Hepatology 51:615–620
Landrier JF, Eloranta JJ, Vavricka SR, Kullak-Ublick GA (2006) The nuclear receptor for bile acids, FXR, transactivates human organic solute transporter-alpha and -beta genes. Am J Physiol Gastrointest Liver Physiol 290:G476–G485
Landry J, Bernier D, Ouellet C, Goyette R, Marceau N (1985) Spheroidal aggregate culture of rat liver cells: histotypic reorganization, biomatrix deposition, and maintenance of functional activities. J Cell Biol 101:914–923
Lanford RE, Hildebrandt-Eriksen ES, Petri A, Persson R, Lindow M, Munk ME, Kauppinen S, Orum H (2010) Therapeutic silencing of microRNA-122 in primates with chronic hepatitis C virus infection. Science 327:198–201
Lang R, Stern MM, Smith L, Liu Y, Bharadwaj S, Liu G, Baptista PM, Bergman CR, Soker S, Yoo JJ, Atala A, Zhang Y (2011) Three-dimensional culture of hepatocytes on porcine liver tissue-derived extracellular matrix. Biomaterials 32:7042–7052
Langenbach R, Malick L, Tompa A, Kuszynski C, Freed H, Huberman E (1979) Maintenance of adult rat hepatocytes on C3H/10T1/2 cells. Cancer Res 39:3509–3514
Laskin DL, Pilaro AM, Ji S (1986) Potential role of activated macrophages in acetaminophen hepatotoxicity. II. Mechanism of macrophage accumulation and activation. Toxicol Appl Pharmacol 86:216–226
Laskin DL, Gardner CR, Price VF, Jollow DJ (1995) Modulation of macrophage functioning abrogates the acute hepatotoxicity of acetaminophen. Hepatology 21:1045–1050
Lave T, Parrott N, Grimm HP, Fleury A, Reddy M (2007) Challenges and opportunities with modelling and simulation in drug discovery and drug development. Xenobiotica 37:1295–1310
le Vee M, Jouan E, Fardel O (2010) Involvement of aryl hydrocarbon receptor in basal and 2,3,7,8-tetrachlorodibenzo-p-dioxin-induced expression of target genes in primary human hepatocytes. Toxicol In Vitro 24:1775–1781
Lecluyse EL (2001) Human hepatocyte culture systems for the in vitro evaluation of cytochrome P450 expression and regulation. Eur J Pharm Sci 13:343–368
Lecluyse EL, Audus KL, Hochman JH (1994) Formation of extensive canalicular networks by rat hepatocytes cultured in collagen-sandwich configuration. Am J Physiol 266:C1764–C1774
Lecluyse EL, Bullock PL, Parkinson A, Hochman JH (1996) Cultured rat hepatocytes. Pharm Biotechnol 8:121–159
Ledwith BJ, Johnson TE, Wagner LK, Pauley CJ, Manam S, Galloway SM, Nichols WW (1996) Growth regulation by peroxisome proliferators: opposing activities in early and late G1. Cancer Res 56:3257–3264
Lee HK, Lewis LD (2011) Pharmacogenetics of flucloxacillin and amoxicillin-clavulanate associated hepatic dysfunction/injury. In: Wu AHB, Yeo KTJ (eds) Pharmacogenomic testing in current clinical practice. implementation in the clinical laboratory, pp 239–247
Lee CH, Bradley G, Zhang JT, Ling V (1993) Differential expression of P-glycoprotein genes in primary rat hepatocyte culture. J Cell Physiol 157:392–402
Lee HK, Lee YK, Park SH, Kim YS, Park SH, Lee JW, Kwon HB, Soh J, Moore DD, Choi HS (1998) Structure and expression of the orphan nuclear receptor SHP gene. J Biol Chem 273:14398–14402
Lee YK, Dell H, Dowhan DH, Hadzopoulou-Cladaras M, Moore DD (2000) The orphan nuclear receptor SHP inhibits hepatocyte nuclear factor 4 and retinoid X receptor transactivation: two mechanisms for repression. Mol Cell Biol 20:187–195
Lee WM (2003) Drug-induced hepatotoxicity. N Engl J Med 349:474–485
Lee CM, Yeoh GC, Olynyk JK (2004) Differential effects of gadolinium chloride on Kupffer cells in vivo and in vitro. Int J Biochem Cell Biol 36:481–488
Lee W, Glaeser H, Smith LH, Roberts RL, Moeckel GW, Gervasini G, Leake BF, Kim RB (2005) Polymorphisms in human organic anion-transporting polypeptide 1A2 (OATP1A2): implications for altered drug disposition and central nervous system drug entry. J Biol Chem 280:9610–9617
Lee PJ, Hung PJ, Lee LP (2007) An artificial liver sinusoid with a microfluidic endothelial-like barrier for primary hepatocyte culture. Biotechnol Bioeng 97:1340–1346
Lee J, Padhye A, Sharma A, Song G, Miao J, Mo YY, Wang L, Kemper JK (2010) A pathway involving farnesoid X receptor and small heterodimer partner positively regulates hepatic sirtuin 1 levels via microRNA-34a inhibition. J Biol Chem 285:12604–12611
Lee CG, Kim YW, Kim EH, Meng Z, Huang W, Hwang SJ, Kim SG (2012) Farnesoid X receptor protects hepatocytes from injury by repressing miR-199a-3p, which increases levels of LKB1. Gastroenterology 142(1206–1217):e7
Lefebvre P, Cariou B, Lien F, Kuipers F, Staels B (2009) Role of bile acids and bile acid receptors in metabolic regulation. Physiol Rev 89:147–191
Lefebvre P, Chinetti G, Fruchart JC, Staels B (2006) Sorting out the roles of PPAR alpha in energy metabolism and vascular homeostasis. J Clin Invest 116:571–580
Lelbach A, Scharf JG, Ramadori G (2001) Regulation of insulin-like growth factor-I and of insulin-like growth factor binding protein-1, -3 and -4 in cocultures of rat hepatocytes and Kupffer cells by interleukin-6. J Hepatol 35:558–567
Lemaire B, Beck M, Jaspart M, Debier C, Calderon PB, Thome JP, Rees JF (2011) Precision-Cut Liver Slices of Salmo salar as a tool to investigate the oxidative impact of CYP1A-mediated PCB 126 and 3-methylcholanthrene metabolism. Toxicol In Vitro 25:335–342
Lerche-Langrand C, Toutain HJ (2000) Precision-cut liver slices: characteristics and use for in vitro pharmaco-toxicology. Toxicology 153:221–253
Leu JI, Crissey MA, Craig LE, Taub R (2003) Impaired hepatocyte DNA synthetic response posthepatectomy in insulin-like growth factor binding protein 1-deficient mice with defects in C/EBP beta and mitogen-activated protein kinase/extracellular signal-regulated kinase regulation. Mol Cell Biol 23:1251–1259
Leuthold S, Hagenbuch B, Mohebbi N, Wagner CA, Meier PJ, Stieger B (2009) Mechanisms of pH-gradient driven transport mediated by organic anion polypeptide transporters. Am J Physiol Cell Physiol 296:C570–C582
Leverrier Y, Ridley AJ (2001) Apoptosis: caspases orchestrate the ROCK ‘n’ bleb. Nat Cell Biol 3:E91–E93
Lewis BP, Burge CB, Bartel DP (2005) Conserved seed pairing, often flanked by adenosines, indicates that thousands of human genes are microRNA targets. Cell 120:15–20
Li T, Chiang JY (2005) Mechanism of rifampicin and pregnane X receptor inhibition of human cholesterol 7 alpha-hydroxylase gene transcription. Am J Physiol Gastrointest Liver Physiol 288:G74–G84
Li AP, Colburn SM, Beck DJ (1992) A simplified method for the culturing of primary adult rat and human hepatocytes as multicellular spheroids. In Vitro Cell Dev Biol 28A:673–677
Li Q, Kay MA, Finegold M, Stratford-Perricaudet LD, Woo SL (1993) Assessment of recombinant adenoviral vectors for hepatic gene therapy. Hum Gene Ther 4:403–409
Li AP, Maurel P, Gomez-Lechon MJ, Cheng LC, Jurima-Romet M (1997) Preclinical evaluation of drug-drug interaction potential: present status of the application of primary human hepatocytes in the evaluation of cytochrome P450 induction. Chem Biol Interact 107:5–16
Li L, Lee TK, Meier PJ, Ballatori N (1998) Identification of glutathione as a driving force and leukotriene C4 as a substrate for oatp1, the hepatic sinusoidal organic solute transporter. J Biol Chem 273:16184–16191
Li H, Zhu H, Xu CJ, Yuan J (1998) Cleavage of BID by caspase 8 mediates the mitochondrial damage in the Fas pathway of apoptosis. Cell 94:491–501
Li AP, Gorycki PD, Hengstler JG, Kedderis GL, Koebe HG, Rahmani R, de Sousas G, Silva JM, Skett P (1999) Present status of the application of cryopreserved hepatocytes in the evaluation of xenobiotics: consensus of an international expert panel. Chem Biol Interact 121:117–123
Li L, Meier PJ, Ballatori N (2000) Oatp2 mediates bidirectional organic solute transport: a role for intracellular glutathione. Mol Pharmacol 58:335–40
Li N, Hartley DP, Cherrington NJ, Klaassen CD (2002) Tissue expression, ontogeny, and inducibility of rat organic anion transporting polypeptide 4. J Pharmacol Exp Ther 301:551–560
Li J, Kaneko T, Wang Y, Qin LQ, Wang PY, Sato A (2002) Troglitazone enhances the hepatotoxicity of acetaminophen by inducing CYP3A in rats. Toxicology 176:91–100
Li S, Sanna S, Maschio A, Busonero F, Usala G, Mulas A, Lai S, Dei M, Orru M, Albai G, Bandinelli S, Schlessinger D, Lakatta E, Scuteri A, Najjar SS, Guralnik J, Naitza S, Crisponi L, Cao A, Abecasis G, Ferrucci L, Uda M, Chen WM, Nagaraja R (2007) The GLUT9 gene is associated with serum uric acid levels in Sardinia and Chianti cohorts. PLoS Genet 3:e194
Li M, Yuan H, Li N, Song G, Zheng Y, Baratta M, Hua F, Thurston A, Wang J, Lai Y (2008) Identification of interspecies difference in efflux transporters of hepatocytes from dog, rat, monkey and human. Eur J Pharm Sci 35:114–26
Li N, Bi YA, Duignan DB, Lai Y (2009a) Quantitative expression profile of hepatobiliary transporters in sandwich cultured rat and human hepatocytes. Mol Pharm 6:1180–1189
Li L, Jick H, Jick SS (2009b) Updated study on risk of cholestatic liver disease and flucloxacillin. Br J Clin Pharmacol 68:269–270
Li R, Oteiza A, Sorensen KK, McCourt P, Olsen R, Smedsrod B, Svistounov D (2011) Role of liver sinusoidal endothelial cells and stabilins in elimination of oxidized low-density lipoproteins. Am J Physiol Gastrointest Liver Physiol 300:G71–G81
Liang D, Hagenbuch B, Stieger B, Meier PJ (1993) Parallel decrease of Na(+)-taurocholate cotransport and its encoding mRNA in primary cultures of rat hepatocytes. Hepatology 18:1162–1166
Liao W, Ning G (2006) Knockdown of apolipoprotein B, an atherogenic apolipoprotein, in HepG2 cells by lentivirus-mediated siRNA. Biochem Biophys Res Commun 344:478–483
Liao X, Wang Y, Wong CW (2010) Troglitazone induces cytotoxicity in part by promoting the degradation of peroxisome proliferator-activated receptor gamma co-activator-1alpha protein. Br J Pharmacol 161:771–781
Liedtke C, Trautwein C (2011) The role of TNF and Fas dependent signaling in animal models of inflammatory liver injury and liver cancer. Eur J Cell Biol 91:582–589
Lillegard JB, Fisher JE, Nedredal G, Luebke-Wheeler J, Bao J, Wang W, Amoit B, Nyberg SL (2011) Normal atmospheric oxygen tension and the use of antioxidants improve hepatocyte spheroid viability and function. J Cell Physiol 226:2987–2996
Lim PL, Liu J, Go ML, Boelsterli UA (2008) The mitochondrial superoxide/thioredoxin-2/Ask1 signaling pathway is critically involved in troglitazone-induced cell injury to human hepatocytes. Toxicol Sci 101:341–349
Limmer A, Knolle PA (2001) Liver sinusoidal endothelial cells: a new type of organ-resident antigen-presenting cell. Arch Immunol Ther Exp (Warsz) 49(Suppl 1):S7–S11
Lin KH, Hino H, Maeda S, Inagaki H, Airat JV, Saito T (1995) Albumin synthesis by rat hepatocytes cultured on collagen gels is sustained specifically by heparin. Exp Cell Res 219:717–721
Lin RZ, Chang HY (2008) Recent advances in three-dimensional multicellular spheroid culture for biomedical research. Biotechnol J 3:1172–1184
Lindros KO, Penttila KE (1985) Digitonin-collagenase perfusion for efficient separation of periportal or perivenous hepatocytes. Biochem J 228:757–760
Link E, Parish S, Armitage J, Bowman L, Heath S, Matsuda F, Gut I, Lathrop M, Collins R (2008) SLCO1B1 variants and statin-induced myopathy–a genomewide study. N Engl J Med 359:789–799
Lipniacki T, Paszek P, Brasier AR, Luxon B, Kimmel M (2004) Mathematical model of NF-kappaB regulatory module. J Theor Biol 228:195–215
Lippincott JB (1993) Diseases of the liver. Wiley-Blackwell, Philadelphia
Liu X, Brouwer KL, Gan LS, Brouwer KR, Stieger B, Meier PJ, Audus KL, Lecluyse EL (1998) Partial maintenance of taurocholate uptake by adult rat hepatocytes cultured in a collagen sandwich configuration. Pharm Res 15:1533–9
Liu X, Lecluyse EL, Brouwer KR, Gan LS, Lemasters JJ, Stieger B, Meier PJ, Brouwer KL (1999) Biliary excretion in primary rat hepatocytes cultured in a collagen-sandwich configuration. Am J Physiol 277:G12–G21
Liu ZX, Govindarajan S, Kaplowitz N (2004) Innate immune system plays a critical role in determining the progression and severity of acetaminophen hepatotoxicity. Gastroenterology 127:1760–1774
Liu ZX, Han D, Gunawan B, Kaplowitz N (2006) Neutrophil depletion protects against murine acetaminophen hepatotoxicity. Hepatology 43:1220–1230
Liu H, Zheng F, Cao Q, Ren B, Zhu L, Striker G, Vlassara H (2006) Amelioration of oxidant stress by the defensin lysozyme. Am J Physiol Endocrinol Metab 290:E824–E832
Liu J, Abate W, Xu J, Corry D, Kaul B, Jackson SK (2011) Three-dimensional spheroid cultures of A549 and HepG2 cells exhibit different lipopolysaccharide (LPS) receptor expression and LPS-induced cytokine response compared with monolayer cultures. Innate Immun 17:245–255
Llambi F, Moldoveanu T, Tait SW, Bouchier-Hayes L, Temirov J, McCormick LL, Dillon CP, Green DR (2011) A unified model of mammalian BCL-2 protein family interactions at the mitochondria. Mol Cell 44:517–531
Loeppen S, Schneider D, Gaunitz F, Gebhardt R, Kurek R, Buchmann A, Schwarz M (2002) Overexpression of glutamine synthetase is associated with beta-catenin-mutations in mouse liver tumors during promotion of hepatocarcinogenesis by phenobarbital. Cancer Res 62:5685–5688
Loeppen S, Koehle C, Buchmann A, Schwarz M (2005) A beta-catenin-dependent pathway regulates expression of cytochrome P450 isoforms in mouse liver tumors. Carcinogenesis 26:239–2348
Lorber M, Patterson D, Huwe J, Kahn H (2009) Evaluation of background exposures of Americans to dioxin-like compounds in the 1990s and the 2000s. Chemosphere 77:640–51
Loscher W, Potschka H (2005) Drug resistance in brain diseases and the role of drug efflux transporters. Nat Rev Neurosci 6:591–602
Lu C, Li P, Gallegos R, Uttamsingh V, Xia CQ, Miwa GT, Balani SK, Gan LS (2006) Comparison of intrinsic clearance in liver microsomes and hepatocytes from rats and humans: evaluation of free fraction and uptake in hepatocytes. Drug Metab Dispos 34:1600–1605
Lubberstedt M, Muller-Vieira U, Mayer M, Biemel KM, Knospel F, Knobeloch D, Nussler AK, Gerlach JC, Zeilinger K (2011) HepaRG human hepatic cell line utility as a surrogate for primary human hepatocytes in drug metabolism assessment in vitro. J Pharmacol Toxicol Methods 63:59–68
Lucier GW, Tritscher A, Goldsworthy T, Foley J, Clark G, Goldstein J, Maronpot R (1991) Ovarian hormones enhance 2,3,7,8-tetrachlorodibenzo-p-dioxin-mediated increases in cell proliferation and preneoplastic foci in a two-stage model for rat hepatocarcinogenesis. Cancer Res 51:1391–1397
Luebeck EG, Buchmann A, Stinchcombe S, Moolgavkar SH, Schwarz M (2000) Effects of 2,3,7,8-tetrachlorodibenzo-p-dioxin on initiation and promotion of GST-P-positive foci in rat liver: A quantitative analysis of experimental data using a stochastic model. Toxicol Appl Pharmacol 167:63–73
Lund E, Guttinger S, Calado A, Dahlberg JE, Kutay U (2004) Nuclear export of microRNA precursors. Science 303:95–98
Lustig B, Behrens J (2003) The Wnt signaling pathway and its role in tumor development. J Cancer Res Clin Oncol 129:199–221
Luthi AU, Martin SJ (2007) The CASBAH: a searchable database of caspase substrates. Cell Death Differ 14:641–650
Ly VT, Brock B (2011) Effects of CYP inhibitors on precocene I metabolism and toxicity in rat liver slices. Chem Biol Interact 193:109–118
Lysz TW, Billiar TR, Curran RD, Simmons RL, Machiedo GW (1990) Kupffer cell-hepatocyte interactions and the changes in 1–14C-arachidonate incorporation in response to endotoxin in vitro. Prostaglandins 39:497–514
Ma PX, Zhang R (1999) Synthetic nano-scale fibrous extracellular matrix. J Biomed Mater Res 46:60–72
Macanas-Pirard P, Yaacob NS, Lee PC, Holder JC, Hinton RH, Kass GE (2005) Glycogen synthase kinase-3 mediates acetaminophen-induced apoptosis in human hepatoma cells. J Pharmacol Exp Ther 313:780–789
Macdougall JD, McCabe M (1967) Diffusion coefficient of oxygen through tissues. Nature 215:1173–1174
Mace K, Gonzalez FJ, McConnell IR, Garner RC, Avanti O, Harris CC, Pfeifer AM (1994) Activation of promutagens in a human bronchial epithelial cell line stably expressing human cytochrome P450 1A2. Mol Carcinog 11:65–73
Mace K, Aguilar F, Wang JS, Vautravers P, Gomez-Lechon M, Gonzalez FJ, Groopman J, Harris CC, Pfeifer AM (1997) Aflatoxin B1-induced DNA adduct formation and p53 mutations in CYP450-expressing human liver cell lines. Carcinogenesis 18:1291–1297
Machide M, Hashigasako A, Matsumoto K, Nakamura T (2006) Contact inhibition of hepatocyte growth regulated by functional association of the c-Met/hepatocyte growth factor receptor and LAR protein-tyrosine phosphatase. J Biol Chem 281:8765–8772
Mack AA, Kroboth S, Rajesh D, Wang WB (2011) Generation of induced pluripotent stem cells from CD34 + cells across blood drawn from multiple donors with non-integrating episomal vectors. PLoS One 6:e27956
Mackiewicz A, Ganapathi MK, Schultz D, Samols D, Reese J, Kushner I (1988) Regulation of rabbit acute phase protein biosynthesis by monokines. Biochem J 253:851–857
Maeda K, Ikeda Y, Fujita T, Yoshida K, Azuma Y, Haruyama Y, Yamane N, Kumagai Y, Sugiyama Y (2011) Identification of the rate-determining process in the hepatic clearance of atorvastatin in a clinical cassette microdosing study. Clin Pharmacol Ther 90:575–581
Maeda K, Shitara Y, Horie T, Sugiyama Y (2010) Web-based database as a tool to examine drug-drug interactions involving transporters. Springer, Berlin
Magalhães R, Nugraha B, Pervaiz S, Yu H, Kuleshova LL (2012) Influence of cell culture configuration on the post-cryopreservation viability of primary rat hepatocytes. Biomaterials 33:829–836
Maglich JM, Stoltz CM, Goodwin B, Hawkins-Brown D, Moore JT, Kliewer SA (2002) Nuclear pregnane x receptor and constitutive androstane receptor regulate overlapping but distinct sets of genes involved in xenobiotic detoxification. Mol Pharmacol 62:638–646
Mahagita C, Grassl SM, Piyachaturawat P, Ballatori N (2007) Human organic anion transporter 1B1 and 1B3 function as bidirectional carriers and do not mediate GSH-bile acid cotransport. Am J Physiol Gastrointest Liver Physiol 293:G271–G278
Maher JJ, Lozier JS, Scott MK (1998) Rat hepatic stellate cells produce cytokine-induced neutrophil chemoattractant in culture and in vivo. Am J Physiol 275:G847–G853
Maier K, Hofmann U, Reuss M, Mauch K (2008) Identification of metabolic fluxes in hepatic cells from transient 13C-labeling experiments: part II. Flux estimation. Biotechnol Bioeng 100:355–370
Maier K, Hofmann U, Reuss M, Mauch K (2010) Dynamics and control of the central carbon metabolism in hepatoma cells. BMC Syst Biol 4:54
Makishima M, Okamoto AY, Repa JJ, Tu H, Learned RM, Luk A, Hull MV, Lustig KD, Mangelsdorf DJ, Shan B (1999) Identification of a nuclear receptor for bile acids. Science 284:1362–1365
Makishima M, Lu TT, Xie W, Whitfield GK, Domoto H, Evans RM, Haussler MR, Mangelsdorf DJ (2002) Vitamin D receptor as an intestinal bile acid sensor. Science 296:1313–1316
Malhi H, Gores GJ (2008) Cellular and molecular mechanisms of liver injury. Gastroenterology 134:1641–1654
Malhi H, Gores GJ, Lemasters JJ (2006) Apoptosis and necrosis in the liver: a tale of two deaths? Hepatology 43:S31–S44
Malhi H, Barreyro FJ, Isomoto H, Bronk SF, Gores GJ (2007) Free fatty acids sensitise hepatocytes to TRAIL mediated cytotoxicity. Gut 56:1124–1131
Malhi H, Guicciardi ME, Gores GJ (2010) Hepatocyte death: a clear and present danger. Physiol Rev 90:1165–94
Mallal S, Nolan D, Witt C, Masel G, Martin AM, Moore C, Sayer D, Castley A, Mamotte C, Maxwell D, James I, Christiansen FT (2002) Association between presence of HLA-B*5701, HLA-DR7, and HLA-DQ3 and hypersensitivity to HIV-1 reverse-transcriptase inhibitor abacavir. Lancet 359:727–732
Malovic I, Sorensen KK, Elvevold KH, Nedredal GI, Paulsen S, Erofeev AV, Smedsrod BH, McCourt PA (2007) The mannose receptor on murine liver sinusoidal endothelial cells is the main denatured collagen clearance receptor. Hepatology 45:1454–1461
Mandard S, Muller M, Kersten S (2004) Peroxisome proliferator-activated receptor alpha target genes. Cell Mol Life Sci 61:393–416
Mantovani A, Cassatella MA, Costantini C, Jaillon S (2011) Neutrophils in the activation and regulation of innate and adaptive immunity. Nat Rev Immunol 11:519–531
Mareninova O, Shin JM, Vagin O, Turdikulova S, Hallen S, Sachs G (2005) Topography of the membrane domain of the liver Na + -dependent bile acid transporter. Biochemistry 44:13702–13712
Maronpot RR, Foley JF, Takahashi K, Goldsworthy T, Clark G, Tritscher A, Portier C, Lucier G (1993) Dose response for TCDD promotion of hepatocarcinogenesis in rats initiated with DEN: histologic, biochemical, and cell proliferation endpoints. Environ Health Perspect 101:634–642
Marquardt JU, Raggi C, Andersen JB, Seo D, Avital I, Geller D, Lee YH, Kitade M, Holczbauer A, Gillen MC, Conner EA, Factor VM, Thorgeirsson SS (2011) Human hepatic cancer stem cells are characterized by common stemness traits and diverse oncogenic pathways. Hepatology 54:1031–1042
Marquart TJ, Allen RM, Ory DS, Baldan A (2010) miR-33 links SREBP-2 induction to repression of sterol transporters. Proc Natl Acad Sci USA 107:12228–12232
Marquez B, van Bambeke F (2011) ABC multidrug transporters: target for modulation of drug pharmacokinetics and drug-drug interactions. Curr Drug Targets 12:600–620
Marquez RT, Wendlandt E, Galle CS, Keck K, McCaffrey AP (2010) MicroRNA-21 is upregulated during the proliferative phase of liver regeneration, targets Pellino-1, and inhibits NF-kappaB signaling. Am J Physiol Gastrointest Liver Physiol 298:G535–G5341
Marra F, Grandaliano G, Valente AJ, Abboud HE (1995) Thrombin stimulates proliferation of liver fat-storing cells and expression of monocyte chemotactic protein-1: potential role in liver injury. Hepatology 22:780–787
Martin-Armas M, Simon-Santamaria J, Pettersen I, Moens U, Smedsrod B, Sveinbjornsson B (2006) Toll-like receptor 9 (TLR9) is present in murine liver sinusoidal endothelial cells (LSECs) and mediates the effect of CpG-oligonucleotides. J Hepatol 44:939–946
Martin H, Sarsat JP, Lerche-Langrand C, Housset C, Balladur P, Toutain H, Albaladejo V (2002) Morphological and biochemical integrity of human liver slices in long-term culture: effects of oxygen tension. Cell Biol Toxicol 18:73–85
Martin AM, Nolan D, James I, Cameron P, Keller J, Moore C, Phillips E, Christiansen FT, Mallal S (2005) Predisposition to nevirapine hypersensitivity associated with HLA-DRB1*0101 and abrogated by low CD4 T-cell counts. AIDS 19(1):97–99
Martin SF, Esser PR, Schmucker S, Dietz L, Naisbitt DJ, Park BK, Vocanson M, Nicolas JF, Keller M, Pichler WJ, Peiser M, Luch A, Wanner R, Maggi E, Cavani A, Rustemeyer T, Richter A, Thierse HJ, Sallusto F (2010) T-cell recognition of chemicals, protein allergens and drugs: towards the development of in vitro assays. Cell Mol Life Sci 67:4171–4184
Martinez-Hernandez A, Amenta PS (1993) The hepatic extracellular matrix. I. Components and distribution in normal liver. Virchows Arch A Pathol Anat Histopathol 423:1–11
Martinez-Jimenez CP, Jover R, Donato MT, Castell JV, Gomez-Lechon MJ (2007) Transcriptional regulation and expression of CYP3A4 in hepatocytes. Curr Drug Metab 8:185–194
Martins PN, Theruvath TP, Neuhaus P (2008) Rodent models of partial hepatectomies. Liver Int 28:3–11
Maruyama T, Miyamoto Y, Nakamura T, Tamai Y, Okada H, Sugiyama E, Nakamura T, Itadani H, Tanaka K (2002) Identification of membrane-type receptor for bile acids (M-BAR). Biochem Biophys Res Commun 298:714–719
Massie I, Selden C, Morris J, Hodgson H, Fuller B (2011) Cryopreservation of encapsulated liver spheroids using a cryogen-free cooler: high functional recovery using a multi-step cooling profile. Cryo Letters 32:158–165
Masson MJ, Carpenter LD, Graf ML, Pohl LR (2008) Pathogenic role of natural killer T and natural killer cells in acetaminophen-induced liver injury in mice is dependent on the presence of dimethyl sulfoxide. Hepatology 48:889–897
Masubuchi Y (2006) Metabolic and non-metabolic factors determining troglitazone hepatotoxicity: a review. Drug Metab Pharmacokinet 21:347–356
Mathew LK, Simonich MT, Tanguay RL (2009) AHR-dependent misregulation of Wnt signaling disrupts tissue regeneration. Biochem Pharmacol 77:498–507
Mathijs K, Kienhuis AS, Brauers KJ, Jennen DG, Lahoz A, Kleinjans JC, van Delft JH (2009) Assessing the metabolic competence of sandwich-cultured mouse primary hepatocytes. Drug Metab Dispos 37:1305–1311
Matsui H, Takeuchi S, Osada T, Fujii T, Sakai Y (2012) Enhanced bile canaliculi formation enabling direct recovery of biliary metabolites of hepatocytes in 3D collagen gel microcavities. Lab Chip 12:1857–1864
Matsumura H, Shimizu Y, Ohsawa Y, Kawahara A, Uchiyama Y, Nagata S (2000) Necrotic death pathway in Fas receptor signaling. J Cell Biol 151:1247–1256
Mayhew BS, Jones DR, Hall SD (2000) An in vitro model for predicting in vivo inhibition of cytochrome P450 3A4 by metabolic intermediate complex formation. Drug Metab Dispos 28:1031–1037
McClelland R, Wauthier E, Uronis J, Reid L (2008) Gradients in the liver’s extracellular matrix chemistry from periportal to pericentral zones: influence on human hepatic progenitors. Tissue Eng Part A 14:59–70
McCourt PA, Smedsrod BH, Melkko J, Johansson S (1999) Characterization of a hyaluronan receptor on rat sinusoidal liver endothelial cells and its functional relationship to scavenger receptors. Hepatology 30:1276–1286
McCullough CT, Tura BJ, Harrison DJ (2007) c-Myc partially mediates IFNgamma-induced apoptosis in the primary hepatocyte. Int J Exp Pathol 88:129–136
McCuskey RS, Bethea NW, Wong J, McCuskey MK, Abril ER, Wang X, Ito Y, Deleve LD (2005) Ethanol binging exacerbates sinusoidal endothelial and parenchymal injury elicited by acetaminophen. J Hepatol 42:371–377
McDonald B, Pittman K, Menezes GB, Hirota SA, Slaba I, Waterhouse CC, Beck PL, Muruve DA, Kubes P (2010) Intravascular danger signals guide neutrophils to sites of sterile inflammation. Science 330:362–366
McGill MR, Sharpe MR, Williams CD, Taha M, Curry SC, Jaeschke H (2012) The mechanism underlying acetaminophen-induced hepatotoxicity in humans and mice involves mitochondrial damage and nuclear DNA fragmentation. J Clin Invest 122:1574–1583
McGill MR, Yan HM, Ramachandran A, Murray GJ, Rollins DE, Jaeschke H (2011) HepaRG cells: a human model to study mechanisms of acetaminophen hepatotoxicity. Hepatology 53:974–982
McGinnity DF, Soars MG, Urbanowicz RA, Riley RJ (2004) Evaluation of fresh and cryopreserved hepatocytes as in vitro drug metabolism tools for the prediction of metabolic clearance. Drug Metab Dispos 32:1247–1253
Meehan RR, Lewis JD, McKay S, Kleiner EL, Bird AP (1989) Identification of a mammalian protein that binds specifically to DNA containing methylated CpGs. Cell 58:499–507
Meier PJ (1988) Transport polarity of hepatocytes. Semin Liver Dis 8:293–307
Meier PJ, Stieger B (2002) Bile salt transporters. Annu Rev Physiol 64:635–661
Meier PJ, Sztul ES, Reuben A, Boyer JL (1984) Structural and functional polarity of canalicular and basolateral plasma membrane vesicles isolated in high yield from rat liver. J Cell Biol 98:991–1000
Meier PJ, Eckhardt U, Schroeder A, Hagenbuch B, Stieger B (1997) Substrate specificity of sinusoidal bile acid and organic anion uptake systems in rat and human liver. Hepatology 26:1667–1677
Meier P, Finch A, Evan G (2000) Apoptosis in development. Nature 407:796–801
Meier Y, Pauli-Magnus C, Zanger UM, Klein K, Schaeffeler E, Nussler AK, Nussler N, Eichelbaum M, Meier PJ, Stieger B (2006) Interindividual variability of canalicular ATP-binding-cassette (ABC)-transporter expression in human liver. Hepatology 44:62–74
Meijer AJ, Lamers WH, Chamuleau RA (1990) Nitrogen metabolism and ornithine cycle function. Physiol Rev 70:701–748
Meijer C, Wiezer MJ, Diehl AM, Schouten HJ, Schouten HJ, Meijer S, van Rooijen N, van Lambalgen AA, Dijkstra CD, van Leeuwen PA (2000) Kupffer cell depletion by CI2MDP-liposomes alters hepatic cytokine expression and delays liver regeneration after partial hepatectomy. Liver 20:66–77
Melgert BN, Olinga P, Jack VK, Molema G, Meijer DK, Poelstra K (2000) Dexamethasone coupled to albumin is selectively taken up by rat nonparenchymal liver cells and attenuates LPS-induced activation of hepatic cells. J Hepatol 32:603–611
Melgert BN, Olinga P, van der Laan JM, Weert B, Cho J, Schuppan D, Groothuis GM, Meijer DK, Poelstra K (2001) Targeting dexamethasone to Kupffer cells: effects on liver inflammation and fibrosis in rats. Hepatology 34:719–728
Meng Q (2003) Hypothermic preservation of hepatocytes. Biotechnol Prog 19:1118–1127
Meng Q (2010) Three-dimensional culture of hepatocytes for prediction of drug-induced hepatotoxicity. Expert Opin Drug Metab Toxicol 6:733–746
Menochet K, Kenworthy KE, Houston JB, Galetin A (2012) Simultaneous assessment of uptake and metabolism in rat hepatocytes: a comprehensive mechanistic model. J Pharmacol Exp Ther 341:2–15
Meyer zu Schwabedissen HE, Bottcher K, Chaudhry A, Kroemer HK, Schuetz EG, Kim RB (2010) Liver X receptor alpha and farnesoid X receptor are major transcriptional regulators of OATP1B1. Hepatology 52:1797–1807
Meyer zu Schwabedissen H, Kroemer H (2011) In vitro and in vivo evidence for the importance of breast cancer resistance protein transporters (BCRP/MXR/ABCP/ABCG2). Handb Exp Pharmacol 325–371
Miao J, Fang S, Bae Y, Kemper JK (2006) Functional inhibitory cross-talk between constitutive androstane receptor and hepatic nuclear factor-4 in hepatic lipid/glucose metabolism is mediated by competition for binding to the DR1 motif and to the common coactivators, GRIP-1 and PGC-1alpha. J Biol Chem 281:14537–1446
Michael SL, Pumford NR, Mayeux PR, Niesman MR, Hinson JA (1999) Pretreatment of mice with macrophage inactivators decreases acetaminophen hepatotoxicity and the formation of reactive oxygen and nitrogen species. Hepatology 30:186–195
Michalik L, Wahli W (2008) PPARs Mediate Lipid Signaling in Inflammation and Cancer. PPAR Res 2008:134059
Michalopoulos G, Sattler GL, Pitot HC (1976) Maintenance of microsomal cytochromes b5 and P-450 in primary cultures of parenchymal liver cells on collagen membranes. Life Sci 18:1139–1144
Michalopoulos GK (2007) Liver regeneration. J Cell Physiol 213:286–300
Micheau O, Tschopp J (2003) Induction of TNF receptor I-mediated apoptosis via two sequential signaling complexes. Cell 114:181–190
Mikkaichi T, Suzuki T, Tanemoto M, Ito S, Abe T (2004) The organic anion transporter (OATP) family. Drug Metab Pharmacokinet 19:171–179
Mikos AG, Sarakinos G, Leite SM, Vacanti JP, Langer R (1993) Laminated three-dimensional biodegradable foams for use in tissue engineering. Biomaterials 14:323–330
Miller LL, Bly CG, Watson ML, Bale WF (1951) The dominant role of the liver in plasma protein synthesis; a direct study of the isolated perfused rat liver with the aid of lysine-epsilon-C14. J Exp Med 94:431–453
Milosevic N, Schawalder H, Maier P (1999) Kupffer cell-mediated differential down-regulation of cytochrome P450 metabolism in rat hepatocytes. Eur J Pharmacol 368:75–87
Minter RM, Fan MH, Sun J, Niederbichler A, Ipaktchi K, Arbabi S, Hemmila MR, Remick DG, Wang SC, Su GL (2005) Altered Kupffer cell function in biliary obstruction. Surgery 138:236–245
Miranda JP, Leite SB, Muller-Vieira U, Rodrigues A, Carrondo MJ, Alves PM (2009) Towards an extended functional hepatocyte in vitro culture. Tissue Eng Part C Methods 15:157–167
Mita S, Suzuki H, Akita H, Hayashi H, Onuki R, Hofmann AF, Sugiyama Y (2006) Vectorial transport of unconjugated and conjugated bile salts by monolayers of LLC-PK1 cells doubly transfected with human NTCP and BSEP or with rat Ntcp and Bsep. Am J Physiol Gastrointest Liver Physiol 290(3):G550–G556
Mitaka T (1998) The current status of primary hepatocyte culture. Int J Exp Pathol 79:393–409
Mitaka T, Ooe H (2010) Characterization of hepatic-organoid cultures. Drug Metab Rev 42:472–481
Mitaka T, Sato F, Mizuguchi T, Yokono T, Mochizuki Y (1999) Reconstruction of hepatic organoid by rat small hepatocytes and hepatic nonparenchymal cells. Hepatology 29:111–125
Mitchell KA, Lockhart CA, Huang G, Elferink CJ (2006) Sustained aryl hydrocarbon receptor activity attenuates liver regeneration. Mol Pharmacol 70:163–170
Mitchell PS, Parkin RK, Kroh EM, Fritz BR, Wyman SK, Pogosova-Agadjanyan EL, Peterson A, Noteboom J, O’Briant KC, Allen A, Lin DW, Urban N, Drescher CW, Knudsen BS, Stirewalt DL, Gentleman R, Vessella RL, Nelson PS, Martin DB, Tewari M (2008) Circulating microRNAs as stable blood-based markers for cancer detection. Proc Natl Acad Sci USA 105:10513–10518
Miyamoto Y, Teramoto N, Hayashi S, Enosawa S (2010) An improvement in the attaching capability of cryopreserved human hepatocytes by a proteinaceous high molecule, sericin, in the serum-free solution. Cell Transpl 19:701–706
Mizuguchi T, Mitaka T, Hirata K, Oda H, Mochizuki Y (1998) Alteration of expression of liver-enriched transcription factors in the transition between growth and differentiation of primary cultured rat hepatocytes. J Cell Physiol 174:273–284
Mocarelli P, Gerthoux PM, Patterson DG Jr, Milani S, Limonta G, Bertona M, Signorini S, Tramacere P, Colombo L, Crespi C, Brambilla P, Sarto C, Carreri V, Sampson EJ, Turner WE, Needham LL (2008) Dioxin exposure, from infancy through puberty, produces endocrine disruption and affects human semen quality. Environ Health Perspect 116:70–77
Modica S, Gadaleta RM, Moschetta A (2010) Deciphering the nuclear bile acid receptor FXR paradigm. Nucl Recept Signal 8:e005
Moennikes O, Loeppen S, Buchmann A, Andersson P, Ittrich C, Poellinger L, Schwarz M (2004) A constitutively active dioxin/aryl hydrocarbon receptor promotes hepatocarcinogenesis in mice. Cancer Res 64:4707–4710
Moghe PV, Coger RN, Toner M, Yarmush ML (1997) Cell-cell interactions are essential for maintenance of hepatocyte function in collagen gel but not on matrigel. Biotechnol Bioeng 56:706–711
Mohn KL, Melby AE, Tewari DS, Laz TM, Taub R (1991) The gene encoding rat insulinlike growth factor-binding protein 1 is rapidly and highly induced in regenerating liver. Mol Cell Biol 11:1393–1401
Mohri T, Nakajima M, Takagi S, Komagata S, Yokoi T (2009) MicroRNA regulates human vitamin D receptor. Int J Cancer 125:1328–1333
Mohutsky MA, Chien JY, Ring BJ, Wrighton SA (2006) Predictions of the in vivo clearance of drugs from rate of loss using human liver microsomes for phase I and phase II biotransformations. Pharm Res 23:654–662
Molina H, Azocar L, Ananthanarayanan M, Arrese M, Miquel JF (2008) Localization of the Sodium-Taurocholate cotransporting polypeptide in membrane rafts and modulation of its activity by cholesterol in vitro. Biochim Biophys Acta 1778:1283–91
Monshouwer M, Witkamp RF (2000) Cytochromes and cytokines: changes in drug disposition in animals during an acute phase response: a mini-review. Vet Q 22:17–20
Mooney DJ, Park S, Kaufmann PM, Sano K, McNamara K, Vacanti JP, Langer R (1995) Biodegradable sponges for hepatocyte transplantation. J Biomed Mater Res 29:959–965
Morgan RE, Trauner M, van Staden CJ, Lee PH, Ramachandran B, Eschenberg M, Afshari CA, Qualls CW Jr, Lightfoot-Dunn R, Hamadeh HK (2010) Interference with bile salt export pump function is a susceptibility factor for human liver injury in drug development. Toxicol Sci 118:485–500
Moriguchi T, Motohashi H, Hosoya T, Nakajima O, Takahashi S, Ohsako S, Aoki Y, Nishimura N, Tohyama C, Fujii-Kuriyama Y, Yamamoto M (2003) Distinct response to dioxin in an arylhydrocarbon receptor (AHR)-humanized mouse. Proc Natl Acad Sci USA 100:5652–5657
Morimoto Y, Wettstein M, Häussinger D (1993) Hepatocyte heterogeneity in response to extracellular adenosine. Biochem J 293(Pt 2):573–581
Morin O, Goulet F, Normand C (1988) Liver sinusoidal endothelial cells: isolation, purification, characterization and interaction with hepatocytes. Revis Biol Celular 15:1–85
Morin O, Normand C (1986) Long-term maintenance of hepatocyte functional activity in co-culture: requirements for sinusoidal endothelial cells and dexamethasone. J Cell Physiol 129:103–110
Moriyama A, Kii I, Sunabori T, Kurihara S, Takayama I, Shimazaki M, Tanabe H, Oginuma M, Fukayama M, Matsuzaki Y, Saga Y, Kudo A (2007) GFP transgenic mice reveal active canonical Wnt signal in neonatal brain and in adult liver and spleen. Genesis 45:90–100
Mounho BJ, Thrall BD (1999) The extracellular signal-regulated kinase pathway contributes to mitogenic and antiapoptotic effects of peroxisome proliferators in vitro. Toxicol Appl Pharmacol 159:125–133
Mueckler M, Caruso C, Baldwin SA, Panico M, Blench I, Morris HR, Allard WJ, Lienhard GE, Lodish HF (1985) Sequence and structure of a human glucose transporter. Science 229:941–945
Mueller D, Koetemann A, Noor F (2011) Organotypic cultures of Hepg2 cells for in vitro toxicity studies. J Bioeng Biomed Sci 01:S2
Munzel P, Bock-Hennig B, Schieback S, Gschaidmeier H, Beck-Gschaidmeier S, Bock KW (1996) Growth modulation of hepatocytes and rat liver epithelial cells (WB-F344) by 2,3,7,8-tetrachlorodibenzo-p-dioxin (TCDD). Carcinogenesis 17:197–202
Muschen M, Warskulat U, Douillard P, Gilbert E, Häussinger D (1998) Regulation of CD95 (APO-1/Fas) receptor and ligand expression by lipopolysaccharide and dexamethasone in parenchymal and nonparenchymal rat liver cells. Hepatology 27:200–208
Mwinyi J, Johne A, Bauer S, Roots I, Gerloff T (2004) Evidence for inverse effects of OATP-C (SLC21A6) 5 and 1b haplotypes on pravastatin kinetics. Clin Pharmacol Ther 75:415–421
Mwinyi J, Kopke K, Schaefer M, Roots I, Gerloff T (2008) Comparison of SLCO1B1 sequence variability among German, Turkish, and African populations. Eur J Clin Pharmacol 64:257–266
Nagai H, Matsumaru K, Feng G, Kaplowitz N (2002) Reduced glutathione depletion causes necrosis and sensitization to tumor necrosis factor-alpha-induced apoptosis in cultured mouse hepatocytes. Hepatology 36:55–64
Nagaoka M, Si-Tayeb K, Akaike T, Duncan SA (2010) Culture of human pluripotent stem cells using completely defined conditions on a recombinant E-cadherin substratum. BMC Dev Biol 10:60
Nahmias Y, Kramvis Y, Barbe L, Casali M, Berthiaume F, Yarmush ML (2006) A novel formulation of oxygen-carrying matrix enhances liver-specific function of cultured hepatocytes. Faseb J 20:2531–2533
Nahmias Y, Schwartz RE, Hu WS, Verfaillie CM, Odde DJ (2006) Endothelium-mediated hepatocyte recruitment in the establishment of liver-like tissue in vitro. Tissue Eng 12:1627–1638
Nahmias Y, Berthiaume F, Yarmush ML (2007) Integration of technologies for hepatic tissue engineering. Adv Biochem Eng Biotechnol 103:309–329
Naik SU, Wang X, da Silva JS, Jaye M, Macphee CH, Reilly MP, Billheimer JT, Rothblat GH, Rader DJ (2006) Pharmacological activation of liver X receptors promotes reverse cholesterol transport in vivo. Circulation 113:90–97
Naiki T, Nagaki M, Shidoji Y, Kojima H, Moriwaki H (2004) Functional activity of human hepatoma cells transfected with adenovirus-mediated hepatocyte nuclear factor (HNF)-4 gene. Cell Transplant 13:393–403
Nakanishi T, Ross DD (2012) Breast cancer resistance protein (BCRP/ABCG2): its role in multidrug resistance and regulation of its gene expression. Chin J Cancer 31(2):73–99
Nakano H, Nakajima A, Sakon-Komazawa S, Piao JH, Xue X, Okumura K (2006) Reactive oxygen species mediate crosstalk between NF-kappaB and JNK. Cell Death Differ 13:730–737
Naldini L, Blomer U, Gallay P, Ory D, Mulligan R, Gage FH, Verma IM, Trono D (1996) In vivo gene delivery and stable transduction of nondividing cells by a lentiviral vector. Science 272:263–267
Nan X, Meehan RR, Bird A (1993) Dissection of the methyl-CpG binding domain from the chromosomal protein MeCP2. Nucleic Acids Res 21:4886–4892
Naritomi Y, Terashita S, Kagayama A, Sugiyama Y (2003) Utility of hepatocytes in predicting drug metabolism: comparison of hepatic intrinsic clearance in rats and humans in vivo and in vitro. Drug Metab Dispos 31:580–588
NAS (2006) Health risks from dioxin and related compounds: Evaluation of the EPA Reassessment. Natil Acad
Nash KL, Jamil B, Maguire AJ, Alexander GJ, Lever AM (2004) Hepatocyte-specific gene expression from integrated lentiviral vectors. J Gene Med 6:974–983
Natori S, Rust C, Stadheim LM, Srinivasan A, Burgart LJ, Gores GJ (2001) Hepatocyte apoptosis is a pathologic feature of human alcoholic hepatitis. J Hepatol 34:248–253
Nava S, Westgren M, Jaksch M, Tibell A, Broome U, Ericzon BG, Sumitran-Holgersson S (2005) Characterization of cells in the developing human liver. Differentiation 73:249–260
Nebert DW, Puga A, Vasiliou V (1993) Role of the Ah receptor and the dioxin-inducible [Ah] gene battery in toxicity, cancer, and signal transduction. Ann N Y Acad Sci 685:624–640
Nechushtan A, Smith CL, Hsu YT, Youle RJ (1999) Conformation of the Bax C-terminus regulates subcellular location and cell death. Embo J 18:2330–2341
Neefjes J, Jongsma ML, Paul P, Bakke O (2011) Towards a systems understanding of MHC class I and MHC class II antigen presentation. Nat Rev Immunol 11:823–836
Nehra V, Angulo P, Buchman AL, Lindor KD (2001) Nutritional and metabolic considerations in the etiology of nonalcoholic steatohepatitis. Dig Dis Sci 46:2347–2352
Nemoto N, Sakurai J (1992) Differences in regulation of gene expression between Cyp1a-1 and Cyp1a-2 in adult mouse hepatocytes in primary culture. Carcinogenesis 13(12):2249–2254
Neubauer K, Wilfling T, Ritzel A, Ramadori G (2000) Platelet-endothelial cell adhesion molecule-1 gene expression in liver sinusoidal endothelial cells during liver injury and repair. J Hepatol 32:921–932
Neufeld E, Ashwell G (1979) Carbohydrate recognition systems for receptor-mediated pinocytosis. In: Lennarz W (ed) Biochemistry of glycoproteins and proteoglycans. Plenum Press, New York, pp 241–266
Ni HM, Bockus A, Boggess N, Jaeschke H, Ding WX (2012) Activation of autophagy protects against acetaminophen-induced hepatotoxicity. Hepatology 55:222–232
Ni R, Tomita Y, Matsuda K, Ichihara A, Ishimura K, Ogasawara J, Nagata S (1994) Fas-mediated apoptosis in primary cultured mouse hepatocytes. Exp Cell Res 215:332–337
Niemi M, Pasanen MK, Neuvonen PJ (2011) Organic anion transporting polypeptide 1B1: a genetically polymorphic transporter of major importance for hepatic drug uptake. Pharmacol Rev 63:157–181
Niemi M, Schaeffeler E, Lang T, Fromm MF, Neuvonen M, Kyrklund C, Backman JT, Kerb R, Schwab M, Neuvonen PJ, Eichelbaum M, Kivisto KT (2004) High plasma pravastatin concentrations are associated with single nucleotide polymorphisms and haplotypes of organic anion transporting polypeptide-C (OATP-C, SLCO1B1). Pharmacogenetics 14:429–440
Nies AT, Keppler D (2007) The apical conjugate efflux pump ABCC2 (MRP2). Pflugers Arch 453:643–659
Nies AT, Schwab M, Keppler D (2008) Interplay of conjugating enzymes with OATP uptake transporters and ABCC/MRP efflux pumps in the elimination of drugs. Expert Opin Drug Metab Toxicol 4:545–568
Nies AT, Koepsell H, Winter S, Burk O, Klein K, Kerb R, Zanger UM, Keppler D, Schwab M, Schaeffeler E (2009) Expression of organic cation transporters OCT1 (SLC22A1) and OCT3 (SLC22A3) is affected by genetic factors and cholestasis in human liver. Hepatology 50:1227–1240
Nies AT, Koepsell H, Damme K, Schwab M (2011) Organic cation transporters (OCTs, MATEs), in vitro and in vivo evidence for the importance in drug therapy. Handb Exp Pharmacol 105–167
Nishikawa M, Kojima N, Komori K, Yamamoto T, Fujii T, Sakai Y (2008) Enhanced maintenance and functions of rat hepatocytes induced by combination of on-site oxygenation and coculture with fibroblasts. J Biotechnol 133:253–260
Nishimura N, Yonemoto J, Nishimura H, Ikushiro S, Tohyama C (2005) Disruption of thyroid hormone homeostasis at weaning of Holtzman rats by lactational but not in utero exposure to 2,3,7,8-tetrachlorodibenzo-p-dioxin. Toxicol Sci 85:607–614
Nishizato Y, Ieiri I, Suzuki H, Kimura M, Kawabata K, Hirota T, Takane H, Irie S, Kusuhara H, Urasaki Y, Urae A, Higuchi S, Otsubo K, Sugiyama Y (2003) Polymorphisms of OATP-C (SLC21A6) and OAT3 (SLC22A8) genes: consequences for pravastatin pharmacokinetics. Clin Pharmacol Ther 73:554–565
Nishizawa H, Yamagata K, Shimomura I, Takahashi M, Kuriyama H, Kishida K, Hotta K, Nagaretani H, Maeda N, Matsuda M, Kihara S, Nakamura T, Nishigori H, Tomura H, Moore DD, Takeda J, Funahashi T, Matsuzawa Y (2002) Small heterodimer partner, an orphan nuclear receptor, augments peroxisome proliferator-activated receptor gamma transactivation. J Biol Chem 277:1586–1592
Noé B, Hagenbuch B, Stieger B, Meier PJ (1997) Isolation of a multispecific organic anion and cardiac glycoside transporter from rat brain. Proc Natl Acad Sci USA 94:10346–10350
Noé J, Stieger B, Meier PJ (2002) Functional expression of the canalicular bile salt export pump of human liver. Gastroenterology 123(5):1659–1666
Noh K, Kim YM, Kim YW, Kim SG (2011) Farnesoid X receptor activation by chenodeoxycholic acid induces detoxifying enzymes through AMP-activated protein kinase and extracellular signal-regulated kinase 1/2-mediated phosphorylation of CCAAT/enhancer binding protein beta. Drug Metab Dispos 39:1451–1459
Nolan RP, Fenley AP, Lee K (2006) Identification of distributed metabolic objectives in the hypermetabolic liver by flux and energy balance analysis. Metab Eng 8:30–45
Notas G, Kisseleva T, Brenner D (2009) NK and NKT cells in liver injury and fibrosis. Clin Immunol 130:16–26
Novicki DL, Irons GP, Strom SC, Jirtle R, Michalopoulos G (1982) Cryopreservation of isolated rat hepatocytes. In Vitro 18:393–399
Novik E, Maguire TJ, Chao P, Cheng KC, Yarmush ML (2010) A microfluidic hepatic coculture platform for cell-based drug metabolism studies. Biochem Pharmacol 79:1036–1044
Nowak M, Gaines GC, Rosenberg J, Minter R, Bahjat FR, Rectenwald J, Mackay SL, Edwards CK 3rd, Moldawer LL (2000) LPS-induced liver injury in D-galactosamine-sensitized mice requires secreted TNF-alpha and the TNF-p55 receptor. Am J Physiol Regul Integr Comp Physiol 278:R1202–R1209
NTP (1980) Bioassay of a mixture of 1,2,3,6,7,8-hexachlorodibenzo-p-dioxin and 1,2,3,7,8,9-hexachlorodibenzo-p-dioxin (gavage) for possible carcinogenicity (cas no. 57653–85-7, cas no. 19408–74-3). Natl Toxicol Program Tech Rep Ser 198:1–187
NTP (1982) Carcinogenesis bioassay of 2,3,7,8-tetrachlorodibenzo-p-dioxin (cas no. 1746–01-6) in osborne-mendel rats and b6c3f1 mice (gavage study). Natl Toxicol Program Tech Rep Ser 209:1–195
NTP (2006) Ntp toxicology and carcinogenesis studies of 2,3,7,8-tetrachlorodibenzo-p-dioxin (tcdd) (cas no. 1746-01-6) in female Harlan Sprague-Dawley rats (gavage studies). Natl Toxicol Program Tech Rep Ser
Nuwaysir EF, Bittner M, Trent J, Barrett JC, Afshari CA (1999) Microarrays and toxicology: the advent of toxicogenomics. Mol Carcinog 24:153–159
Nyasae LK, Hubbard AL, Tuma PL (2003) Transcytotic efflux from early endosomes is dependent on cholesterol and glycosphingolipids in polarized hepatic cells. Mol Biol Cell 14:2689–2705
Nyberg SL, Hardin J, Amiot B, Argikar UA, Remmel RP, Rinaldo P (2005) Rapid, large-scale formation of porcine hepatocyte spheroids in a novel spheroid reservoir bioartificial liver. Liver Transpl 11:901–910
O’Donnell MA, Perez-Jimenez E, Oberst A, Ng A, Massoumi R, Xavier R, Green DR, Ting AT (2011) Caspase 8 inhibits programmed necrosis by processing CYLD. Nat Cell Biol 13:1437–442
Obach RS, Reed-Hagen AE (2002) Measurement of Michaelis constants for cytochrome P450-mediated biotransformation reactions using a substrate depletion approach. Drug Metab Dispos 30:831–837
Obach RS, Walsky RL, Venkatakrishnan K (2007) Mechanism-based inactivation of human cytochrome p450 enzymes and the prediction of drug-drug interactions. Drug Metab Dispos 35:246–255
Obach RS, Walsky RL, Venkatakrishnan K, Gaman EA, Houston JB, Tremaine LM (2006) The utility of in vitro cytochrome P450 inhibition data in the prediction of drug-drug interactions. J Pharmacol Exp Ther 316:336–348
Oberst A, Pop C, Tremblay AG, Blais V, Denault JB, Salvesen GS, Green DR (2010) Inducible dimerization and inducible cleavage reveal a requirement for both processes in caspase-8 activation. J Biol Chem 285:16632–16642
Ochi M, Ohdan H, Mitsuta H, Onoe T, Tokita D, Hara H, Ishiyama K, Zhou W, Tanaka Y, Asahara T (2004) Liver NK cells expressing TRAIL are toxic against self hepatocytes in mice. Hepatology 39:1321–1331
Oertel M, Menthena A, Chen YQ, Shafritz DA (2006) Properties of cryopreserved fetal liver stem/progenitor cells that exhibit long-term repopulation of the normal rat liver. Stem Cells 24:2244–2251
Ogasawara J, Watanabe-Fukunaga R, Adachi M, Matsuzawa A, Kasugai T, Kitamura Y, Itoh N, Suda T, Nagata S (1993) Lethal effect of the anti-Fas antibody in mice. Nature 364:806–809
Oh SH, Park SC, Kim HK, Koh YJ, Lee JH, Lee MC, Lee JH (2010) Degradation behavior of 3D porous polydioxanone-b-polycaprolactone scaffolds fabricated using the melt-molding particulate-leaching method. J Biomater Sci Polym Ed
Ohashi K, Yokoyama T, Yamato M, Kuge H, Kanehiro H, Tsutsumi M, Amanuma T, Iwata H, Yang J, Okano T, Nakajima Y (2007) Engineering functional two- and three-dimensional liver systems in vivo using hepatic tissue sheets. Nat Med 13:880–885
Ohi Y, Qin H, Hong C, Blouin L, Polo JM, Guo T, Qi Z, Downey SL, Manos PD, Rossi DJ, Yu J, Hebrok M, Hochedlinger K, Costello JF, Song JS, Ramalho-Santos M (2011) Incomplete DNA methylation underlies a transcriptional memory of somatic cells in human iPS cells. Nat Cell Biol 13:541–549
Ohno H, Naito Y, Nakajima H, Tomita M (2008) Construction of a biological tissue model based on a single-cell model: a computer simulation of metabolic heterogeneity in the liver lobule. Artif Life 14:3–28
Okamoto M, Ishida Y, Keogh A, Strain A (1998) Evaluation of the function of primary human hepatocytes co-cultured with the human hepatic stellate cell (HSC) line LI90. Int J Artif Organs 21:353–359
Okita K, Ichisaka T, Yamanaka S (2007) Generation of germline-competent induced pluripotent stem cells. Nature 448:313–317
Olinga P, Merema MT, Meijer DKF, Slooff MJH, Groothuis GMM (1993) Human liver slices express the same lidocaine biotransformation rate as isolated human hepatocytes. ATLAS (Alternatives to laboratory animals) 21:466–468
Olinga P, Groen K, Hof IH, de Kanter R, Koster HJ, Leeman WR, Rutten AA, van Twillert K, Groothuis GM (1997) Comparison of five incubation systems for rat liver slices using functional and viability parameters. J Pharmacol Toxicol Methods 38:59–69
Olinga P, Merema MT, Hof IH, de Jager MH, de Jong KP, Slooff MJ, Meijer DK, Groothuis GM (1998a) Effect of cold and warm ischaemia on drug metabolism in isolated hepatocytes and slices from human and monkey liver. Xenobiotica 28(4):349–360
Olinga P, Merema M, Hof IH, de Jong KP, Slooff MJ, Meijer DK, Groothuis GM (1998b) Effect of human liver source on the functionality of isolated hepatocytes and liver slices. Drug Metab Dispos 26:5–11
Olinga P, Hof IH, Merema MT, Smit M, de Jager MH, Swart PJ, Slooff MJ, Meijer DK, Groothuis GM (2001) The applicability of rat and human liver slices to the study of mechanisms of hepatic drug uptake. J Pharmacol Toxicol Methods 45:55–63
Olinga P, Elferink MG, Draaisma AL, Merema MT, Castell JV, Perez G, Groothuis GM (2008) Coordinated induction of drug transporters and phase I and II metabolism in human liver slices. Eur J Pharm Sci 33:380–389
Olynyk JK, Clarke SL (1998) Isolation and primary culture of rat Kupffer cells. J Gastroenterol Hepatol 13:842–845
Orman M, Mattick J, Androulakis I, Berthiaume F, Ierapetritou M (2012) Stoichiometry Based Steady-State Hepatic Flux Analysis: Computational and Experimental Aspects. Metabolites 2:268–291
Orman MA, Ierapetritou MG, Androulakis IP, Berthiaume F (2011) Metabolic response of perfused livers to various oxygenation conditions. Biotechnol Bioeng 108:2947–2957
Orom UA, Nielsen FC, Lund AH (2008) MicroRNA-10a binds the 5’UTR of ribosomal protein mRNAs and enhances their translation. Mol Cell 30:460–471
Osanai M, Ogawa K, Lee GH (1997) Phenobarbital causes apoptosis in conditionally immortalized mouse hepatocytes depending on deregulated c-myc expression: characterization of an unexpected effect. Cancer Res 57:2896–2903
Oshikata A, Matsushita T, Ueoka R (2011) Enhancement of drug efflux activity via MDR1 protein by spheroid culture of human hepatic cancer cells. J Biosci Bioeng 111:590–593
Ostrowska A, Gu K, Bode DC, van Buskirk RG (2009) Hypothermic storage of isolated human hepatocytes: a comparison between University of Wisconsin solution and a hypothermosol platform. Arch Toxicol 83:493–502
Ou Z, Wada T, Gramignoli R, Li S, Strom SC, Huang M, Xie W (2011) MicroRNA hsa-miR-613 targets the human LXRalpha gene and mediates a feedback loop of LXRalpha autoregulation. Mol Endocrinol 25:584–596
Oude Elferink RP, Beuers U (2011) Targeting the ABCB4 gene to control cholesterol homeostasis. Expert Opin Ther Targets 15:1173–1182
Oude Elferink RP, Groen AK (2000) Mechanisms of biliary lipid secretion and their role in lipid homeostasis. Semin Liver Dis 20:293–305
Oude Elferink RP, Paulusma CC, Groen AK (2006) Hepatocanalicular transport defects: pathophysiologic mechanisms of rare diseases. Gastroenterology 130:908–925
Ourlin JC, Lasserre F, Pineau T, Fabre JM, Sa-Cunha A, Maurel P, Vilarem MJ, Pascussi JM (2003) The small heterodimer partner interacts with the pregnane X receptor and represses its transcriptional activity. Mol Endocrinol 17:1693–1703
Paajarvi G, Viluksela M, Pohjanvirta R, Stenius U, Hogberg J (2005) TCDD activates Mdm2 and attenuates the p53 response to DNA damaging agents. Carcinogenesis 26:201–208
Pachkoria K, Lucena MI, Ruiz-Cabello F, Crespo E, Cabello MR, Andrade RJ (2007) Genetic polymorphisms of CYP2C9 and CYP2C19 are not related to drug-induced idiosyncratic liver injury (DILI). Br J Pharmacol 150:808–815
Padgham CR, Boyle CC, Wang XJ, Raleigh SM, Wright MC, Paine AJ (1993) Alteration of transcription factor mRNAs during the isolation and culture of rat hepatocytes suggests the activation of a proliferative mode underlies their de-differentiation. Biochem Biophys Res Commun 197:599–605
Paine AJ, Andreakos E (2004) Activation of signalling pathways during hepatocyte isolation: relevance to toxicology in vitro. Toxicol In Vitro 18:187–193
Paine SW, Parker AJ, Gardiner P, Webborn PJ, Riley RJ (2008) Prediction of the pharmacokinetics of atorvastatin, cerivastatin, and indomethacin using kinetic models applied to isolated rat hepatocytes. Drug Metab Dispos 36:1365–1374
Pampaloni F, Reynaud EG, Stelzer EH (2007) The third dimension bridges the gap between cell culture and live tissue. Nat Rev Mol Cell Biol 8:839–845
Pampaloni F, Stelzer EH, Masotti A (2009) Three-dimensional tissue models for drug discovery and toxicology. Recent Pat Biotechnol 3:103–117
Pan G, Boiselle C, Wang J (2012) Assessment of biliary clearance in early drug discovery using sandwich-cultured hepatocyte model. J Pharm Sci 101:1898–1908
Pande K, Moran SM, Bradfield CA (2005) Aspects of dioxin toxicity are mediated by interleukin 1-like cytokines. Mol Pharmacol 67:1393–1398
Papa S, Bubici C, Zazzeroni F, Franzoso G (2009) Mechanisms of liver disease: cross-talk between the NF-kappaB and JNK pathways. Biol Chem 390:965–976
Papa S, Bubici C, Zazzeroni F, Pham CG, Kuntzen C, Knabb JR, Dean K, Franzoso G (2006) The NF-kappaB-mediated control of the JNK cascade in the antagonism of programmed cell death in health and disease. Cell Death Differ 13:712–729
Papeleu P, Elaut G, Rogiers V, Vanhaecke T (2002) Cell cultures as in vitro tools for biotransformation studies. Recent Res Dev Drug Kerala Transw Res Netw
Papeleu P, Loyer P, Vanhaecke T, Elaut G, Geerts A, Guguen-Guillouzo C, Rogiers V (2003) Trichostatin A induces differential cell cycle arrests but does not induce apoptosis in primary cultures of mitogen-stimulated rat hepatocytes. J Hepatol 39:374–382
Papeleu P, Wullaert A, Elaut G, Henkens T, Vinken M, Laus G, Tourwe D, Beyaert R, Rogiers V, Vanhaecke T (2007) Inhibition of NF-kappaB activation by the histone deacetylase inhibitor 4-Me2 N-BAVAH induces an early G1 cell cycle arrest in primary hepatocytes. Cell Prolif 40:640–655
Parent R, Marion MJ, Furio L, Trepo C, Petit MA (2004) Origin and characterization of a human bipotent liver progenitor cell line. Gastroenterology 126:1147–1156
Park IK, Yang J, Jeong HJ, Bom HS, Harada I, Akaike T, Kim SI, Cho CS (2003) Galactosylated chitosan as a synthetic extracellular matrix for hepatocytes attachment. Biomaterials 24:2331–2337
Park BK, Boobis A, Clarke S, Goldring CE, Jones D, Kenna JG, Lambert C, Laverty HG, Naisbitt DJ, Nelson S, Nicoll-Griffith DA, Obach RS, Routledge P, Smith DA, Tweedie DJ, Vermeulen N, Williams DP, Wilson ID, Baillie TA (2011) Managing the challenge of chemically reactive metabolites in drug development. Nat Rev Drug Discov 10:292–306
Park BK, Kitteringham NR, Maggs JL, Pirmohamed M, Williams DP (2005) The role of metabolic activation in drug-induced hepatotoxicity. Annu Rev Pharmacol Toxicol 45:177–202
Park J, Kang W, Ryu SW, Kim WI, Chang DY, Lee DH, Park DY, Choi YH, Choi K, Shin EC, Choi C (2012) Hepatitis C virus infection enhances TNFalpha-induced cell death via suppression of NF-kappaB. Hepatology
Park J, Li Y, Berthiaume F, Toner M, Yarmush ML, Tilles AW (2008) Radial flow hepatocyte bioreactor using stacked microfabricated grooved substrates. Biotechnol Bioeng 99:455–467
Parker AJ, Houston JB (2008) Rate-limiting steps in hepatic drug clearance: comparison of hepatocellular uptake and metabolism with microsomal metabolism of saquinavir, nelfinavir, and ritonavir. Drug Metab Dispos 36:1375–1384
Parks DJ, Blanchard SG, Bledsoe RK, Chandra G, Consler TG, Kliewer SA, Stimmel JB, Willson TM, Zavacki AM, Moore DD, Lehmann JM (1999) Bile acids: natural ligands for an orphan nuclear receptor. Science 284:1365–1368
Parrish AR, Gandolfi AJ, Brendel K (1995) Precision-cut tissue slices: applications in pharmacology and toxicology. Life Sci 57:1887–1901
Pasanen MK, Fredrikson H, Neuvonen PJ, Niemi M (2007) Different effects of SLCO1B1 polymorphism on the pharmacokinetics of atorvastatin and rosuvastatin. Clin Pharmacol Ther 82:726–733
Pascussi JM, Gerbal-Chaloin S, Drocourt L, Assenat E, Larrey D, Pichard-Garcia L, Vilarem MJ, Maurel P (2004) Cross-talk between xenobiotic detoxication and other signalling pathways: clinical and toxicological consequences. Xenobiotica 34:633–664
Pascussi JM, Robert A, Moreau A, Ramos J, Bioulac-Sage P, Navarro F, Blanc P, Assenat E, Maurel P, Vilarem MJ (2007) Differential regulation of constitutive androstane receptor expression by hepatocyte nuclear factor4alpha isoforms. Hepatology 45:1146–1153
Pascussi JM, Gerbal-Chaloin S, Duret C, Daujat-Chavanieu M, Vilarem MJ, Maurel P (2008) The tangle of nuclear receptors that controls xenobiotic metabolism and transport: crosstalk and consequences. Annu Rev Pharmacol Toxicol 48:1–32
Passamonti S, Terdoslavich M, Margon A, Cocolo A, Medic N, Micali F, Decorti G, Franko M (2005) Uptake of bilirubin into HepG2 cells assayed by thermal lens spectroscopy. FEBS J 272:5522–5535
Pauley CJ, Ledwith BJ, Kaplanski C (2002) Peroxisome proliferators activate growth regulatory pathways largely via peroxisome proliferator-activated receptor alpha-independent mechanisms. Cell Signal 14:351–358
Pauli-Magnus C, Stieger B, Meier Y, Kullak-Ublick GA, Meier PJ (2005) Enterohepatic transport of bile salts and genetics of cholestasis. J Hepatol 43:342–357
Paulusma CC, Bosma PJ, Zaman GJ, Bakker CT, Otter M, Scheffer GL, Scheper RJ, Borst P, Oude Elferink RP (1996) Congenital jaundice in rats with a mutation in a multidrug resistance-associated protein gene. Science 271:1126–1128
Paulusma CC, de Waart DR, Kunne C, Mok KS, Elferink RP (2009) Activity of the bile salt export pump (ABCB11) is critically dependent on canalicular membrane cholesterol content. J Biol Chem 284:9947–9954
Peet DJ, Janowski BA, Mangelsdorf DJ (1998) The LXRs: a new class of oxysterol receptors. Curr Opin Genet Dev 8:571–575
Peet DJ, Turley SD, Ma W, Janowski BA, Lobaccaro JM, Hammer RE, Mangelsdorf DJ (1998) Cholesterol and bile acid metabolism are impaired in mice lacking the nuclear oxysterol receptor LXR alpha. Cell 93:693–704
Pelkonen O, Turpeinen M (2007) In vitro-in vivo extrapolation of hepatic clearance: biological tools, scaling factors, model assumptions and correct concentrations. Xenobiotica 37:1066–1089
Peshwa MV, Wu FJ, Sharp HL, Cerra FB, Hu WS (1996) Mechanistics of formation and ultrastructural evaluation of hepatocyte spheroids. In Vitro Cell Dev Biol Anim 32:197–203
Peter ME, Krammer PH (2003) The CD95(APO-1/Fas) DISC and beyond. Cell Death Differ 10:26–35
Petrasek J, Dolganiuc A, Csak T, Nath B, Hritz I, Kodys K, Catalano D, Kurt-Jones E, Mandrekar P, Szabo G (2011) Interferon regulatory factor 3 and type I interferons are protective in alcoholic liver injury in mice by way of crosstalk of parenchymal and myeloid cells. Hepatology 53:649–660
Pfeifer AM, Cole KE, Smoot DT, Weston A, Groopman JD, Shields PG, Vignaud JM, Juillerat M, Lipsky MM, Trump BF et al (1993) Simian virus 40 large tumor antigen-immortalized normal human liver epithelial cells express hepatocyte characteristics and metabolize chemical carcinogens. Proc Natl Acad Sci USA 90:5123–5127
Pfeifer AM, Macé K, Tromvoukis Y, Lipsky MM (1995) Highly efficient establishment of immortalized cells from adult human liver. Methods Cell Sci 17:83–89
Phay JE, Hussain HB, Moley JF (2000) Cloning and expression analysis of a novel member of the facilitative glucose transporter family, SLC2A9 (GLUT9). Genomics 66:217–220
Phillips EJ, Sullivan JR, Knowles SR, Shear NH (2002) Utility of patch testing in patients with hypersensitivity syndromes associated with abacavir. Aids 16:2223–2225
Pichler WJ, Beeler A, Keller M, Lerch M, Posadas S, Schmid D, Spanou Z, Zawodniak A, Gerber B (2006) Pharmacological interaction of drugs with immune receptors: the p-i concept. Allergol Int 55:17–25
Pichler WJ, Naisbitt DJ, Park BK (2011) Immune pathomechanism of drug hypersensitivity reactions. J Allergy Clin Immunol 127:S74–S81
Pierre S, Bats AS, Coumoul X (2011) Understanding SOS (Son of Sevenless). Biochem Pharmacol 82:1049–1056
Pintilie DG, Shupe TD, Oh SH, Salganik SV, Darwiche H, Petersen BE (2010) Hepatic stellate cells’ involvement in progenitor-mediated liver regeneration. Lab Invest 90:1199–1208
Pitot HC, Goldsworthy TL, Moran S, Kennan W, Glauert HP, Maronpot RR, Campbell HA (1987) A method to quantitate the relative initiating and promoting potencies of hepatocarcinogenic agents in their dose-response relationships to altered hepatic foci. Carcinogenesis 8:1491–1499
Plass JR, Mol O, Heegsma J, Geuken M, Faber KN, Jansen PL, Muller M (2002) Farnesoid X receptor and bile salts are involved in transcriptional regulation of the gene encoding the human bile salt export pump. Hepatology 35:589–96
Pless G, Sauer IM, Rauen U (2012) Improvement of the cold storage of isolated human hepatocytes. Cell Transpl 21:23–37
Pober JS, Sessa WC (2007) Evolving functions of endothelial cells in inflammation. Nat Rev Immunol 7:803–815
Poguntke M, Hazai E, Fromm MF, Zolk O (2010) Drug transport by breast cancer resistance protein. Expert Opin Drug Metab Toxicol 6:1363–1384
Pohjanvirta R, Viluksela M, Tuomisto JT, Unkila M, Karasinska J, Franc MA, Holowenko M, Giannone JV, Harper PA, Tuomisto J, Okey AB (1999) Physicochemical differences in the AH receptors of the most TCDD-susceptible and the most TCDD-resistant rat strains. Toxicol Appl Pharmacol 155:82–95
Polakis P (2000) Wnt signaling and cancer. Genes Dev 14:1837–1851
Polgar O, Robey RW, Bates SE (2008) ABCG2: structure, function and role in drug response. Expert Opin Drug Metab Toxicol 4:1–15
Pols TW, Nomura M, Harach T, Lo Sasso G, Oosterveer MH, Thomas C, Rizzo G, Gioiello A, Adorini L, Pellicciari R, Auwerx J, Schoonjans K (2011) TGR5 activation inhibits atherosclerosis by reducing macrophage inflammation and lipid loading. Cell Metab 14:747–757
Potschka H, Fedrowitz M, Loscher W (2003) Brain access and anticonvulsant efficacy of carbamazepine, lamotrigine, and felbamate in ABCC2/MRP2-deficient TR- rats. Epilepsia 44:1479–1486
Potschka H, Fedrowitz M, Loscher W (2003) Multidrug resistance protein MRP2 contributes to blood-brain barrier function and restricts antiepileptic drug activity. J Pharmacol Exp Ther 306:124–131
Poulin P, Kenny JR, Hop CE, Haddad S (2012) In vitro-in vivo extrapolation of clearance: modeling hepatic metabolic clearance of highly bound drugs and comparative assessment with existing calculation methods. J Pharm Sci 101:838–851
Powanda MC, Wannemacher RW Jr, Cockerell GL (1972) Nitrogen metabolism and protein synthesis during pneumococcal sepsis in rats. Infect Immun 6:266–271
Powell EE, Cooksley WG, Hanson R, Searle J, Halliday JW, Powell LW (1990) The natural history of nonalcoholic steatohepatitis: a follow-up study of forty-two patients for up to 21 years. Hepatology 11:74–80
Prakash C, Sharma R, Gleave M, Nedderman A (2008) In vitro screening techniques for reactive metabolites for minimizing bioactivation potential in drug discovery. Curr Drug Metab 9:952–964
Preitner F, Bonny O, Laverriere A, Rotman S, Firsov D, da Costa A, Metref S, Thorens B (2009) Glut9 is a major regulator of urate homeostasis and its genetic inactivation induces hyperuricosuria and urate nephropathy. Proc Natl Acad Sci USA 106:15501–15506
Prestwich GD, Liu Y, Yu B, Shu XZ, Scott A (2007) 3-D culture in synthetic extracellular matrices: new tissue models for drug toxicology and cancer drug discovery. Adv Enzyme Regul 47:196–207
Pricer Jr WE, Ashwell G (1971) The binding of desialylated glycoproteins by plasma membranes of rat liver. J Biol Chem 246:4825–4833
Priego T, Granado M, Castillero E, Martin AI, Villanua MA, Lopez-Calderon A (2006) Nitric oxide production by hepatocytes contributes to the inhibitory effect of endotoxin on insulin-like growth factor I gene expression. J Endocrinol 190:847–856
Prince HM, Bishton MJ, Harrison SJ (2009) Clinical studies of histone deacetylase inhibitors. Clin Cancer Res 15:3958–3969
Prins HA, Meijer C, Boelens PG, Diks J, Holtz R, Masson S, Daveau M, Meijer S, Scotte M, van Leeuwen PA (2004) Kupffer cell-depleted rats have a diminished acute-phase response following major liver resection. Shock 21:561–565
Prochazkova J, Kabatkova M, Bryja V, Umannova L, Bernatik O, Kozubik A, Machala M, Vondracek J (2011) The interplay of the aryl hydrocarbon receptor and beta-catenin alters both AhR-dependent transcription and Wnt/beta-catenin signaling in liver progenitors. Toxicol Sci 122:349–360
Proost JH, Beljaars L, Olinga P, Swart PJ, Kuipers ME, Reker-Smit C, Groothuis GM, Meijer DK (2006) Prediction of the pharmacokinetics of succinylated human serum albumin in man from in vivo disposition data in animals and in vitro liver slice incubations. Eur J Pharm Sci 27:123–132
Prot JM, Briffaut AS, Letourneur F, Chafey P, Merlier F, Grandvalet Y, Legallais C, Leclerc E (2011) Integrated proteomic and transcriptomic investigation of the acetaminophen toxicity in liver microfluidic biochip. PLoS One 6:e21268
Przyborski SA (2005) Differentiation of human embryonic stem cells after transplantation in immune-deficient mice. Stem Cells 23:1242–1250
Puga A, Barnes SJ, Dalton TP, Chang C, Knudsen ES, Maier MA (2000) Aromatic hydrocarbon receptor interaction with the retinoblastoma protein potentiates repression of E2F-dependent transcription and cell cycle arrest. J Biol Chem 275:2943–2950
Puga A, Marlowe J, Barnes S, Chang CY, Maier A, Tan Z, Kerzee JK, Chang X, Strobeck M, Knudsen ES (2002) Role of the aryl hydrocarbon receptor in cell cycle regulation. Toxicology 181–182:171–177
Putnam AJ, Mooney DJ (1996) Tissue engineering using synthetic extracellular matrices. Nat Med 2:824–826
Pyper SR, Viswakarma N, Yu S, Reddy JK (2010) PPARalpha: energy combustion, hypolipidemia, inflammation and cancer. Nucl Recept Signal 8:e002
Quelard D, Lavergne E, Hendaoui I, Elamaa H, Tiirola U, Heljasvaara R, Pihlajaniemi T, Clement B, Musso O (2008) A cryptic frizzled module in cell surface collagen 18 inhibits Wnt/beta-catenin signaling. PLoS One 3:e1878
Quistorff B (1985) Gluconeogenesis in periportal and perivenous hepatocytes of rat liver, isolated by a new high-yield digitonin/collagenase perfusion technique. Biochem J 229:221–226
Racine L, Scoazec JY, Moreau A, Chassagne P, Bernuau D, Feldmann G (1995) Distribution of albumin, alpha 1-inhibitor 3 and their respective mRNAs in periportal and perivenous rat hepatocytes isolated by the digitonin-collagenase technique. Biochem J 305(Pt 1):263–268
Radaeva S, Sun R, Jaruga B, Nguyen VT, Tian Z, Gao B (2006) Natural killer cells ameliorate liver fibrosis by killing activated stellate cells in NKG2D-dependent and tumor necrosis factor-related apoptosis-inducing ligand-dependent manners. Gastroenterology 130:435–452
Rai RM, Loffreda S, Karp CL, Yang SQ, Lin HZ, Diehl AM (1997) Kupffer cell depletion abolishes induction of interleukin-10 and permits sustained overexpression of tumor necrosis factor alpha messenger RNA in the regenerating rat liver. Hepatology 25:889–895
Rajendran L, Simons K (2005) Lipid rafts and membrane dynamics. J Cell Sci 118:1099–1102
Rakhshandehroo M, Knoch B, Muller M, Kersten S (2010) Peroxisome proliferator-activated receptor alpha target genes. PPAR Res
Ramachandran A, Lebofsky M, Weinman SA, Jaeschke H (2011) The impact of partial manganese superoxide dismutase (SOD2)-deficiency on mitochondrial oxidant stress, DNA fragmentation and liver injury during acetaminophen hepatotoxicity. Toxicol Appl Pharmacol 251:226–233
Ramadori G, Saile B (2002) Mesenchymal cells in the liver–one cell type or two? Liver 22:283–94
Ramaiah SK, Jaeschke H (2007) Role of neutrophils in the pathogenesis of acute inflammatory liver injury. Toxicol Pathol 35:757–766
Ramamoorthy A, Li L, Gaedigk A, Bradford LD, Benson EA, Flockhart DA, Skaar TC (2012) In silico and in vitro identification of microRNAs that regulate hepatic nuclear factor 4alpha expression. Drug Metab Dispos 40:726–733
Ranucci CS, Kumar A, Batra SP, Moghe PV (2000) Control of hepatocyte function on collagen foams: sizing matrix pores toward selective induction of 2-D and 3-D cellular morphogenesis. Biomaterials 21:783–793
Ranucci CS, Moghe PV (1999) Polymer substrate topography actively regulates the multicellular organization and liver-specific functions of cultured hepatocytes. Tissue Eng 5:407–420
Rashid ST, Corbineau S, Hannan N, Marciniak SJ, Miranda E, Alexander G, Huang-Doran I, Griffin J, Ahrlund-Richter L, Skepper J, Semple R, Weber A, Lomas DA, Vallier L (2010) Modeling inherited metabolic disorders of the liver using human induced pluripotent stem cells. J Clin Invest 120:3127–3136
Rathmell JC, Thompson CB (2002) Pathways of apoptosis in lymphocyte development, homeostasis, and disease. Cell 109(Suppl):S97–S107
Raulet DH, Vance RE (2006) Self-tolerance of natural killer cells. Nat Rev Immunol 6:520–531
Raza H, John A, Benedict S (2011) Acetylsalicylic acid-induced oxidative stress, cell cycle arrest, apoptosis and mitochondrial dysfunction in human hepatoma HepG2 cells. Eur J Pharmacol 668:15–24
Rebello S, Zhao S, Hariry S, Dahlke M, Alexander N, Vapurcuyan A, Hanna I, Jarugula V (2012) Intestinal OATP1A2 inhibition as a potential mechanism for the effect of grapefruit juice on aliskiren pharmacokinetics in healthy subjects. Eur J Clin Pharmacol 68:697–708
Reddy JK, Rao S, Moody DE (1976) Hepatocellular carcinomas in acatalasemic mice treated with nafenopin, a hypolipidemic peroxisome proliferator. Cancer Res 36:1211–1217
Reddy JK, Azarnoff DL, Hignite CE (1980) Hypolipidaemic hepatic peroxisome proliferators form a novel class of chemical carcinogens. Nature 283:397–398
Reder-Hilz B, Ullrich M, Ringel M, Hewitt N, Utesch D, Oesch F, Hengstler JG (2004) Metabolism of propafenone and verapamil by cryopreserved human, rat, mouse and dog hepatocytes: comparison with metabolism in vivo. Naunyn Schmiedebergs Arch Pharmacol 369:408–417
Reese JA, Byard JL (1981) Isolation and culture of adult hepatocytes from liver biopsies. In Vitro 17:935–940
Reeves HL, Friedman SL (2002) Activation of hepatic stellate cells–a key issue in liver fibrosis. Front Biosci 7:d808–d826
Reichel C, Gao B, van Montfoort J, Cattori V, Rahner C, Hagenbuch B, Stieger B, Kamisako T, Meier PJ (1999) Localization and function of the organic anion-transporting polypeptide Oatp2 in rat liver. Gastroenterology 117:688–695
Reid AB, Kurten RC, McCullough SS, Brock RW, Hinson JA (2005) Mechanisms of acetaminophen-induced hepatotoxicity: role of oxidative stress and mitochondrial permeability transition in freshly isolated mouse hepatocytes. J Pharmacol Exp Ther 312:509–516
Reinehr R, Häussinger D (2004) Inhibition of bile salt-induced apoptosis by cyclic AMP involves serine/threonine phosphorylation of CD95. Gastroenterology 126:249–262
Reinehr R, Sommerfeld A, Häussinger D (2008) CD95 ligand is a proliferative and antiapoptotic signal in quiescent hepatic stellate cells. Gastroenterology 134:1494–1506
Ren J, Singh BN, Huang Q, Li Z, Gao Y, Mishra P, Hwa YL, Li J, Dowdy SC, Jiang SW (2011) DNA hypermethylation as a chemotherapy target. Cell Signal 23:1082–1093
Rendic S, di Carlo FJ (1997) Human cytochrome P450 enzymes: a status report summarizing their reactions, substrates, inducers, and inhibitors. Drug Metab Rev 29:413–580
Rennert B, Melzig MF (2002) Free fatty acids inhibit the activity of Clostridium histolyticum collagenase and human neutrophil elastase. Planta Med 68:767–769
Rhoads DB, Takano M, Gattoni-Celli S, Chen CC, Isselbacher KJ (1988) Evidence for expression of the facilitated glucose transporter in rat hepatocytes. Proc Natl Acad Sci USA 85:9042–9046
Ribeiro PS, Cortez-Pinto H, Sola S, Castro RE, Ramalho RM, Baptista A, Moura MC, Camilo ME, Rodrigues CM (2004) Hepatocyte apoptosis, expression of death receptors, and activation of NF-kappaB in the liver of nonalcoholic and alcoholic steatohepatitis patients. Am J Gastroenterol 99:1708–1717
Riccalton-Banks L, Liew C, Bhandari R, Fry J, Shakesheff K (2003) Long-term culture of functional liver tissue: three-dimensional coculture of primary hepatocytes and stellate cells. Tissue Eng 9:401–410
Richert L, Liguori MJ, Abadie C, Heyd B, Mantion G, Halkic N, Waring JF (2006) Gene expression in human hepatocytes in suspension after isolation is similar to the liver of origin, is not affected by hepatocyte cold storage and cryopreservation, but is strongly changed after hepatocyte plating. Drug Metab Dispos 34:870–879
Richman RA, Claus TH, Pilkis SJ, Friedman DL (1976) Hormonal stimulation of DNA synthesis in primary cultures of adult rat hepatocytes. Proc Natl Acad Sci USA 73:3589–3593
Riggs MG, Whittaker RG, Neumann JR, Ingram VM (1977) n-Butyrate causes histone modification in HeLa and Friend erythroleukaemia cells. Nature 268:462–464
Rignall B, Ittrich C, Krause E, Appel KE, Buchmann A, Schwarz M (2009) Comparative transcriptome and proteome analysis of Ha-ras and B-raf mutated mouse liver tumors. J Proteome Res 8:3987–3994
Riley RJ, McGinnity DF, Austin RP (2005) A unified model for predicting human hepatic, metabolic clearance from in vitro intrinsic clearance data in hepatocytes and microsomes. Drug Metab Dispos 33:1304–1311
Ring BJ, Chien JY, Adkison KK, Jones HM, Rowland M, Jones RD, Yates JW, Ku MS, Gibson CR, He H, Vuppugalla R, Marathe P, Fischer V, Dutta S, Sinha VK, Bjornsson T, Lave T, Poulin P (2011) PhRMA CPCDC initiative on predictive models of human pharmacokinetics, part 3: comparative assessment of prediction methods of human clearance. J Pharm Sci
Ringel M, Oesch F, Gerl M, Klebach M, Quint M, Bader A, Bottger T, Hengstler JG (2002) Permissive and suppressive effects of dexamethasone on enzyme induction in hepatocyte co-cultures. Xenobiotica 32:653–666
Ringel M, von Mach MA, Santos R, Feilen PJ, Brulport M, Hermes M, Bauer AW, Schormann W, Tanner B, Schon MR, Oesch F, Hengstler JG (2005) Hepatocytes cultured in alginate microspheres: an optimized technique to study enzyme induction. Toxicology 206:153–167
Rippin SJ, Hagenbuch B, Meier PJ, Stieger B (2001) Cholestatic expression pattern of sinusoidal and canalicular organic anion transport systems in primary cultured rat hepatocytes. Hepatology 33:776–782
Rius M, Nies AT, Hummel-Eisenbeiss J, Jedlitschky G, Keppler D (2003) Cotransport of reduced glutathione with bile salts by MRP4 (ABCC4) localized to the basolateral hepatocyte membrane. Hepatology 38:374–384
Roberts RA, Soames AR (1993) Hepatocyte spheroids: prolonged hepatocyte viability for in vitro modeling of nongenotoxic carcinogenesis. Fundam Appl Toxicol 21:149–158
Roberts RA, Ganey PE, Ju C, Kamendulis LM, Rusyn I, Klaunig JE (2007) Role of the Kupffer cell in mediating hepatic toxicity and carcinogenesis. Toxicol Sci 96:2–15
Robles M, Toscano E, Cotta J, Lucena MI, Andrade RJ (2010) Antibiotic-induced liver toxicity: mechanisms, clinical features and causality assessment. Curr Drug Saf 5:212–222
Rock KL, Lai JJ, Kono H (2011) Innate and adaptive immune responses to cell death. Immunol Rev 243:191–205
Rodés J (2007) Textbook of hepatology: from basic science to clinical practice. Blackwell, Malden
Rodriguez-Antona C, Donato MT, Boobis A, Edwards RJ, Watts PS, Castell JV, Gomez-Lechon MJ (2002) Cytochrome P450 expression in human hepatocytes and hepatoma cell lines: molecular mechanisms that determine lower expression in cultured cells. Xenobiotica 32:505–520
Roelofsen H, Vos TA, Schippers IJ, Kuipers F, Koning H, Moshage H, Jansen PL, Muller M (1997) Increased levels of the multidrug resistance protein in lateral membranes of proliferating hepatocyte-derived cells. Gastroenterology 112:511–521
Rojkind M, Gatmaitan Z, Mackensen S, Giambrone MA, Ponce P, Reid LM (1980) Connective tissue biomatrix: its isolation and utilization for long-term cultures of normal rat hepatocytes. J Cell Biol 87:255–263
Rokos CL, Ledwith BJ (1997) Peroxisome proliferators activate extracellular signal-regulated kinases in immortalized mouse liver cells. J Biol Chem 272:13452–13457
Rombouts K, Marra F (2010) Molecular mechanisms of hepatic fibrosis in non-alcoholic steatohepatitis. Dig Dis 28:229–235
Romero JR, Fresnedo O, Isusi E, Barrionuevo J, Ochoa B (1999) Hepatic zonation of the formation and hydrolysis of cholesteryl esters in periportal and perivenous parenchymal cells. Lipids 34:907–913
Rost D, Konig J, Weiss G, Klar E, Stremmel W, Keppler D (2001) Expression and localization of the multidrug resistance proteins MRP2 and MRP3 in human gallbladder epithelia. Gastroenterology 121:1203–1208
Rostami-Hodjegan A (2010) Translation of in vitro metabolic data to predict in vivo drug-drug interactions: IVIVE and modeling and simulations. Springer, New York
Roth M, Obaidat A, Hagenbuch B (2012) OATPs, OATs and OCTs: the organic anion and cation transporters of the SLCO and SLC22A gene superfamilies. Br J Pharmacol 165:1260–1287
Rowe C, Goldring CE, Kitteringham NR, Jenkins RE, Lane BS, Sanderson C, Elliott V, Platt V, Metcalfe P, Park BK (2010) Network analysis of primary hepatocyte dedifferentiation using a shotgun proteomics approach. J Proteome Res 9:2658–2668
Rowland M, Matin SB (1973) Kinetics of drug-drug interactions. J Pharmacokinet Biopharm 1:553–567
Rowland Yeo K, Jamei M, Yang J, Tucker GT, Rostami-Hodjegan A (2010) Physiologically based mechanistic modelling to predict complex drug-drug interactions involving simultaneous competitive and time-dependent enzyme inhibition by parent compound and its metabolite in both liver and gut - the effect of diltiazem on the time-course of exposure to triazolam. Eur J Pharm Sci 39:298–309
Rowlands JC, Budinsky R, Gollapudi B, Cukovic D, Salagrama S, Dombkowski A, Thompson C, Urban JD, Black MB, Thomas RS (2012) A genomics-based benchmark dose analysis of relative potencies of dioxin-like compounds in primary rat hepatocytes (in press). 51st Annual Meeting of Society of Toxicology. San Francisco, CA. USA.
Rowlands JC, Budinsky R, Gollapudi B, Novak R, Abdelmegeed M, Cukovic D, Dombkowski A (2011) Transcriptional profiles induced by the Aryl Hydrocarbon Receptor agonists 2,3,7,8-tetrachlorodibenzo-p-dioxin, 2,3,7,8-tetrachlorodibenzofuran and 2,3,4,7,8-pentachlorodibenzofuran in primary rat hepatocytes. Chemosphere 85:232–238
Rowley JA, Madlambayan G, Mooney DJ (1999) Alginate hydrogels as synthetic extracellular matrix materials. Biomaterials 20:45–53
Rubbia-Brandt L, Audard V, Sartoretti P, Roth AD, Brezault C, le Charpentier M, Dousset B, Morel P, Soubrane O, Chaussade S, Mentha G, Terris B (2004) Severe hepatic sinusoidal obstruction associated with oxaliplatin-based chemotherapy in patients with metastatic colorectal cancer. Ann Oncol 15:460–466
Ruepp S, Boess F, Suter L, de Vera MC, Steiner G, Steele T, Weiser T, Albertini S (2005) Assessment of hepatotoxic liabilities by transcript profiling. Toxicol Appl Pharmacol 207:161–170
Ruhnke M, Ungefroren H, Nussler A, Martin F, Brulport M, Schormann W, Hengstler JG, Klapper W, Ulrichs K, Hutchinson JA, Soria B, Parwaresch RM, Heeckt P, Kremer B, Fandrich F (2005) Differentiation of in vitro-modified human peripheral blood monocytes into hepatocyte-like and pancreatic islet-like cells. Gastroenterology 128:1774–1786
Ruiz S, Diep D, Gore A, Panopoulos AD, Montserrat N, Plongthongkum N, Kumar S, Fung HL, Giorgetti A, Bilic J, Batchelder EM, Zaehres H, Kan NG, Scholer HR, Mercola M, Zhang K, Izpisua Belmonte JC (2012) Identification of a specific reprogramming-associated epigenetic signature in human induced pluripotent stem cells. Proc Natl Acad Sci USA 109:16196–16201
Rukov JL, Vinther J, Shomron N (2011) Pharmacogenomics genes show varying perceptibility to microRNA regulation. Pharmacogenet Genomics 21:251–262
Russmann S, Jetter A, Kullak-Ublick GA (2010) Pharmacogenetics of drug-induced liver injury. Hepatology 52:748–761
Sachlos E, Czernuszka JT (2003) Making tissue engineering scaffolds work. Review: the application of solid freeform fabrication technology to the production of tissue engineering scaffolds. Eur Cell Mater 5:29–39; discussion 39–40
Saez-Rodriguez J, Alexopoulos LG, Zhang M, Morris MK, Lauffenburger DA, Sorger PK (2011) Comparing signaling networks between normal and transformed hepatocytes using discrete logical models. Cancer Res 71:5400–5411
Sahi J, Grepper S, Smith C (2010) Hepatocytes as a tool in drug metabolism, transport and safety evaluations in drug discovery. Curr Drug Discov Technol 7:188–198
Sahin S (2003) Perfused liver preparation and its applications. FABAD J Pharm Sci 28:39–49
Sahin S, Rowland M (1998) Development of an optimal method for the dual perfusion of the isolated rat liver. J Pharmacol Toxicol Methods 39:35–43
Sai Y, Nies AT, Arias IM (1999) Bile acid secretion and direct targeting of mdr1-green fluorescent protein from Golgi to the canalicular membrane in polarized WIF-B cells. J Cell Sci 112(Pt 24):4535–4545
Saile B, Knittel T, Matthes N, Schott P, Ramadori G (1997) CD95/CD95L-mediated apoptosis of the hepatic stellate cell. A mechanism terminating uncontrolled hepatic stellate cell proliferation during hepatic tissue repair. Am J Pathol 151:1265–1272
Saini SP, Sonoda J, Xu L, Toma D, Uppal H, Mu Y, Ren S, Moore DD, Evans RM, Xie W (2004) A novel constitutive androstane receptor-mediated and CYP3A-independent pathway of bile acid detoxification. Mol Pharmacol 65:292–300
Sainz B Jr, Tencate V, Uprichard SL (2009) Three-dimensional Huh7 cell culture system for the study of Hepatitis C virus infection. Virol J 6:103
Sakai Y, Yamagami S, Nakazawa K (2010) Comparative analysis of gene expression in rat liver tissue and monolayer-and spheroid-cultured hepatocytes. Cells Tissues Organs 191:281–288
Salerno A, Oliviero M, di Maio E, Iannace S, Netti PA (2009) Design of porous polymeric scaffolds by gas foaming of heterogeneous blends. J Mater Sci Mater Med 20:2043–2051
Sancho-Bru P, Roelandt P, Narain N, Pauwelyn K, Notelaers T, Shimizu T, Ott M, Verfaillie C (2011) Directed differentiation of murine-induced pluripotent stem cells to functional hepatocyte-like cells. J Hepatol 54:98–107
Sanderson JP, Naisbitt DJ, Park BK (2006) Role of bioactivation in drug-induced hypersensitivity reactions. Aaps J 8:E55–E64
Sandker GW, Weert B, Merema MT, Kuipers W, Slooff MJ, Meijer DK, Groothuis GM (1993) Maintenance of viability and transport function after preservation of isolated rat hepatocytes in various simplified University of Wisconsin solutions. Biochem Pharmacol 46(11):2093–2096
Sankaran B, Racic M, Tona A, Rao MV, Gaitan M, Forry SP (2008) Dielectrophoretic capture of mammalian cells using transparent indium tin oxide electrodes in microfluidic systems. Electrophoresis 29:5047–5054
Sanna S, Busonero F, Maschio A, McArdle PF, Usala G, Dei M, Lai S, Mulas A, Piras MG, Perseu L, Masala M, Marongiu M, Crisponi L, Naitza S, Galanello R, Abecasis GR, Shuldiner AR, Schlessinger D, Cao A, Uda M (2009) Common variants in the SLCO1B3 locus are associated with bilirubin levels and unconjugated hyperbilirubinemia. Hum Mol Genet 18:2711–2718
Santos-Rosa H, Caldas C (2005) Chromatin modifier enzymes, the histone code and cancer. Eur J Cancer 41:2381–402
Sanyal S, Kim JY, Kim HJ, Takeda J, Lee YK, Moore DD, Choi HS (2002) Differential regulation of the orphan nuclear receptor small heterodimer partner (SHP) gene promoter by orphan nuclear receptor ERR isoforms. J Biol Chem 277:1739–1748
Sartor MA, Schnekenburger M, Marlowe JL, Reichard JF, Wang Y, Fan Y, Ma C, Karyala S, Halbleib D, Liu X, Medvedovic M, Puga A (2009) Genomewide analysis of aryl hydrocarbon receptor binding targets reveals an extensive array of gene clusters that control morphogenetic and developmental programs. Environ Health Perspect 117:1139–1146
Sasse D, Spornitz UM, Maly IP (1992) Liver architecture. Enzyme 46(1–3):8–32
Satlin LM, Amin V, Wolkoff AW (1997) Organic anion transporting polypeptide mediates organic anion/HCO3- exchange. J Biol Chem 272:26340–26345
Sato H, Macchiarulo A, Thomas C, Gioiello A, Une M, Hofmann AF, Saladin R, Schoonjans K, Pellicciari R, Auwerx J (2008) Novel potent and selective bile acid derivatives as TGR5 agonists: biological screening, structure-activity relationships, and molecular modeling studies. J Med Chem 51:1831–1841
Sauer A, Hartung T, Aigner J, Wendel A (1996) Endotoxin-inducible granulocyte-mediated hepatocytotoxicity requires adhesion and serine protease release. J Leukoc Biol 60:633–643
Sauer U (2006) Metabolic networks in motion: 13C-based flux analysis. Mol Syst Biol 2:62
Saunders WB (1996) Hepatology: a textbook of liver disease. W B Saunders Co., Philadelphia
Saussele T, Burk O, Blievernicht JK, Klein K, Nussler A, Nussler N, Hengstler JG, Eichelbaum M, Schwab M, Zanger UM (2007) Selective induction of human hepatic cytochromes P450 2B6 and 3A4 by metamizole. Clin Pharmacol Ther 82:265–274
Sawada M, Kamataki T (1998) Genetically engineered cells stably expressing cytochrome P450 and their application to mutagen assays. Mutat Res 411:19–43
Sawitza I, Kordes C, Reister S, Häussinger D (2009) The niche of stellate cells within rat liver. Hepatology 50:1617–1624
Scaffidi C, Fulda S, Srinivasan A, Friesen C, Li F, Tomaselli KJ, Debatin KM, Krammer PH, Peter ME (1998) Two CD95 (APO-1/Fas) signaling pathways. EMBO J 17:1675–1687
Schaap FG, van der Gaag NA, Gouma DJ, Jansen PL (2009) High expression of the bile salt-homeostatic hormone fibroblast growth factor 19 in the liver of patients with extrahepatic cholestasis. Hepatology 49:1228–1235
Schaefer O, Ohtsuki S, Kawakami H, Inoue T, Liehner S, Saito A, Sakamoto A, Ishiguro N, Matsumaru T, Terasaki T, Ebner T (2012) Absolute quantification and differential expression of drug transporters, cytochrome P450 enzymes, and UDP-glucuronosyltransferases in cultured primary human hepatocytes. Drug Metab Dispos 40:93–103
Schaffert CS, Duryee MJ, Bennett RG, Deveney AL, Tuma DJ, Olinga P, Easterling KC, Thiele GM, Klassen LW (2010) Exposure of precision-cut rat liver slices to ethanol accelerates fibrogenesis. Am J Physiol Gastrointest Liver Physiol 299:G661–G668
Scharf J, Ramadori G, Braulke T, Hartmann H (1996) Synthesis of insulinlike growth factor binding proteins and of the acid-labile subunit in primary cultures of rat hepatocytes, of Kupffer cells, and in cocultures: regulation by insulin, insulinlike growth factor, and growth hormone. Hepatology 23:818–827
Scharf JG, Braulke T, Hartmann H, Ramadori G (2001) Regulation of the components of the 150 kDa IGF binding protein complex in cocultures of rat hepatocytes and Kupffer cells by 3’,5’-cyclic adenosine monophosphate. J Cell Physiol 186:425–436
Schattenberg JM, Galle PR, Schuchmann M (2006) Apoptosis in liver disease. Liver Int 26:904–911
Schattenberg JM, Schuchmann M, Galle PR (2011) Cell death and hepatocarcinogenesis: Dysregulation of apoptosis signaling pathways. J Gastroenterol Hepatol 26(Suppl 1):213–9
Schattenberg JM, Zimmermann T, Worns M, Sprinzl MF, Kreft A, Kohl T, Nagel M, Siebler J, Bergkamen HS, He YW, Galle PR, Schuchmann M (2011) Ablation of c-FLIP in hepatocytes enhances death-receptor mediated apoptosis and toxic liver injury in vivo. J Hepatol 55:1272–1280
Schaub TP, Kartenbeck J, Konig J, Spring H, Dorsam J, Staehler G, Storkel S, Thon WF, Keppler D (1999) Expression of the MRP2 gene-encoded conjugate export pump in human kidney proximal tubules and in renal cell carcinoma. J Am Soc Nephrol 10:1159–1169
Schecter AJ, Sheu SU, Birnbaum LS, Devito JJ, Denison MS, Papke O (1999) A comparison and discussion of two differing methods of measuring dioxin-like compounds: Gas chromatography-mass spectrometry and the CALUX bioassay- implications for health studies. Organohalogen Cmpds 40:247–250
Schell MJ, Maurice M, Stieger B, Hubbard AL (1992) 5’nucleotidase is sorted to the apical domain of hepatocytes via an indirect route. J Cell Biol 119:1173–1182
Schlatter R, Philippi N, Wangorsch G, Pick R, Sawodny O, Borner C, Timmer J, Ederer M, Dandekar T (2011) Integration of Boolean models exemplified on hepatocyte signal transduction. Brief Bioinform 13:365–376
Schmelzer E, Zhang L, Bruce A, Wauthier E, Ludlow J, Yao HL, Moss N, Melhem A, McClelland R, Turner W, Kulik M, Sherwood S, Tallheden T, Cheng N, Furth ME, Reid LM (2007) Human hepatic stem cells from fetal and postnatal donors. J Exp Med 204:1973–1987
Schmich K, Schlatter R, Corazza N, Sá Ferreira K, Ederer M, Brunner T, Borner C, Merfort I (2011) Tumor necrosis factor alpha sensitizes primary murine hepatocytes to Fas/CD95-induced apoptosis in a Bim- and Bid-dependent manner. Hepatology 53:282–292
Schmidt CK, Hoegberg P, Fletcher N, Nilsson CB, Trossvik C, Hakansson H, Nau H (2003) 2,3,7,8-tetrachlorodibenzo-p-dioxin (TCDD) alters the endogenous metabolism of all-trans-retinoic acid in the rat. Arch Toxicol 77:371–383
Schmidt A, Braeuning A, Ruck P, Seitz G, Armeanu-Ebinger S, Fuchs J, Warmann SW, Schwarz M (2011) Differential expression of glutamine synthetase and cytochrome P450 isoforms in human hepatoblastoma. Toxicology 281:7–14
Schmucker DL, Sanchez H (2011) Liver regeneration and aging: a current perspective. Curr Gerontol Geriatr Res 2011:526379
Schnabl B, Czech B, Valletta D, Weiss TS, Kirovski G, Hellerbrand C (2011) Increased expression of zinc finger protein 267 in non-alcoholic fatty liver disease. Int J Clin Exp Pathol 4:661–666
Schnyder B, Mauri-Hellweg D, Zanni M, Bettens F, Pichler WJ (1997) Direct, MHC-dependent presentation of the drug sulfamethoxazole to human alphabeta T cell clones. J Clin Invest 100:136–141
Schote AB, Turner JD, Schiltz J, Muller CP (2007) Nuclear receptors in human immune cells: expression and correlations. Mol Immunol 44:1436–445
Schreiber S, Rignall B, Braeuning A, Marx-Stoelting P, Ott T, Buchmann A, Hammad S, Hengstler JG, Schwarz M, Kohle C (2011) Phenotype of single hepatocytes expressing an activated version of beta-catenin in liver of transgenic mice. J Mol Histol 42:393–400
Schrenk D, Baus PR, Ermel N, Klein C, Vorderstemann B, Kauffmann HM (2001) Up-regulation of transporters of the MRP family by drugs and toxins. Toxicol Lett 120:51–57
Schrenk D, Buchmann A, Dietz K, Lipp HP, Brunner H, Sirma H, Munzel P, Hagenmaier H, Gebhardt R, Bock KW (1994) Promotion of preneoplastic foci in rat liver with 2,3,7,8-tetrachlorodibenzo-p-dioxin, 1,2,3,4,6,7,8-heptachlorodibenzo-p-dioxin and a defined mixture of 49 polychlorinated dibenzo-p-dioxins. Carcinogenesis 15:509–515
Schrenk D, Stuven T, Gohl G, Viebahn R, Bock KW (1995) Induction of CYP1A and glutathione S-transferase activities by 2,3,7,8-tetrachlorodibenzo-p-dioxin in human hepatocyte cultures. Carcinogenesis 16:943–946
Schrode W, Mecke D, Gebhardt R (1990) Induction of glutamine synthetase in periportal hepatocytes by cocultivation with a liver epithelial cell line. Eur J Cell Biol 53:35–41
Schug M, Heise T, Bauer A, Storm D, Blaszkewicz M, Bedawy E, Brulport M, Geppert B, Hermes M, Follmann W, Rapp K, Maccoux L, Schormann W, Appel KE, Oberemm A, Gundert-Remy U, Hengstler JG (2008) Primary rat hepatocytes as in vitro system for gene expression studies: comparison of sandwich, Matrigel and 2D cultures. Arch Toxicol 82:923–931
Schug M, Stöber R, Heise T, Mielke H, Gundert-Remy U, Godoy P, Reif R, Blaszkewicz M, Ellinger-Ziegelbauer H, Ahr HR, Günther G, Marchan R, Sachinidis A, Nüssler A, Oberemm A, Hengstler JG (2012) Pharmacokinetics explain in vivo/in vitro discrepancies of carcinogen induced gene expression alterations in rat liver and cultivated hepatocytes. Arch Toxicol (submitted, 2012)
Schuppan D, Ruehl M, Somasundaram R, Hahn EG (2001) Matrix as a modulator of hepatic fibrogenesis. Semin Liver Dis 21:351–372
Schurigt U, Sevenich L, Vannier C, Gajda M, Schwinde A, Werner F, Stahl A, von Elverfeldt D, Becker AK, Bogyo M, Peters C, Reinheckel T (2008) Trial of the cysteine cathepsin inhibitor JPM-OEt on early and advanced mammary cancer stages in the MMTV-PyMT-transgenic mouse model. Biol Chem 389:1067–1074
Schuster S, Dandekar T, Fell DA (1999) Detection of elementary flux modes in biochemical networks: a promising tool for pathway analysis and metabolic engineering. Trends Biotechnol 17:53–60
Schutte J, Freudigmann C, Benz K, Bottger J, Gebhardt R, Stelzle M (2010) A method for patterned in situ biofunctionalization in injection-molded microfluidic devices. Lab Chip 10:2551–258
Schutte M, Fox B, Baradez MO, Devonshire A, Minguez J, Bokhari M, Przyborski S, Marshall D (2011) Rat primary hepatocytes show enhanced performance and sensitivity to acetaminophen during three-dimensional culture on a polystyrene scaffold designed for routine use. Assay Drug Dev Technol 9:475–486
Schutte J, Hagmeyer B, Holzner F, Kubon M, Werner S, Freudigmann C, Benz K, Bottger J, Gebhardt R, Becker H, Stelzle M (2011) „Artificial micro organs“–a microfluidic device for dielectrophoretic assembly of liver sinusoids. Biomed Microdevices 13:493–501
Schwabe RF, Bataller R, Brenner DA (2003) Human hepatic stellate cells express CCR5 and RANTES to induce proliferation and migration. Am J Physiol Gastrointest Liver Physiol 285:G949–G958
Schwarz M, Buchmann A, Schulte M, Pearson D, Kunz W (1989) Heterogeneity of enzyme-altered foci in rat liver. Toxicol Lett 49:297–317
Schwarz M, Buchmann A, Stinchcombe S, Kalkuhl A, Bock K (2000) Ah receptor ligands and tumor promotion: survival of neoplastic cells. Toxicol Lett 112–113:69–77
Scott-Conner CE, Grogan JB (1994) The pathophysiology of biliary obstruction and its effect on phagocytic and immune function. J Surg Res 57:316–36
Scott MJ, Liu S, Su GL, Vodovotz Y, Billiar TR (2005) Hepatocytes enhance effects of lipopolysaccharide on liver nonparenchymal cells through close cell interactions. Shock 23:453–458
Seglen PO (1972) Preparation of rat liver cells: I. Effect of Ca2+ on enzymatic dispersion of isolated, perfused liver. Exp Cell Res 74(2):450–454
Seglen PO (1976) Preparation of isolated rat liver cells. In: Prescott DM, ed. Methods in cell biology 8, New York. Academic. No. 3:29–83
Seki E, de Minicis S, Inokuchi S, Taura K, Miyai K, van Rooijen N, Schwabe RF, Brenner DA (2009) CCR2 promotes hepatic fibrosis in mice. Hepatology 50:185–197
Seki E, de Minicis S, Osterreicher CH, Kluwe J, Osawa Y, Brenner DA, Schwabe RF (2007) TLR4 enhances TGF-beta signaling and hepatic fibrosis. Nat Med 13:1324–1332
Sekine S, Lan BY, Bedolli M, Feng S, Hebrok M (2006) Liver-specific loss of beta-catenin blocks glutamine synthesis pathway activity and cytochrome p450 expression in mice. Hepatology 43:817–825
Sekine S, Ogawa R, McManus MT, Kanai Y, Hebrok M (2009) Dicer is required for proper liver zonation. J Pathol 219:365–372
Sekiya S, Suzuki A (2011) Direct conversion of mouse fibroblasts to hepatocyte-like cells by defined factors. Nature 475:390–393
Selvaggi TA, Walker RE, Fleisher TA (1997) Development of antibodies to fetal calf serum with arthus-like reactions in human immunodeficiency virus-infected patients given syngeneic lymphocyte infusions. Blood 89:776–779
Selzner N, Selzner M, Odermatt B, Tian Y, van Rooijen N, Clavien PA (2003) ICAM-1 triggers liver regeneration through leukocyte recruitment and Kupffer cell-dependent release of TNF-alpha/IL-6 in mice. Gastroenterology 124:692–700
Semino CE, Merok JR, Crane GG, Panagiotakos G, Zhang S (2003) Functional differentiation of hepatocyte-like spheroid structures from putative liver progenitor cells in three-dimensional peptide scaffolds. Differentiation 71:262–270
Semler EJ, Ranucci CS, Moghe PV (2000) Mechanochemical manipulation of hepatocyte aggregation can selectively induce or repress liver-specific function. Biotechnol Bioeng 69:359–369
Senoo H, Yoshikawa K, Morii M, Miura M, Imai K, Mezaki Y (2010) Hepatic stellate cell (vitamin A-storing cell) and its relative–past, present and future. Cell Biol Int 34:1247–1272
Seo SJ, Akaike T, Choi YJ, Shirakawa M, Kang IK, Cho CS (2005) Alginate microcapsules prepared with xyloglucan as a synthetic extracellular matrix for hepatocyte attachment. Biomaterials 26:3607–3615
Seo SJ, Choi YJ, Akaike T, Higuchi A, Cho CS (2006) Alginate/galactosylated chitosan/heparin scaffold as a new synthetic extracellular matrix for hepatocytes. Tissue Eng 12:33–44
Seo SJ, Kim IY, Choi YJ, Akaike T, Cho CS (2006) Enhanced liver functions of hepatocytes cocultured with NIH 3T3 in the alginate/galactosylated chitosan scaffold. Biomaterials 27:1487–1495
Seol W, Choi HS, Moore DD (1995) Isolation of proteins that interact specifically with the retinoid X receptor: two novel orphan receptors. Mol Endocrinol 9:72–85
Sevenich L, Schurigt U, Sachse K, Gajda M, Werner F, Muller S, Vasiljeva O, Schwinde A, Klemm N, Deussing J, Peters C, Reinheckel T (2010) Synergistic antitumor effects of combined cathepsin B and cathepsin Z deficiencies on breast cancer progression and metastasis in mice. Proc Natl Acad Sci USA 107:2497–2502
Sewall CH, Lucier GW, Tritscher AM, Clark GC (1993) TCDD-mediated changes in hepatic epidermal growth factor receptor may be a critical event in the hepatocarcinogenic action of TCDD. Carcinogenesis 14:1885–1893
Shafritz DA, Oertel M, Menthena A, Nierhoff D, Dabeva MD (2006) Liver stem cells and prospects for liver reconstitution by transplanted cells. Hepatology 43:S89–S98
Shah I, Houck K, Judson RS, Kavlock RJ, Martin MT, Reif DM, Wambaugh J, Dix DJ (2011) Using nuclear receptor activity to stratify hepatocarcinogens. PLoS One 6:e14584
Shah RR (2005) Mechanistic basis of adverse drug reactions: the perils of inappropriate dose schedules. Expert Opin Drug Saf 4:103–128
Shappell SB, Toman C, Anderson DC, Taylor AA, Entman ML, Smith CW (1990) Mac-1 (CD11b/CD18) mediates adherence-dependent hydrogen peroxide production by human and canine neutrophils. J Immunol 144:2702–2711
Sharma SK, Balamurugan A, Saha PK, Pandey RM, Mehra NK (2002) Evaluation of clinical and immunogenetic risk factors for the development of hepatotoxicity during antituberculosis treatment. Am J Respir Crit Care Med 166(7):916–919
Sharma AD, Cantz T, Richter R, Eckert K, Henschler R, Wilkens L, Jochheim-Richter A, Arseniev L, Ott M (2005) Human cord blood stem cells generate human cytokeratin 18-negative hepatocyte-like cells in injured mouse liver. Am J Pathol 167:555–564
Shaw PJ, Ganey PE, Roth RA (2009) Tumor necrosis factor alpha is a proximal mediator of synergistic hepatotoxicity from trovafloxacin/lipopolysaccharide coexposure. J Pharmacol Exp Ther 328:62–68
Shaw PJ, Hopfensperger MJ, Ganey PE, Roth RA (2007) Lipopolysaccharide and trovafloxacin coexposure in mice causes idiosyncrasy-like liver injury dependent on tumor necrosis factor-alpha. Toxicol Sci 100:259–266
Shear NH, Milpied B, Bruynzeel DP, Phillips EJ (2008) A review of drug patch testing and implications for HIV clinicians. AIDS 22(9):999–1007
Shedlofsky SI, Israel BC, McClain CJ, Hill DB, Blouin RA (1994) Endotoxin administration to humans inhibits hepatic cytochrome P450-mediated drug metabolism. J Clin Invest 94:2209–2214
Shen C, Huang Y, Liu Y, Wang G, Zhao Y, Wang Z, Teng M, Wang Y, Flockhart DA, Skaar TC, Yan P, Nephew KP, Huang TH, Li L (2011) A modulated empirical Bayes model for identifying topological and temporal estrogen receptor alpha regulatory networks in breast cancer. BMC Syst Biol 5:67
Shen C, Meng Q, Zhang G (2012) Species-specific toxicity of troglitazone on rats and human by gel entrapped hepatocytes. Toxicol Appl Pharmacol 258:19–25
Shertzer HG, Genter MB, Shen D, Nebert DW, Chen Y, Dalton TP (2006) TCDD decreases ATP levels and increases reactive oxygen production through changes in mitochondrial F(0)F(1)-ATP synthase and ubiquinone. Toxicol Appl Pharmacol 217:363–374
Shibata Y, Takahashi H, Chiba M, Ishii Y (2002) Prediction of hepatic clearance and availability by cryopreserved human hepatocytes: an application of serum incubation method. Drug Metab Dispos 30:892–896
Shimamoto Y, Ishida J, Yamagata K, Saito T, Kato H, Matsuoka T, Hirota K, Daitoku H, Nangaku M, Yamagata K, Fujii H, Takeda J, Fukamizu A (2004) Inhibitory effect of the small heterodimer partner on hepatocyte nuclear factor-4 mediates bile acid-induced repression of the human angiotensinogen gene. J Biol Chem 279:7770–7776
Shimaoka S, Nakamura T, Ichihara A (1987) Stimulation of growth of primary cultured adult rat hepatocytes without growth factors by coculture with nonparenchymal liver cells. Exp Cell Res 172:228–242
Shitara Y, Sugiyama Y (2006) Pharmacokinetic and pharmacodynamic alterations of 3-hydroxy-3-methylglutaryl coenzyme A (HMG-CoA) reductase inhibitors: drug-drug interactions and interindividual differences in transporter and metabolic enzyme functions. Pharmacol Ther 112:71–105
Shitara Y, Li AP, Kato Y, Lu C, Ito K, Itoh T, Sugiyama Y (2003) Function of uptake transporters for taurocholate and estradiol 17beta-D-glucuronide in cryopreserved human hepatocytes. Drug Metab Pharmacokinet 18:33–41
Shitara Y, Sato H, Sugiyama Y (2005) Evaluation of drug-drug interaction in the hepatobiliary and renal transport of drugs. Annu Rev Pharmacol Toxicol 45:689–723
Shitara Y, Horie T, Sugiyama Y (2006) Transporters as a determinant of drug clearance and tissue distribution. Eur J Pharm Sci 27:425–446
Shmarakov I, Fleshman MK, D’Ambrosio DN, Piantedosi R, Riedl KM, Schwartz SJ, Curley RW Jr, Von Lintig J, Rubin LP, Harrison EH, Blaner WS (2010) Hepatic stellate cells are an important cellular site for beta-carotene conversion to retinoid. Arch Biochem Biophys 504:3–10
Shoda J, Kano M, Oda K, Kamiya J, Nimura Y, Suzuki H, Sugiyama Y, Miyazaki H, Todoroki T, Stengelin S, Kramer W, Matsuzaki Y, Tanaka N (2001) The expression levels of plasma membrane transporters in the cholestatic liver of patients undergoing biliary drainage and their association with the impairment of biliary secretory function. Am J Gastroenterol 96:3368–3378
Shoji I, Aizaki H, Tani H, Ishii K, Chiba T, Saito I, Miyamura T, Matsuura Y (1997) Efficient gene transfer into various mammalian cells, including non-hepatic cells, by baculovirus vectors. J Gen Virol 78(Pt 10):2657–2664
Shomron N, Levy C (2009) MicroRNA-biogenesis and Pre-mRNA splicing crosstalk. J Biomed Biotechnol 2009:594678
Shu Y, Brown C, Castro RA, Shi RJ, Lin ET, Owen RP, Sheardown SA, Yue L, Burchard EG, Brett CM, Giacomini KM (2008) Effect of genetic variation in the organic cation transporter 1, OCT1, on metformin pharmacokinetics. Clin Pharmacol Ther 83:273–280
Shultz PJ, Knauss TC, Mene P, Abboud HE (1989) Mitogenic signals for thrombin in mesangial cells: regulation of phospholipase C and PDGF genes. Am J Physiol 257:F366–F374
Si-Tayeb K, Duclos-Vallee JC, Petit MA (2012) Hepatocyte-like cells differentiated from human induced pluripotent stem cells (iHLCs) are permissive to hepatitis C virus (HCV) infection: HCV study gets personal. J Hepatol 57:689–691
Si-Tayeb K, Noto FK, Nagaoka M, Li J, Battle MA, Duris C, North PE, Dalton S, Duncan SA (2010) Highly efficient generation of human hepatocyte-like cells from induced pluripotent stem cells. Hepatology 51:297–305
Sidler Pfandler MA, Hochli M, Inderbitzin D, Meier PJ, Stieger B (2004) Small hepatocytes in culture develop polarized transporter expression and differentiation. J Cell Sci 117:4077–4087
Siersbaek R, Nielsen R, Mandrup S (2010) PPARgamma in adipocyte differentiation and metabolism–novel insights from genome-wide studies. FEBS Lett 584:3242–3249
Sies H (1978) The use of perfusion of liver and other organs for the study of microsomal electron-transport and cytochrome P-450 systems. Methods Enzymol 52:48–59
Sies H, Chance B (1970) The steady state level of catalase compound I in isolated hemoglobin-free perfused rat liver. FEBS Lett 11:172–176
Sies H, Häussinger D, Grosskopf M (1974) Mitochondrial nicotinamide nucleotide systems: ammonium chloride responses and associated metabolic transitions in hemoglobin-free perfused rat liver. Hoppe Seylers Z Physiol Chem 355:305–320
Siest G, Jeannesson E, Marteau JB, Samara A, Marie B, Pfister M, Visvikis-Siest S (2008) Transcription factor and drug-metabolizing enzyme gene expression in lymphocytes from healthy human subjects. Drug Metab Dispos 36:182–189
Silkworth JB, Carlson EA, McCulloch C, Illouz K, Goodwin S, Sutter TR (2008) Toxicogenomic analysis of gender, chemical, and dose effects in livers of TCDD- or aroclor 1254-exposed rats using a multifactor linear model. Toxicol Sci 102:291–309
Silva JM, Day SH, Nicoll-Griffith DA (1999) Induction of cytochrome-P450 in cryopreserved rat and human hepatocytes. Chem Biol Interact 121:49–63
Silverman RB (1995) Mechanism-based enzyme inactivators. Methods Enzymol 249:240–283
Simoni J (2012) Artificial oxygen carriers: renewed commercial interest and scientific/technological advances. Artif Organs 36(2):123–126
Sinal CJ, Tohkin M, Miyata M, Ward JM, Lambert G, Gonzalez FJ (2000) Targeted disruption of the nuclear receptor FXR/BAR impairs bile acid and lipid homeostasis. Cell 102:731–744
Singer JB, Lewitzky S, Leroy E, Yang F, Zhao X, Klickstein L, Wright TM, Meyer J, Paulding CA (2010) A genome-wide study identifies HLA alleles associated with lumiracoxib-related liver injury. Nat Genet 42(8):711–714
Singh R, Czaja MJ (2007) Regulation of hepatocyte apoptosis by oxidative stress. J Gastroenterol Hepatol 22(Suppl 1):S45–S48
Sinz M, Wallace G, Sahi J (2008) Current industrial practices in assessing CYP450 enzyme induction: preclinical and clinical. Aaps J 10:391–400
Sissung TM, Troutman SM, Campbell TJ, Pressler HM, Sung H, Bates SE, Figg WD (2012) Transporter pharmacogenetics: transporter polymorphisms affect normal physiology, diseases, and pharmacotherapy. Discov Med 13:19–34
Sivertsson L, Ek M, Darnell M, Edebert I, Ingelman-Sundberg M, Neve EP (2010) CYP3A4 catalytic activity is induced in confluent Huh7 hepatoma cells. Drug Metab Dispos 38:995–1002
Skardal A, Smith L, Bharadwaj S, Atala A, Soker S, Zhang Y (2012) Tissue specific synthetic ECM hydrogels for 3-D in vitro maintenance of hepatocyte function. Biomaterials 33:4565–75
Slee EA, Keogh SA, Martin SJ (2000) Cleavage of BID during cytotoxic drug and UV radiation-induced apoptosis occurs downstream of the point of Bcl-2 action and is catalysed by caspase-3: a potential feedback loop for amplification of apoptosis-associated mitochondrial cytochrome c release. Cell Death Differ 7:556–65
Slimane TA, Trugnan G, Van ISC, Hoekstra D (2003) Raft-mediated trafficking of apical resident proteins occurs in both direct and transcytotic pathways in polarized hepatic cells: role of distinct lipid microdomains. Mol Biol Cell 14:611–24
Small DM (2003) Role of ABC transporters in secretion of cholesterol from liver into bile. Proc Natl Acad Sci USA 100:4–6
Smith MD, Smirthwaite AD, Cairns DE, Cousins RB, Gaylor JD (1996) Techniques for measurement of oxygen consumption rates of hepatocytes during attachment and post-attachment. Int J Artif Organs 19:36–44
Smith NF, Acharya MR, Desai N, Figg WD, Sparreboom A (2005) Identification of OATP1B3 as a high-affinity hepatocellular transporter of paclitaxel. Cancer Biol Ther 4:815–8
Smith NF, Marsh S, Scott-Horton TJ, Hamada A, Mielke S, Mross K, Figg WD, Verweij J, McLeod HL, Sparreboom A (2007) Variants in the SLCO1B3 gene: interethnic distribution and association with paclitaxel pharmacokinetics. Clin Pharmacol Ther 81:76–82
Smitherman PK, Townsend AJ, Kute TE, Morrow CS (2004) Role of multidrug resistance protein 2 (MRP2, ABCC2) in alkylating agent detoxification: MRP2 potentiates glutathione S-transferase A1–1-mediated resistance to chlorambucil cytotoxicity. J Pharmacol Exp Ther 308:260–267
Snykers S, Henkens T, de Rop E, Vinken M, Fraczek J, de Kock J, de Prins E, Geerts A, Rogiers V, Vanhaecke T (2009) Role of epigenetics in liver-specific gene transcription, hepatocyte differentiation and stem cell reprogrammation. Hepatol 1:187–211
So A, Thorens B (2010) Uric acid transport and disease. J Clin Invest 120:1791–1799
So AY, Chaivorapol C, Bolton EC, Li H, Yamamoto KR (2007) Determinants of cell- and gene-specific transcriptional regulation by the glucocorticoid receptor. PLoS Genet 3:e94
Soars MG, McGinnity DF, Grime K, Riley RJ (2007) The pivotal role of hepatocytes in drug discovery. Chem Biol Interact 168:2–15
Soars MG, Grime K, Sproston JL, Webborn PJ, Riley RJ (2007) Use of hepatocytes to assess the contribution of hepatic uptake to clearance in vivo. Drug Metab Dispos 35:859–865
Sohlenius-Sternbeck AK, Schmidt S (2005) Impaired glutathione-conjugating capacity by cryopreserved human and rat hepatocytes. Xenobiotica 35:727–736
Son JS, Kim SG, Oh JS, Appleford M, Oh S, Ong JL, Lee KB (2011) Hydroxyapatite/polylactide biphasic combination scaffold loaded with dexamethasone for bone regeneration. J Biomed Mater Res A 99:638–647
Song G, Wang L (2008) Transcriptional mechanism for the paired miR-433 and miR-127 genes by nuclear receptors SHP and ERRgamma. Nucleic Acids Res 36:5727–5735
Song G, Wang L (2009) Nuclear receptor SHP activates miR-206 expression via a cascade dual inhibitory mechanism. PLoS One 4:e6880
Song Z, Cai J, Liu Y, Zhao D, Yong J, Duo S, Song X, Guo Y, Zhao Y, Qin H, Yin X, Wu C, Che J, Lu S, Ding M, Deng H (2009) Efficient generation of hepatocyte-like cells from human induced pluripotent stem cells. Cell Res 19:1233–1242
Song G, Sharma AD, Roll GR, Ng R, Lee AY, Blelloch RH, Frandsen NM, Willenbring H (2010) MicroRNAs control hepatocyte proliferation during liver regeneration. Hepatology 51:1735–1743
Soroka CJ, Lee JM, Azzaroli F, Boyer JL (2001) Cellular localization and up-regulation of multidrug resistance-associated protein 3 in hepatocytes and cholangiocytes during obstructive cholestasis in rat liver. Hepatology 33:783–791
Sosef MN, Baust JM, Sugimachi K, Fowler A, Tompkins RG, Toner M (2005) Cryopreservation of isolated primary rat hepatocytes: enhanced survival and long-term hepatospecific function. Ann Surg 241:125–133
Sosnik A, Sefton MV (2005) Semi-synthetic collagen/poloxamine matrices for tissue engineering. Biomaterials 26:7425–7435
Soto-Gutierrez A, Navarro-Alvarez N, Zhao D, Rivas-Carrillo JD, Lebkowski J, Tanaka N, Fox IJ, Kobayashi N (2007) Differentiation of mouse embryonic stem cells to hepatocyte-like cells by co-culture with human liver nonparenchymal cell lines. Nat Protoc 2:347–356
Spanou Z, Keller M, Britschgi M, Yawalkar N, Fehr T, Neuweiler J, Gugger M, Mohaupt M, Pichler WJ (2006) Involvement of drug-specific T cells in acute drug-induced interstitial nephritis. J Am Soc Nephrol 17:2919–2927
Spiegel S, Milstien S, Grant S (2011) Endogenous modulators and pharmacological inhibitors of histone deacetylases in cancer therapy. Oncogene 31:537–551
Spraggs CF, Budde LR, Briley LP, Bing N, Cox CJ, King KS, Whittaker JC, Mooser VE, Preston AJ, Stein SH, Cardon LR (2011) HLA-DQA1*02:01 is a major risk factor for lapatinib-induced hepatotoxicity in women with advanced breast cancer. J Clin Oncol 29(6):667–673
Spray DC, Fujita M, Saez JC, Choi H, Watanabe T, Hertzberg E, Rosenberg LC, Reid LM (1987) Proteoglycans and glycosaminoglycans induce gap junction synthesis and function in primary liver cultures. J Cell Biol 105:541–551
Stadie WC, Riggs BC (1944) Microtome for the preparation of tissue slices for metabolic studies of surviving tissues in vitro. J Biol Chem 154:687–690
Stahl S, Ittrich C, Marx-Stoelting P, Kohle C, Altug-Teber O, Riess O, Bonin M, Jobst J, Kaiser S, Buchmann A, Schwarz M (2005) Genotype-phenotype relationships in hepatocellular tumors from mice and man. Hepatology 42:353–361
Stanulovic VS, Kyrmizi I, Kruithof-de Julio M, Hoogenkamp M, Vermeulen JL, Ruijter JM, Talianidis I, Hakvoort TB, Lamers WH (2007) Hepatic HNF4alpha deficiency induces periportal expression of glutamine synthetase and other pericentral enzymes. Hepatology 45:433–444
Staudinger JL, Goodwin B, Jones SA, Hawkins-Brown D, Mackenzie KI, Latour A, Liu Y, Klaassen CD, Brown KK, Reinhard J, Willson TM, Koller BH, Kliewer SA (2001) The nuclear receptor PXR is a lithocholic acid sensor that protects against liver toxicity. Proc Natl Acad Sci USA 98:3369–3374
Staudinger JL, Madan A, Carol KM, Parkinson A (2003) Regulation of drug transporter gene expression by nuclear receptors. Drug Metab Dispos 31:523–527
Stefanovich P, Ezzell RM, Sheehan SJ, Tompkins RG, Yarmush ML, Toner M (1995) Effects of hypothermia on the function, membrane integrity, and cytoskeletal structure of hepatocytes. Cryobiology 32:389–403
Stender JD, Kim K, Charn TH, Komm B, Chang KC, Kraus WL, Benner C, Glass CK, Katzenellenbogen BS (2010) Genome-wide analysis of estrogen receptor alpha DNA binding and tethering mechanisms identifies Runx1 as a novel tethering factor in receptor-mediated transcriptional activation. Mol Cell Biol 30:3943–3955
Stéphenne X, Najimi M, Ngoc DK, Smets F, Hue L, Guigas B, Sokal EM (2007) Cryopreservation of human hepatocytes alters the mitochondrial respiratory chain complex 1. Cell Transplant 16(4):409–419
Stéphenne X, Najimi M, Sokal EM (2010) Hepatocyte cryopreservation: is it time to change the strategy? World J Gastroenterol 16:1–14
Stieger B (2010) Role of the bile salt export pump, BSEP, in acquired forms of cholestasis. Drug Metab Rev 42(3):437–445
Stieger B (2011) The role of the sodium-taurocholate cotransporting polypeptide (NTCP) and of the bile salt export pump (BSEP) in physiology and pathophysiology of bile formation. Handb Exp Pharmacol 201:205–259
Stieger B, Beuers U (2011) The canalicular bile salt export pump BSEP (ABCB11) as a potential therapeutic target. Curr Drug Targets 12:661–670
Stieger B, Meier PJ (2011) Pharmacogenetics of drug transporters in the enterohepatic circulation. Pharmacogenomics 12:611–631
Stieger B, Hagenbuch B, Landmann L, Hochli M, Schroeder A, Meier PJ (1994) In situ localization of the hepatocytic Na +/Taurocholate cotransporting polypeptide in rat liver. Gastroenterology 107:1781–1787
Stieger B, Fattinger K, Madon J, Kullak-Ublick GA, Meier PJ (2000) Drug- and estrogen-induced cholestasis through inhibition of the hepatocellular bile salt export pump (Bsep) of rat liver. Gastroenterology 118:422–430
Stieger B, Meier Y, Meier PJ (2007) The bile salt export pump. Pflugers Arch 453:611–620
Stiehl A, Thaler MM, Admirand WH (1972) The effects of phenobarbital on bile salts and bilirubin in patients with intrahepatic and extrahepatic cholestasis. N Engl J Med 286:858–861
Stinchcombe S, Buchmann A, Bock KW, Schwarz M (1995) Inhibition of apoptosis during 2,3,7,8-tetrachlorodibenzo-p-dioxin-mediated tumour promotion in rat liver. Carcinogenesis 16:1271–1275
Stirnimann G, Kessebohm K, Lauterburg B (2010) Liver injury caused by drugs: an update. Swiss Med Wkly 140:w13080
Strahl BD, Allis CD (2000) The language of covalent histone modifications. Nature 403:41–45
Strasser A, Harris AW, Huang DC, Krammer PH, Cory S (1995) Bcl-2 and Fas/APO-1 regulate distinct pathways to lymphocyte apoptosis. Embo J 14:6136–6147
Strasser A, Jost PJ, Nagata S (2009) The many roles of FAS receptor signaling in the immune system. Immunity 30:180–192
Strathmann J, Paal K, Ittrich C, Krause E, Appel KE, Glauert HP, Buchmann A, Schwarz M (2007) Proteome analysis of chemically induced mouse liver tumors with different genotype. Proteomics 7:3318–3331
Strathmann J, Schwarz M, Tharappel JC, Glauert HP, Spear BT, Robertson LW, Appel KE, Buchmann A (2006) PCB 153, a non-dioxin-like tumor promoter, selects for beta-catenin (Catnb)-mutated mouse liver tumors. Toxicol Sci 93:34–40
Strautnieks SS, Byrne JA, Pawlikowska L, Cebecauerova D, Rayner A, Dutton L, Meier Y, Antoniou A, Stieger B, Arnell H, Ozcay F, Al-Hussaini HF, Bassas AF, Verkade HJ, Fischler B, Nemeth A, Kotalova R, Shneider BL, Cielecka-Kuszyk J, McClean P, Whitington PF, Sokal E, Jirsa M, Wali SH, Jankowska I, Pawlowska J, Mieli-Vergani G, Knisely AS, Bull LN, Thompson RJ (2008) Severe bile salt export pump deficiency: 82 different ABCB11 mutations in 109 families. Gastroenterology 134:1203–1214
Stringer R, Nicklin PL, Houston JB (2008) Reliability of human cryopreserved hepatocytes and liver microsomes as in vitro systems to predict metabolic clearance. Xenobiotica 38:1313–1329
Strom SC, Dorko K, Thompson MT, Pisarov LA, Nussler AK (2005) Large scale isolation and culture of human hepatocytes. Ilots de Langerhans et hepatocytes 195–205
Strom SC, Jirtle RL, Jones RS, Novicki DL, Rosenberg MR, Novotny A, Irons G, McLain JR, Michalopoulos G (1982) Isolation, culture, and transplantation of human hepatocytes. J Natl Cancer Inst 68:771–778
Stroup D, Crestani M, Chiang JY (1997) Identification of a bile acid response element in the cholesterol 7 alpha-hydroxylase gene CYP7A. Am J Physiol 273:G508–F517
Studer E, Zhou X, Zhao R, Wang Y, Takabe K, Nagahashi M, Pandak WM, Dent P, Spiegel S, Shi R, Xu W, Liu X, Bohdan P, Zhang L, Zhou H, Hylemon PB (2012) Conjugated bile acids activate the sphingosine-1-phosphate receptor 2 in primary rodent hepatocytes. Hepatology 55(1):267–276
Su Y, Zhang X, Sinko PJ (2004) Human organic anion-transporting polypeptide OATP-A (SLC21A3) acts in concert with P-glycoprotein and multidrug resistance protein 2 in the vectorial transport of Saquinavir in Hep G2 cells. Mol Pharm 1:49–56
Sueyoshi T, Kawamoto T, Zelko I, Honkakoski P, Negishi M (1999) The repressed nuclear receptor CAR responds to phenobarbital in activating the human CYP2B6 gene. J Biol Chem 274:6043–6
Sugatani J, Kojima H, Ueda A, Kakizaki S, Yoshinari K, Gong QH, Owens IS, Negishi M, Sueyoshi T (2001) The phenobarbital response enhancer module in the human bilirubin UDP-glucuronosyltransferase UGT1A1 gene and regulation by the nuclear receptor CAR. Hepatology 33:1232–1238
Sugimachi K, Sosef MN, Baust JM, Fowler A, Tompkins RG, Toner M (2004) Long-term function of cryopreserved rat hepatocytes in a coculture system. Cell Transpl 13:187–195
Suino K, Peng L, Reynolds R, Li Y, Cha JY, Repa JJ, Kliewer SA, Xu HE (2004) The nuclear xenobiotic receptor CAR: structural determinants of constitutive activation and heterodimerization. Mol Cell 16:893–905
Sumanasekera WK, Tien ES, Turpey R, Vanden Heuvel JP, Perdew JP (2003) Evidence that peroxisome proliferator-activated receptor alpha is complexed with the 90-kDa heat shock protein and the hepatitis virus B X-associated protein 2. J Biol Chem 278:4467–4473
Sun AQ, Arrese MA, Zeng L, Swaby I, Zhou MM, Suchy FJ (2001) The rat liver Na(+)/bile acid cotransporter. Importance of the cytoplasmic tail to function and plasma membrane targeting. J Biol Chem 276:6825–6833
Sun B, Karin M (2008) NF-kappaB signaling, liver disease and hepatoprotective agents. Oncogene 27:6228–6244
Sung JJ, Go MY (1999) Reversible Kupffer cell suppression in biliary obstruction is caused by hydrophobic bile acids. J Hepatol 30:413–418
Suzuki A, Zheng YW, Kaneko S, Onodera M, Fukao K, Nakauchi H, Taniguchi H (2002) Clonal identification and characterization of self-renewing pluripotent stem cells in the developing liver. J Cell Biol 156:173–184
Suzuki H, Watabe T, Kato M, Miyazawa K, Miyazono K (2005) Roles of vascular endothelial growth factor receptor 3 signaling in differentiation of mouse embryonic stem cell-derived vascular progenitor cells into endothelial cells. Blood 105:2372–2379
Svoboda M, Riha J, Wlcek K, Jaeger W, Thalhammer T (2011) Organic anion transporting polypeptides (OATPs): regulation of expression and function. Curr Drug Metab 12:139–153
Swift B, Pfeifer ND, Brouwer KL (2010) Sandwich-cultured hepatocytes: an in vitro model to evaluate hepatobiliary transporter-based drug interactions and hepatotoxicity. Drug Metab Rev 42:446–471
Synold TW, Dussault I, Forman BM (2001) The orphan nuclear receptor SXR coordinately regulates drug metabolism and efflux. Nat Med 7:584–590
Szyf M (2010) DNA methylation and demethylation probed by small molecules. Biochim Biophys Acta 1799:750–759
Tacke F, Luedde T, Trautwein C (2009) Inflammatory pathways in liver homeostasis and liver injury. Clin Rev Allergy Immunol 36:4–12
Tafazoli S, Spehar DD, O’Brien PJ (2005) Oxidative stress mediated idiosyncratic drug toxicity. Drug Metab Rev 37:311–325
Takagi S, Nakajima M, Mohri T, Yokoi T (2008) Post-transcriptional regulation of human pregnane X receptor by micro-RNA affects the expression of cytochrome P450 3A4. J Biol Chem 283:9674–9680
Takagi S, Nakajima M, Kida K, Yamaura Y, Fukami T, Yokoi T (2010) MicroRNAs regulate human hepatocyte nuclear factor 4alpha, modulating the expression of metabolic enzymes and cell cycle. J Biol Chem 285:4415–4422
Takahashi A, Hasegawa M, Sumazaki R, Suzuki M, Toki F, Suehiro T, Onigata K, Tomomasa T, Suzuki T, Matsui A, Morikawa A, Kuwano H (2007) Gradual improvement of liver function after administration of ursodeoxycholic acid in an infant with a novel ABCB11 gene mutation with phenotypic continuum between BRIC2 and PFIC2. Eur J Gastroenterol Hepatol 19:942–946
Takahashi K, Tanabe K, Ohnuki M, Narita M, Ichisaka T, Tomoda K, Yamanaka S (2007) Induction of pluripotent stem cells from adult human fibroblasts by defined factors. Cell 131:861–872
Takahashi R, Sonoda H, Tabata Y, Hisada A (2010) Formation of hepatocyte spheroids with structural polarity and functional bile canaliculi using nanopillar sheets. Tissue Eng Part A 16:1983–1995
Takanaga H, Chaudhuri B, Frommer WB (2008) GLUT1 and GLUT9 as major contributors to glucose influx in HepG2 cells identified by a high sensitivity intramolecular FRET glucose sensor. Biochim Biophys Acta 1778:1091–1099
Takeba Y, Matsumoto N, Takenoshita-Nakaya S, Harimoto Y, Kumai T, Kinoshita Y, Nakano H, Ohtsubo T, Kobayashi S (2011) Comparative study of culture conditions for maintaining CYP3A4 and ATP-binding cassette transporters activity in primary cultured human hepatocytes. J Pharmacol Sci 115:516–524
Takebe T, Sekine K, Enomura M, Koike H, Kimura M, Ogaeri T, Zhang RR, Ueno Y, Zheng YW, Koike N, Aoyama S, Adachi Y, Taniguchi H (2013) Vascularized and functional human liver from an iPSC-derived organ bud transplant. Nature. doi:10.1038/nature12271
Takei R, Suzuki D, Hoshiba T, Nagaoka M, Seo SJ, Cho CS, Akaike T (2005) Role of E-cadherin molecules in spheroid formation of hepatocytes adhered on galactose-carrying polymer as an artificial asialoglycoprotein model. Biotechnol Lett 27:1149–1156
Takeishi T, Hirano K, Kobayashi T, Hasegawa G, Hatakeyama K, Naito M (1999) The role of Kupffer cells in liver regeneration. Arch Histol Cytol 62:413–422
Takeshita K, Bowen WC, Michalopoulos GK (1998) Three-dimensional culture of hepatocytes in a continuously flowing medium. In Vitro Cell Dev Biol Anim 34:482–485
Takikawa H, Sano N, Narita T, Uchida Y, Yamanaka M, Horie T, Mikami T, Tagaya O (1991) Biliary excretion of bile acid conjugates in a hyperbilirubinemic mutant Sprague-Dawley rat. Hepatology 14:352–360
Talamini MA, McCluskey MP, Buchman TG, de Maio A (1998) Expression of alpha2-macroglobulin by the interaction between hepatocytes and endothelial cells in coculture. Am J Physiol 275:R203–R211
Tambaro FP, Dell’Aversana C, Carafa V, Nebbioso A, Radic B, Ferrara F, Altucci L (2010) Histone deacetylase inhibitors: clinical implications for hematological malignancies. Clin Epigenetics 1:25–44
Tan EH, Ma FJ, Gopinadhan S, Sakban RB, Wang ND (2007) C/EBP alpha knock-in hepatocytes exhibit increased albumin secretion and urea production. Cell Tissue Res 330:427–435
Tan X, Behari J, Cieply B, Michalopoulos GK, Monga SP (2006) Conditional deletion of beta-catenin reveals its role in liver growth and regeneration. Gastroenterology 131:1561–1572
Tanaka A, Nezu S, Uegaki S, Kikuchi K, Shibuya A, Miyakawa H, Takahashi S, Bianchi I, Zermiani P, Podda M, Ohira H, Invernizzi P, Takikawa H (2009) Vitamin D receptor polymorphisms are associated with increased susceptibility to primary biliary cirrhosis in Japanese and Italian populations. J Hepatol 50:1202–1209
Tanaka M, Itoh T, Tanimizu N, Miyajima A (2011) Liver stem/progenitor cells: their characteristics and regulatory mechanisms. J Biochem 149:231–239
Tang D, Lahti JM, Kidd VJ (2000) Caspase-8 activation and bid cleavage contribute to MCF7 cellular execution in a caspase-3-dependent manner during staurosporine-mediated apoptosis. J Biol Chem 275:9303–9307
Tang C, Lin Y, Rodrigues AD, Lin JH (2002) Effect of albumin on phenytoin and tolbutamide metabolism in human liver microsomes: an impact more than protein binding. Drug Metab Dispos 30:648–654
Taniguchi K, Wada M, Kohno K, Nakamura T, Kawabe T, Kawakami M, Kagotani K, Okumura K, Akiyama S, Kuwano M (1996) A human canalicular multispecific organic anion transporter (cMOAT) gene is overexpressed in cisplatin-resistant human cancer cell lines with decreased drug accumulation. Cancer Res 56:4124–4129
Tanimizu N, Nishikawa M, Saito H, Tsujimura T, Miyajima A (2003) Isolation of hepatoblasts based on the expression of Dlk/Pref-1. J Cell Sci 116:1775–1786
Tateno C, Yoshizato K (1996) Long-term cultivation of adult rat hepatocytes that undergo multiple cell divisions and express normal parenchymal phenotypes. Am J Pathol 148:383–392
Taub R (2004) Liver regeneration: from myth to mechanism. Nat Rev Mol Cell Biol 5:836–847
Tchaparian EH, Houghton JS, Uyeda C, Grillo MP, Jin L (2011) Effect of culture time on the basal expression levels of drug transporters in sandwich-cultured primary rat hepatocytes. Drug Metab Dispos 39:2387–2394
Teeguarden JG, Dragan YP, Singh J, Vaughan J, Xu YH, Goldsworthy T, Pitot HC (1999) Quantitative analysis of dose- and time-dependent promotion of four phenotypes of altered hepatic foci by 2,3,7,8-tetrachlorodibenzo-p-dioxin in female Sprague-Dawley rats. Toxicol Sci 51:211–223
Telbisz A, Muller M, Ozvegy-Laczka C, Homolya L, Szente L, Varadi A, Sarkadi B (2007) Membrane cholesterol selectively modulates the activity of the human ABCG2 multidrug transporter. Biochim Biophys Acta 1768:2698–2713
Teli MR, James OF, Burt AD, Bennett MK, Day CP (1995) The natural history of nonalcoholic fatty liver: a follow-up study. Hepatology 22:1714–1719
Teng S, Piquette-Miller M (2008) Regulation of transporters by nuclear hormone receptors: implications during inflammation. Mol Pharm 5:67–76
Terdoslavich M, de Graaf IAM, Proost JH, Cocolo A, Passamonti S, Groothuis GMM (2012) Bilitranslocase is involved in the uptake of bromosulfophthalein in rat and human liver. Metab Lett 6:165–173
Terry C, Dhawan A, Mitry RR, Lehec SC, Hughes RD (2006) Preincubation of rat and human hepatocytes with cytoprotectants prior to cryopreservation can improve viability and function upon thawing. Liver Transpl 12:165–177
Terry C, Dhawan A, Mitry RR, Lehec SC, Hughes RD (2010) Optimization of the cryopreservation and thawing protocol for human hepatocytes for use in cell transplantation. Liver Transpl 16:229–237
Terry C, Mitry RR, Lehec SC, Muiesan P, Rela M, Heaton ND, Hughes RD, Dhawan A (2005) The effects of cryopreservation on human hepatocytes obtained from different sources of liver tissue. Cell Transpl 14:585–594
Teruel T, Hernandez R, Benito M, Lorenzo M (2003) Rosiglitazone and retinoic acid induce uncoupling protein-1 (UCP-1) in a p38 mitogen-activated protein kinase-dependent manner in fetal primary brown adipocytes. J Biol Chem 278:263–269
Thomas RJ, Bhandari R, Barrett DA, Bennett AJ, Fry JR, Powe D, Thomson BJ, Shakesheff KM (2005) The effect of three-dimensional co-culture of hepatocytes and hepatic stellate cells on key hepatocyte functions in vitro. Cells Tissues Organs 181:67–79
Thomas C, Pellicciari R, Pruzanski M, Auwerx J, Schoonjans K (2008) Targeting bile-acid signalling for metabolic diseases. Nat Rev Drug Discov 7:678–693
Thomas RS, Clewell HJ 3rd, Allen BC, Wesselkamper SC, Wang NC, Lambert JC, Hess-Wilson JK, Zhao QJ, Andersen ME (2011) Application of transcriptional benchmark dose values in quantitative cancer and noncancer risk assessment. Toxicol Sci 120:194–205
Thorens B, Mueckler M (2010) Glucose transporters in the 21st century. Am J Physiol Endocrinol Metab 298:E141–E145
Thummel KE, Brimer C, Yasuda K, Thottassery J, Senn T, Lin Y, Ishizuka H, Kharasch E, Schuetz J, Schuetz E (2001) Transcriptional control of intestinal cytochrome P-4503A by 1alpha,25-dihydroxy vitamin D3. Mol Pharmacol 60:1399–1406
Tilles AW, Baskaran H, Roy P, Yarmush ML, Toner M (2001) Effects of oxygenation and flow on the viability and function of rat hepatocytes cocultured in a microchannel flat-plate bioreactor. Biotechnol Bioeng 73:379–389
Tirona RG, Lee W, Leake BF, Lan LB, Cline CB, Lamba V, Parviz F, Duncan SA, Inoue Y, Gonzalez FJ, Schuetz EG, Kim RB (2003) The orphan nuclear receptor HNF4alpha determines PXR- and CAR-mediated xenobiotic induction of CYP3A4. Nat Med 9:220–224
Tiscornia G, Vivas EL, Izpisua Belmonte JC (2011) Diseases in a dish: modeling human genetic disorders using induced pluripotent cells. Nat Med 17:1570–1576
Toh YC, Lim TC, Tai D, Xiao G, van Noort D, Yu H (2009) A microfluidic 3D hepatocyte chip for drug toxicity testing. Lab Chip 9:2026–2035
Tolosa L, Bonora-Centelles A, Donato MT, Mirabet V, Pareja E, Negro A, Lopez S, Castell JV, Gomez-Lechon MJ (2011) Influence of platelet lysate on the recovery and metabolic performance of cryopreserved human hepatocytes upon thawing. Transplantation 91:1340–1346
Tolosa L, Donato MT, Perez-Cataldo G, Castell JV, Gomez-Lechon MJ (2011b) Upgrading cytochrome P450 activity in HepG2 cells co-transfected with adenoviral vectors for drug hepatotoxicity assessment. Toxicol In Vitro
Tompkins LM, Wallace AD (2007) Mechanisms of cytochrome P450 induction. J Biochem Mol Toxicol 21:176–181
Tong JZ, de Lagausie P, Furlan V, Cresteil T, Bernard O, Alvarez F (1992) Long-term culture of adult rat hepatocyte spheroids. Exp Cell Res 200:326–332
Tong JZ, Sarrazin S, Cassio D, Gauthier F, Alvarez F (1994) Application of spheroid culture to human hepatocytes and maintenance of their differentiation. Biol Cell 81:77–81
Tordjmann T, Berthon B, Lardeux B, Moreau A, Jacquemin E, Combettes L, Feldmann G, Claret M (1997) An improved digitonin-collagenase perfusion technique for the isolation of periportal and perivenous hepatocytes from a single rat liver: physiological implications for lobular heterogeneity. Hepatology 26:1592–1599
Tostoes RM, Leite SB, Miranda JP, Sousa M, Wang DI, Carrondo MJ, Alves PM (2011) Perfusion of 3D encapsulated hepatocytes–a synergistic effect enhancing long-term functionality in bioreactors. Biotechnol Bioeng 108:41–49
Tostoes RM, Leite SB, Serra M, Jensen J, Bjorquist P, Carrondo MJ, Brito C, Alves PM (2012) Human liver cell spheroids in extended perfusion bioreactor culture for repeated-dose drug testing. Hepatology 55:1227–1236
Touboul T, Hannan NR, Corbineau S, Martinez A, Martinet C, Branchereau S, Mainot S, Strick-Marchand H, Pedersen R, di Santo J, Weber A, Vallier L (2010) Generation of functional hepatocytes from human embryonic stem cells under chemically defined conditions that recapitulate liver development. Hepatology 51:1754–1765
Townsend AJ, Kiningham KK, St Clair D, Tephly TR, Morrow CS, Guengerich FP (1999) Symposium overview: Characterization of xenobiotic metabolizing enzyme function using heterologous expression systems. Toxicol Sci 48:143–150
Toyoda Y, Tsuchida A, Iwami E, Miwa I (2001) Toxic effect of troglitazone on cultured rat hepatocytes. Life Sci 68:1867–1876
Troadec MB, Fautrel A, Drenou B, Leroyer P, Camberlein E, Turlin B, Guillouzo A, Brissot P, Loreal O (2008) Transcripts of ceruloplasmin but not hepcidin, both major iron metabolism genes, exhibit a decreasing pattern along the portocentral axis of mouse liver. Biochim Biophys Acta 1782:239–249
Tsuruga Y, Kiyono T, Matsushita M, Takahashi T, Kasai H, Matsumoto S, Todo S (2008) Establishment of immortalized human hepatocytes by introduction of HPV16 E6/E7 and hTERT as cell sources for liver cell-based therapy. Cell Transpl 17(9):1083–1094
Tucker GT, Houston JB, Huang SM (2001) Optimizing drug development: strategies to assess drug metabolism/transporter interaction potential–towards a consensus. Br J Clin Pharmacol 52:107–117
Tukov FF, Luyendyk JP, Ganey PE, Roth RA (2007) The role of tumor necrosis factor alpha in lipopolysaccharide/ranitidine-induced inflammatory liver injury. Toxicol Sci 100:267–280
Turncliff RZ, Tian X, Brouwer KL (2006) Effect of culture conditions on the expression and function of Bsep, Mrp2, and Mdr1a/b in sandwich-cultured rat hepatocytes. Biochem Pharmacol 71:1520–529
Turner R, Lozoya O, Wang Y, Cardinale V, Gaudio E, Alpini G, Mendel G, Wauthier E, Barbier C, Alvaro D, Reid LM (2011) Human hepatic stem cell and maturational liver lineage biology. Hepatology 53:1035–1045
Tuschl G, Hrach J, Walter Y, Hewitt PG, Mueller SO (2009) Serum-free collagen sandwich cultures of adult rat hepatocytes maintain liver-like properties long term: a valuable model for in vitro toxicity and drug-drug interaction studies. Chem Biol Interact 181:124–137
Tuschl G, Mueller SO (2006) Effects of cell culture conditions on primary rat hepatocytes-cell morphology and differential gene expression. Toxicology 218:205–215
Tzanakakis ES, Hansen LK, Hu WS (2001) The role of actin filaments and microtubules in hepatocyte spheroid self-assembly. Cell Motil Cytoskeleton 48:175–189
Ueberham E, Bottger J, Ueberham U, Grosche J, Gebhardt R (2010) Response of sinusoidal mouse liver cells to choline-deficient ethionine-supplemented diet. Comp Hepatol 9:8
Ueda K, Kato Y, Komatsu K, Sugiyama Y (2001) Inhibition of biliary excretion of methotrexate by probenecid in rats: quantitative prediction of interaction from in vitro data. J Pharmacol Exp Ther 297:1036–1043
Ueno T, Gonzalez FJ (1990) Transcriptional control of the rat hepatic CYP2E1 gene. Mol Cell Biol 10:4495–4505
Ueno Y, Ishii M, Yahagi K, Mano Y, Kisara N, Nakamura N, Shimosegawa T, Toyota T, Nagata S (2000) Fas-mediated cholangiopathy in the murine model of graft versus host disease. Hepatology 31:966–974
Uldry M, Thorens B (2004) The SLC2 family of facilitated hexose and polyol transporters. Pflugers Arch 447:480–489
Ullrich A, Berg C, Hengstler JG, Runge D (2007) Use of a standardised and validated long-term human hepatocyte culture system for repetitive analyses of drugs: repeated administrations of acetaminophen reduces albumin and urea secretion. Altex 24:35–40
Ullrich A, Stolz DB, Ellis EC, Strom SC, Michalopoulos GK, Hengstler JG, Runge D (2009) Long term cultures of primary human hepatocytes as an alternative to drug testing in animals. Altex 26:295–302
Ulvestad M, Bjorquist P, Molden E, Asberg A, Andersson TB (2011) OATP1B1/1B3 activity in plated primary human hepatocytes over time in culture. Biochem Pharmacol 82:1219–26
Unadkat JD, Kirby BJ, Endres CJ, Zolnerciks JK (2010) The impact and in vitro to in vivo prediction of transporter-based drug-drug interactions in humans. Springer, New York
Urquhart BL, Tirona RG, Kim RB (2007) Nuclear receptors and the regulation of drug-metabolizing enzymes and drug transporters: implications for interindividual variability in response to drugs. J Clin Pharmacol 47:566–578
Uyama N, Shimahara Y, Kawada N, Seki S, Okuyama H, Iimuro Y, Yamaoka Y (2002) Regulation of cultured rat hepatocyte proliferation by stellate cells. J Hepatol 36:590–599
Uygun BE, Soto-Gutierrez A, Yagi H, Izamis ML, Guzzardi MA, Shulman C, Milwid J, Kobayashi N, Tilles A, Berthiaume F, Hertl M, Nahmias Y, Yarmush ML, Uygun K (2010) Organ reengineering through development of a transplantable recellularized liver graft using decellularized liver matrix. Nat Med 16:814–820
Uygun K, Matthew HW, Huang Y (2007) Investigation of metabolic objectives in cultured hepatocytes. Biotechnol Bioeng 97:622–637
van Aubel RA, Koenderink JB, Peters JG, van Os CH, Russel FG (1999) Mechanisms and interaction of vinblastine and reduced glutathione transport in membrane vesicles by the rabbit multidrug resistance protein Mrp2 expressed in insect cells. Mol Pharmacol 56:714–719
van Birgelen AP, Smit EA, Kampen IM, Groeneveld CN, Fase KM, van der Kolk J, Poiger H, van den Berg M, Koeman JH, Brouwer A (1995) Subchronic effects of 2,3,7,8-TCDD or PCBs on thyroid hormone metabolism: use in risk assessment. Eur J Pharmacol 293:77–85
van Bossuyt H, Wisse E (1988) Cultured Kupffer cells, isolated from human and rat liver biopsies, ingest endotoxin. J Hepatol 7:45–56
van de Bovenkamp M, Groothuis GM, Meijer DK, Olinga P (2008) Liver slices as a model to study fibrogenesis and test the effects of anti-fibrotic drugs on fibrogenic cells in human liver. Toxicology in vitro : an international journal published in association with BIBRA 22:771
van de Bovenkamp M, Groothuis GM, Meijer DK, Slooff MJ, Olinga P (2006) Human liver slices as an in vitro model to study toxicity-induced hepatic stellate cell activation in a multicellular milieu. Chem Biol Interact 162:62–69
Van De Steeg E, Stranecky V, Hartmannova H, Noskova L, Hrebicek M, Wagenaar E, van Esch A, De Waart DR, Oude Elferink RP, Kenworthy KE, Sticova E, Knisely AS, Kmoch S, Jirsa M, Schinkel AH (2012) Complete OATP1B1 and OATP1B3 deficiency causes human Rotor syndrome by interrupting conjugated bilirubin reuptake into the liver. J Clin Invest 122:519–528
van de Steeg E, van der Kruijssen CM, Wagenaar E, Burggraaff JE, Mesman E, Kenworthy KE, Schinkel AH (2009) Methotrexate pharmacokinetics in transgenic mice with liver-specific expression of human organic anion-transporting polypeptide 1B1 (SLCO1B1). Drug Metab Dispos 37:277–281
van de Steeg E, Wagenaar E, van der Kruijssen CM, Burggraaff JE, de Waart DR, Elferink RP, Kenworthy KE, Schinkel AH (2010) Organic anion transporting polypeptide 1a/1b-knockout mice provide insights into hepatic handling of bilirubin, bile acids, and drugs. J Clin Invest 120:2942–2952
van den Berg M, Birnbaum LS, Denison M, de Vito M, Farland W, Feeley M, Fiedler H, Hakansson H, Hanberg A, Haws L, Rose M, Safe S, Schrenk D, Tohyama C, Tritscher A, Tuomisto J, Tysklind M, Walker N, Peterson RE (2006) The 2005 World Health Organization reevaluation of human and Mammalian toxic equivalency factors for dioxins and dioxin-like compounds. Toxicol Sci 93:223–241
van der Deure WM, Friesema EC, de Jong FJ, de Rijke YB, de Jong FH, Uitterlinden AG, Breteler MM, Peeters RP, Visser TJ (2008) Organic anion transporter 1B1: an important factor in hepatic thyroid hormone and estrogen transport and metabolism. Endocrinology 149:4695–4701
van der Meer DL, Degenhardt T, Vaisanen S, de Groot PJ, Heinaniemi M, de Vries SC, Muller M, Carlberg C, Kersten S (2010) Profiling of promoter occupancy by PPARalpha in human hepatoma cells via ChIP-chip analysis. Nucleic Acids Res 38:2839–2850
van der Sluijs P, Braakman I, Meijer DK, Groothuis GM (1988) Heterogeneous acinar localization of the asialoglycoprotein internalization system in rat hepatocytes. Hepatology 8(6):1521–1529
van Midwoud PM, Groothuis GM, Merema MT, Verpoorte E (2010) Microfluidic biochip for the perifusion of precision-cut rat liver slices for metabolism and toxicology studies. Biotechnol Bioeng 105:184–194
van Midwoud PM, Merema MT, Verpoorte E, Groothuis GM (2010) A microfluidic approach for in vitro assessment of interorgan interactions in drug metabolism using intestinal and liver slices. Lab Chip 10:2778–2786
van Midwoud PM, Janssen J, Merema MT, de Graaf IA, Groothuis GM, Verpoorte E (2011) On-line HPLC analysis system for metabolism and inhibition studies in precision-cut liver slices. Anal Chem 83:84–91
van Midwoud PM, Merema MT, Verpoorte E, Groothuis GM (2011) Microfluidics enables small-scale tissue-based drug metabolism studies with scarce human tissue. J Lab Autom 16:468–476
van Midwoud PM, Verpoorte E, Groothuis GM (2011) Microfluidic devices for in vitro studies on liver drug metabolism and toxicity. Integr Biol (Camb) 3:509–521
van Midwoud PM, Merema MT, Verweij N, Groothuis GM, Verpoorte E (2011) Hydrogel embedding of precision-cut liver slices in a microfluidic device improves drug metabolic activity. Biotechnol Bioeng 108:1404–1412
van Mil SW, van der Woerd WL, van der Brugge G, Sturm E, Jansen PL, Bull LN, van den Berg IE, Berger R, Houwen RH, Klomp LW (2004) Benign recurrent intrahepatic cholestasis type 2 is caused by mutations in ABCB11. Gastroenterology 127:379–384
van Noort D, Ong SM, Zhang C, Zhang S, Arooz T, Yu H (2009) Stem cells in microfluidics. Biotechnol Prog 25:52–60
van Rooijen N (1989) The liposome-mediated macrophage ‘suicide’ technique. J Immunol Methods 124:1–6
van Rooijen N, Sanders A (1994) Liposome mediated depletion of macrophages: mechanism of action, preparation of liposomes and applications. J Immunol Methods 174:83–93
van Rooijen N, Sanders A (1997) Elimination, blocking, and activation of macrophages: three of a kind? J Leukoc Biol 62:702–709
van Summeren A, Renes J, Bouwman FG, Noben JP, van Delft JH, Kleinjans JC, Mariman EC (2011) Proteomics investigations of drug-induced hepatotoxicity in HepG2 cells. Toxicol Sci 120:109–122
van Zijl F, Mikulits W (2010) Hepatospheres: Three dimensional cell cultures resemble physiological conditions of the liver. World J Hepatol 2:1–7
Vandenabeele P, Declercq W, Van Herreweghe F, Vanden Berghe T (2010) The role of the kinases RIP1 and RIP3 in TNF-induced necrosis. Sci Signal 3:re4
Vanhaecke T, Henkens T, Kass GE, Rogiers V (2004) Effect of the histone deacetylase inhibitor trichostatin A on spontaneous apoptosis in various types of adult rat hepatocyte cultures. Biochem Pharmacol 68:753–760
Vara E, Arias-Diaz J, Villa N, Hernandez J, Garcia C, Ortiz P, Balibrea JL (1995) Beneficial effect of S-adenosylmethionine during both cold storage and cryopreservation of isolated hepatocytes. Cryobiology 32:422–427
Vasilj A, Gentzel M, Ueberham E, Gebhardt R, Shevchenko A (2012) Tissue proteomics by one-dimensional gel electrophoresis combined with label-free protein quantification. J Proteome Res 11:3680–3689
Vaux DL, Silke J (2003) Mammalian mitochondrial IAP binding proteins. Biochem Biophys Res Commun 304:499–504
Vavassori P, Mencarelli A, Renga B, Distrutti E, Fiorucci S (2009) The bile acid receptor FXR is a modulator of intestinal innate immunity. J Immunol 183(10):6251–6261
Vermeulen M, Mulder KW, Denissov S, Pijnappel WW, van Schaik FM, Varier RA, Baltissen MP, Stunnenberg HG, Mann M, Timmers HT (2007) Selective anchoring of TFIID to nucleosomes by trimethylation of histone H3 lysine 4. Cell 131:58–69
Vickers AE (2009) Tissue slices for the evaluation of metabolism-based toxicity with the example of diclofenac. Chem Biol Interact 179:9–16
Vickers AE, Fisher R, Olinga P, Dial S (2011) Repair pathways evident in human liver organ slices. Toxicol In Vitro 25:1485–1492
Vickers AE, Fisher RL (2004) Organ slices for the evaluation of human drug toxicity. Chem Biol Interact 150:87–96
Vickers AE, Fisher RL (2005) Precision-cut organ slices to investigate target organ injury. Expert Opin Drug Metab Toxicol 1:687–699
Vickers AE, Saulnier M, Cruz E, Merema MT, Rose K, Bentley P, Olinga P (2004) Organ slice viability extended for pathway characterization: an in vitro model to investigate fibrosis. Toxicol Sci 82:534–544
Victorino RM, Maria VA, Correia AP, de Moura C (1987) Floxacillin-induced cholestatic hepatitis with evidence of lymphocyte sensitization. Arch Intern Med 147:987–989
Vignati L, Turlizzi E, Monaci S, Grossi P, Kanter R, Monshouwer M (2005) An in vitro approach to detect metabolite toxicity due to CYP3A4-dependent bioactivation of xenobiotics. Toxicology 216:154–167
Villafuerte BC, Koop BL, Pao CI, Gu L, Birdsong GG, Phillips LS (1994) Coculture of primary rat hepatocytes and nonparenchymal cells permits expression of insulin-like growth factor binding protein-3 in vitro. Endocrinology 134:2044–2050
Viluksela M, Stahl BU, Birnbaum LS, Rozman KK (1997) Subchronic/chronic toxicity of 1,2,3,4,6,7,8-heptachlorodibenzo-p-dioxin (HpCDD) in rats. Part II. Biochemical effects. Toxicol Appl Pharmacol 146:217–226
Viluksela M, Bager Y, Tuomisto JT, Scheu G, Unkila M, Pohjanvirta R, Flodstrom S, Kosma VM, Maki-Paakkanen J, Vartiainen T, Klimm C, Schramm KW, Warngard L, Tuomisto J (2000) Liver tumor-promoting activity of 2,3,7,8-tetrachlorodibenzo-p-dioxin (TCDD) in TCDD-sensitive and TCDD-resistant rat strains. Cancer Res 60:6911–6920
Viluksela M, Raasmaja A, Lebofsky M, Stahl BU, Rozman KK (2004) Tissue-specific effects of 2,3,7,8-tetrachlorodibenzo-p-dioxin (TCDD) on the activity of 5’-deiodinases I and II in rats. Toxicol Lett 147:133–142
Vinken M, Papeleu P, Snykers S, de Rop E, Henkens T, Chipman JK, Rogiers V, Vanhaecke T (2006) Involvement of cell junctions in hepatocyte culture functionality. Crit Rev Toxicol 36:299–318
Vinken M, Henkens T, Vanhaecke T, Papeleu P, Geerts A, van Rossen E, Chipman JK, Meda P, Rogiers V (2006) Trichostatin a enhances gap junctional intercellular communication in primary cultures of adult rat hepatocytes. Toxicol Sci 91:484–492
Vinken M, Doktorova T, Decrock E, Leybaert L, Vanhaecke T, Rogiers V (2009) Gap junctional intercellular communication as a target for liver toxicity and carcinogenicity. Crit Rev Biochem Mol Biol 44:201–222
Visser WE, Friesema EC, Visser TJ (2009) Transport of thyroxine and 3,3’,5-triiodothyronine in human umbilical vein endothelial cells. Endocrinology 150:1552–1557
Viswakarma N, Jia Y, Bai L, Vluggens A, Borensztajn J, Xu J, Reddy JK (2010) Coactivators in PPAR-regulated gene expression. PPAR Res
Vogel A, Strassburg CP, Manns MP (2002) Genetic association of vitamin D receptor polymorphisms with primary biliary cirrhosis and autoimmune hepatitis. Hepatology 35:126–131
Vom Dahl S, Hallbrucker C, Lang F, Gerok W, Häussinger D (1991) A non-invasive technique for cell volume determination in perfused rat liver. Biol Chem Hoppe Seyler 372:411–418
Vom Dahl S, Häussinger D (1997) Experimental methods in hepatology. Guidelines of the German Association for the Study of the Liver (GASL). Liver perfusion–technique and applications. Z Gastroenterol 35:221–226
Vom Dahl s, Häussinger D (1998) Bumetanide-sensitive cell swelling mediates the inhibitory effect of ethanol on proteolysis in rat liver. Gastroenterology 114:1046–1053
Waddington CH (1942) The epigenotype. Endeavour 1:18–20
Wagner M, Halilbasic E, Marschall HU, Zollner G, Fickert P, Langner C, Zatloukal K, Denk H, Trauner M (2005) CAR and PXR agonists stimulate hepatic bile acid and bilirubin detoxification and elimination pathways in mice. Hepatology 42:420–430
Wajant H, Pfizenmaier K, Scheurich P (2003) Tumor necrosis factor signaling. Cell Death Differ 10:45–65
Walgren JL, Mitchell MD, Thompson DC (2005) Role of metabolism in drug-induced idiosyncratic hepatotoxicity. Crit Rev Toxicol 35:325–361
Walisser JA, Glover E, Pande K, Liss AL, Bradfield CA (2005) Aryl hydrocarbon receptor-dependent liver development and hepatotoxicity are mediated by different cell types. Proc Natl Acad Sci USA 102:17858–17863
Walker NJ, Wyde ME, Fischer LJ, Nyska A, Bucher JR (2006) Comparison of chronic toxicity and carcinogenicity of 2,3,7,8-tetrachlorodibenzo-p-dioxin (TCDD) in 2-year bioassays in female Sprague-Dawley rats. Mol Nutr Food Res 50:934–944
Walker TM, Rhodes PC, Westmoreland C (2000) The differential cytotoxicity of methotrexate in rat hepatocyte monolayer and spheroid cultures. Toxicol In Vitro 14:475–485
Walter D, Schmich K, Vogel S, Pick R, Kaufmann T, Hochmuth FC, Haber A, Neubert K, McNelly S, von Weizsacker F, Merfort I, Maurer U, Strasser A, Borner C (2008) Switch from type II to I Fas/CD95 death signaling on in vitro culturing of primary hepatocytes. Hepatology 48:1942–1953
Wan YJ, An D, Cai Y, Repa JJ, Hung-Po Chen T, Flores M, Postic C, Magnuson MA, Chen J, Chien KR, French S, Mangelsdorf DJ, Sucov HM (2000) Hepatocyte-specific mutation establishes retinoid X receptor alpha as a heterodimeric integrator of multiple physiological processes in the liver. Mol Cell Biol 20:4436–4444
Wang L, Boyer JL (2004) The maintenance and generation of membrane polarity in hepatocytes. Hepatology 39(4):892–899
Wang H, Chen J, Hollister K, Sowers LC, Forman BM (1999) Endogenous bile acids are ligands for the nuclear receptor FXR/BAR. Mol Cell 3:543–553
Wang X, Yang J, Gascoyne PR (1999) Role of peroxide in AC electrical field exposure effects on friend murine erythroleukemia cells during dielectrophoretic manipulations. Biochim Biophys Acta 1426:53–68
Wang X, Kanel GC, Deleve LD (2000) Support of sinusoidal endothelial cell glutathione prevents hepatic veno-occlusive disease in the rat. Hepatology 31:428–434
Wang R, Salem M, Yousef IM, Tuchweber B, Lam P, Childs SJ, Helgason CD, Ackerley C, Phillips MJ, Ling V (2001) Targeted inactivation of sister of P-glycoprotein gene (Spgp) in mice results in nonprogressive but persistent intrahepatic cholestasis. Proc Natl Acad Sci USA 98:2011–2016
Wang DS, Jonker JW, Kato Y, Kusuhara H, Schinkel AH, Sugiyama Y (2002) Involvement of organic cation transporter 1 in hepatic and intestinal distribution of metformin. J Pharmacol Exp Ther 302:510–515
Wang P, Kim RB, Chowdhury JR, Wolkoff AW (2003) The human organic anion transport protein SLC21A6 is not sufficient for bilirubin transport. J Biol Chem 278:20695–20699
Wang X, Yan Y, Xiong Z, Lin F, Wu R, Zhang R, Lu Q (2005) Preparation and evaluation of ammonia-treated collagen/chitosan matrices for liver tissue engineering. J Biomed Mater Res B Appl Biomater 75:91–98
Wang X, Yan Y, Lin F, Xiong Z, Wu R, Zhang R, Lu Q (2005) Preparation and characterization of a collagen/chitosan/heparin matrix for an implantable bioartificial liver. J Biomater Sci Polym Ed 16:1063–80
Wang J, Sun F, Zhang DW, Ma Y, Xu F, Belani JD, Cohen JC, Hobbs HH, Xie XS (2006) Sterol transfer by ABCG5 and ABCG8: in vitro assay and reconstitution. J Biol Chem 281:27894–27904
Wang YD, Chen WD, Wang M, Yu D, Forman BM, Huang W (2008) Farnesoid X receptor antagonizes nuclear factor kappaB in hepatic inflammatory response. Hepatology 48:1632–1643
Wang S, Nagrath D, Chen PC, Berthiaume F, Yarmush ML (2008) Three-dimensional primary hepatocyte culture in synthetic self-assembling peptide hydrogel. Tissue Eng Part A 14:227–236
Wang XX, Jiang T, Shen Y, Adorini L, Pruzanski M, Gonzalez FJ, Scherzer P, Lewis L, Miyazaki-Anzai S, Levi M (2009) The farnesoid X receptor modulates renal lipid metabolism and diet-induced renal inflammation, fibrosis, and proteinuria. Am J Physiol Renal Physiol 297:F1587–F1596
Wang YD, Forman BM, Huang W (2011) The G-protein-coupled bile acid receptor, Gpbar1 (TGR5), negatively regulates hepatic inflammatory response through antagonizing nuclear factor kappa light-chain enhancer of activated B cells (NF-kappaB) in mice. Hepatology 54:1421–1432
Wang L, Wang X, Xie G, Wang L, Hill CK, Deleve LD (2012) Liver sinusoidal endothelial cell progenitor cells promote liver regeneration in rats. J Clin Invest 122:1567–1573
Wang YM, Ong SS, Chai SC, Chen T (2012) Role of CAR and PXR in xenobiotic sensing and metabolism. Expert Opin Drug Metab Toxicol 8:803–817
Wanninger J, Neumeier M, Hellerbrand C, Schacherer D, Bauer S, Weiss TS, Huber H, Schaffler A, Aslanidis C, Scholmerich J, Buechler C (2011) Lipid accumulation impairs adiponectin-mediated induction of activin A by increasing TGFbeta in primary human hepatocytes. Biochim Biophys Acta 1811:626–633
Warburg O (1923) Versuche an überlebendem Karzinomgewebe. Biochem Z 142:317
Watanabe N, Miura S, Zeki S, Ishii H (2001) Hepatocellular oxidative DNA injury induced by macrophage-derived nitric oxide. Free Radic Biol Med 30:1019–1028
Watanabe M, Houten SM, Wang L, Moschetta A, Mangelsdorf DJ, Heyman RA, Moore DD, Auwerx J (2004) Bile acids lower triglyceride levels via a pathway involving FXR, SHP, and SREBP-1c. J Clin Invest 113:1408–1418
Watanabe A, Hashmi A, Gomes DA, Town T, Badou A, Flavell RA, Mehal WZ (2007) Apoptotic hepatocyte DNA inhibits hepatic stellate cell chemotaxis via toll-like receptor 9. Hepatology 46:1509–1518
Watanabe T, Kusuhara H, Maeda K, Shitara Y, Sugiyama Y (2009) Physiologically based pharmacokinetic modeling to predict transporter-mediated clearance and distribution of pravastatin in humans. J Pharmacol Exp Ther 328:652–662
Waters LJ, Mandalia S, Gazzard B, Nelson M (2007) Prospective HLA-B*5701 screening and abacavir hypersensitivity: a single centre experience. Aids 21:2533–2534
Waxman DJ, Lapenson DP, Aoyama T, Gelboin HV, Gonzalez FJ, Korzekwa K (1991) Steroid hormone hydroxylase specificities of eleven cDNA-expressed human cytochrome P450 s. Arch Biochem Biophys 290:160–166
Webborn PJ, Parker AJ, Denton RL, Riley RJ (2007) In vitro-in vivo extrapolation of hepatic clearance involving active uptake: theoretical and experimental aspects. Xenobiotica 37:1090–1109
Wege H, Le HT, Chui MS, Liu L, Wu J, Giri R, Malhi H, Sappal BS, Kumaran V, Gupta S, Zern MA (2003) Telomerase reconstitution immortalizes human fetal hepatocytes without disrupting their differentiation potential. Gastroenterology 124(2):432–444
Wei MC, Lindsten T, Mootha VK, Weiler S, Gross A, Ashiya M, Thompson CB, Korsmeyer SJ (2000) tBID, a membrane-targeted death ligand, oligomerizes BAK to release cytochrome c. Genes Dev 14:2060–2071
Weinman SA (1997) Electrogenicity of Na(+)-coupled bile acid transporters. Yale J Biol Med 70:331–340
Weiss C, Faust D, Schreck I, Ruff A, Farwerck T, Melenberg A, Schneider S, Oesch-Bartlomowicz B, Zatloukalova J, Vondracek J, Oesch F, Dietrich C (2008) TCDD deregulates contact inhibition in rat liver oval cells via Ah receptor, JunD and cyclin A. Oncogene 27:2198–2207
Weiss C, Kolluri SK, Kiefer F, Gottlicher M (1996) Complementation of Ah receptor deficiency in hepatoma cells: negative feedback regulation and cell cycle control by the Ah receptor. Exp Cell Res 226:154–163
Weisz OA, Rodriguez-Boulan E (2009) Apical trafficking in epithelial cells: signals, clusters and motors. J Cell Sci 122:4253–4266
Wells RG (2008a) Cellular sources of extracellular matrix in hepatic fibrosis. Clin Liver Dis 12:759–768, viii
Wells RG (2008) The role of matrix stiffness in regulating cell behavior. Hepatology 47:1394–1400
West MA, Billiar TR, Mazuski JE, Curran RJ, Cerra FB, Simmons RL (1988) Endotoxin modulation of hepatocyte secretory and cellular protein synthesis is mediated by Kupffer cells. Arch Surg 123:1400–1405
West MA, Keller GA, Hyland BJ, Cerra FB, Simmons RL (1985) Hepatocyte function in sepsis: Kupffer cells mediate a biphasic protein synthesis response in hepatocytes after exposure to endotoxin or killed Escherichia coli. Surgery 98:388–395
West MA, Keller GA, Hyland BJ, Cerra FB, Simmons RL (1986) Further characterization of Kupffer cell/macrophage-mediated alterations in hepatocyte protein synthesis. Surgery 100:416–423
Westlind-Johnsson A, Malmebo S, Johansson A, Otter C, Andersson TB, Johansson I, Edwards RJ, Boobis AR, Ingelman-Sundberg M (2003) Comparative analysis of CYP3A expression in human liver suggests only a minor role for CYP3A5 in drug metabolism. Drug Metab Dispos 31:755–761
Wickham TJ (2000) Targeting adenovirus. Gene Ther 7:110–114
Widman LE, Golden JJ, Chasin LA (1979) Immortalization of normal liver functions in cell culture: rat hepatocyte-hepatoma cell hybrids expressing ornithine carbamoyltransferase activity. J Cell Physiol 100:391–400
Wilkinson GR (2005) Drug metabolism and variability among patients in drug response. N Engl J Med 352:2211–2221
Willert K, Nusse R (1998) Beta-catenin: a key mediator of Wnt signaling. Curr Opin Genet Dev 8:95–102
Williams SK, McKenney S, Jarrell BE (1995) Collagenase lot selection and purification for adipose tissue digestion. Cell Transplant 4:281–289
Williams CD, Bajt ML, Farhood A, Jaeschke H (2010) Acetaminophen-induced hepatic neutrophil accumulation and inflammatory liver injury in CD18-deficient mice. Liver Int 30:1280–1292
Wilton JC, Chipman JK, Lawson CJ, Strain AJ, Coleman R (1993) Periportal- and perivenous-enriched hepatocyte couplets: differences in canalicular activity and in response to oxidative stress. Biochem J 292(Pt 3):773–779
Wirsing A, Senkel S, Klein-Hitpass L, Ryffel GU (2011) A systematic analysis of the 3’UTR of HNF4A mRNA reveals an interplay of regulatory elements including miRNA target sites. PLoS One 6:e27438
Wisse E, Braet F, Luo D, de Zanger R, Jans D, Crabbe E, Vermoesen A (1996) Structure and function of sinusoidal lining cells in the liver. Toxicol Pathol 24:100–111
Witt O, Deubzer HE, Milde T, Oehme I (2009) HDAC family: What are the cancer relevant targets? Cancer Lett 277:8–21
Wittenburg H, Carey MC (2002) Biliary cholesterol secretion by the twinned sterol half-transporters ABCG5 and ABCG8. J Clin Invest 110:605–609
Wobser H, Dorn C, Weiss TS, Amann T, Bollheimer C, Buttner R, Scholmerich J, Hellerbrand C (2009) Lipid accumulation in hepatocytes induces fibrogenic activation of hepatic stellate cells. Cell Res 19:996–1005
Wong SF, DA No, Y, Choi YY, Kim DS, Chung BG, Lee SH (2011) Concave microwell based size-controllable hepatosphere as a three-dimensional liver tissue model. Biomaterials 32(32):8087–8096
Worboys PD, Bradbury A, Houston JB (1997) Kinetics of drug metabolism in rat liver slices. III. Relationship between metabolic clearance and slice uptake rate. Drug Metab Dispos 25:460–467
Wright MC, Maurel P, Paine AJ (1996) Induction of cytochrome P450 3A by metyrapone in human hepatocyte culture. Hum Exp Toxicol 15:203–204
Wu D, Cederbaum AI (1996) Ethanol cytotoxicity to a transfected HepG2 cell line expressing human cytochrome P4502E1. J Biol Chem 271:23914–23919
Wu FJ, Friend JR, Remmel RP, Cerra FB, Hu WS (1999) Enhanced cytochrome P450 IA1 activity of self-assembled rat hepatocyte spheroids. Cell Transpl 8:233–246
Wu J, Meng Z, Jiang M, Zhang E, Trippler M, Broering R, Bucchi A, Krux F, Dittmer U, Yang D, Roggendorf M, Gerken G, Lu M, Schlaak JF (2009) Toll-like receptor-induced innate immune responses in non-parenchymal liver cells are cell type-specific. Immunology 129:363–374
Wu R, Cui X, Dong W, Zhou M, Simms HH, Wang P (2006) Suppression of hepatocyte CYP1A2 expression by Kupffer cells via AhR pathway: the central role of proinflammatory cytokines. Int J Mol Med 18:339–346
Wu X, Li W, Sharma V, Godzik A, Freeze HH (2002) Cloning and characterization of glucose transporter 11, a novel sugar transporter that is alternatively spliced in various tissues. Mol Genet Metab 76:37–45
Wullaert A, van Loo G, Heyninck K, Beyaert R (2007) Hepatic tumor necrosis factor signaling and nuclear factor-kappaB: effects on liver homeostasis and beyond. Endocr Rev 28:365–386
Xia X, Francis H, Glaser S, Alpini G, Lesage G (2006) Bile acid interactions with cholangiocytes. World J Gastroenterol 12:3553–3563
Xiao J, Gong AY, Eischeid AN, Chen D, Deng C, Young CY, Chen XM (2012) miR-141 modulates androgen receptor transcriptional activity in human prostate cancer cells through targeting the small heterodimer partner protein. Prostate
Xie W, Radominska-Pandya A, Shi Y, Simon CM, Nelson MC, Ong ES, Waxman DJ, Evans RM (2001) An essential role for nuclear receptors SXR/PXR in detoxification of cholestatic bile acids. Proc Natl Acad Sci USA 98:3375–3380
Xu J, Ma M, Purcell WM (2003) Characterisation of some cytotoxic endpoints using rat liver and HepG2 spheroids as in vitro models and their application in hepatotoxicity studies. II. Spheroid cell spreading inhibition as a new cytotoxic marker. Toxicol Appl Pharmacol 189:112–119
Xu J, Purcell WM (2006) Energy metabolism and biotransformation as endpoints to pre-screen hepatotoxicity using a liver spheroid model. Toxicol Appl Pharmacol 216:293–302
Xu JJ, Henstock PV, Dunn MC, Smith AR, Chabot JR, de Graaf D (2008) Cellular imaging predictions of clinical drug-induced liver injury. Toxicol Sci 105:97–105
Xu X, Arriaga EA (2009) Qualitative determination of superoxide release at both sides of the mitochondrial inner membrane by capillary electrophoretic analysis of the oxidation products of triphenylphosphonium hydroethidine. Free Radic Biol Med 46:905–913
Xu JJ, Dunn MC, Smith AR, Tien ES (2012) Assessment of hepatotoxicity potential of drug candidate molecules including kinase inhibitors by hepatocyte imaging assay technology and bile flux imaging assay technology. Methods Mol Biol 795:83–107
Yagi K, Sumiyoshi N, Nakashima Y, Michibayashi N, Kawase M, Miura Y, Mizoguchi T (1998) Stimulation of liver functions in hierarchical co-culture of bone marrow cells and hepatocytes. Cytotechnology 26:5–12
Yamagata K, Daitoku H, Shimamoto Y, Matsuzaki H, Hirota K, Ishida J, Fukamizu A (2004) Bile acids regulate gluconeogenic gene expression via small heterodimer partner-mediated repression of hepatocyte nuclear factor 4 and Foxo1. J Biol Chem 279:23158–23165
Yamakawa Y, Hamada A, Shuto T, Yuki M, Uchida T, Kai H, Kawaguchi T, Saito H (2011) Pharmacokinetic impact of SLCO1A2 polymorphisms on imatinib disposition in patients with chronic myeloid leukemia. Clin Pharmacol Ther 90:157–163
Yamashita M, Emerman M (2006) Retroviral infection of non-dividing cells: old and new perspectives. Virology 344:88–93
Yamashita Y, Shimada M, Harimoto N, Rikimaru T, Shirabe K, Tanaka S, Sugimachi K (2003) Histone deacetylase inhibitor trichostatin A induces cell-cycle arrest/apoptosis and hepatocyte differentiation in human hepatoma cells. Int J Cancer 103:572–576
Yan HM, Ramachandran A, Bajt ML, Lemasters JJ, Jaeschke H (2010) The oxygen tension modulates acetaminophen-induced mitochondrial oxidant stress and cell injury in cultured hepatocytes. Toxicol Sci 117:515–523
Yan QG, Shi JG, Zhang F, Zhao QT, Pang XW, Chen R, Hu PZ, Li QL, Wang Z, Huang GS (2008) Overexpression of CYP2E1 enhances sensitivity of HepG2 cells to fas-mediated cytotoxicity. Cancer Biol Ther 7:1280–1287
Yang F, Huang X, Yi T, Yen Y, Moore DD, Huang W (2007) Spontaneous development of liver tumors in the absence of the bile acid receptor farnesoid X receptor. Cancer Res 67:863–867
Yang J, Chung TW, Nagaoka M, Goto M, Cho CS, Akaike T (2001) Hepatocyte-specific porous polymer-scaffolds of alginate/galactosylated chitosan sponge for liver tissue engineering. Biotechnology Letters 23:1385–1389
Yang J, Goto M, Ise H, Cho CS, Akaike T (2002) Galactosylated alginate as a scaffold for hepatocytes entrapment. Biomaterials 23:471–9
Yang X, Han G, Pang X, Fan M (2012) Chitosan/collagen scaffold containing bone morphogenetic protein-7 DNA supports dental pulp stem cell differentiation in vitro and in vivo. J Biomed Mater Res A
Yang XJ, Seto E (2007) HATs and HDACs: from structure, function and regulation to novel strategies for therapy and prevention. Oncogene 26:5310–8
Yang L, Jung Y, Omenetti A, Witek RP, Choi SS, Vandongen HM, Huang J, Alpini GD, Diehl AM (2008) Fate-Mapping evidence that hepatic stellate cells are epithelial progenitors in adult mouse livers. Stem Cells 26:2104–2113
Yao C, Levy RH (2002) Inhibition-based metabolic drug-drug interactions: predictions from in vitro data. J Pharm Sci 91:1923–35
Yazdanpanah B, Wiegmann K, Tchikov V, Krut O, Pongratz C, Schramm M, Kleinridders A, Wunderlich T, Kashkar H, Utermohlen O, Bruning JC, Schutze S, Kronke M (2009) Riboflavin kinase couples TNF receptor 1 to NADPH oxidase. Nature 460:1159–1163
Yin C, Ying L, Zhang PC, Zhuo RX, Kang ET, Leong KW, Mao HQ (2003) High density of immobilized galactose ligand enhances hepatocyte attachment and function. J Biomed Mater Res A 67:1093–1104
Yin J, Meng Q (2012) Use of primary rat hepatocytes in the gel entrapment culture to predict in vivo biliary excretion. Xenobiotica 42:417–428
Yin J, Meng Q, Zhang G, Sun Y (2009) Differential methotrexate hepatotoxicity on rat hepatocytes in 2-D monolayer culture and 3-D gel entrapment culture. Chem Biol Interact 180:368–375
Yin XM, Wang K, Gross A, Zhao Y, Zinkel S, Klocke B, Roth KA, Korsmeyer SJ (1999) Bid-deficient mice are resistant to Fas-induced hepatocellular apoptosis. Nature 400:886–891
Yoon JH, Gores GJ (2002) Death receptor-mediated apoptosis and the liver. J Hepatol 37:400–410
Yoshida K, Maeda K, Sugiyama Y (2012) Prediction of the degree of transporter-mediated drug-drug interactions involving OATP substrates based on in vitro inhibition studies. Clin Pharmacol Ther doi:10.1038/clpt.2011.351
Yoshida T, Takayama K, Kondoh M, Sakurai F, Tani H, Sakamoto N, Matsuura Y, Mizuguchi H, Yagi K (2011) Use of human hepatocyte-like cells derived from induced pluripotent stem cells as a model for hepatocytes in hepatitis C virus infection. Biochem Biophys Res Commun 416:119–124
Yoshikawa Y, Hosomi H, Fukami T, Nakajima M, Yokoi T (2009) Establishment of knockdown of superoxide dismutase 2 and expression of CYP3A4 cell system to evaluate drug-induced cytotoxicity. Toxicol In Vitro 23:1179–1187
Yoshinari K, Yoda N, Toriyabe T, Yamazoe Y (2010) Constitutive androstane receptor transcriptionally activates human CYP1A1 and CYP1A2 genes through a common regulatory element in the 5’-flanking region. Biochem Pharmacol 79:261–269
Yoshitomi S, Ikemoto K, Takahashi J, Miki H, Namba M, Asahi S (2001) Establishment of the transformants expressing human cytochrome P450 subtypes in HepG2, and their applications on drug metabolism and toxicology. Toxicol In Vitro 15:245–256
You Q, Cheng L, Kedl RM, Ju C (2008) Mechanism of T cell tolerance induction by murine hepatic Kupffer cells. Hepatology 48:978–990
Youdim KA, Tyman CA, Jones BC, Hyland R (2007) Induction of cytochrome P450: assessment in an immortalized human hepatocyte cell line (Fa2N4) using a novel higher throughput cocktail assay. Drug Metab Dispos 35:275–282
Youle RJ, Strasser A (2008) The BCL-2 protein family: opposing activities that mediate cell death. Nat Rev Mol Cell Biol 9:47–59
Yu J, Chau KF, Vodyanik MA, Jiang J, Jiang Y (2011) Efficient feeder-free episomal reprogramming with small molecules. PLoS One 6:e17557
Yu J, Vodyanik MA, Smuga-Otto K, Antosiewicz-Bourget J, Frane JL, Tian S, Nie J, Jonsdottir GA, Ruotti V, Stewart R, Slukvin II, Thomson JA (2007) Induced pluripotent stem cell lines derived from human somatic cells. Science 318:1917–1920
Yu L, Hammer RE, Li-Hawkins J, von Bergmann K, Lutjohann D, Cohen JC, Hobbs HH (2002) Disruption of Abcg5 and Abcg8 in mice reveals their crucial role in biliary cholesterol secretion. Proc Natl Acad Sci USA 99:16237–16242
Yu Y, Liu H, Ikeda Y, Amiot BP, Rinaldo P, Duncan SA, Nyberg SL (2012) Hepatocyte-like cells differentiated from human induced pluripotent stem cells: Relevance to cellular therapies. Stem Cell Res 9:196–207
Yue J, Peng R, Chen J, Liu Y, Dong G (2009) Effects of rifampin on CYP2E1-dependent hepatotoxicity of isoniazid in rats. Pharmacol Res 59:112–119
Yusa K, Rashid ST, Strick-Marchand H, Varela I, Liu PQ, Paschon DE, Miranda E, Ordonez A, Hannan NR, Rouhani FJ, Darche S, Alexander G, Marciniak SJ, Fusaki N, Hasegawa M, Holmes MC, di Santo JP, Lomas DA, Bradley A, Vallier L (2011) Targeted gene correction of alpha1-antitrypsin deficiency in induced pluripotent stem cells. Nature 478:391–394
Zaher H, Fernandez-Salguero PM, Letterio J, Sheikh MS, Fornace AJ Jr, Roberts AB, Gonzalez FJ (1998) The involvement of aryl hydrocarbon receptor in the activation of transforming growth factor-beta and apoptosis. Mol Pharmacol 54:313–321
Zaher H, Meyer zu Schwabedissen HE, Tirona RG, Cox ML, Obert LA, Agrawal N, Palandra J, Stock JL, Kim RB, Ware JA (2008) Targeted disruption of murine organic anion-transporting polypeptide 1b2 (Oatp1b2/Slco1b2) significantly alters disposition of prototypical drug substrates pravastatin and rifampin. Mol Pharmacol 74:320–329
Zahlten RN, Hagler HK, Nejtek ME, Day CJ (1978) Morphological characterization of Kupffer and endothelial cells of rat liver isolated by counterflow elutriation. Gastroenterology 75:80–87
Zahno A, Brecht K, Morand R, Maseneni S, Torok M, Lindinger PW, Krahenbuhl S (2011) The role of CYP3A4 in amiodarone-associated toxicity on HepG2 cells. Biochem Pharmacol 81:432–441
Zandbergen F, Plutzky J (2007) PPARalpha in atherosclerosis and inflammation. Biochim Biophys Acta 1771:972–982
Zanelli U, Caradonna NP, Hallifax D, Turlizzi E, Houston JB (2012) Comparison of cryopreserved HepaRG cells with cryopreserved human hepatocytes for prediction of clearance for 26 drugs. Drug Metab Dispos 40:104–110
Zelcer N, Tontonoz P (2006) Liver X receptors as integrators of metabolic and inflammatory signaling. J Clin Invest 116:607–614
Zeller E, Mock K, Horn M, Colnot S, Schwarz M, Braeuning A (2012) Dual-specificity phosphatases are targets of the Wnt/β-catenin pathway and candidate mediators of β-catenin/Ras signaling interactions. Biol Chem 393(10):1183–1191
Zellmer S, Schmidt-Heck W, Godoy P, Weng H, Meyer C, Lehmann T, Sparna T, Schormann W, Hammad S, Kreutz C, Timmer J, von Weizsacker F, Thurmann PA, Merfort I, Guthke R, Dooley S, Hengstler JG, Gebhardt R (2010) Transcription factors ETF, E2F, and SP-1 are involved in cytokine-independent proliferation of murine hepatocytes. Hepatology 52:2127–236
Zeng H, Liu G, Rea PA, Kruh GD (2000) Transport of amphipathic anions by human multidrug resistance protein 3. Cancer Res 60:4779–4784
Zhang M, Chiang JY (2001) Transcriptional regulation of the human sterol 12alpha-hydroxylase gene (CYP8B1): roles of hepatocyte nuclear factor 4alpha in mediating bile acid repression. J Biol Chem 276:41690–41699
Zhang S, Gelain F, Zhao X (2005) Designer self-assembling peptide nanofiber scaffolds for 3D tissue cell cultures. Semin Cancer Biol 15:413–420
Zhang W, He YJ, Gan Z, Fan L, Li Q, Wang A, Liu ZQ, Deng S, Huang YF, Xu LY, Zhou HH (2007) OATP1B1 polymorphism is a major determinant of serum bilirubin level but not associated with rifampicin-mediated bilirubin elevation. Clin Exp Pharmacol Physiol 34:1240–1244
Zhang H, Davis CD, Sinz MW, Rodrigues AD (2007) Cytochrome P450 reaction-phenotyping: an industrial perspective. Expert Opin Drug Metab Toxicol 3:667–687
Zhang L, Theise N, Chua M, Reid LM (2008) The stem cell niche of human livers: symmetry between development and regeneration. Hepatology 48:1598–1607
Zhang L, Zhang YD, Strong JM, Reynolds KS, Huang SM (2008) A regulatory viewpoint on transporter-based drug interactions. Xenobiotica 38:709–724
Zhang Y, He Y, Bharadwaj S, Hammam N, Carnagey K, Myers R, Atala A, van Dyke M (2009) Tissue-specific extracellular matrix coatings for the promotion of cell proliferation and maintenance of cell phenotype. Biomaterials 30:4021–4028
Zhang Y, Hagedorn CH, Wang L (2011) Role of nuclear receptor SHP in metabolism and cancer. Biochim Biophys Acta 1812:893–908
Zhang Y, Yang Z, Whitby R, Wang L (2011) Regulation of miR-200c by nuclear receptors PPARalpha, LRH-1 and SHP. Biochem Biophys Res Commun 416:135–139
Zhang T, Xu XY, Zhou H, Zhao X, Song M, Zhang TT, Yin H, Li T, Li PT, Cai DY (2012) A pharmacodynamic model of portal hypertension in isolated perfused rat liver. World J Gastroenterol 18:472–478
Zhao J, Geng C, Tao L, Zhang D, Jiang Y, Tang K, Zhu R, Yu H, Zhang W, He F, Li Y, Cao Z (2010) Reconstruction and analysis of human liver-specific metabolic network based on CNHLPP data. J Proteome Res 9:1648–1658
Zhao Y, Xu Y, Zhang B, Wu X, Xu F, Liang W, Du X, Li R (2010) In vivo generation of thick, vascularized hepatic tissue from collagen hydrogel-based hepatic units. Tissue Eng Part C Methods 16:653–659
Zhao P, Vieira Mde L, Grillo JA, Song P, Wu TC, Zheng JH, Arya V, Berglund EG, Atkinson AJ Jr, Sugiyama Y, Pang KS, Reynolds KS, Abernethy DR, Zhang L, Lesko LJ, Huang SM (2012) Evaluation of exposure change of nonrenally eliminated drugs in patients with chronic kidney disease using physiologically based pharmacokinetic modeling and simulation. J Clin Pharmacol 52:91S–108S
Zhong XY, Yu JH, Zhang WG, Wang ZD, Dong Q, Tai S, Cui YF, Li H (2012) MicroRNA-421 functions as an oncogenic miRNA in biliary tract cancer through down-regulating farnesoid X receptor expression. Gene 493:44–51
Zhou C, Tabb MM, Nelson EL, Grun F, Verma S, Sadatrafiei A, Lin M, Mallick S, Forman BM, Thummel KE, Blumberg B (2006) Mutual repression between steroid and xenobiotic receptor and NF-kappaB signaling pathways links xenobiotic metabolism and inflammation. J Clin Invest 116:2280–2289
Zhou Z, Kang X, Jiang Y, Song Z, Feng W, McClain CJ, Kang YJ (2007) Preservation of hepatocyte nuclear factor-4alpha is associated with zinc protection against TNF-alpha hepatotoxicity in mice. Exp Biol Med (Maywood) 232(5):622–628
Zhou Y, Doyen R, Lichtenberger LM (2009) The role of membrane cholesterol in determining bile acid cytotoxicity and cytoprotection of ursodeoxycholic acid. Biochim Biophys Acta 1788:507–13
Zhuge J, Luo Y, Yu YN (2003) Heterologous expression of human cytochrome P450 2E1 in HepG2 cell line. World J Gastroenterol 9:2732–2736
Zidek N, Hellmann J, Kramer PJ, Hewitt PG (2007) Acute hepatotoxicity: a predictive model based on focused illumina microarrays. Toxicol Sci 99:289–302
Zimmermann M, Lampe J, Lange S, Smirnow I, Konigsrainer A, Hann-Von-weyhern C, Fend F, Gregor M, Bitzer M, Lauer UM (2009) Improved reproducibility in preparing precision-cut liver tissue slices. Cytotechnology 61:145–152
Zinchenko YS, Coger RN (2005) Engineering micropatterned surfaces for the coculture of hepatocytes and Kupffer cells. J Biomed Mater Res A 75:242–248
Zinchenko YS, Schrum LW, Clemens M, Coger RN (2006) Hepatocyte and Kupffer cells co-cultured on micropatterned surfaces to optimize hepatocyte function. Tissue Eng 12:751–761
Zollner G, Fickert P, Zenz R, Fuchsbichler A, Stumptner C, Kenner L, Ferenci P, Stauber RE, Krejs GJ, Denk H, Zatloukal K, Trauner M (2001) Hepatobiliary transporter expression in percutaneous liver biopsies of patients with cholestatic liver diseases. Hepatology 33:633–646
Zou W, Beggs KM, Sparkenbaugh EM, Jones AD, Younis HS, Roth RA, Ganey PE (2009) Sulindac metabolism and synergy with tumor necrosis factor-alpha in a drug-inflammation interaction model of idiosyncratic liver injury. J Pharmacol Exp Ther 331:114–121
Acknowledgments
We gratefully acknowledge financial support by the BMBF-VIRTUAL-LIVER network; the BMBF-projects, DEEP, “innovations in drug development”, LUNGSYS I, II, and the PEMIALF-study; the FP6 program projects, Liintop, PREDICTOMICS and carcinoGENOMICS, the FP-7 EU SEURAT-1 projects, NOTOX, DETECTIVE, ESNATS, Body-on-a-Chip and PASSPORT; the BMBF program “Alternatives to animal testing”; the ANR-projects, Sine2Arti and PHYSCANCER; the National Research Foundation of Korea Grant funded by the Korean Government (MEST) (NRF-2011-0009592); the Institut d’encouragement de la Recherche Scientifique et de l’Innovation de Bruxelles; ISRIB, Innoviris (Brustem project); the Belgian Science Policy (BELSPO) project: HEPRO; the Geconcerteerde Onderzoek Acties (GOA project); the Fonds Wetenschappelijk Onderzoek Vlaanderen (FWO) and Research Council VUB; the National Institutes of Health Grants AA12916 and DK070195; the Medical Faculty of the University of Regensburg (ReForM-Program); the German Ministry of Education and Research (BMBF) within the Human Tissue and Cell Research (HTCR) Foundation; the Excellence Initiative of the German Federal and State Governments (GSC-4); Spemann Graduate School of Biology and Medicine (SGBM) and EXC-294, Centre for Biological Signaling Studies (BIOSS) and KSF by the GRK 1104—From Cells to Organs: Molecular Mechanisms of Organogenesis from the Deutsche Forschungsgemeinschaft (DFG) and the Swiss National Science grant 31003A_124652. We thank Tony Rutt for proof reading of the hepatosphere model section, Hans-Joachim Grammel for his figure contribution, Martin Stelzle (Reutlingen, Germany) and Holger Becker (Jena, Germany) for invaluable contributions to the HepaChip project, Julia Schütte (Reutlingen, Germany) for cell culture experiments, and Christoph Höppner (Munich, Germany), as well as Peter Röhnert (Hamburg, Germany) for contributing to the analysis of the HepaChip culture media. Last but certainly not least, we would like to thank Susanne Lindemann and Kathrin Streitbuerger from the Leibniz-Institut für Arbeitsforschung an der TU Dortmund Leibniz Research Centre for Working Environment and Human Factors, IfADo, D-44139 Dortmund, Germany for their hard work on the ordering and formatting of the references.
Conflict of interest
None of the authors have a conflict of interest.
Author information
Authors and Affiliations
Corresponding author
Additional information
Patricio Godoy, Nicola J. Hewitt and Jan G. Hengstler have contributed equally to the planning, implementation and final editing of this manuscript. The authors above are listed in alphabetical order, with the exception of first, second and last authors.
Electronic supplementary material
Below is the link to the electronic supplementary material.
Appendices
Appendix 1: Hepatocyte isolation protocols
An overview of the hepatocyte isolation process is shown in Fig. 51. The procedure can be applied to livers of humans, rats, mice and other species. Here, the isolation and culture of human and rodent hepatocytes are described in detail.
Isolation of human hepatocytes
The following chapter will briefly define the solutions that are necessary for a successful isolation of primary human hepatocytes from liver resections and liver tissue that was unsuitable for transplantation.
2.1 Preparation of media and equipment
2.1.1 Media
To ensure a smooth and successful performance, all necessary solutions and equipment must be sterilized and ready to use before starting the procedure. A detailed description of the components and instructions for the preparation of the perfusion buffers and stop solution are listed below and in Tables 10 and 11. EGTA is added to prevent the coagulation of the residual blood and to deplete extracellular Ca2+. N-acetyl-l-Cyteine can be used to prevent oxidative damage in the cells during the perfusion process (Stéphenne et al. 2007).
-
Perfusion solution I: See Table 10.
-
Perfusion solution II: See Table 11
-
Stop solution: The stop solution (100 ml FCS in 500 ml sterile PBS at 4 °C) is used to stop the enzyme activities (e.g. trypsin, clostripain, neutral proteases) of the remaining collagenase perfusion solution in the tissue in order to prevent over-digestion of the tissue and damage to the cells.
2.1.2 Equipment
-
The isolation procedure is generally performed under sterile conditions; therefore, it is advised to place the whole perfusion system setup under the sterile workbench (Fig. 52).
-
Set the water bath temperature to 39 °C. Keep the temperature at the outflow between 36 and 38 °C in order to maintain an optimal collagenase activity (for details, see section “Pitfalls and limitations in the isolation of primary human hepatocytes”).
-
The sterile equipment includes a forceps, a scalpel, gauze, a glass Petri dish and a buttoned cannula with up to 6 channels (Fig. 52a). Place all equipment on an unwrapped surgical drape sheet.
-
Prepare a container with ice and several 50-ml tubes. The number of tubes depends on the size of the tissue to be isolated. Approximately 10 tubes can be used for a 40-g piece of perfused liver tissue.
-
For the filtration of the cell suspension subsequent to the isolation procedure, a sterile plastic funnel coated with aseptic gauze is used (Fig. 52c).
In order to save time, the complete setup for the perfusion system should be prepared before the arrival of the tissue in the laboratory from the surgical ward. The setup of the perfusion system is depicted in Fig. 52b.
-
Place a bottle containing perfusion solution I into the water bath and fix it with a lead ring to prevent floating.
-
Secure a Buchner funnel with a tripod and place an empty sterile 500-ml bottle underneath for waste collection.
-
Place both ends of a sterile silicone tube in the bottle containing perfusion solution I and let the solution circulate until the hose is completely filled (Fig. 52b). Avoid air bubbles, because they might be harmful to the tissue.
The ideal tissue for hepatocyte isolation weighs between 30 and 100 g and is surrounded on three sides by tissue capsule, ideally from patients younger than 50 years, with a single isolated pathological finding (e.g. single metastasis or liver tumor such as colorectal carcinoma) or trauma (Fig. 53a). Usually, the smaller the resection area, the better is the performance of the perfusion (Fig. 53b).
The resected liver tissue should be transported as fast as possible into a sterile vessel containing cell culture medium or PBS on ice in order to minimize the time of warm ischemia. The isolation procedure starts immediately after the arrival at the laboratory.
2.2 Isolation procedure
During the first perfusion step, the remaining blood is removed and the liver tissue is prepared for the collagenase digestion. Upon arrival of the liver, the tissue is removed from the transport container and placed on a sterile Petri dish followed by a gentle wipe of the remaining blood from the tissue using aseptic gauze. In order to prepare the piece of liver for perfusion I, the buttoned cannulae are placed into several vessels of the resection site and fixed with tissue glue (Braun, Melsungen, Germany). By using the biological architecture of vessels, the whole piece of liver can be perfused with 3–8 cannulae, depending on the size of the tissue. Using too many cannulae can restrict the outflow of the perfusion solution or lead to a long recirculation of the perfusion solution into the tissue. The perfusion process is as follows:
-
Check all cannulae for blockages by pumping perfusion solution through the system.
-
Place cannulae into the largest vessels and fix them with tissue glue (Fig. 54a). Close smaller vessels and bile ducts in the same way. Control the perfusion pressure and adjust the pump speed so that a homogenous perfusion is achieved.
Fig. 55 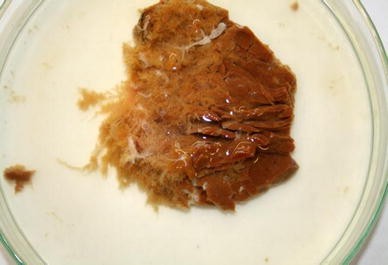
Digested liver tissue: The left side of the tissue shows the typical morphology of digested tissue matrix after harvesting the hepatocytes. The right side, however, has not been sufficiently perfused and therefore the tissue remains intact
-
Transfer the prepared tissue into the Buchner funnel and start perfusion step I. The setup for this perfusion is depicted in Fig. 54b. Use at least 300 ml of perfusion solution I to remove residual blood and warm up the tissue. The end of this perfusion step is indicated by a light-red color of the out-flowing perfusion solution I.
-
Note: To avoid a loss of perfusion pressure, any vessel leakage should be immediately stopped by using additional tissue glue.
-
Prepare the buffer for perfusion step II by adding the necessary amount of Collagenase P for the digestion of the liver tissue to 100 ml perfusion solution II (pre-warmed at 37 °C). Sterile filter the solution into a glass bottle of at least 150 ml and keep the ready-to-use solution warmed at 37 °C in order to avoid any loss of activity (for details, see section “Pitfalls and limitations in the isolation of primary human hepatocytes”).

For the collagenase digestion, the perfusion setup has to be rearranged in order to enable the recirculation of the perfusion solution II, which reduces the necessary amount of Collagenase P and hence reduces the running cost (Fig. 54c):
-
Remove the silicone tube from the cannula tubing and empty it.
-
Transfer the end of the tube from the perfusion solution I into the bottle containing perfusion solution II.
-
Remove the bottle for the collection of waste and the bottle containing perfusion solution I from the water bath and place the bottle with the collagenase buffer (perfusion solution II) underneath the Buchner funnel. Then, re-attach the silicone tube to the buttoned cannula and start the perfusion. Check all adhesive joints for leakages and, if necessary, re-fix the cannula with tissue glue.
-
The termination of perfusion step II is indicated by irreversible deformation of the tissue upon slight pressure. This state should be reached after approximately 10–20 min.
Following the digestion procedure, the cannulae have to be pulled out quickly. The tissue is placed into a Petri dish, and stop solution is immediately poured over the tissue for enzyme inactivation to prevent the over-digestion of the tissue. The release of hepatocytes from the digested tissue matrix is carried out as follows:
-
Use the scalpel to cut the piece of perfused liver into two halves without cutting through the capsule (Fig. 54d).
-
Tweeze the tissue gently and release the cells from the tissue into the surrounding stop solution.
A complete perfusion of liver tissue can nicely be seen in Fig. 55. Only the left side of the liver tissue has been well perfused and shows the typical morphology of digested liver tissue after harvesting the hepatocytes. The perfusion of the right side, however, has not been sufficiently perfused, and therefore, almost no cells could be isolated from this part of the tissue.

Separation of viable and dead hepatocytes by density gradient centrifugation. a A 25 % Percoll solution is carefully overlaid with the suspension containing a maximum of 50 million viable cells. b After the centrifugation, the dead cells and the cell debris are located at the interphase, while viable cells are pelleted
-
Collect the cell suspension with a serological pipette and pass the suspension through the prepared funnel with gauze into ice-cooled 50-ml tubes in order to eliminate tissue debris.
-
Pellet the cells by centrifugation at 50–100×g at 4 °C for 5 min. Note that with cells from steatotic livers, a higher centrifugation speed (up to 100×g) is recommended, since these cells often contain intracellular fat that will hinder their sedimentation at 50×g.
-
Aspirate and discard the supernatant, resuspend the cell pellets in hepatocyte culture medium or PBS and place the suspension on ice.
To assess yield and viability, Trypan blue exclusion can be performed using a Neubauer hemocytometer:
-
Use a 0.5 % solution of Trypan blue; dilute it in a ratio of 1:4 in PBS.
-
Mix 100 μl of the cell suspension with 900 μl of the diluted Trypan blue to obtain a dilution of 1:10. This step can be adjusted according to the amount of isolated cells in suspension.
-
Count viable and dead cells.
-
Calculation:
-
Total cells/ml = counted cells × 104 × 10 (dilution factor)
-
Viability [%] = \( \frac{{{\text{vital}}\,{\text{cells}}}}{{{\text{total}}\,{\text{cells}}}} \times 100 \)
Using the procedure described above, it is possible to obtain a cell viability of over 90 %. However, the viability and quality of hepatocytes can be impaired if there is prolonged ischemia or if the liver was steatotic or fibrotic. If the cell suspension contains lower than 70 % of viable cells, a separation of the dead cells from the viable cells by density gradient centrifugation with Percoll® is highly recommended.
2.3 Cell yield and purification
The quality and quantity of the isolated hepatocytes strongly depends on many factors, including initial liver damage (normal, steatotic, cholestatic or fibrotic tissue), the conditions caused by the liver disease itself, and the pretreatment of the liver by drugs as well as the warm ischemia time upon surgery (Table 11).
As already mentioned, a density gradient centrifugation known as Percoll® can be performed and is carried out as follows:
Prepare several 50-ml Falcon tubes with 20 ml of a 25 % Percoll® solution (15 ml PBS + 5 ml Percoll®). The number of tubes depends on the total cell count, as for the density gradient centrifugation no more than 50 × 106 viable cells in a total volume of 4–5 ml should be added. This concentration allows the best separation between viable and dead cells.
-
Carefully overlay the Percoll® solution with the cell suspension (Fig. 56a).
Fig. 57 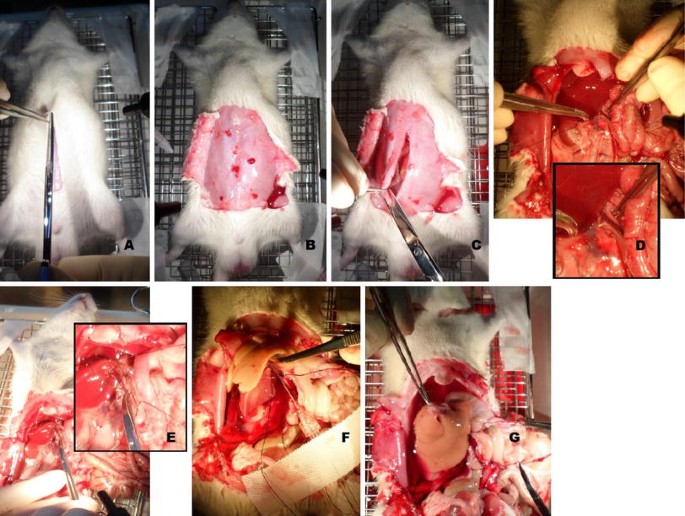
Progressive workflow of rat liver perfusion
-
Centrifuge at 1,200–1,300×g at 4 °C for 15–20 min. NOTE: Turn off the break and use a minimum acceleration in order to improve separation.
-
After centrifugation, two layers can be observed. Dead cells and cell debris are located at the interphase, while viable cells are pelleted (Fig. 56b).
-
Aspirate both layers, starting at the interphase.
-
Resuspend the cell pellets with PBS and fill each one up with PBS to 50 ml mark and centrifuge at 50–100×g at 4 °C for 5 min.
-
Aspirate the supernatant and resuspend all pellets in an appropriate medium for the culture of hepatocytes. Yield and viability of hepatocytes can be reassessed using Trypan blue exclusion.
-
At this point, the cells can be stored on ice for several hours prior to seeding or shipping.

2.4 Seeding and culture of primary human hepatocytes
During the isolation procedure, the plates for culturing the cells should be prepared by coating them with ECM proteins (e.g. collagen) to allow a better attachment. The cells are suspended in hepatocyte culture medium and seeded in multi-well plates, Petri dishes or culture flasks according to the chosen experimental setup. An adequate cell density ensuring the confluence of the cells is 0.1–0.15 × 10⁶ cells per cm², and the number of cells can be seeded according to Table 12. A recommended hepatocyte culture medium is described in Table 13. It should be noted that the composition of the culture medium may be adapted according to the experimental setup. For instance, if certain inflammatory events in liver cells are investigated, it might be useful to withdraw or reduce hydrocortisone from the medium.
2.5 Shipping method
Shipping of hepatocytes using Hepacult cold storage solution can be carried out as follows:
-
Prepare and label sterile cryovials.
-
Resuspend the hepatocytes in cold storage solution with a concentration of approximately 50 million cells per ml.
-
Transfer the cells into cryovials and avoid air bubbles.
-
Close the cap carefully and avoid overflow.
-
Disinfect the cryovials with ethanol and seal them with Parafilm. Pack the vials into a small plastic bag and place the bag into a big styrofoam box filled with ice.
-
Seal the box and arrange with a trustworthy courier service for overnight shipping.
Note If the hepatocytes arrive with a significantly decreased viability, it is possible to perform a second Percoll® density gradient centrifugation upon arrival.
Isolation of primary rat and mouse hepatocytes
The following chapter will briefly define the procedure of hepatocyte isolation from rats and mice.
3.1 Preparation of buffers, media and equipment
3.1.1 General buffers
-
Glucose solution: 9 g/l H2O
-
HEPES, pH8.5: 60 g/l, adjusted with NaOH to pH 8.5
-
HEPES, pH7.6 60 g/l, adjusted with NaOH to pH 7.6
-
Glutamine solution: 7 g/l
-
EGTA solution: 47.5 g/l in H2O
-
Dissolve in a small amount of NaOH and adjust pH7.6 with HCl
-
CaCl2 solution 19 g/l CaCl2.2H2O
-
MgSO4 solution 24.6 g/l MgSO4.7H2O
-
Krebs Henseleit buffer (see Table 14 for preparation of this buffer):
-
Amino acid solution (From PAN Biotech GmbH, Cat. No: SO-33100). Dissolve the following amino acids in a 4M NaOH solution:
0.27 g/l l-alanine; 0.14 g/l l-aspartic acid; 0.4 g/l l-asparagine; 0.27 g/l l-citrulline; 0.14 g/l l-cysteine; 1.0 g/l l-histidine; 1.0 g/l l-glutamic acid; 1.0 g/l l-glycine; 0.40 g/l l-isoleucine; 0.8 g/l l-leucine; 1.30 g/l l-lysine; 0.55 g/l l-methionine; 0.65 g/l l-ornithine; 0.55 g/l l-phenylalanine; 0.55 g/l l-proline; 0.65 g/l l-serine; 1.35 g/l l-threonine; 0.65 g/l l-tryptophan; 0.55 g/l l-tyrosine; 0.80 g/l l-valine. Stir until fully dissolved and then adjust to pH 7.6 by 2N HCl). Store at 4 °C and pre-warm in water bath before use.
3.1.2 Buffers for perfusion
-
EGTA buffer composition for liver perfusion (Table 15)
-
Collagenase buffer composition for liver perfusion (Table 16)
-
Suspension buffer composition for resuspension of primary hepatocytes (Table 17)
3.1.3 Equipment
Technical and laboratory equipment for liver perfusion are listed in Table 18. Further laboratory equipment includes 100 μm filter; beakers; measuring cylinders, flasks; culture dishes (50 mm ∅ for mouse, 100 mm ∅ for rat liver perfusion); sharp and blunt cannula (see below) for anesthesia and for perfusion; 1–3 ml syringes. Note: All further laboratory equipment must be autoclaved before usage or provided as sterile disposable material.
3.2 Animals
Typical breeds of mice and rats are shown in Table 19, together with a description of ideal weight ranges and suppliers. The animals should have free access to water and food (ssniV, Soest, Germany) and should be kept under controlled temperature (18–26 °C), humidity (30–70 %) and light (12-h light/dark circle).
3.3 Setup of the perfusion apparatus
A small plastic cap has to be removed from one end to fix the 3-way stop cock, while the other end is placed into a reservoir of perfusion buffer. Opposite to the tube, the infusion tube extension is connected with the 3-way stop cock. The other end of this tube extension carries a blunt cannula which is inserted into the blood vessel during perfusion. The tube is spirally coiled on the heating element to ensure appropriate warming of the perfusion buffer before entering the liver through the needle. The third conjunction of the 3-way stop cock fixes another connection tubing, a so-called Heidelberger extension. This conjunction enables pressure release in case the pressure in the perfusion system is too high. The system must be rinsed with EGTA perfusion buffer before usage to avoid air bubbles in the tubes that might perturb the perfusion. Finally the flow rate is set to 15 ml/min.
3.4 General procedure for mouse and rat liver
The surgical procedure for the isolation of primary hepatocytes is based on a modified two-step isolation method described by Seglen (1976). This procedure was established by Berry and Friend (1969) and Seglen (1972) and makes it possible to convert nearly the whole liver to a suspension of intact hepatocytes. In the first step, the liver is perfused with an EGTA-containing perfusion buffer. Calcium ions are complexed with EGTA, and the blood is rinsed to wash out blood cells and plasma. The removal of calcium ions is crucial for cell detachment and washing out of Ca2+-dependent adhesion factors. The loss of these adhesion factors causes loosening of cell–cell connections and is a preparative step for the following perfusion with collagenase, which is applied to digest collagen in the ECM and to disperse the liver cells. Because collagenase is a Ca2+-dependent enzyme, Ca2+ has to be added anew to the collagenase perfusion buffer to achieve effective enzymatic activity. This way reproducibility of the yield and viability of the isolated cells are substantially increased. After liver digestion with collagenase buffer, the liver is excised from the tissue. By opening the liver capsule with forceps, the cells can be released into suspension buffer. The following section focuses on the detailed surgical procedure.
3.5 Isolation procedure
Rats and mice are anesthetized with an intraperitoneal injection of a mixture consisting of xylazine (Rompun 2 %, Bayer, Leverkusen, Germany) and ketamine (Ratiopharm, Ulm, Germany). The corresponding amounts of ketamine and xylazine depend on the animals’ body weight and are listed in Table 20. The anesthesia needs to be controlled by checking the lid reflex and pain sensitivity (pedal reflex). Next, the narcotized animal should be fixed in a dorsal position by fixing the limbs. To create an aseptically surrounding the body of the animal is sprayed with 70 % Ethanol. The surgical procedure is as follows:
-
1.
Cut into the suprapubic region of the abdomen: A longitudinal cut from caudal to cranial is performed and the upper abdominal wall is opened without touching the peritoneum. This longitudinal cut is further cranially extended to the axilla, and the abdominal wall is removed carefully from the peritoneum. Two further cuts are made into the abdominal wall, dorsolaterally to the hind legs. This enables an optimal flow off from the perfusion buffers (Fig. 56a, b).
-
2.
The surgical instruments and the uncovered peritoneum are briefly rinsed with PBS. Surgical forceps are used to pull the peritoneum to ventral, and a small cut is made in the suprapubic region. The cut is subsequently extended toward cranial and stopped when reaching the breastbone. With two transverse incisions to the costal arch and to the hind legs, the abdominal cavity is exposed. This way the peritoneum is carefully removed without injuring any organs. The intestines are displaced to the left side of the abdominal cavity (Fig. 57c).
While rat livers are usually perfused via the hepatic portal vein, mouse liver perfusion proceeds through the vena cava inferior. The following steps refer to the vena portae for rat perfusion and to the vena cava for mouse perfusion.
-
3.
A loose ligature is placed around the appropriate blood vessel (vena cava for mouse, vena portae for rat) near the liver: Small forceps are carefully directed underneath the vein, and second forceps are used to pass a piece of suture thread beneath the blood vessel. A loose knot is made but not tightened. In case of rat perfusion, a second ligature is placed at 5–10 mm below the upper one. This second ligature helps to fix the vena portae which facilitates inserting the needle. For mouse perfusion, no second ligature is necessary (Fig. 57d).
A small incision is made diagonally into the vein (vena portae for rat, vena cava for mouse) (Fig. 57e). A blunt needle (B. Braun Sterican 20G × 1 ½, ∅ 0.90 × 40 mm) is inserted at a flat angle into the blood vessel and the liver is perfused with EGTA buffer.
-
4.
If the needle is placed in the right position, the liver will blanch immediately, indicating effective perfusion. The ligature around the needle is fixed by tightening the thread ends. The needle can further be kept in its position by fixing it with a piece of tape (Fig. 57f).
-
5.
To avoid high pressure to the hepatocytes and for pressure release in rats, the jugular veins are cut off. For mouse perfusion, the vena portae is cut immediately. The perfusion with 37 °C warm EGTA buffer should last 10–15 min at a flow rate of 15 ml/min. The other two perfusion buffers are prepared during this perfusion step, e.g. by adding collagenase to the collagenase-containing perfusion buffer and adding BSA to the suspension buffer.
-
6.
The buffer flow has to be stopped before changing to collagenase-containing buffer. Perfusion with collagenase perfusion buffer (37 °C) is continued at a flow rate of 15 ml/min until the liver becomes smooth and soft. Depending on the collagenase activity, this step might last between 10–15 min for rat and 5–10 min for mouse liver perfusion. The digestion state can be tested by cautiously applying pressure with the back of a pair of forceps. The perfusion should be finished when the consistency of the liver changes from elastic to a deformable state.
-
7.
The liver is carefully excised by piercing the diaphragm and fixing the liver with forceps at thoracal liver blood vessels (Fig. 57g). The diaphragm, ligaments and further connections to other organs are carefully severed without injuring other organs. As soon as the liver is excised, it is placed in a Petri dish filled with suspension buffer. Further steps of hepatocyte isolation need to be performed under a sterile hood or lamina flow hood.
-
8.
The liver capsule is opened carefully with forceps, and primary hepatocytes are released into the suspension buffer. In case of optimal digestion, only the encasing connective and vascular tissue (the empty liver capsule) remains.
-
9.
In a next purification step, the cell suspension is filtered through a 100-μm gauze to remove tissue debris. For mouse hepatocytes, the cell suspension is transferred into a single 50-ml falcon tube. For rat hepatocytes, the cell suspension is equally distributed into eight 50-ml falcon tubes and the volume made to 20 ml with suspension buffer.
-
10.
NPCs can be separated from parenchymal hepatocytes by centrifuging the cell suspension at 50×g for 5 min, at 4 °C. NPCs are removed when discarding the supernatant. A second washing and centrifugation step with suspension buffer ensures a greater purity of hepatocytes. For mouse hepatocytes, the obtained cell pellet is resuspended in 10 ml suspension buffer and placed on ice immediately. The cell pellets of rat hepatocytes are resuspended in 3-5 ml suspension buffer and pooled into one 50-ml falcon tube. Healthy and viable hepatocytes will aggregate and form clumps, which should carefully be disaggregated by gently inverting the falcon tube until all cell aggregates are dissolved. Cells need to be kept on ice afterward.
For culture, cell viability and the amount of cells per ml can be determined using Trypan blue exclusion, as described in section "Isolation procedure" of “Appendix 1.”
3.6 Hepatocyte purification with Percoll®
Percoll® reagent (Easycoll Separating Solution, desity 1.124 g/ml, Biochrom AG, Berlin, Germany, Cat. No. L6143) is a useful tool for further purification of the isolated rat or mouse hepatocytes. Polyvinyl pyrrolidone-coated silica gel particles are used to create a density gradient, and isolated cells are hence separated according to their density. For hepatocyte purification, a 48 % Percoll® solution in PBS is optimal. Depending on the required amount of cells, several 50-ml falcon tubes are filled with 25 ml of 48 % Percoll® solution. A volume of 2.5 ml of cell suspension is transferred carefully dropwise “on top” of the Percoll® solution and then centrifuged at 28×g and room temperature for 5 min. The supernatant is discarded, and the cell pellet is resuspended in 25 ml of suspension buffer and centrifuged again at 50×g for 5 min, at 4 °C, to remove the Percoll® solution. All cell pellets are carefully resuspended in 2.5 ml suspension buffer by gently turning the falcon tubes. Finally, all Percoll® purified cells are collected in a single 50-ml falcon tube. Cell count and viability must be determined as described above.
Appendix 2: Primary human hepatocyte collagen sandwich and monolayer protocols
4.1 Equipment
-
Laminar airflow cabinet
-
Incubator (water jacketed, 37 °C, humidified atmosphere of air containing 5 % CO2).
-
Thermostated waterbath (37 °C)
-
Bright field/phase-contrast microscope
-
Pipette-aid, pipettes and micropipettes
-
Polystyrene tubes (50 ml) and desired cell culture plates (6 cm Petri dish, 24-, 12-, or 6-well plate)
-
Cell scrapers
-
Ice box
4.2 Reagents and media
-
Lyophilized rat tail collagen I (Roche Diagnostic Mannheim, 10 mg)
-
0.2 % solution of acetic acid (v/v in distilled H20, sterile filtered)
-
William’s E Medium with additives
-
10× Dulbecco’s modified Eagle medium [BioConcept, 1-25K03-I]
-
1 M solution of NaOH for pH neutralization (sterile filtered)
All media should be pre-warmed to 37 °C prior to use. A basic culture medium is described in Table 21. Complete medium is the basic medium supplemented with 10 % Sera Plus (PAN Biotech, 3701-P103009) and washing medium is William’s E without any supplements.
4.3 Cell suspension preparation
-
All of the steps should be performed under sterile conditions.
-
Cells should be kept on ice before plating.
-
Centrifuge the isolated primary human hepatocytes at 50×g for 2 min at 4 °C.
-
Under a laminar airflow cabinet, gently remove the supernatant and resuspend the cell in 2 ml of complete medium, centrifuge again at 50×g for 2 min, at 4 °C.
-
Under a laminar airflow cabinet, gently remove the supernatant, resuspend the cell in 2 ml of complete medium and transfer the suspension into polystyrene tube (50 ml). Add additional 8 ml of complete medium (resulting in total of 10 ml complete medium).
-
Count the cell number and viability in 4 % Tryptan blue as described in section “Isolation procedure” of “Appendix 1.”
-
Calculate appropriate cell suspension volume for the amount of cells needed per well.
4.4 Collagen Sandwich preparation procedure
-
All of the steps should be performed under sterile conditions.
-
All collagen solution should be constantly kept on ice to prevent the gelation process.
-
Gelled collagen solutions should be used immediately after dissolving and not to be re-used afterward.
-
Under a laminar airflow cabinet, add 9 ml 0.2 % acetic acid to the bottle of lyophilized collagen type I (resulting in final concentration of 1.11 mg/ml) and let it dissolve for at least 3 h in the fridge until no collagen clumps are visible in the solution (dissolving overnight is preferred).
-
Calculate the total amount of collagen gel to be used as a first layer for the experiment according to Table 22.
Table 22 Calculation of the appropriate amount of gelled collagen to be used as a first layer -
In a 50-ml sterile tube, prepare a mix of collagen/1× DMEM by mixing 1 volume of 10× DMEM and 9 volumes of acidic collagen solution. This generates a final collagen solution of 1 mg/ml in 1× DMEM (i.e. if a total of 5 ml of collagen solution is needed, then mix 4.5 ml of acidic collagen solution with 500 μl of 10× DMEM).
-
Neutralize the collagen solution by adding 1 M NaOH (drop-wise) and constantly shake until the initial yellow color turns to fuchsia.
-
Keep the neutralized collagen solution on ice to prevent gelation.
-
Add an appropriate amount of pH-adjusted collagen onto the desired plate format (see Collagen Layer Volume in the Table 23) and distribute it evenly by quick movements of a cell scraper and gently shake the plate up and down and side to side. Avoid air bubbles.
-
Transfer plates with smoothly distributed gelled collagen into a 37 °C incubator for 45 min.
-
Proper collagen gelation can be assessed by tilting the plates. The gel should be firm and the surface even and smooth.
-
After gel polymerization, place plates under the hood for a few minutes to adjust to room temperature.
-
Add gently the appropriate amount of pre-warmed full medium to the side of each well (see Table 23), followed by gentle addition of hepatocytes in suspension (see Table 23).
-
Shake gently the plate side to side (in directions North–South; West–East) until cells are evenly distributed. Transfer plates in the incubator for at least 3 h to allow cell attachment.
-
After attachment, prepare an appropriate amount of 1 mg/ml gelled collagen to be used as a second layer as described for the first layer. (Note: it is recommended to use 0.5 mg/ml gelled collagen for the upper layer when performing immunostaining procedures).
-
Gently aspirate the media from each well. Wash gently 3 times with washing medium and add the appropriate amount of collagen onto the plated cells and gently shake to distribute the collagen solution evenly over the surface.
-
Transfer the completed collagen gel sandwich plates for 45 min in the incubator for collagen gelation.
-
After gel polymerization, add gently an appropriate amount of pre-warmed basic culture medium.
-
Renew the medium every day thereafter with the same volume of basic culture medium.
-
Control the morphology of the cells daily by bright field/phase-contrast microscopy.
4.5 Collagen monolayer protocol
-
All of the steps should be performed under sterile conditions.
-
All collagen solution should be constantly kept on ice to stop gelation process.
-
The stock collagen type I solution of 250 μg/ml can be re-used.
-
Under a laminar airflow cabinet, add 40 ml of 0.2 % acetic acid to the bottle of lyophilized collagen type I (resulting in final concentration of 250 μg/ml), let it dissolve for at least 3 h in the fridge until no collagen clumps are visible in the solution (dissolving overnight is preferred).
-
Place the 250 μg/ml collagen solution on ice in the laminar airflow cabinet.
-
Coat all wells with 250 μg/ml collagen type I stock solution until the well is fully covered and aspirate back to the stock to solution. Allow the plates to dry in the sterile flow hood.
-
Before plating the cells, wash the coated plates twice with 1× PBS.
-
Add gently appropriate amount of pre-warmed complete medium, according to Table 23, followed by gentle addition of freshly isolated hepatocyte suspension (see Confluent Condition column in the table) of freshly isolated hepatocytes suspension.
-
Gently shake the plate side to side until the cells are evenly distributed. Transfer plates in the incubator for at least 3 h to allow cell attachment.
-
After 3 h of attachment gently aspirate the media from each well. Wash gently three times with washing medium and add gently appropriate amount of pre-warmed culture medium to the side of each well.
-
Renew the medium every day thereafter with the same volume of basic medium.
-
Control the morphology of cells daily under bright field/phase-contrast microscope.
Appendix 3: Model-guided experimental strategy—equation of cell motion
To understand the concept of an equation of motion, consider the classical example of Newton’s equation of motion of an object of mass m falling down as a consequence of the attraction by the earth: \( m\underline{a} = \underline{F} \). Here, \( \underline{a} = {\text{d}}\underline{v} /{\text{d}}t \) is the acceleration of the center of mass of the object. The left hand side \( m\underline{a} \) describes the inertia of the object and is called inertia term. The acceleration describes the increment of the velocity v within an arbitrarily short period of time: \( \underline{a} = \frac{{{\mathbf{d}}\underline{v} }}{{{\mathbf{d}}t}} = \mathop {\lim }\limits_{{\Updelta t \to {\mathbf{0}}}} \frac{{\Updelta \underline{v} }}{\Updelta t} \) where \( \Delta \underline{v} = \underline{v} \left( {t + \Delta t} \right) - \underline{v} \left( t \right)\). Knowing the velocity and the current position permits to calculate the new position of the object from \( {\text{d}}\underline{r} /{\text{d}}t = \underline{v} \). Acceleration, force, velocity and position are vectors, have an absolute value and a direction. If the acting force on the object is due to the attraction between the object and the earth, then \( \underline{F} = m\underline{g} \) where \( \underline{g} \) is the earth acceleration.
For hepatocytes in culture, the equation of motion is more complicated. It is assumed that hepatocyte movement results from the superposition of (1) hepatocyte–hepatocyte interactions by friction, as well as adhesion and repulsion between them, (2) hepatocyte-substrate friction, as well as adhesion and repulsion between hepatocytes and substrate and (3) the active movement of the hepatocytes. The active movement includes the hepatocyte micro-motility and possible directed movements of hepatocytes that play an important role in vivo. The repulsive forces emerge mainly from cell deformation (and to a small extend, from compression). Adhesive and repulsive forces are mimicked by elastic and adhesive central forces of the JKR (Johnson-Kendall-Roberts)-type. The JKR force has been shown to successfully mimic adhesion and repulsion of S180 cells on sufficiently short time scales including the hysteresis behavior leading to cell stretch if cohering cells are pulled apart (Chu et al. 2005).
The equation of motion for hepatocyte i reads:
In this equation, \( \underline{v}_{i} (t) \) is the velocity of cell i denotes a hepatocyte. \( \underline{\underline{\varsigma }}_{iX} \) denotes the friction tensor (here a 3 × 3 matrix) describing the friction of hepatocytes i and j (for X = j), or hepatocytes i and the substrate (for X = S). The friction tensor may be decomposed into a perpendicular and a parallel component: \( \underline{\underline{\varsigma }}_{iX} = \gamma_{ \bot } (\underline{u}_{iX} \otimes \underline{u}_{iX} ) + \gamma_{||} (\underline{\underline{I}} - \underline{u}_{iX} \otimes \underline{u}_{iX} ) \). Here, u iX = (r X − r i )/|r X − r i | with r i denoting the position of cell i. “\( \otimes \)” denotes the dyadic product. \( \underline{F}_{iX}^{{}} \) denotes the JKR force between hepatocytes i and j (for X = j) as well as between hepatocyte i and substrate. \( \underline{\underline{I}} \) is the unity matrix (here a 3 × 3 matrix with “1” on the diagonal and “0” on the off-diagonals). \( \gamma_{ \bot } \), \( \gamma_{||} \) are the perpendicular and parallel friction coefficients, respectively. \( \underline{F}_{i}^{{{\text{active}},H}} \) denotes the active movement force. The model neglects internal friction (friction inside the cell that emerges from intracellular reorganization if cells are deformed or compressed) by considering the setting \( \gamma_{ \bot } \) = 0. For hepatocytes in monolayer culture as in Fig. 48, right panel, we assumed for the micro-motility: \( F_{im}^{{{\text{active}},H}} = \sqrt {2D_{m} \gamma_{||}^{2} } \eta {}_{\rm im}(t) \). m denotes the coordinate index: m = x, y, z. The choice of the diffusion constant, D x = D y ; D z = 0 corresponds to an isotropic homogeneous micro-motility in the plane of the monolayer substrate. \( \underline{\eta }_{i} (t) \) denotes a Gaussian-distributed random variable with average\( \left\langle {\underline{\eta }_{i} (t)} \right\rangle = 0 \) and autocorrelation \( \left\langle {\eta_{mi} (t^{\prime } )\eta_{nj} (t)} \right\rangle = \delta (t^{\prime } - t) \) (m, n = x, y, z denote the coordinate direction; i, j are the hepatocyte indices). Here, \( \left\langle {\underline{X} } \right\rangle \) denotes the expectation value obtained by averaging the random variable \( \underline{X} \) over many of its realizations. As each component of \( \underline{\eta }\) is Gaussian distributed, each realization is sampled from a Gaussian distribution. The friction between cells and the substrate is large so that the inertia term, the first term in Eq. (1), can be neglected and be set to zero.
5.1 Metropolis algorithm
Cell orientation changes can be mimicked by an optimization principle using the Metropolis algorithm for the energy change in case of a cell orientation change (Drasdo et al. 2007) or an equation for the angular momentum (Drasdo 2005). Here we used the Metropolis algorithm for convenience as the equations for the angular momentum lead to very complicated equations of motion. In the Metropolis algorithm, a trial step (here: a small rotation) is performed and subsequently it is evaluated whether this step is accepted, or rejected (in which case the step is taken back). The change of total energy of the whole cell configuration is used to evaluate the step. As the orientation change of a hepatocyte only affects the next and maybe next-next neighbors, only those neighbors need to be considered. To calculate the orientation change, within each time interval Δt for each hepatocyte, a rotation trial around three space-fixed axes by angles δβ i with i = 1, 2, 3, δω i є [0, δω max), with δω max < < π/2 was performed, using the algorithm of Barker and Watts (Allen and Tildersley 1987). The energy can be calculated by integration of the equation \( \underline{F}_{ij} = - \frac{{\partial V_{ij} }}{{\partial \underline{r}_{i} }} \) where only the JKR force contributions were considered. The energy difference is then calculated from\( \Updelta V_{ij} (t) = V_{ij} (t + \Updelta t) - V{}_{ij}(t) \), and the probability that a step is accepted is calculated using \( p = \hbox{min} (1,{\text{e}}^{{ - \Updelta V_{ij} /F_{\text{T}} }} ) \) where F T ≈ 10−16 J is a reference energy (comparable to the kbT in fluids or gases were kb is the Boltzmann factor, T the temperature).
Rights and permissions
Open Access This article is distributed under the terms of the Creative Commons Attribution License which permits any use, distribution, and reproduction in any medium, provided the original author(s) and the source are credited.
About this article
Cite this article
Godoy, P., Hewitt, N.J., Albrecht, U. et al. Recent advances in 2D and 3D in vitro systems using primary hepatocytes, alternative hepatocyte sources and non-parenchymal liver cells and their use in investigating mechanisms of hepatotoxicity, cell signaling and ADME. Arch Toxicol 87, 1315–1530 (2013). https://doi.org/10.1007/s00204-013-1078-5
Received:
Accepted:
Published:
Issue Date:
DOI: https://doi.org/10.1007/s00204-013-1078-5