Article Text

Abstract
Paediatric dose cannot be scaled down directly from an adult using weight (eg, mg/kg). This results in a dose too small in infants and children because elimination does not change in direct proportion to weight, and a dose too large in neonates whose drug elimination pathways are immature. The goal of treatment is a desired response (the target effect). An understanding of the concentration–response relationship (pharmacodynamics) can be used to predict the target concentration required to achieve this target effect. Pharmacokinetic knowledge then determines the target dose that will achieve the target concentration. Variability associated with both pharmacokinetics and pharmacodynamics can be reduced by demographic information (covariates), which can be used to help predict the target dose in a specific child. The covariates of size, maturation and organ function are the three principle contributors to pharmacokinetic variability. Children (2 years postnatal age or older) are essentially similar to adults (ie, mature) and differ only in size. Maturation processes are only important in neonates and infants, therefore, this cohort can be viewed as immature children. Paediatric pharmacodynamic studies are fewer than pharmacokinetic studies, but are required to elucidate the target concentration and consequent dose. The lack of pharmacodynamic studies is a serious challenge for rational dosing.
- Pharmacology
- Neonatology
- Obesity
- Therapeutics
- Allometry
Statistics from Altmetric.com
Introduction
The expression ‘take two tablets and see me in the morning’ is commonly associated with the tired general practitioner telephoned late at night. Dosing in adults appears easy because typical doses are determined in clinical trials involving adults. Calculating a suitable dose for children based on an adult dose per kilogram is complicated by two major errors; that of calculation where the position of the decimal point gets confused leading to a 10-fold dose error,1 and failure to recognise that elimination is not linearly related to weight, and that neonates and infants have immature renal and metabolic drug elimination pathways.2
This review attempts to explain why dose changes with age and weight, outline alternative ways of considering weight for drug dosing and suggest strategies to improve dose prediction in children. For the purposes of this discussion, we shall confine the term children to those 2 years of age and older, neonates to those in their first 6 weeks of postnatal life, and infants to that group in between. We propose that children are small adults because physiological and pharmacokinetic features are predictable from adults based only on weight. Predictions for neonates and infants are also based on weight, but age must also be accounted for which is why we propose they should be considered immature children.
The key descriptors of pharmacology
Pharmacology can be explained in terms of pharmacokinetics (PK, what the body does to the drug) and pharmacodynamics (PD, what the drug does to the body). Simple equations are used to describe these processes and to estimate dose. For example, (1)
(1)
 (2)
(2)
Clearance (CL) and volume (V) are the two key pharmacokinetic descriptors (known as parameters). PK is linked to PD (describing effect of the drug) by concentration. A simple equation for effect is: (3)
(3)
The two key parameters for drug effect are the maximum effect (Emax) and the concentration at which half this maximum effect is achieved (C50).
Understanding the predictable differences in these four parameters (CL, V, Emax, C50) is at the heart of rational dosing. Weight, age and pathology have important predictable influences on PK. Pharmacogenetics also have a predictable influence for some drugs with predictable effects on drug elimination.
The goal of treatment is a desired response, known as the target effect. An understanding of the concentration–response relationship can be used to predict the target concentration required to achieve a target effect in a typical child.3 This target concentration could be a peak concentration (eg, gentamicin peak concentration 18 mg/L), a trough concentration (eg, vancomycin 15 mg/L), an average concentration or area under a time-concentration plot (eg, busulphan 0.77 mg/L equivalent to 1125 µmol min over 6 h) or a constant steady-state concentration, such as that used for propofol infusion (eg, 3 mg/L) to maintain anaesthesia. Pharmacokinetic knowledge can be used to predict the dose that will achieve the desired concentration.
The time course of concentration is determined by three processes: input, distribution and elimination (table 1). An understanding of volume of distribution is important for the initial dose of a drug. The aminoglycosides, for example, distribute to the extracellular fluid compartment, which is increased in neonates and dictates greater initial dose than older children. Input (eg, absorption characteristics and bioavailability of oral drugs) may also change with age. However, it is CL that dictates the maintenance dose, and it is here that demographic information has most importance, explaining many of the dose differences associated with age and weight.
Childhood physiological changes influencing pharmacokinetics (PK)
Why the ‘per kg’ method is not the right way to scale for body size differences
It has been known for over 70 years that smaller species are generally more tolerant of drug treatment than larger species leading to the conclusion that doses increase less rapidly than predicted directly from weight.4 Doses and drug CL, expressed per kg of body weight, are larger in children than adults. In humans, prediction of CL from adult CL values using the per kg approach leads to an under-prediction of more than 10% at body weights less than 50 kg (figure 1).5 The per kg dosing method most seriously underestimates CL around ages of 1–3 years which often leads to underdosing. Failure to recognise this incorrect scaling principle has resulted in inadvertent systematic underdosing of HIV-infected children in the UK and Ireland with antiretrovirals.6 We note that because CL is reduced in neonates for developmental reasons (see below for details), use of the per kg approach may not be far from the right answer for this age group, but for the wrong reason.
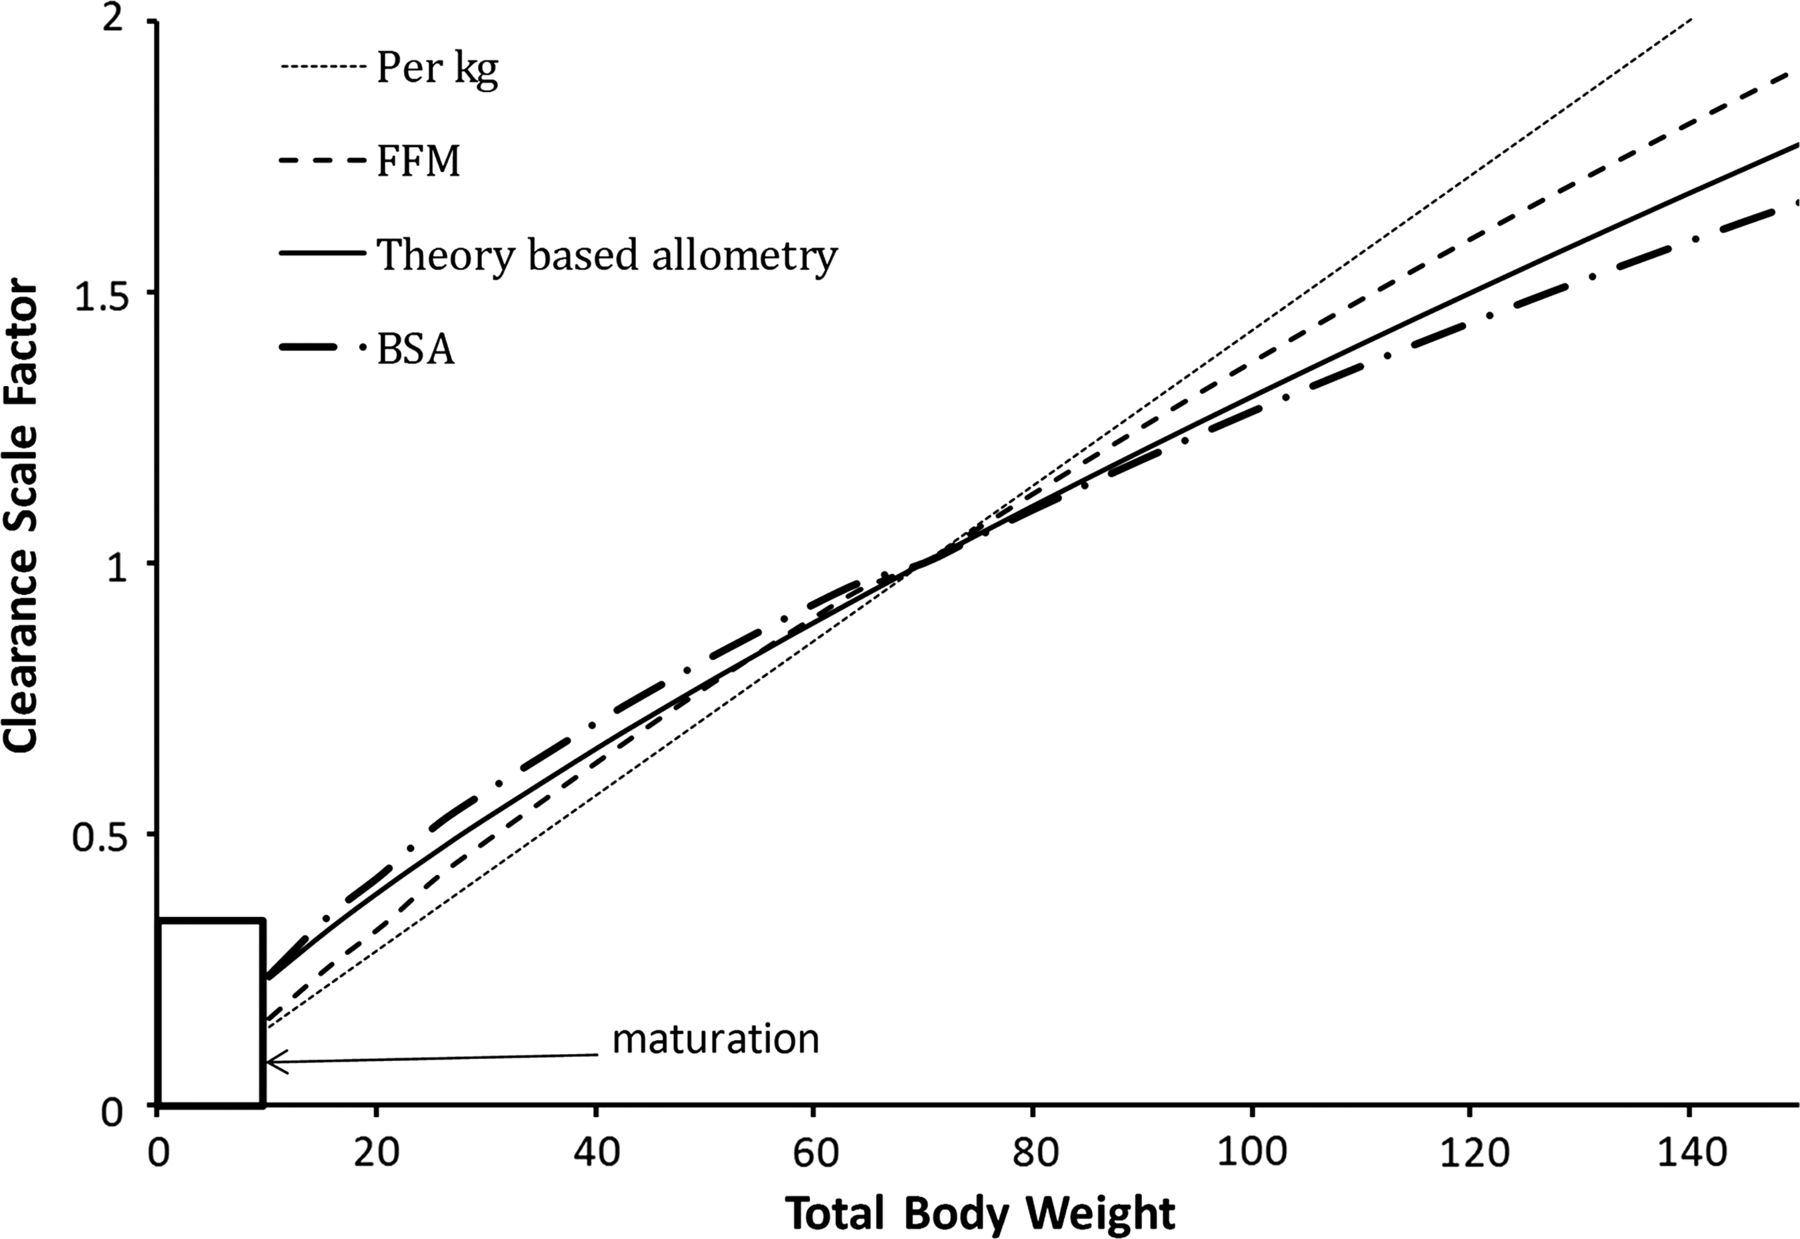
Body size metrics used to describe clearance changes with weight for individuals of average height for weight. The clearance scale factor shows how clearance would differ with weight. A non-linear relationship exists between weight and clearance using theory-based allometry. The per kg method increasingly overestimates clearance in adults and underestimates clearance in children. The body surface area method overestimates clearance in children compared with theory-based allometry. Scaling with fat-free mass lies between the per kg method and theory-based allometry.
Basal metabolic rate (BMR) is increased in neonates and infants compared with adults when expressed per kg. The oxygen consumption of an average neonate is 5–8 mL/kg/min and 3.5–6 mL/kg/min for an infant, whereas that of an adult is 2–3 mL/kg/min.7 These observations are well established, but it is important to try to understand the biological reason behind the higher value per kg. It has been proposed that the reason for increased dose requirement is because liver mass per kg and liver blood flow per kg are increased in children. But this is not an adequate explanation because one must then ask why are liver mass and organ blood flow increased. We must also seek an explanation for why CL per kg is also increased for drugs that are eliminated by pathways other than those found in the liver or kidney, for example, remifentanil, a synthetic opioid cleared by plasma esterase.8
An alternative approach using allometric theory
The observation that metabolic processes increase with weight more slowly as weight increases is common in biology. An allometric equation is often used to describe these body size relations. This equation takes the form: 4where Y is the biological characteristic to be predicted, and a is called the allometric coefficient and b is the allometric exponent. Allometric relations like this have been used to describe size relations in such diverse fields as palaeontology, animal morphology, physiology, ecology and animal behaviour.9
Why body surface area is not the best allometric scale for body size differences
A common, although uncommonly recognised example of an allometric equation, is that for body surface area (BSA). BSA has been widely used to describe this non-linear relationship with size for metabolic processes, for example, glomerular filtration rate (GFR), cardiac ouput and drug metabolism.
Heat production at rest is described by BMR. Sarrus and Rameaux10 put forward the theory that the rate of heat production in animals is in proportion to their BSA. It needs to be understood that BSA is used simply as a surrogate for body size when applied to these other quantities. BSA has the dimensions of area and, thus, ignores the more fundamental quantity of body mass as a driver for metabolism. Renal function, cardiac output and drug elimination are not connected physically with the area of the skin. BSA has, nevertheless, been used to standardise these quantities in order to account for their dependence on body weight. In 1950, BSA was proposed to be a more satisfactory index of drug requirements than body weight or age, particularly during infancy and childhood.11
Quantitative biologists have explored in great detail the relationship between BSA, body weight and BMR. BSA is commonly predicted as a function of both height and weight. Meeh12 proposed a function of weight using a theory-derived allometric exponent of 2/3 (figure 1 and see online supplementary appendix 1): 5
5
The simplicity of the allometric 2/3 surface area law as an explanation proved so attractive that over a century of science was distorted by trying to fit observations to this model.13
In all species studied, including humans, the log of BMR plotted against the log of body weight produces a straight line with an estimated slope close to 3/4. This slope is an estimate of the allometric exponent. This log-linear function has the same slope in homeotherms, poikilotherms and unicellular organisms,14 and extends over a size range of 18 orders of magnitude (body mass 10−15–103 kg). The mass of empirical evidence for the relationship between metabolic rate and weight supports the theoretical scaling exponent of 3/4.14 We acknowledge that the exponent for metabolic rate may be less than 3/4 for very small animals and greater than 3/4 during increased physical activity, but in human PK studied at rest, a value of 3/4 is clearly better than 2/3.14 The use of allometry is not limited to prediction of metabolic rate but is applicable to all functional and structural aspects of biology including pharmacokinetic processes such as elimination and distribution. Prediction of measurements of GFR from very premature neonates to young adults showed BSA was markedly inferior to theory-based allometry with a weight exponent of 3/4.15 It has been demonstrated that cardiac output16 ,17 and oxygen consumption18 (other physiological functions related to BMR) are better scaled with an allometric exponent closer to 3/4 than with BSA. Liver volume has been predicted with an empirical exponent of 0.78 from neonates to adults with no additional influence of age.19 Kidney volume scales with an empirical exponent of 0.8.20 In this respect, the liver and kidneys of neonates and infants reflect they are just small adults. These empirical exponents support the use of theory-based allometry used 3/4 rather than 2/3 to predict the effect of size on hepatic drug metabolism and renal elimination independently from age-related maturation in the first 2 years of life. On the basis of theory and experimental confirmation, we conclude, therefore, that an allometric exponent of 2/3 which is the basis for using BSA to predict doses should be rejected in favour of a value of 3/4.
Why theory-based allometry is a better way to scale for body size differences
West et al18 have proposed a theory that assumes the energy consumption per cell is similar across all sizes of living organisms. The bigger the organism the more metabolically less active structural elements (eg, bone) are required to support the energy delivery system (eg, blood vessels). Therefore, as mass increases, the overall metabolic rate does not increase in direct proportion. Their formal mathematical theory predicts an allometric scaling exponent of 3/4. We refer to the use of the 3/4 exponent as ‘theory-based allometry’ to distinguish it from ‘empirical allometry’ that uses observed data to try to estimate the exponent. We have demonstrated that precise estimation of the exponent for pharmacokinetic parameters is very difficult,2 and empirical allometry fails as a predictor of dose requirements.21
The difference in drug CL between an adult and a child is predictable from weight using theory-based allometry: 6
6
It is of practical importance to report pharmacokinetic parameters in terms of a standard weight.5 The allometric predictions are not changed by the choice of the standard weight,22 and a standard value of 70 kg is the most widely used.23 The combination of theory-based allometry and a standard weight offers a consistent method for description allowing direct comparison between different studies and better understanding of the influence of factors such as age.23
By contrast with a value of 3/4 for functional processes like BMR, GFR and CL, the theory-based allometric exponent is 1 for structural features like blood volume, vital capacity and tidal volume, and this has been confirmed by experiment.24 The volume of distribution of the central compartment (Vc), the volume of distribution by area (Vbeta), and the volume of distribution at steady state (Vdss) also show direct proportionality to body weight and are therefore best described with a theory-based allometric exponent of 1. We assert, therefore, that the biologically based theory and extensive experimental support for the predictions across a diverse range of function means scaling of drug doses with size should be guided by the same science. The use of per kg and BSA methods of dosing should be recognised as ad hoc empiricism which should be replaced by a rational science-based approach.
A size descriptor for the obese child
Size is often described using total body weight (TBW), but adjustment for body composition with fat-free mass (FFM)25 can improve predictions of GFR15 and drug CL.26 The importance of accounting for FFM as well as TBW has been recently confirmed and also shown that empirical estimates of allometric exponents are indistinguishable from theory.27 Thus, the best descriptor of size may not necessarily be TBW. This is exemplified in determining the size descriptor for the obese child.
Although body fat has minimal metabolic activity, fat mass contributes to overall body size and may have an indirect influence on both metabolic and renal CL. On the other hand, the volume of distribution of a drug depends on its physicochemical properties. There are drugs whose apparent volume of distribution may be independent of fat mass (eg, digoxin) or be extensively determined by it (eg, diazepam). A number of size descriptors (figure 1) have been put forward for use in the obese patient, for example, TBW, lean body weight (LBW), ideal body weight, body mass index, FFM, normal fat mass (NFM).28 FFM is similar to LBW but excludes lipids in cell membranes. For all practical purposes these two descriptors are indistinguishable.
These size descriptors invariably demonstrate nonlinear relationships between weight and CL. The best size descriptor accounting for obesity remains unknown.29 LBW is often advocated for use in the obese, but that descriptor may not apply for all drugs. An infusion of propofol is commonly used for paediatric anaesthesia. Infusion rate is dependent on CL and an incorrect estimate of CL may lead to inadequate anaesthesia and awareness. Propofol CL in obese adults30 and non-obese adults and children31 ,32 is best predicted using TBW as the size descriptor with theory-based allometry.
Practical morphine infusion rates taken from figure 4
However, TBW may be inappropriate for remifentanil where LBW appears to be a better size descriptor.33 The use of NFM with allometric scaling as a size descriptor is a more versatile approach.28 In addition to FFM there is an additional parameter, Ffat that characterises the contribution of fat mass (TBW-FFM) to the apparent allometric size of the body (see online supplementary appendix 2). This parameter is drug specific and also specific to the PK parameter, such as CL or volume of distribution. It has a value of 0.211 for GFR which implies that 21% of fat mass is a size driver for kidney function in addition to FFM.15 Size based on NFM assumes that FFM is the primary determinant of size with an extra Ffat factor (which may be positive or negative) that determines how fat mass contributes to size.
Why maturation as well as size must be considered
The use of dosing regimens in neonates that is the same as that for children causes high plasma concentrations that may result in toxicity because CL is immature at birth. Seizures were observed in babies given epidural bupivacaine at rates the same as those in children (mg/kg/h) for analgesia. High systemic bupivacaine concentrations were causative and occurred through failure to appreciate immature CL.34
Allometric scaling is insufficient to describe CL in neonates and infants. Maturation of enzyme systems, a process that begins before birth, is occurring. Enzyme maturation occurs at different rates. Individual hepatic drug metabolising enzymes have been categorised into one of three classes based on developmental trajectories.35 Class 1 enzymes are expressed at their highest levels in the fetus during the first trimester (eg, CYP3A7 that may have a role in retinoic metabolism); enzymes belonging to the second class are expressed at relatively constant levels throughout gestation and into adulthood (eg, sulfotransferase, SULT1A1, responsible for most of paracetamol CL in neonates). The vast majority of enzymes (Class 3, eg, CYP3A4, UGT2B7, see below) are expressed at low levels at birth and mature with time.
Age is used to describe processes which are independent of size. Changes in these processes are not explained by, but are associated with, the passage of time. Postmenstrual age (PMA) is preferred because it accounts for maturation occurring before birth. Maturation can be described in terms of a maturation half time (TM50). 7
7
This is the PMA at which CL is half the size-adjusted adult value. The shape of the maturation curve approaches the adult value. The steepness of maturation is determined by the Hill coefficient. Examples of maturation curves are shown in figure 2. For GFR, the TM50 is 48 weeks which means that renal function is 50% of adult values around 2 months after full-term gestation.
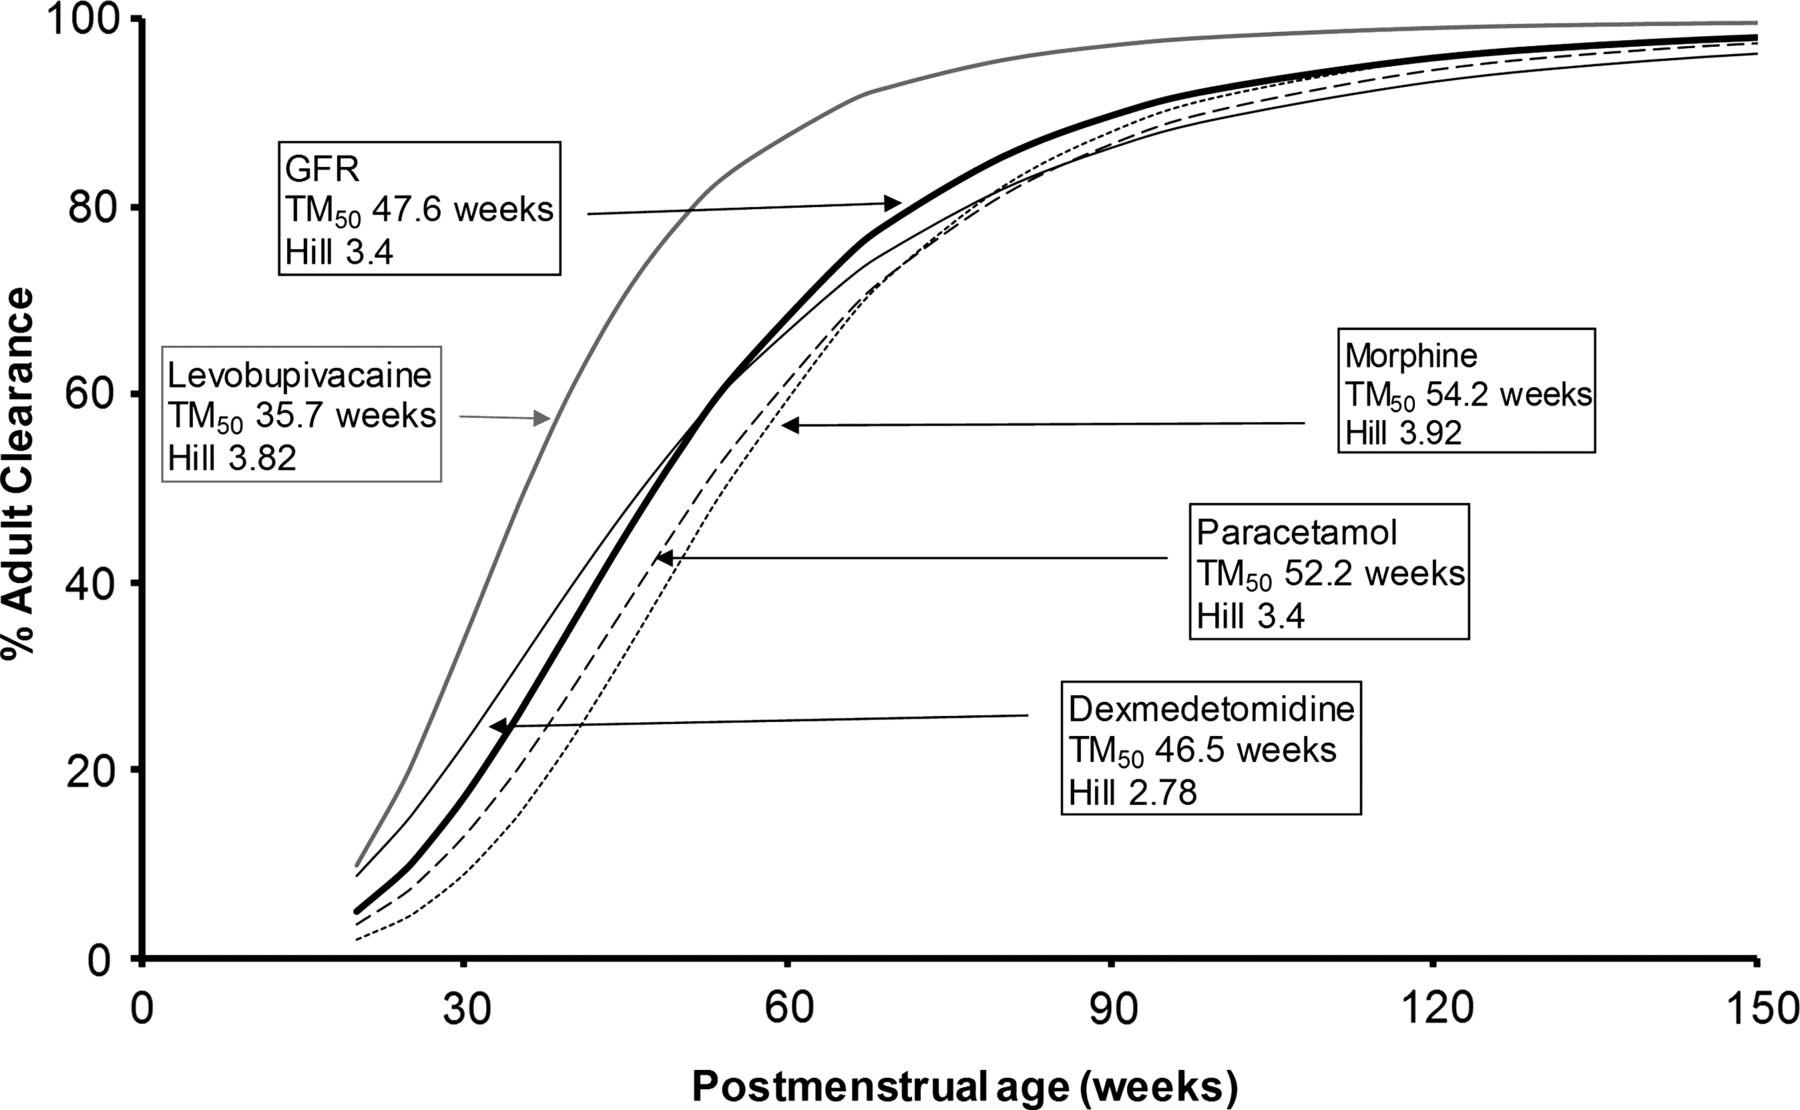
Maturation of glomerular filtration rate and the clearance of many drugs, such as dexmedetomidine, levobupivacaine, acetaminophen (paracetamol) and morphine can be described using postmenstrual age. Hill determines the steepness of the function, and TM50 indicates when 50% of adult values are reached (adapted from West et al,18 with permission).
The time course of maturation of drug metabolism (morphine, paracetamol, dexmedetomidine) and GFR are all similar. These three drugs are all cleared by glucuronide conjugation to water-soluble metabolites that are cleared by the kidney. Levobupivacaine is metabolised by the cytochrome P-450 oxidase system (CYP3A4) and maturation is more rapid.36
The impact of birth on this CL maturation process is probably of less importance. It is recognised that transition from the intrauterine to the extrauterine environment is associated with major changes in blood flow and oxygenation of those organs responsible for drug CL. Birth does have an impact on the rate of increase of GFR maturation, but the increase was only 15% greater than that predicted using size and maturation based on PMA.22
The rates of maturation for the CL of many drugs remain undefined. However, based on many examples,23 CLs are close to size-scaled adult values before the end of infancy (2 years after birth) reflecting the transition to childhood and pharmacokinetic maturity.
Organ function
The majority of drugs are cleared by either the hepatic or renal systems. Organ dysfunction can be hard to evaluate because normal values may not have accounted for size and maturation. Normal GFR may be predicted from PMA and weight.15 Age and size-appropriate estimates can be used to predict the CL of drugs eliminated by the kidneys. Creatinine CL is often used to estimate GFR in children.37 If creatinine CL is less than the normal GFR then a reduction in drug dose should be considered. Hepatic function, the other major organ of elimination, may be compromised by both impaired enzyme activity and liver blood flow. Midazolam CL was noted to be reduced in critically ill children. This was assumed to be due to reduced CYP3A activity,38 although it would be more plausible to consider reduced hepatic blood flow because midazolam is rapidly removed by the liver.
Why are doses per kg higher in young children?
Given this understanding of theory-based allometry and maturation of body function, we can now show how the empirical observation of bigger mg/kg doses in young children (1–3 years) can be explained. Using the typical relationship between age and weight39 we have used allometric theory and maturation to predict morphine CL in neonates, infants and children from the adult value. Morphine dose was calculated from CL and a target concentration of 10 mcg/L (see Equation 2) then dose converted to a per kg value. Both the actual dose prediction and its linear per kg value have been plotted against age (figure 3). It can easily be seen that the maintenance dose per kg has its highest value around the age of 2 years. This is because dose per kg is higher in children based on allometric theory, but it reaches a peak because of the influence of immature elimination at younger ages (and consequently at lower weights). Thus, the empirical observations of higher doses per kg (eg, table 2) in young children are predictable directly from fundamental biological principles. Similar theory predicts why liver size and blood flow are also higher per kg in young children.

Allometric theory predicts why maintenance dose per kg is higher in children. Dose predictions are based on size and maturation typical for morphine with a target concentration of 10 mcg/L. When dose is expressed using a linear function (eg, mg/kg/h), it is highest in the 1–3-year-old age band, decreasing throughout childhood until adult rates are achieved in late adolescence. (Morphine clearance taken from Holford et al21).
Pharmacodynamic maturation
Although pathology may differ in children, it is usually assumed that the concentration-effect relationship is the same as in adults. Children's responses to drugs are not so different to those responses observed in adults once pharmacokinetic differences are considered. On the other hand, neonates and infants may be different from children. Outcome measures on which PD is measured are commonly more difficult to assess in neonates and infants than in children or adults. Neonates and infants may, therefore, have altered PD, but this is difficult to evaluate experimentally. Some examples exist where they appear to have not reached pharmacodynamic maturity (eg, response to bronchodilators, gut prokinetic drugs).40
Practical application of PKPD to dosing
The target concentration strategy is a powerful tool for determining clinical dose.41 Principles of biology and clinical pharmacology can guide dosing in children once targets have been identified.3
The target concentration approach involves four steps to predict the dose required to achieve and maintain a target effect:
-
Choose the target effect
-
Use Emax and C50 to predict the target concentration
-
Use V to predict the loading dose
-
Use CL to predict the maintenance dose rate
Online supplementary appendix 3 demonstrates how equations can be used to determine the maintenance dose rate (equivalent to an infusion rate for drugs given intravenously). The maintenance dose for intermittent dosing can be determined by calculating the daily dose (over 24 h) and fractioning that daily dose dependent on the dosing interval.
These steps calculate the science-based dose, but that prediction may not be usable in clinical practice because of actual tablet sizes and practical dosing intervals. Figure 4 shows the science-based dose of morphine infusion predicted to maintain a target concentration of 10 mcg/L21 for the relief of postoperative pain. The doses are expressed as mcg/kg/h for comparison with clinically practical values commonly used in those different age groups. The figure shows that the highest dose is required around the age of 2 years postnatal age (PNA), as we might expect from increased dose observed in children when expressed per kilogram (figure 3). Once dose changes with size and age as predicted by the science are understood, it is then possible to suggest practical doses for different age groups (figure 4). These scientific principles have also been applied to propose practical intermittent dosing of drugs such as paracetamol.42 The use of maturation and allometric scaling allows estimation of CL at any age; we can then predict doses at any age and weight without having to use rather arbitrary age groups, and do empirical dosing trials in each of the groups.

Age-based infusion dosing for morphine with a target average steady-state concentration of 10 mcg/L in children not receiving positive pressure ventilation, CLSTD=86.4 L/h/70 kg, TM50=58.3 weeks, Hill=3.6. The dotted line is the predictions based on age and typical weight for age. The solid line is the suggested practical infusion rate dose in mcg/kg/h at different postnatal ages. PNA years=(postmenstrual age (PMA) weeks-40)/52. The upper panel shows dose related to postnatal age. The lower panel shows dose related to PMA.
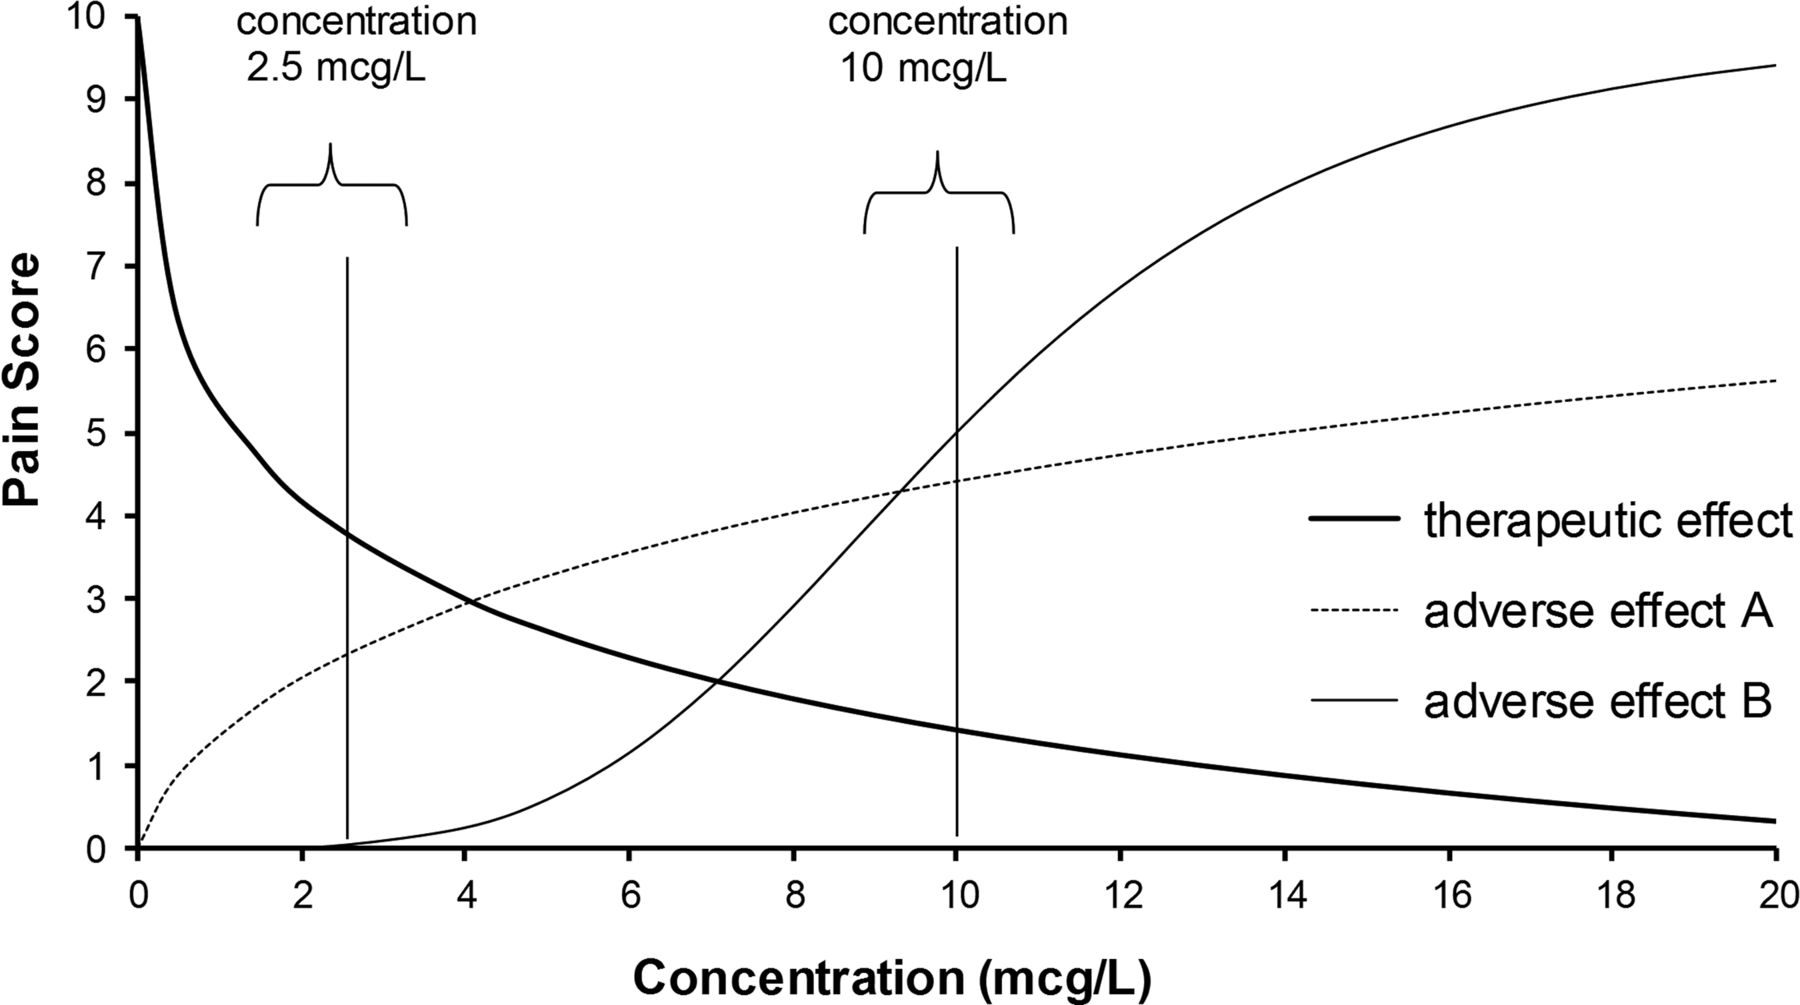
The desired target concentration requires knowledge of both benefit and adverse effect relationships with concentration. Figure 5 shows reduction in pain that might occur with increasing analgesic concentration. Children who are capable of self-administering opioids through an electronic pump (patient-controlled analgesia) may settle for a higher pain score of approximately 4/10 because they suffer less distressing nausea and vomiting than with the lower pain score of 1.5/10 achieved at the higher concentration of 10 mcg/L. On the other hand, if it was important to have the higher effect, and the higher risk of adverse effects was acceptable, then the desired concentration might be 20 mcg/L.

The higher analgesic drug concentration of 10 mcg/L achieves better pain relief with a pain score of 1.5/10, but at the expense of increased adverse effects. The lower concentration of 2.5 mcg/L with a pain score close to 4/10 may be preferred because it is associated with fewer adverse effects.
Our future responsibility to dosing in children; filling the big gaps
The dose of a drug does not dictate a precise response to that drug. The holy grail of clinical pharmacology is prediction of drug PK and PD in the individual patient, and this requires knowledge of the demographics that contribute to variability. Each child is somewhat different, and so there is still unpredictable variability associated with all the parameters used in PK and PD equations. Dose individualisation will come with greater understanding of covariate effects (including pharmacogenomics) and the use of measurement of drug concentrations and subsequent forecasting—the latter (a ‘Bayesian’ approach) has been understood for a long time but is still unfortunately rarely used in clinical practice.
Drug developers have ignored children in the past rendering them ‘therapeutic orphans’. However, regulatory agencies are now encouraging studies in children to develop and use models for PK and PD. Most of these studies concern PK, and despite a great deal of work on that front, there are no well accepted examples of PK in children (over 2 years) not being predictable from adults based on size alone. A lot is now known about PK in neonates, children and adults, but much less about PD.i Thus, the main drug development challenge for dosing in children is to understand if and how their pharmacodynamic behaviour differs from adults. Children (2 years PNA or older) are mature and differ only in size—children are small adults from a PK perspective. Maturation, defined by age, is equally important in infants (less than 2 years PNA) and neonates—infants can be viewed as immature children. There is still knowledge to be gained about pharmacokinetic maturation in neonates and infants.23
The remaining responsibility that we have to children is to link concentrations to clinical outcome. It is these pharmacodynamic studies that are now required. Few paediatric pharmacodynamic studies have been performed that can be directly compared with adults.43 Given the different disease spectrum observed in children and immature physiology particularly in the very young, then the lack of knowledge of Emax and C50 renders the target concentration elusive. It is unacceptable to continue PK studies without the partner PD studies that define effect.
References
Supplementary materials
Supplementary Data
This web only file has been produced by the BMJ Publishing Group from an electronic file supplied by the author(s) and has not been edited for content.
Files in this Data Supplement:
- Data supplement 1 - Online appendices
Footnotes
-
Funding This work is supported by salaries from the University of Auckland.
-
Competing interests None.
-
Provenance and peer review Commissioned; externally peer reviewed.
-
↵i PubMed (3 March 2013) found 2250 references to ‘pharmacokinetic’ and 471 references to ‘pharmacodynamic’ when combined with ‘pediatric’