Article Text

Abstract
Objective To describe birth weight and postnatal weight gain in a contemporaneous population of babies born <32 weeks’ gestation, using routinely captured electronic clinical data.
Design Anonymised longitudinal weight data from 2006 to 2011.
Setting National Health Service neonatal units in England.
Methods Birth weight centiles were constructed using the LMS method, and longitudinal weight gain was summarised as mean growth curves for each week of gestation until discharge, using SITAR (Superimposition by Translation and Rotation) growth curve analysis.
Results Data on 103 194 weights of 5009 babies born from 22–31 weeks’ gestation were received from 40 neonatal units. At birth, girls weighed 6.6% (SE 0.4%) less than boys (p<0.0001). For babies born at 31 weeks’ gestation, weight fell after birth by an average of 258 g, with the nadir on the 8th postnatal day. The rate of weight gain then increased to a maximum of 28.4 g/d or 16.0 g/kg/d after 3 weeks. Conversely for babies of 22 to 28 weeks’ gestation, there was on average no weight loss after birth. At all gestations, babies tended to cross weight centiles downwards for at least 2 weeks.
Conclusions In very preterm infants, mean weight crosses centiles downwards by at least two centile channel widths. Postnatal weight loss is generally absent in those born before 29 weeks, but marked in those born later. Assigning an infant's target centile at birth is potentially harmful as it requires rapid weight gain and should only be done once weight gain has stabilised. The use of electronic data reflects contemporary medical management.
- Growth
- Data Collection
- Neonatology
- Statistics
This is an Open Access article distributed in accordance with the Creative Commons Attribution Non Commercial (CC BY-NC 3.0) license, which permits others to distribute, remix, adapt, build upon this work non-commercially, and license their derivative works on different terms, provided the original work is properly cited and the use is non-commercial. See: http://creativecommons.org/licenses/by-nc/3.0/
Statistics from Altmetric.com
What is already known on this topic
-
Weight in very preterm babies shows downward centile crossing after birth
-
The ideal pattern of postnatal growth for preterm babies, that which results in optimal long-term health, is unknown
-
Existing preterm weight centile charts based on birth weight fail to describe longitudinal weight gain adequately
What this study adds
-
The median birth weight of preterm babies born 2006–2011 approximates to that of preterm babies born in the 1980s
-
Babies born at 29 weeks’ gestation or later take 2 weeks to stop downward centile crossing, and those born earlier take longer, suggesting that immediate postnatal nutritional support may be inadequate
-
It is feasible to use routinely captured electronic data to quantify longitudinal weight gain reflecting contemporaneous management in a large population of preterm babies
Introduction
Growth monitoring is a cardinal precept of paediatric practice. Weight gain in infancy and childhood is usually monitored against centile charts that provide a visual depiction of progress and are based on anthropometry from a large population sample. Centile charts in use in the UK were superseded in 2009 with the launch of the new UK-WHO 0–4 years growth charts,1 a synthesis of birth data from the British 1990 reference, reanalysed for the purpose2 and the WHO growth standard charts from age 2 weeks to 4 years.3
For preterm infants, centile charts have conventionally been based on cross-sectional birth weight data of babies born at different gestational ages such as the British 1990 reference.4 ,5 The ‘UK-WHO Neonatal and Infant Close Monitoring Chart’ or ‘NICM’ chart6 is intended for babies born from 23 weeks’ gestation. Charts have also incorporated longitudinal weights of infants born preterm. Their limitations include historic data, small numbers of infants and poor obstetric dating. For example, one of the most widely used longitudinal growth charts for preterm infants, from Ehrenkranz et al7 of the US National Institute of Child Health and Development, is based on data from 1660 infants born in the mid-1990s, with inclusions based on birth weights between 501 and 1500 g rather than gestational age.
In recent years, neonatal units in the UK have adopted an electronic patient record that provides the facility to record longitudinal measures of growth.8 We utilised this opportunity to collect longitudinal data from a contemporaneous cohort of preterm babies born at less than 32 weeks’ gestation and construct descriptive birth weight centiles by gestational age, and longitudinal growth curves by postmenstrual age. Our aim was to illustrate the range of growth performance seen with current medical management and provide a benchmark against which to examine the growth of individual infants in relation to other babies born at the same gestational age, and a baseline for future examination of temporal trends in the pattern of weight gain after preterm birth.
Methods
Subjects
The eligible population comprised infants born <32 weeks’ gestation admitted to UK neonatal units using a neonatal.net electronic newborn record.
Electronic data
Anonymised data covering neonatal unit admissions from 2006 to 2011 comprising gestational age, postnatal age, sex and longitudinal weight measurements from birth to discharge were released to the Neonatal Data Analysis Unit by Clevermed, the NHS hosting company for the neonatal.net records.
Data management
The data were first examined for outliers, overall and in individual growth curves. Individual growth curves with at least three measurements were cleaned by looking at the weight data in successive triplets of measurements, comparing the three growth rates of the weights taken in pairs within each triplet. Aberrant growth rates allowed different patterns of outliers to be identified and excluded. Gross errors in curves with fewer than three measurements were identified from overall plots. Weights for growth curve analysis were truncated at an upper postmenstrual age limit that depended on the week of gestation at birth, and weights at older ages were excluded. The upper age limits were set to ensure that around 10% of the infants at each week of gestation were still in hospital up to that age, to ensure good coverage. All babies were included in the analysis until death, transfer to a neonatal unit not contributing data to the study, discharge or this upper age limit, whichever came soonest. The data on babies subsequently dying were retained to ensure that the data were unbiased (since such babies cannot be identified in advance).
Statistical analysis
Birth weight centiles were constructed using the LMS method9 and implemented using GAMLSS10 in the software programming language R.11 In brief, this summarises the skew distribution of birth weight as a function of gestational age in terms of the Box-Cox power needed to transform the data to normality (λ or L), the median (μ or M) and the coefficient of variation (σ or S). A gender effect was fitted as a constant proportion across all gestations, using a log link. A sex by gestation interaction was tested for. The longitudinal data were analysed using SITAR (Superimposition by Translation and Rotation) growth curve analysis.12 This is a shape-invariant growth model whereby all individuals are assumed to have the same underlying shape of growth curve, but with three subject-specific parameters termed size, tempo and velocity which transform the individual growth curves to closely match the average growth curve. The size parameter for each infant shifts the fitted curve up/down, the tempo parameter shifts it left/right and the velocity parameter stretches/shrinks the underlying age scale to make the curve steeper/shallower. The model fits the average growth curve as a regression spline with 3 degrees of freedom, and the subject-specific parameters size, tempo and velocity are estimated as random effects. The model was fitted with the nlme package13 in R.11 SITAR models were fitted for the sexes combined (as the growth patterns were similar), but separately for babies born at 22–23 weeks (combined due to small numbers) and at each successive completed week to 31 weeks’ gestation. Weight gain was expressed in absolute (g/d) and in relative terms (g/kg/d), the latter by dividing absolute weight gain by mean weight. In practice, this was achieved by analysing gain in loge weight and multiplying by 1000, which is equivalent. Age was specified in weeks of gestation at birth, and in postmenstrual weeks after birth, calculated as weeks of gestation plus weeks of postnatal age.
Regulatory approvals
The study was approved by the UCL Institute of Child Health/Great Ormond Street Hospital National Research Ethics Committee (07/H0713/111) and the Research & Development Offices of all participating hospitals.
Results
Birth centiles
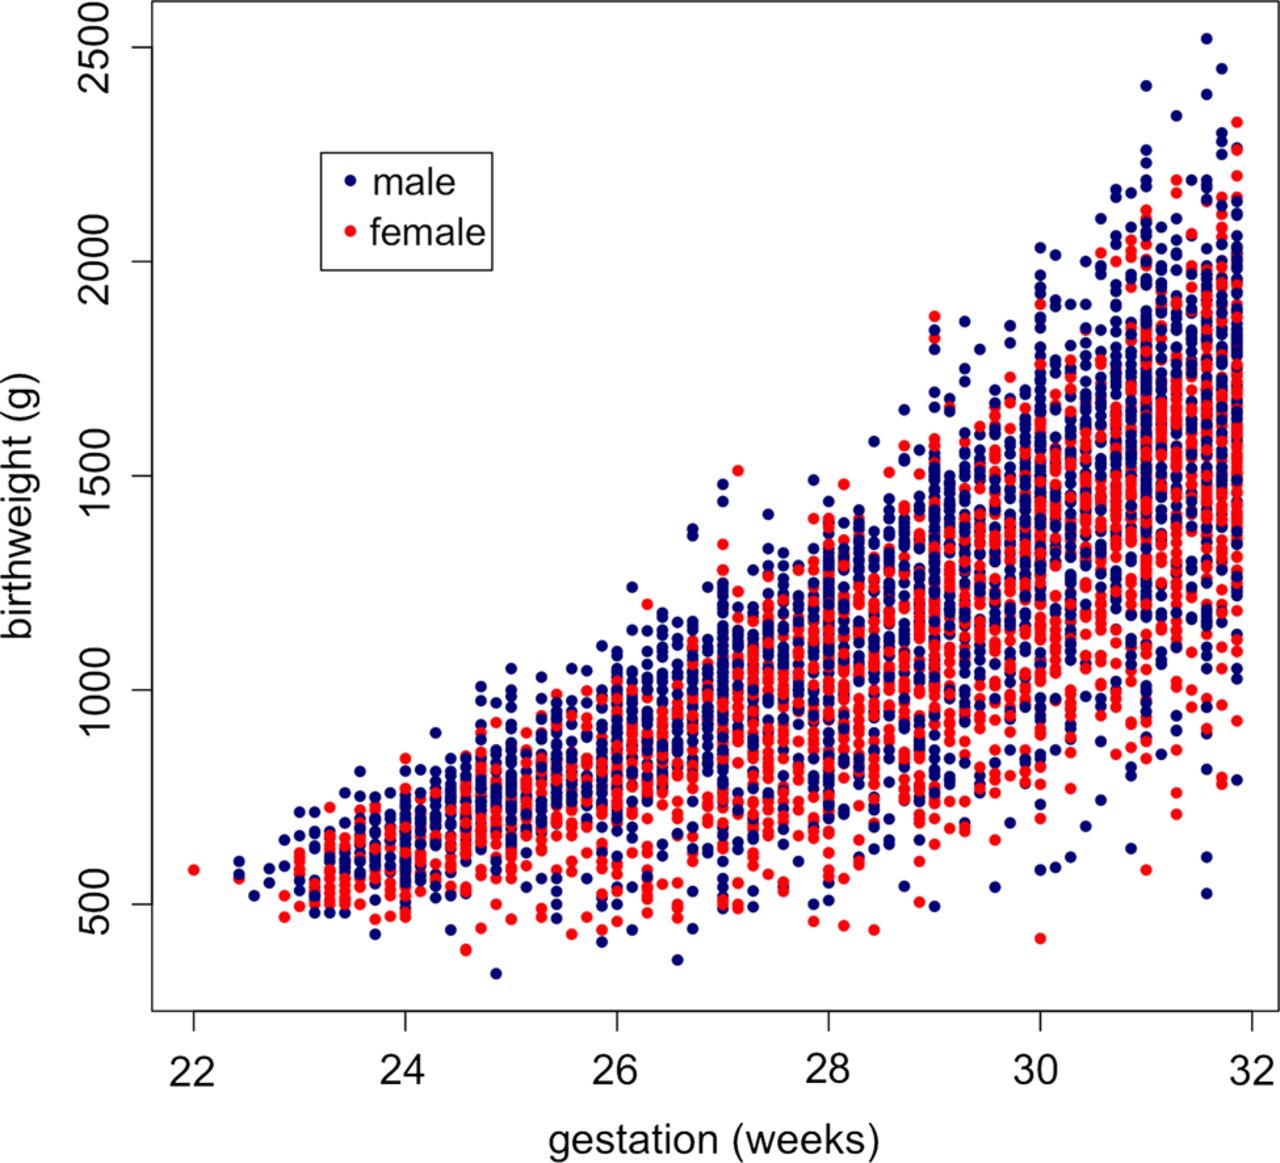
Data were received from 40 neonatal units, comprising 5009 birth weights of babies born from 22 to 31 weeks’ gestation (2679 boys and 2330 girls) (table 1). Birth weights by sex are shown plotted against gestational age in figure 1. The fitted centiles for boys and girls are shown in figure 2. The nine centiles are spaced two-thirds of an SD apart,14 ranging from the 0.4th to the 99.6th centile. On average, the girls weighed 6.6% (SE 0.4%) less than the boys (p<0.0001), with no evidence of a sex by gestation interaction (p>0.9). For comparison, figure 2 also includes the 0.4th, 50th and 99.6th centiles for the two sexes averaged based on the reanalysed British 1990 reference5 as used in the NICM Chart. The two references agree reasonably well for the median, while the NICM 99.6th centile is consistently slightly higher and the two 0.4th centiles are quite different in shape.
Birth weight frequency by sex and completed week of gestation

Birth weight by gestation in 2679 boys and 2330 girls.

Centiles of birth weight by gestation and sex, with the British 1990 0.4th, 50th and 99.6th centiles superimposed (sexes averaged).
Longitudinal growth curves
The original data set included 5025 infants and 109 503 weights. After excluding records with missing or outlying weights, and ages beyond the gestation-specific cut-offs, the longitudinal growth curve analysis data set consisted of 4973 infants and 103 194 weights (table 2). Figure 3A shows growth curves for the 1012 babies born at 31 weeks’ gestation, with a range of birth weights from 500 to 2500 g. The growth curves extend from 31 to 38 weeks postmenstrual age, beyond which they are truncated. Figure 3B shows the same growth curves after SITAR adjustment, where each baby's growth curve has been transformed to make it as similar in shape to the mean curve as possible; the mean curve is shown in white in figure 3A and B. The SITAR adjustment explains 97% of the variance in weight, shrinking the residual SD from 304 (for a curve fitted to the data of figure 3A) to 51 g (for a curve fitted to the data of figure 3B). The plot includes several infants who were measured in the first week and then not measured again for several weeks, whose curves of long straight lines in figure 3B misleadingly appear to fit poorly. There are also a few sharp spikes corresponding to errors in the weight measurements. The shape of the mean curve indicates that weight falls after birth by an average of 258 g, reaching a nadir on the 8th postnatal day. The rate of weight gain then increases to a maximum of 28.4 g/d or 16.0 g/kg/d, both after 3 postnatal weeks.
Number of subjects and measurements in the longitudinal growth curve analysis, by completed week of gestation
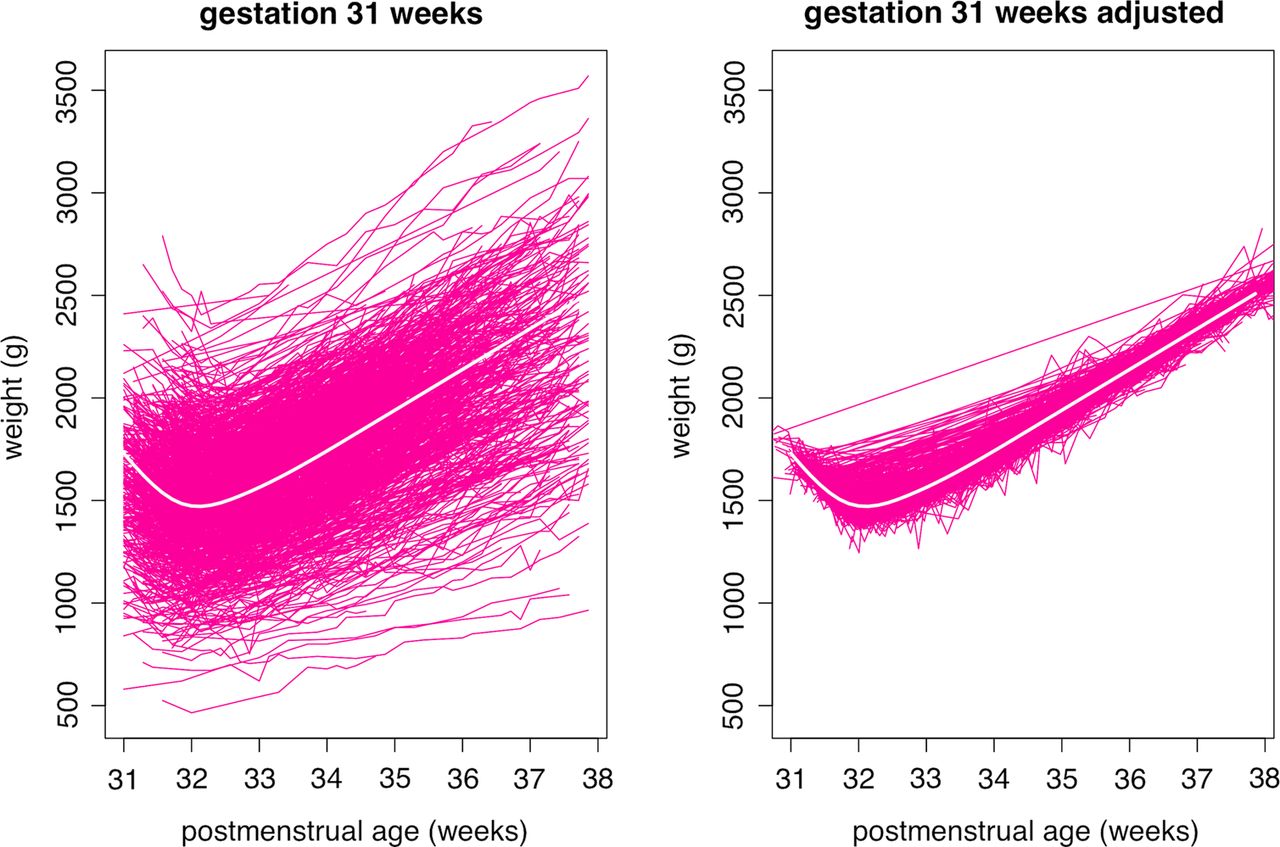
Growth curves of weight by postmenstrual age in 1012 infants born at 31 weeks’ gestation. The curves are shown (left) unadjusted and (right) adjusted using each infant's SITAR (Superimposition by Translation and Rotation) random effects. See text for details.
Figure 4 shows the corresponding growth curves for the 176 babies born at 22–23 weeks, where the curves are truncated at 46 postmenstrual weeks. Here 92% of the variance is explained, the residual shrinking from 293 to 85 g on SITAR adjustment. Unlike at 31 weeks, the mean curve for 22–23 weeks shows no sign of weight loss after birth, the lowest weight gain being 4.7 g/d at 14 days or 7.3 g/kg/d at 16 days. The maximum mean weight gain is 23.9 g/d after 15 postnatal weeks, or 15.6 g/kg/d after 9 postnatal weeks.

Growth curves of weight by postmenstrual age in 176 infants born at 22–23 weeks’ gestation. The curves are shown (left) unadjusted and (right) adjusted using each infant's SITAR (Superimposition by Translation and Rotation) random effects. See text for details.
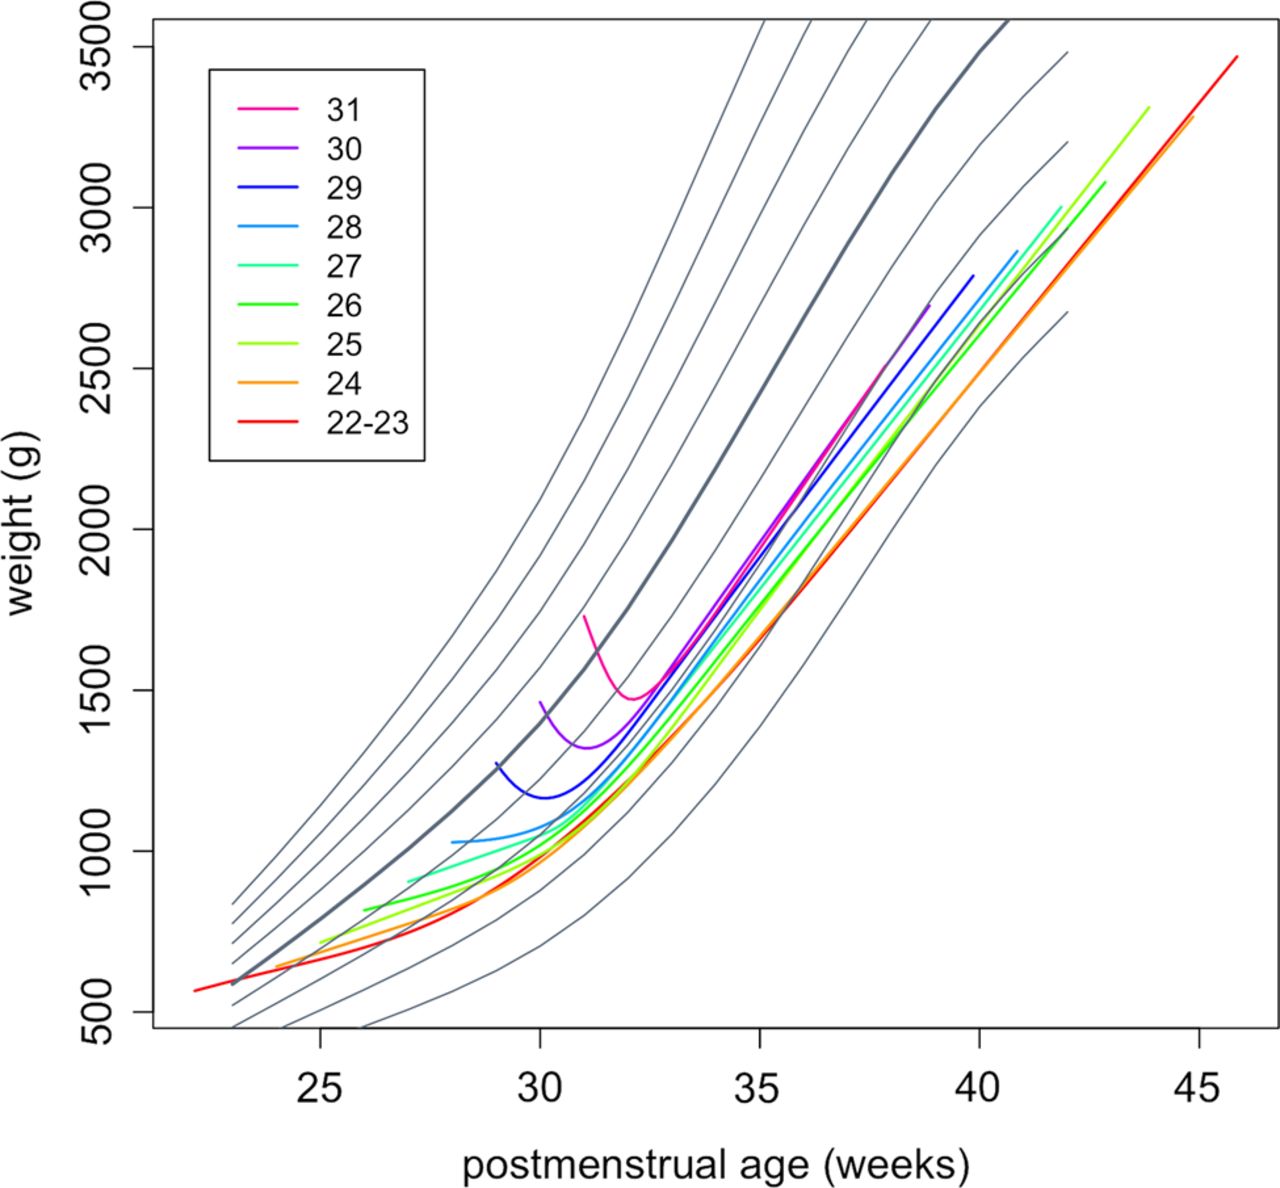
Figure 5 shows the mean fitted growth curves for each week of gestation from 22–23 weeks to 31 weeks, along with the NICM birth weight centiles. The shapes of the curves for 24–28 weeks match that for 22–23 weeks, with no weight loss after birth. Conversely, the curves for 29 and 30 weeks both show clear evidence of postnatal weight loss, similar to 31 weeks, with losses of 109 and 143 g, respectively, at 7–8 days. Despite the apparent absence of postnatal weight loss for babies born before 29 weeks’ gestation, the rate of weight gain is less than that corresponding to the birth weight centiles, so that the mean curves cross centiles downwards until at least 31 postmenstrual weeks. For babies born at 29 weeks’ gestation or later, who lose weight for 8 days on average, it takes 2 postnatal weeks on average to stop downward centile crossing. Thus, from 32 postmenstrual weeks, the mean growth curves for gestations earlier than 30 weeks track roughly along the low birth weight centiles. The tracking centiles and the growth rates are lower for the earlier gestations, so that the growth curves by gestation splay out after 31 postmenstrual weeks.

Mean growth curves of weight by postmenstrual age and week of gestation, superimposed on the British 1990 birth weight reference.
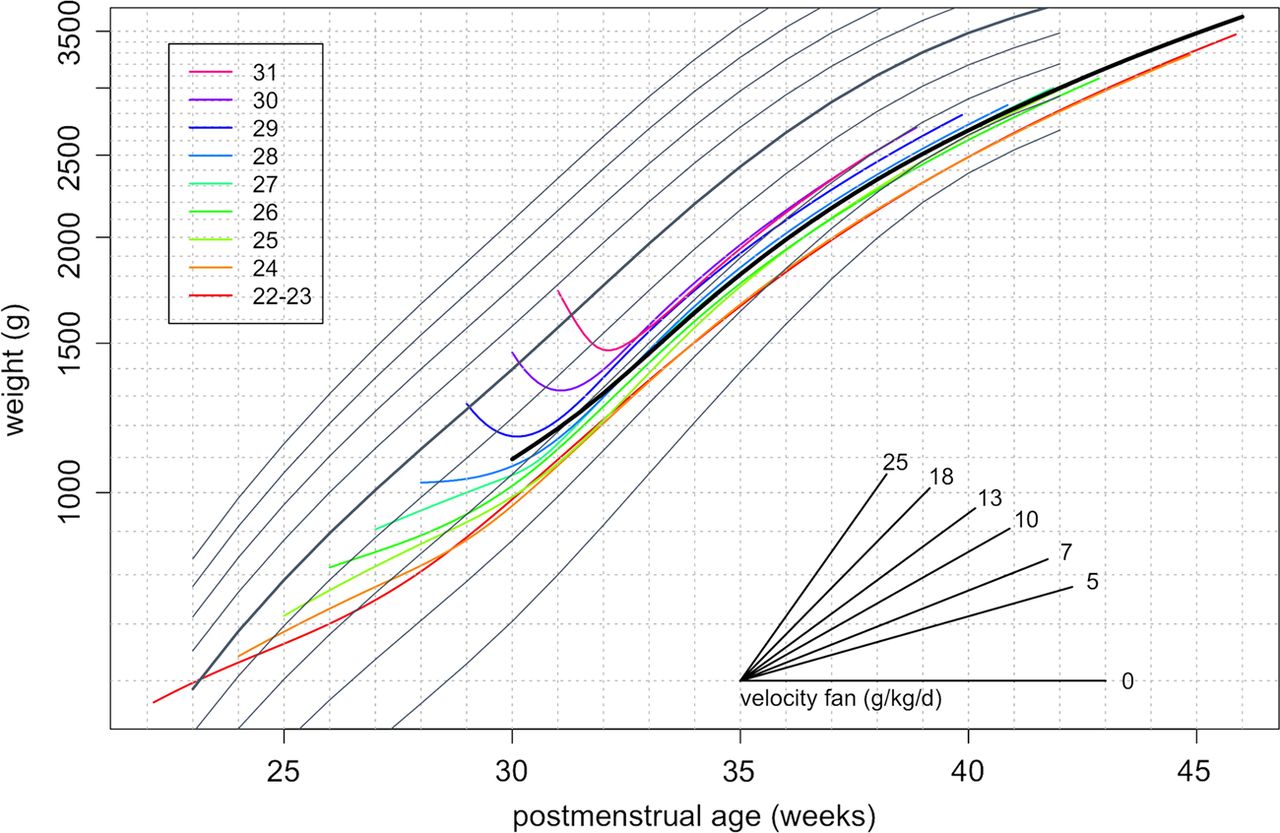
The complex pattern of weight gain following preterm birth shown in figure 5 is hard to represent on a growth chart as the patterns are gestation specific. One way to make the growth curves more consistent by gestation is to express weight gain in units of g/kg/d rather than g/d, as this tends to equalise the mean weight gain. This can be achieved by plotting weight on a logarithmic scale, as shown in figure 6. On conventional plots like figure 5, the slope of each growth curve corresponds to the growth rate in units of g/d. But in figure 6, the plot has the property that the slope of the growth curve corresponds to the weight gain in g/kg/d. From 31 postmenstrual weeks, the growth curves by gestation are broadly parallel to each other and concentrated between the 0.4th and 9th NICM centiles. A solid curve in black is superimposed to reflect the average pattern of growth across the gestations. To help convert the slopes of individual growth curves to weight gain in g/kg/d, the plot includes a ‘velocity fan’ which can be used to assess the growth rate visually. The slopes of the different lines in the fan correspond to different rates of weight gain in g/kg/d, and any growth curve with the same slope corresponds to that growth rate. So by eye, the weight gain of the heavy line peaks at about 16 g/kg/d at 32 weeks and falls to about 8 g/kg/d at 42 weeks.
Mean growth curves of weight by postmenstrual age and week of gestation, superimposed on the British 1990 birth weight reference. Weight is plotted on a log scale, so the slope of each curve indicates relative growth and the velocity fan gives the slopes in g/kg/d.
Discussion
Employing data captured in the course of clinical care, we describe the pattern of postnatal growth in a large population cohort of very preterm infants that is representative of contemporaneous medical management in UK neonatal units. We show that birth weight centiles correspond broadly to those on the NICM chart and that following initial weight loss in the more mature infants, steady weight gain is achieved after 2–3 weeks of age when mean weight tracks along a centile between the 0.4th and 9th NICM centile. We included data on all available infants; hence, the longitudinal weight pattern reflects variation in the patterns of nutritional support, extracellular water loss and illness severity experienced by preterm neonates.
Weight gain within a prespecified range is meant to provide reassurance that an infant is healthy, but for those born preterm this is problematic, as the most healthy growth pattern, leading to optimal long-term health outcomes, is unknown. With a large population study such as this, we consider it reasonable to assume that somewhere within the range of growth shown for each gestational age group lies such a pattern. The challenge for neonatal medicine is to identify what that pattern is.
There are two separate considerations, weight at birth and postnatal weight gain. For weight at birth, preterm delivery is the end result of a compromised pregnancy, so it is unsurprising that an infant born preterm usually weighs less than a fetus of the same gestational age in utero, indicating that some degree of deceleration in intrauterine growth has occurred. At 25–26 weeks’ gestation, newborn infants are typically 50–100 g lighter than the reference fetus, this difference rising to 200–300 g at 30–31 weeks.15 In terms of postnatal growth, preterm infants are often unwell and the delivery of enteral and parenteral nutrition is difficult, resulting in a slow rate of postnatal weight gain and further divergence from centiles based on birth weights. Thus, by 40 weeks postmenstrual age, the weight of babies born before 32 weeks’ gestation is on average more than one SD (one and a half centile channels on the chart) below the mean for term-born babies.16 This understates our own observation of mean steady state growth more than two channel widths below the NICM median (figures 5 and 6). Currently used growth charts are constructed on the premise that by 40 weeks postmenstrual age, an infant born preterm should attain the weight of a term-born infant. As preterm infants are likely to have suffered intrauterine and postnatal weight faltering, growth charts depicting this trajectory are based on the assumption that catch-up in weight over the short period to full term leads to optimal health outcomes. Yet there is no evidence to suggest that this degree of catch-up following growth restriction represents the optimum pattern for preterm infants, and much to suggest that it may be harmful.
There are sound reasons to be concerned about the potential long-term health cost of accelerated weight gain. There is compelling evidence that it increases the risks of adverse metabolic and cardiovascular outcomes. Abdominal adiposity, obesity, insulin resistance, type 2 diabetes, dyslipidaemia, hypertension and coronary artery disease have all been reported. Infants born extremely preterm may be a group at particular risk. By term, these infants have increased abdominal adiposity,17 in childhood, reduced insulin sensitivity,18 and when studied in young adult life, abdominal adiposity, higher blood pressure, increased hepatic lipid19 and reduced arterial distensibility,20 though whether this is a consequence of accelerated growth remains uncertain.21 Possibly, the most powerful arguments against rapid postnatal weight gain come from animal studies of low birth weight spanning five decades, which demonstrate that postnatal dietary interventions to slow growth increase longevity and protect against the risks posed by a high carbohydrate, high fat diet in later life.22–24
Against this, it should be acknowledged that rapid early weight gain in preterm infants is associated with improved developmental outcome in infancy.25 ,26 Thus, there may be a complex trade-off to be made between avoiding adverse metabolic outcomes, through slower weight gain, and optimising mental development, by increasing gain. However, it should be noted that to date no other experimental study evaluating ‘aggressive’ nutritional regimens designed to achieve more rapid growth in preterm infants has led to improved neurodevelopmental outcome. Whether the relationship between more rapid weight gain and improved neurodevelopment is causal thus remains unanswered. It is also plausible that non-nutritional factors may play a part in the adverse neurodevelopmental outcomes associated with growth impairment.
Recommended nutritional intakes for preterm babies have traditionally been calculated from the nutrient accretion rate of the so-called reference fetus, to which is added nutrition necessary to redress the cumulative shortfall acquired by preterm infants during the early postnatal period.27 This poses a conundrum: should clinicians target nutritional support for preterm infants to achieve the weight of term-born infants by term (higher velocity) in keeping with the pattern depicted on current growth charts, or should the target be convergence with term-born trajectories at a later stage (lower velocity)? Despite slow weight gain, the overwhelming majority of preterm infants today rapidly catch up in relation to head circumference,28 and in height as well as weight over a longer period, regardless of the nature of early nutritional support.29 The UK-WHO growth standard indicates that by 1 year of age, term-born, breast-fed infants are 500 g lighter than the weight depicted in the UK 1990 growth reference. A key question for neonatal care is therefore whether preterm infants would also be better served by a slower postnatal weight velocity, and separately whether the emphasis of clinical management should be on optimising early nutritional support, bearing in mind that that weight change is a poor reflection of nutritional support in the immediate postnatal period, given the normal physiological loss of extracellular fluid that occurs at this time.30 It is certainly the case that many clinicians are reluctant to start parenteral nutrition and minimal enteral feeds on day one. A more prompt delivery of parenteral and enteral nutrition would undoubtedly help minimise postnatal catabolism and loss of body solids regardless of the difficulties of monitoring.
Knowing that very preterm babies follow a growth pattern quite different from that portrayed on the NICM (and other) weight charts, how might the charts be modified to make them more useful? figure 6 illustrates one possibility, where weight is plotted on a g/kg scale chart and this leads to longitudinal growth patterns that are broadly independent of gestational age. A simpler alternative would be to add a shaded region to the NICM chart, starting at 30 weeks and extending from the 0.4th to the 9th centile, representing the region where most growth curves will be centred once steady state is reached.
Our study has some limitations. One is that measurements obtained in the course of clinical care may not be as reliable as those conducted to a research standard. Thus, for example, we cannot be certain whether the lack of weight loss in the more immature infants reflects measurement error, or the delayed loss of extracellular water secondary to illness severity.30 Also, detailed nutritional and fluid data were not available so it is not possible to explore the extent to which local management may have affected weight loss.
In addition, even though the fitted growth curves represent the mean growth pattern for babies born at each week of gestation, the individual variation around the fitted curves is substantial, as can be seen in figures 3 and 4. Some of the babies died, and others were transferred elsewhere, and this will have biased the mean curve shape to some extent. But the overall effect is likely to be minor, given the large sample size and the long time period, particularly for the most preterm babies.
The study also has several strengths. The large sample size and the wide range of neonatal units providing data mean that the findings broadly reflect how contemporaneous preterm babies are growing, which in turn reflects current clinical practice. The application of the SITAR growth curve analysis has highlighted the complex average growth pattern, varying as it does by gestation. In particular, the SITAR analysis aims to superimpose individual growth curves by shifting them up-down and left-right, and this latter adjustment allows the individual patterns of postnatal weight loss to be synchronised—in this way the postnatal dip becomes clearer. Previous simpler methods of growth curve analysis have been less successful in modelling this portion of the mean growth curve.
The data we present should not in any way be construed as a ‘standard’, depicting an optimal pattern of third trimester postnatal growth. We propose instead that the utility of our data lies in the following points. We recommend that clinicians do not assign the infant's target centile at birth, that is, based on birth weight. Instead it should be assigned based on weight at 2–3 weeks, once weight gain has steadied. Currently, babies born at 29 weeks’ gestation or later take 2 weeks to stop downward centile crossing, while those of 22–24 weeks take at least 3 weeks. Improved immediate nutritional support, coupled with reduced illness severity brought about by other improvements in care, might shorten this period. The use of electronic data offers opportunity for frequent re-evaluation of postnatal weight gain in large populations of preterm babies. In the absence of randomised controlled trials targeting different patterns of postnatal weight gain, this theoretically provides a means to determine the rate of weight gain associated with optimal long-term health.
Acknowledgments
We are grateful to Tam Fry (Child Growth Foundation), Dr Areli Guttierez-Mendoza and Ms Louisa Lee who provided training in anthropometric measurements for neonatal unit staff, to Richard Colquhoun and Louisa Lee for administrative support and to Clevermed for data extraction and transfer.
References
Footnotes
-
Collaborators Neonatal Data Analysis Unit Steering Board: Jane Abbott, Professor Peter Brocklehurst, Professor Kate Costeloe, Professor Liz Draper, Maria Howard, Jacquie Kemp, Professor Azeem Majeed, Professor Neena Modi and Professor Andrew Wilkinson. Preterm Growth Investigator Group: Dr Oliver Rackham, Arrowe Park Hospital; Dr Simon Roth/Dr Tim Wickham, Barnet Hospital; Dr Ravi Manikonda, Basingstoke & North Hampshire Hospital; Dr Anthony Lipscomb, Broomfield Hospital; Dr Simon Roth/Dr Tim Wickham, Chase Farm Hospital; Dr Sabita Uthaya, Chelsea & Westminster Hospital; Dr John Chang, Croydon University Hospital; Dr Swee Fang, Homerton Hospital; Dr Vibert Noble, King’s Mill Hospital; Dr Meera Lama, Lancashire Women and Newborn Centre; Dr Thirumurugan, Leighton Hospital; Dr Ben (NJ) Shaw, Liverpool Women's Hospital; Dr Anusha Arasu, Luton & Dunstable Hospital; Dr Ignatius Losa, Macclesfield District General Hospital; Dr R Mann, Musgrove Park Hospital (Taunton & Somerset); Dr Vimala Gopinathan, Newham General Hospital; Dr Paul Clarke, Norfolk & Norwich University Hospital; Dr John Dorling, Nottingham City Hospital; Dr Shaun Walters, Princess Royal University Hospital, Orpington; Dr Tim Scorrer, Queen Alexandra Hospital, Portsmouth; Dr Anne Dale, Queen Elizabeth Hospital, Gateshead; Dr Vimal Vasu, Queen Elizabeth the Queen Mother Hospital (Margate); Dr John Dorling, Queen’s Medical Centre (Nottingham University Hospital); Dr Amanda Ogilvy-Stuart, Rosie Maternity Hospital, Addenbrookes Hospital; Dr John McIntyre, Royal Derby Hospital; Dr Vaughan Lewis, Royal Devon & Exeter Hospital (Heavitree); Dr Steve Jones, Royal United Hospital, Bath; Dr Tracy Lawson, St Peter’s Hospital, Ashford & St Peter’s Hospitals NHS Trust; Dr Carrie Heal, Stepping Hill Hospital; Dr Anne Opute, The Royal London Hospital; Dr Angela Huertas-Ceballos, University College Hospital; Dr Roy Stevens, Victoria Hospital, Blackpool; Dr Delyth Webb, Warrington Hospital; Dr Chaniyil Ramesh, Watford General Hospital; Dr Ros Jones, Wexham Park Hospital; Dr John Ho, Whipps Cross University Hospital; Dr R Garr, Whiston Hospital; Dr Raoul Blumberg, Whittington Hospital; Dr Vimal Vasu, William Harvey Hospital; Dr Anil Garg, Worthing Hospital.
-
Contributors The study was conceived by NM, the data were obtained by YS and SS and the analysis was carried out by TJC assisted by HP. The first draft of the paper was written by TJC, and all authors commented on it and approved the final version prior to submission.
-
Funding We gratefully acknowledge study funding from the Child Growth Foundation. TJC is funded by Medical Research Council research grant MR/J004839/1. YS and SS are funded by the National Institute for Health Research (NIHR) under its Programme Grants for Applied Research (Reference RP-PG-0707-10010), “Medicines for Neonates”, held by NM. The study sponsor was Imperial College London. Neither funders nor sponsor had any involvement in study design, analysis or in the decision to submit this paper for publication. The views expressed are those of the authors and not necessarily those of the MRC, NHS, NIHR or Department of Health.
-
Competing interests None.
-
Provenance and peer review Not commissioned; externally peer reviewed.
Linked Articles
- Fantoms