


Abstract
(S)-Warfarin 7-hydroxylation and midazolam 1′-hydroxylation are among the preferred probe substrate reactions for CYP2C9 and CYP3A4/5, respectively. The impact of solvents on enzyme activity, kinetic parameters, and predicted in vivo hepatic clearance (ClH) associated with each reaction has not been evaluated. The effects of increasing concentrations [0.1–2% (v/v)] of six organic solvents (acetonitrile, methanol, ethanol, dimethyl sulfoxide, acetone, isopropanol) were first tested on each reaction using human liver microsomes (HLMs), human intestinal microsomes (midazolam 1′-hydroxylation only), and recombinant enzymes. Across enzyme sources, relative to water, acetonitrile and methanol had the least inhibitory effect on (S)-warfarin 7-hydroxylation (0–58 and 9–96%, respectively); acetonitrile, methanol, and ethanol had the least inhibitory effect on midazolam 1′-hydroxylation (0–29, 0–22, and 0–20%, respectively). Using HLMs, both acetonitrile and methanol (0.1–2%) decreased the Vmax (32–60 and 24–65%, respectively) whereas methanol (2%) increased the Km (100%) of (S)-warfarin-hydroxylation. (S)-Warfarin ClH was underpredicted by 21–65% (acetonitrile) and 13–84% (methanol). Acetonitrile, methanol, and ethanol had minimal to modest impact on both the kinetics of midazolam 1′-hydroxylation (10–24%) and predicted midazolam ClH (2–20%). In conclusion, either acetonitrile or methanol at ≤0.1% is recommended as the primary organic solvent for the (S)-warfarin 7-hydroxylation reaction; acetonitrile is preferred if higher solvent concentrations are required. Acetonitrile, methanol, and ethanol at ≤2% are recommended as primary organic solvents for the midazolam 1′-hydroxylation reaction. This information should facilitate optimization of experimental conditions and improve the interpretation and accuracy of in vitro-in vivo predictions involving these two preferred cytochrome P450 probe substrate reactions.
Introduction
Organic solvents often are required to solubilize xenobiotics for the purpose of characterizing metabolic pathways and evaluating drug interaction liabilities in vitro. It has been recognized since at least the late 1960s that an organic solvent can modulate enzymatic activity. A study published in 1980 evaluated the effects of nine water-miscible organic solvents on different mixed-function oxidase activities, including benzo[a]pyrene hydroxylation, 7-ethyoxycoumarin O-deethylation, aminopyrine N-demethylation, p-nitroanisole O-demethylation, and aniline hydroxylation (Kawalek and Andrews, 1980). Different solvents had different effects on a given reaction. Several of the substrates used are now known to be metabolized by one or more cytochrome P450 (P450) enzymes. In the late 1990s, the effects of different solvents on probe substrate reactions for a number of drug-metabolizing P450s were examined (Draper et al., 1997; Chauret et al., 1998; Hickman et al., 1998; Busby et al., 1999; Tang et al., 2000). Scientists at the U.S. Food and Drug Administration subsequently compiled information from these latter reports to recommend assay conditions for in vitro drug interaction studies, in which any solvent causing ≤20% inhibition was considered acceptable (Yuan et al., 2002). The recommendations highlighted a critical lack of information regarding solvent effects on (S)-warfarin 7-hydroxylation and midazolam 1′-hydroxylation, preferred probe reactions for CYP2C9 and CYP3A4/5, respectively. After a decade, insufficient information remains regarding selection of an organic solvent that will least confound interpretation of in vitro P450 inhibition studies involving either of these reactions.
Increasing reports have substantiated earlier observations that the inhibitory effect of a xenobiotic on enzymatic activity can vary with substrate. One report comparing the effects of 34 pharmaceutical agents on the metabolism of 10 CYP3A4/5 substrates demonstrated that the substrates could be clustered into three distinct subgroups (Kenworthy et al., 1999). Midazolam, testosterone, and nifedipine were considered representative substrates of such subgroups and have been postulated to bind to different domains within the enzyme active site, at least for CYP3A4 (Kenworthy et al., 1999; Schrag and Wienkers, 2001). Likewise, CYP2C9 substrates have been shown to cluster into three distinct subgroups, one of which was represented by diclofenac, tolbutamide, and phenytoin; the remaining two subgroups were represented by (S)-warfarin and (S)-flurbiprofen (Kumar et al., 2006a). Taken together, more than one probe substrate may be required to evaluate fully the inhibitory potential of a given xenobiotic on the activity of either enzyme. The recommendation of using more than one probe substrate for CYP2C9 and CYP3A4/5 underscores further the importance of filling the knowledge gap regarding solvent effects on the aforementioned (S)-warfarin and midazolam hydroxylation reactions.
The goal of the current work was to provide a comprehensive evaluation of the effects of organic solvents on CYP2C9-mediated (S)-warfarin 7-hydroxylation and CYP3A4/5-mediated midazolam 1′-hydroxylation. The first objective was to test the inhibitory potential of six commonly used solvents (acetonitrile, methanol, ethanol, DMSO, acetone, isopropanol) on each reaction using human intestinal and/or liver microsomes and recombinant P450 enzymes. The second objective was to examine the effects of the least inhibitory solvents on the kinetics of each reaction [(S)-warfarin 7-hydroxylation: acetonitrile, methanol; midazolam 1′-hydroxylation: acetonitrile, methanol, ethanol] using human liver microsomes (HLMs). The third objective was to assess the impact of the least inhibitory solvents on the predicted in vivo hepatic plasma clearance (ClH) of each substrate. This rigorous approach provided critical information for optimizing experimental conditions and for improving the interpretation and accuracy of in vitro-in vivo predictions involving (S)-warfarin and midazolam as probe substrates.
Materials and Methods
Chemicals and Reagents.
(S)-Warfarin; 7-hydroxywarfarin; midazolam; 1′-hydroxymidazolam; alprazolam; and baculovirus-insect cell-expressed CYP2C9*1, CYP2C9*2, CYP2C9*3, CYP3A4, and CYP3A5 (supplemented with cDNA-expressed reductase but not cytochrome b5) were purchased from BD Biosciences (San Jose, CA). HLMs (pooled from 50 donors, mixed gender) were purchased from XenoTech, LLC (Lenexa, KS). Human intestinal microsomes (HIMs) were prepared previously from mucosal scrapings from the jejunal portion of a donor small intestine representing average CYP3A4/5 protein expression and activity (midazolam 1′-hydroxylation) (Paine et al., 2006). Methanol (liquid chromatography/mass spectrometry grade) and acetonitrile, acetone, and isopropanol (high-performance liquid chromatography grade) were purchased from Thermo Fisher Scientific (Waltham, MA). Ethanol (190 proof) was purchased from Decon Labs (King of Prussia, PA). DMSO (spectrophotometric grade) was purchased from Acros Organics (Fairlawn, NJ). Chlorowarfarin, ketoconazole, sulfaphenazole, and NADPH were purchased from Sigma-Aldrich (St. Louis, MO). All other chemicals were analytical grade or higher.
Incubation Conditions.
Initial testing.
Incubation mixtures consisted of microsomes or recombinant enzyme, substrate, test solvent or water (control), and potassium phosphate buffer (100 mM, pH 7.4). Although CYP2C9 and CYP3A4/5 are expressed appreciably in both the human intestine and liver (Paine et al., 2006), intestinal CYP2C9 has not yet been shown to have a significant impact on drug disposition in vivo. As such, solvent effects on (S)-warfarin 7-hydroxylation in HIMs were not examined. Each solvent was diluted in buffer to yield working concentrations of 0.4, 4, or 8% (v/v). (S)-Warfarin, midazolam, sulfaphenazole, and ketoconazole were dissolved in methanol to yield a working concentration of 10 mM, 8 mM, 1 mM, and 200 μM, respectively. NADPH was prepared fresh in buffer to yield a working concentration of 4 mM. Incubation mixtures were prepared in 96-well plates and equilibrated at 37°C in a solid heat block for 5 min before initiating reactions with NADPH (1 mM final concentration), yielding a final volume of 200 μl. (S)-Warfarin 7-hydroxylation reaction mixtures consisted of HLMs (0.1 mg/ml) or rCYP2C9 (12.5 pmol/ml), (S)-warfarin (4 μM), test solvent (0.1, 1, or 2%), and buffer. After 30 min (HLMs, CYP2C9*1, CYP2C9*2) or 60 min (CYP2C9*3), reactions were terminated with 200 μl of cold methanol containing the internal standard, chlorowarfarin (3.3 nM). Midazolam 1′-hydroxylation reaction mixtures consisted of HLMs (0.05 mg/ml), HIMs (0.1 mg/ml), or rCYP3A4/5 (10 pmol/ml); midazolam (4 μM); test solvent (0.1, 1, or 2%); and buffer supplemented with magnesium chloride (3.3 mM). After 2 min (HLMs) or 4 min (HIMs, rCYP3A4/5), reactions were terminated with 200 μl of cold acetonitrile containing the internal standard, alprazolam (65 nM). As a positive control for CYP2C9 and CYP3A4/5 inhibition, mixtures contained sulfaphenazole (1 μM) or ketoconazole (1 μM), respectively, in place of test solvent. Control mixtures contained water in place of test solvent. After centrifugation (1350g for 10 min at 4°C), the supernatant (8 μl) was analyzed by high-performance liquid chromatography/tandem mass spectrometry as described previously for 7-hydroxywarfarin (Brantley et al., 2010; Ngo et al., 2010) or 1′-hydroxymidazolam (Wang et al., 2007; Ngo et al., 2009). The amount of 7-hydroxywarfarin or 1′-hydroxymidazolam formed in all enzyme sources was linear with respect to both incubation time and protein concentration (Wang et al., 2007; Ngo et al., 2009; Brantley et al., 2010), the latter of which was optimized to mitigate nonspecific binding concerns (data not shown).
Determination of enzyme kinetics.
The effects of selected solvents on (S)-warfarin 7- and midazolam 1′-hydroxylation kinetics were evaluated using HLMs. Incubation conditions were identical to those described for initial testing except that a range of substrate concentrations was used (1–15 and 0.63–10 μM for (S)-warfarin and midazolam, respectively).
Data Analysis.
Initial estimates of apparent enzyme kinetic parameters, Km and Vmax, were obtained from Eadie-Hofstee plots (velocity versus velocity/[substrate]). Final estimates were obtained by fitting the Michaelis-Menten (eq. 1) or Hill (eq. 2) equation to [substrate] versus velocity data using WinNonlin (version 5.2.1; Pharsight, Mountain View, CA):

 where v represents velocity of metabolite formation, S represents nominal substrate concentration, S50 represents substrate concentration corresponding to 50% of Vmax, and n represents the Hill coefficient. Goodness of fit was assessed from visual inspection of the observed versus predicted data, randomness of the residuals, Akaike information criteria, and S.E.s of the parameter estimates.
Hepatic microsomal intrinsic clearance (Clint) was calculated as the ratio of Vmax to Km. The analogous term for substrates described by the Hill equation, maximum clearance (Clmax) (Houston and Galetin, 2008), was calculated as follows:

Clint or Clmax was scaled to whole-liver intrinsic clearance (Clint,liver) or whole-liver maximum intrinsic clearance (Clmax,liver) using scaling factors of 45 mg of microsomal protein/g liver and 20 g of liver/kg body weight (Obach et al., 1997). Predicted in vivo hepatic plasma clearance (ClH) was calculated using the well-stirred model:
 where Qp represents hepatic plasma flow (11 ml · min−1 · kg−1), assuming a hematocrit of 0.45 (Yang et al., 2007); fu represents the unbound fraction of substrate in plasma (0.01 and 0.02 for warfarin and midazolam, respectively) (O'Reilly, 1972; Thummel et al., 1996; Gorski et al., 1998; Obach, 1999); and fm represents the fraction of substrate clearance forming the metabolite (0.45 and 0.70 for 7-hydroxywarfarin and 1′-hydroxymidazolam, respectively) (Chan et al., 1994; Thummel et al., 1996; Gorski et al., 1998; Takahashi et al., 1999).
Statistical Analysis.
Data were analyzed statistically using SigmaStat (version 3.5; Systat Software, Inc., San Jose, CA). If the amount of metabolite formed was below the limit of quantification, a value one-half the lowest calibration standard (0.04 and 1.0 pmol for 7-hydroxywarfarin and 1′-hydroxymidazolam, respectively) was assigned. If the amount of metabolite formed was below the limit of detection, a value of zero was assigned. Concentration-dependent inhibition by a given solvent in each enzyme source was evaluated by one-way analysis of variance (ANOVA); post hoc comparisons were made using Tukey's test when an overall difference resulted (p < 0.05). Enzyme kinetic parameters are presented as estimates ± S.E.s. Between-concentration differences in enzyme kinetic parameters for a given solvent were evaluated by one-way ANOVA; post hoc comparisons were made using Tukey's test when an overall difference resulted (p < 0.05).
Results
Initial Testing of Solvents on CYP2C9 and CYP3A4/5 Probe Substrate Reactions.
(S)-Warfarin 7-hydroxylation.
The tested solvents differentially inhibited (S)-warfarin 7-hydroxylation in HLMs and rCYP2C9s (Fig. 1). Relative to water, acetonitrile and methanol at the lowest concentration examined (0.1%) demonstrated <20% inhibition in all enzyme sources except rCYP2C9*1 (24 and 21%, respectively). Acetone at 0.1% demonstrated <20% inhibition in HLMs and rCYP2C9*3 but not rCYP2C9*1 (32%) and rCYP2C9*2 (30%). The remaining solvents at 0.1% demonstrated >20% inhibition in all enzyme sources, from 23% by DMSO in rCYP2C9*3 to 58% by isopropanol in HLMs. Acetonitrile at 1 and 2% inhibited activity by 35–40% and 38–58%, respectively. The remaining solvents at 1 and 2% inhibited activity by >51 and >62%, respectively. The CYP2C9 inhibitor, sulfaphenazole, inhibited activity by >75% in all enzyme sources. Midazolam 1′-Hydroxylation. The tested solvents differentially inhibited midazolam 1′-hydroxylation in HLMs, HIMs, and rCYP3As (Fig. 2). Relative to water, methanol and ethanol had the least inhibitory effects, demonstrating <20% inhibition in all enzyme sources, and at all concentrations examined, except methanol at 2% in HIMs (22%). Acetonitrile demonstrated <20% inhibition in all enzyme sources except HLMs at the highest concentration tested (29%). DMSO, acetone, and isopropanol at 0.1% demonstrated <20% inhibition in all enzyme sources except DMSO in HIMs (29%) and acetone in rCYP3A4 (36%). These three solvents at higher concentrations demonstrated more variable and generally a greater extent of inhibition (23–83%) compared with methanol, ethanol, and acetonitrile. The inhibition profile of DMSO was distinct, showing a significant stepwise pattern. Acetone and isopropanol were the least consistent among enzyme sources; both solvents inhibited activity in HLMs and rCYP3A4 to a greater extent than activity in HIMs and rCYP3A5, with acetone showing particularly pronounced differential effects. The CYP3A inhibitor, ketoconazole, inhibited activity by ≥85% in all enzyme sources except rCYP3A5 (62%).
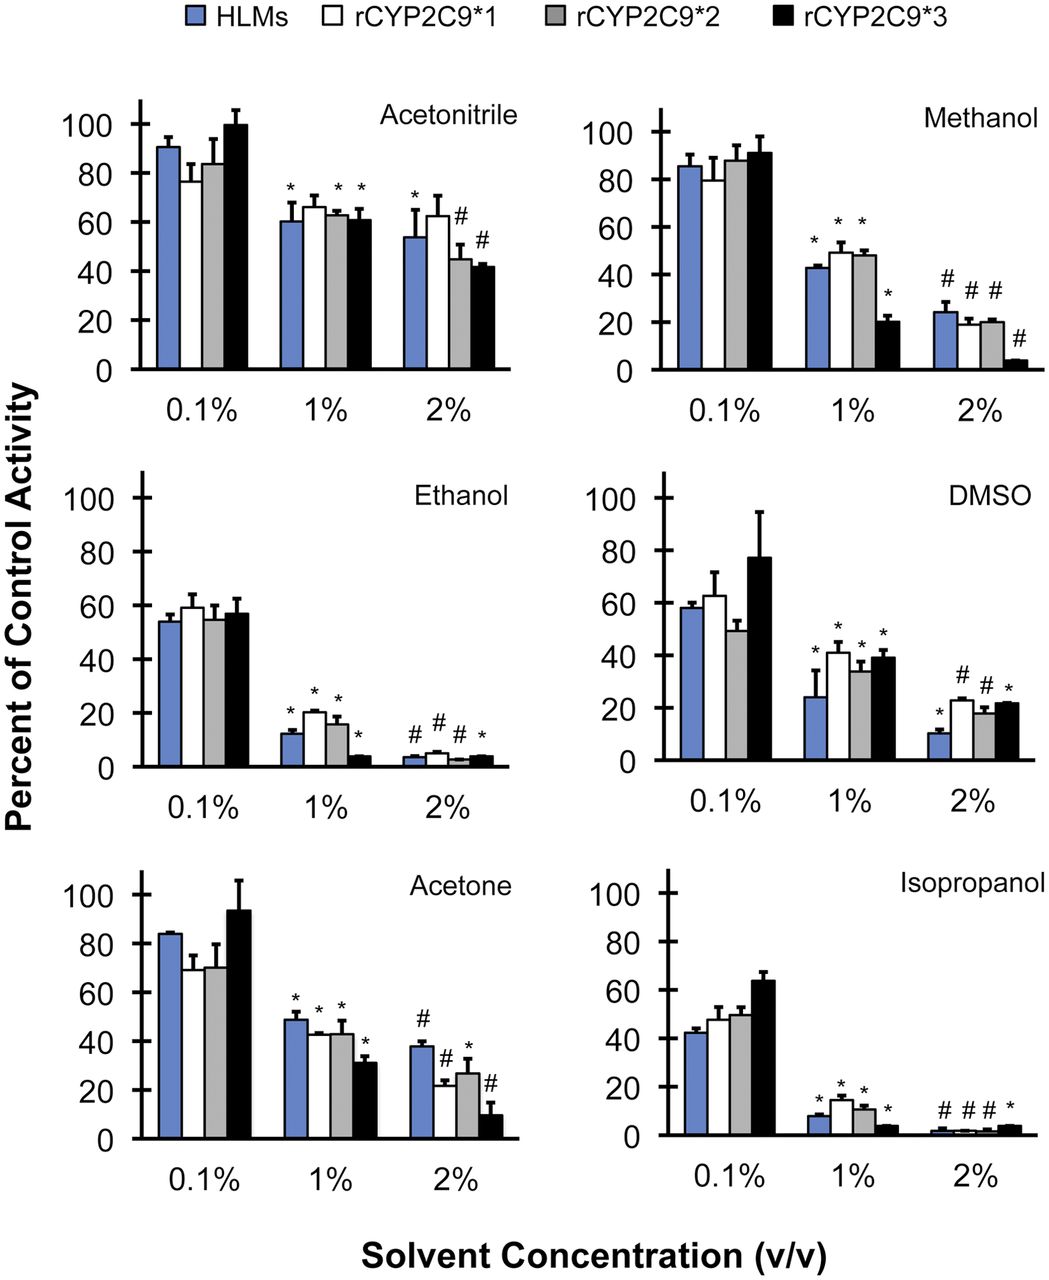
Screen of the inhibitory potential of organic solvents, relative to control (water), on (S)-warfarin 7-hydroxylation activity HLMs and rCYP2C9 enzymes. Control activities were 4.1 ± 0.2 pmol · min−1 · mg−1 in pooled HLMs and 15 ± 0.6, 10 ± 0.6, and 3.5 ± 0.1 pmol · min−1 · nmol−1 in rCYP2C9*1, rCYP2C9*2, and rCYP2C9*3, respectively. Bars denote means of triplicate incubations. Error bars denote S.D.s of triplicate incubations. *, p < 0.05 versus 0.1%; #, p < 0.05 versus 1% (one-way ANOVA, followed by Tukey's test).

Screen of the inhibitory potential of organic solvents, relative to control (water), on midazolam 1′-hydroxylation activity in HLMs, HIMs, and rCYP3A enzymes. Control activities were 0.95 ± 0.05 nmol · min−1 · mg−1 in pooled HLMs, 0.47 ± 0.02 nmol · min−1 · mg−1 in HIMs, and 2.1 ± 0.2 and 2.7 ± 0.1 nmol · min−1 · nmol−1 in rCYP3A4 and rCYP3A5, respectively. Bars denote means of triplicate incubations. Error bars denote S.D.s of triplicate incubations. *, p < 0.05 versus 0.1%; #, p < 0.05 versus 1% (one-way ANOVA, followed by Tukey's test).
Effects of Selected Solvents on CYP2C9 and CYP3A Probe Substrate Reaction Kinetics in HLMs.
(S)-Warfarin 7-hydroxylation.
Based on initial testing (Fig. 1), acetonitrile and methanol were selected for further evaluation. Eadie-Hofstee plots for both solvents at all concentrations examined suggested a unienzyme system (Fig. 3, A and B). The data were described best by the simple Michaelis-Menten equation (eq. 1) (Fig. 3, C and D). Relative to water, acetonitrile had no significant effect on Km but decreased Vmax progressively, by 32–60%, with increasing concentrations (Table 1). Methanol had no significant effect on Km at concentrations ≤1% but nearly doubled Km at a concentration of 2%. Similar to acetonitrile, methanol decreased Vmax progressively, by 24 to 65%, with increasing concentrations.

Effects of organic solvents on the kinetics of 7-hydroxywarfarin formation in HLMs. Eadie-Hofstee (A and B) and Michaelis-Menten (C and D) plots depict 7-hydroxywarfarin formation in the presence of water and 0.1, 1, or 2% (v/v) of either acetonitrile (ACN) (A and C) or methanol (MeOH) (B and D). Symbols denote observed values. Curves denote model-generated values. Error bars denote S.D.s of triplicate incubations.
Effects of selected solvents on the kinetic parameters of (S)-warfarin and midazolam hydroxylation in HLMs
Midazolam 1′-hydroxylation.
Based on initial testing (Fig. 2), acetonitrile, methanol, and ethanol were selected for further evaluation. Eadie-Hofstee plots of all three solvents at all concentrations examined showed a characteristic “hook,” indicative of autoactivation (Fig. 4, A–C) (Houston et al., 2003). The data were described best by the Hill equation (eq. 2) (Fig. 4, D–F); Hill coefficients ranged from 1.3 to 1.6 (S.E.s ≤0.10). Relative to water, all three solvents had no significant effect on either S50 or Vmax regardless of concentration (Table 1).
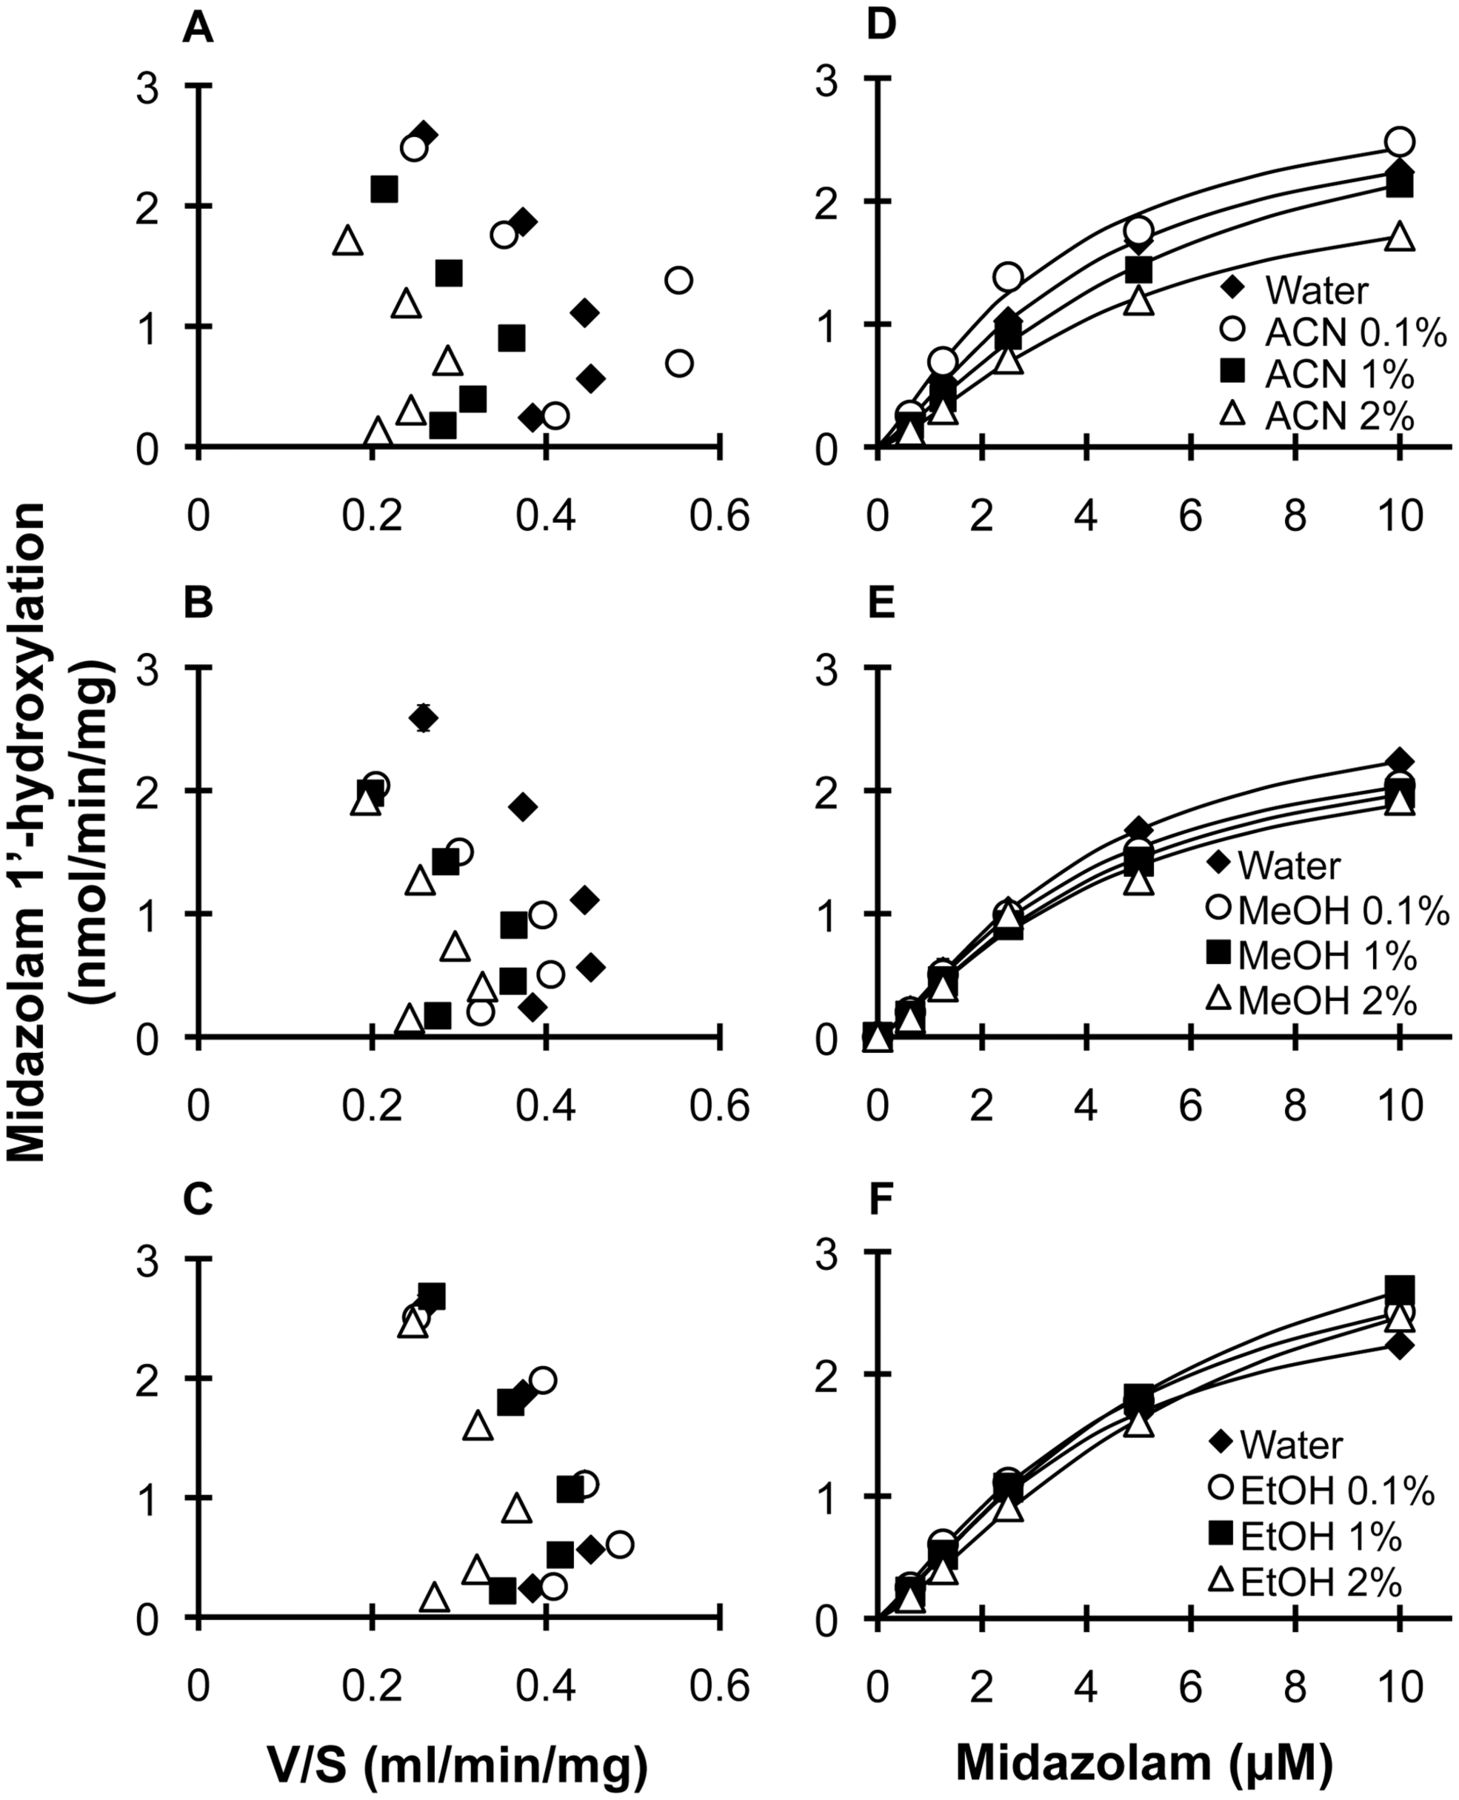
Effects of organic solvents on the kinetics of 1′ hydroxymidazolam formation in HLMs. Eadie-Hofstee (A–C) and Michaelis-Menten (D–F) plots depict 1′-hydroxymidazolam formation in the presence of water and 0.1, 1, or 2% (v/v) of acetonitrile (ACN) (A and D), methanol (MeOH) (B and E), or ethanol (EtOH) (C and F). Symbols denote observed values. Curves denote model-generated values. Error bars denote S.D.s of triplicate incubations.
Effects of Selected Solvents on Predicted Hepatic Plasma Clearance of (S)-Warfarin and Midazolam.
(S)-Warfarin.
Relative to water, acetonitrile at 0.1% had a modest effect (21% decrease) on ClH, whereas the higher concentrations decreased ClH by 52–65% (Table 1). Similar to acetonitrile, methanol at 0.1% had a modest effect (13% decrease) on predicted ClH, whereas the higher concentrations decreased ClH by 58–84% (Table 1).
Midazolam.
Relative to water, all three solvents (acetonitrile, methanol, ethanol) at all concentrations examined had a negligible to modest effect (≤20%) on ClH (Table 1).
Discussion
The potential for organic solvents to modulate in vitro catalytic activity of drug-metabolizing enzymes has been recognized for decades. Such enzymes include CYP2C9 and CYP3A4/5, which combined are involved in the oxidative metabolism of more than 50% of marketed drugs (Wienkers and Heath, 2005; Zanger et al., 2008). In addition, more than one probe substrate has been recommended for drug interaction studies involving either enzyme (Kenworthy et al., 1999; Kumar et al., 2006a). Despite these observations and recommendations, a lack of comprehensive information remains regarding selection of an optimal organic solvent for one of the preferred probe substrate reactions for each enzyme, specifically (S)-warfarin 7-hydroxylation (CYP2C9) and midazolam 1′-hydroxylation (CYP3A4/5). This deficiency has been addressed in the current evaluation of the effects of common solvents on each reaction in HLMs and/or HIMs and recombinant P450 enzymes.
As anticipated, different solvents differentially inhibited both probe substrate reactions. Initial testing showed that the effect of a given solvent varied with concentration and enzyme source. An ideal solvent should have no inhibitory effect on enzyme activity. However, because solubility limitations are commonplace for lipophilic molecules, 20% inhibition or less has been deemed acceptable (Yuan et al., 2002). This criterion was used to assess effects of the various solvents.
Acetonitrile and methanol at the lowest concentration examined (0.1%) inhibited (S)-warfarin 7-hydroxylation by <20% in all enzyme sources except rCYP2C9*1 (24 and 21%, respectively). At the higher concentrations tested (1 and 2%), acetonitrile had the least inhibitory effect, ranging from 35 to 40% and from 38 to 58%, respectively. Previous studies examining effects of multiple solvents on CYP2C9 activity, all published before 2002, used tolbutamide or diclofenac as the probe substrate and a single enzyme source (HLMs, human hepatocytes, or recombinant enzyme) (Chauret et al., 1998; Hickman et al., 1998; Busby et al., 1999; Tang et al., 2000; Easterbrook et al., 2001). Consistent with current observations, acetonitrile had the least inhibitory effect on both tolbutamide 4′-hydroxylation (HLMs, human hepatocytes) and diclofenac 4′-hydroxylation (rCYP2C9) at all tested concentrations, which ranged from 0.1 to 5%. However, the extent of inhibition (<5%) was typically much less than that of (S)-warfarin 7-hydroxylation, even at the lowest concentration examined. The increased sensitivity of (S)-warfarin compared with these other CYP2C9 substrates could reflect different experimental conditions and/or inherent differences in substrate access/binding to the enzyme active site, as discussed later.
Compared with (S)-warfarin 7-hydroxylation, midazolam 1′-hydroxylation was more resilient to the solvents. Methanol, ethanol, and acetonitrile demonstrated ≤20% inhibition in all enzyme sources except methanol at 2% in HIMs (22%) and acetonitrile at 2% in HLMs (29%). Most of the aforementioned pre-2002 studies examined solvent effects on CYP3A4/5 activity using testosterone as the probe substrate. Consistent with current observations, methanol (HLMs, human hepatocytes, rCYP3A4) and ethanol (rCYP3A4) at concentrations ≤2% had the least inhibitory effect on testosterone 6β-hydroxylation (<15 and <5%, respectively) (Chauret et al., 1998; Busby et al., 1999; Easterbrook et al., 2001). Acetonitrile at ≤1% tended to have a slightly greater effect, inhibiting activity in HLMs by up to 25% (Chauret et al., 1998; Busby et al., 1999; Easterbrook et al., 2001). To the authors' knowledge, only one previous study examined effects of solvents on CYP3A4/5 activity using midazolam as the probe substrate (Iwase et al., 2006). Using HLMs only, acetonitrile, methanol, and ethanol inhibited activity by <5%. These lower extents of inhibition compared with current observations may be attributable to the lower solvent concentrations tested (0.1–1%), higher substrate and microsomal protein concentrations (10 μM and 0.5 mg/ml, respectively), and/or longer incubation time (10 min). Nevertheless, the relative resilience of both midazolam 1′-hydroxylation and testosterone 6β-hydroxylation to the tested solvents, along with the notion that midazolam and testosterone belong to different CYP3A4/5 substrate subgroups (Kenworthy et al., 1999), was not unexpected given the promiscuous and flexible nature of CYP3A4 (Otyepka et al., 2012).
The solvents that showed the least inhibitory effects upon initial testing were evaluated further on the enzyme kinetics of each reaction in HLMs. Acetonitrile and methanol were selected for (S)-warfarin 7-hydroxylation; acetonitrile, methanol, and ethanol were selected for midazolam 1′-hydroxylation. Under control (water) conditions, Km (or S50) and Vmax values were in close agreement with previous reports for both reactions (Rettie et al., 1988; Thummel et al., 1996; von Moltke et al., 1996; Kumar et al., 2006b; Isoherranen et al., 2008), allowing generalization of results among laboratories. The Km of 7-hydroxywarfarin formation remained relatively constant (6–8 μM), whereas Vmax decreased (11 to 4 pmol · mg−1 · min−1), with increasing concentrations of acetonitrile and methanol (0.1–1%), suggesting noncompetitive inhibition. These observations are consistent with the effects of acetonitrile on the kinetics of the CYP2C9-mediated hydroxylation of celecoxib (Tang et al., 2000). Only the highest concentration of methanol (2%) altered the Km of 7-hydroxywarfarin formation significantly (14 μM). The increased Km, coupled with a decreased Vmax, suggests mixed-type inhibition, which has not been reported previously for any CYP2C9 probe reaction. In contrast to (S)-warfarin 7-hydroxylation, none of the tested solvents significantly altered the Km and Vmax of midazolam 1′-hydroxylation. These differential effects highlight further the differences between CYP2C9 and CYP3A4 in terms of flexibility and promiscuity, as well as the CYP2C9 substrate-dependent sensitivity to the tested solvents.
ClH for (S)-warfarin under control conditions was near the range of values reported from clinical studies (0.031 versus 0.031–0.061 ml · min−1 · kg−1) (Abernethy et al., 1991; Heimark et al., 1992; Chan et al., 1994; McAleer et al., 1997; Takahashi et al., 1999; Ngo et al., 2010). This improved in vitro-in vivo concordance compared with a previous report (Obach, 1999) may reflect use of intrinsic formation clearance of the metabolite, rather than in vitro half-life of the substrate, and the lack of need to incorporate nonspecific binding because of the much lower microsomal protein concentration (0.1 versus ≥3 mg/ml) (Obach et al., 1997). Although blood clearance is the preferred measure of drug clearance, incorporation of liver plasma flow and plasma unbound fraction permitted direct comparison with reported in vivo plasma clearance values. Consistent with initial testing, acetonitrile or methanol at 0.1% did not impact (S)-warfarin ClH by more than 20%, whereas concentrations >1% underpredicted ClH by more than 50%. Similar to (S)-warfarin, ClH for midazolam under control conditions was within the range of observed values (5.5 versus 5.3–7.6 ml · min−1 · kg−1) (Thummel et al., 1996; Gorski et al., 1998; Tsunoda et al., 1999; Isoherranen et al., 2008). Consistent with the lack of effect on S50 and Vmax, the tested solvents at all concentrations had a minimal to modest effect on ClH, underpredicting by <20%.
The rigorous assessment of the effects of acetonitrile and methanol on (S)-warfarin ClH could be of relevance when designing in vitro studies in which ≥1% concentrations are required. The 50–80% underprediction of (S)-warfarin ClH caused by these solvents may provide useful information when evaluating the interaction liability of new molecular entities with warfarin. Unlike (S)-warfarin ClH, midazolam ClH was affected modestly by acetonitrile, methanol, and ethanol (at most by 20%). Additional calculations showed that Clmax would have to decrease by 40% to impact ClH by >20%, substantiating the resilience of midazolam 1′-hydroxylation to these solvents.
The current study confirmed that the differential effects of solvents on CYP2C9 and CYP3A4/5 activity are both solvent concentration and substrate dependent. Although identifying the mechanisms by which acetonitrile and methanol alter (S)-warfarin kinetics was beyond the scope of this work, a comparison between structural features of CYP2C9 and CYP3A4/5 provides some insight. A recent report ranked the catalytic site of both CYP3A4 and CYP3A5 as more flexible and promiscuous than that of CYP2C9 (Otyepka et al., 2012). This ranking is consistent with the minimal interference of the tested solvents on the midazolam-CYP3A4/5 interaction but marked interference of the (S)-warfarin-CYP2C9 interaction. A previous analysis of the CYP2C9 crystal structure showed that binding of one (S)-warfarin molecule to the substrate binding pocket led to expansion of this pocket, facilitating binding of an additional (S)-warfarin molecule or other ligand, such as the inhibitor fluconazole (Williams et al., 2003). This interaction has been shown to be essential for (S)-warfarin affinity and regioselectivity (Seifert et al., 2006), as well as access to the heme moiety (Williams et al., 2003; Seifert et al., 2006). Whether or not the tested solvents alter the kinetics of (S)-warfarin 7-hydroxylation via alterations in substrate binding and/or enzyme topology merit further investigation.
The current work represents the first rigorous evaluation of the effects of common organic solvents on (S)-warfarin 7-hydroxylation and midazolam 1′-hydroxylation in a variety of enzyme sources. Based on the criterion of ≤20% inhibition, acetonitrile or methanol (≤0.1%) is recommended for studies involving (S)-warfarin 7-hydroxylation and HLMs or rCYP2C9s as enzyme sources. If higher solvent concentrations are necessitated, a significant decrease in Vmax should be anticipated, as much as 60% using HLMs; a significant increase in Km should be anticipated with methanol at 2%, as much as 100%. (S)-warfarin ClH will be underpredicted, by as much as 65 and 84% with acetonitrile and methanol, respectively. Acetonitrile, methanol, or ethanol (≤2%) is recommended for studies involving midazolam 1′-hydroxylation and HLMs, HIMs, or rCYP3As as enzyme sources. All of these solvents should be expected to have only modest effects on either kinetic parameter with HLMs, as well as midazolam ClH. This information fills the knowledge gap regarding solvent effects on P450 probe substrate reactions and should facilitate optimization of experimental conditions. Such optimized conditions will improve the interpretation and accuracy of in vitro-in vivo predictions when an organic solvent is required for solubilization of substrate and/or test molecule.
Authorship Contributions
Participated in research design: González-Pérez, Connolly, Bridges, Wienkers, and Paine.
Conducted experiments: González-Pérez and Connolly.
Contributed new reagents or analytic tools: Bridges.
Performed data analysis: González-Pérez and Connolly.
Wrote or contributed to the writing of the manuscript: González-Pérez, Connolly, Bridges, Wienkers, and Paine.
Acknowledgments
We thank Scott Brantley for technical and data analysis assistance. M.F.P. dedicates this paper to Dr. David P. Paine.
Footnotes
This work was supported by the National Institutes of Health National Institute of General Medical Sciences [Grant R01-GM077482].
Article, publication date, and citation information can be found at http://dmd.aspetjournals.org.
ABBREVIATIONS:
- P450
- cytochrome P450
- Clint
- intrinsic clearance
- Clmax
- maximum intrinsic clearance
- ClH
- predicted in vivo hepatic plasma clearance
- HLMs
- human liver microsomes
- HIMs
- human intestinal microsomes
- DMSO
- dimethyl sulfoxide
- ANOVA
- analysis of variance.
- Received June 20, 2012.
- Accepted August 14, 2012.
- Copyright © 2012 by The American Society for Pharmacology and Experimental Therapeutics


