


Abstract
Genes that are important for the detoxification of drugs and other xenobiotics show a high degree of interindividual variation attributable to regulation by diverse genetic, nongenetic, and epigenetic mechanisms including microRNAs (miRNAs). We selected a set of 56 miRNAs predicted to target the 3′-untranslated region of absorption, distribution, metabolism, excretion (ADME) genes to assess their hepatic expression levels and interindividual variability in a well-documented human liver tissue cohort (n = 92), together with the well-known hepatic miRNAs miR-122, miR-21, miR-27b, and miR-148a. Quantification by stem-loop real-time reverse-transcription polymerase chain reaction confirmed high expression for these microRNAs and revealed particularly strong variability of expression (>1000-fold) for miR-539, miR-200c, miR-31, miR-15a, and miR-22. Association analysis revealed a high degree of correlation among various miRNAs, suggesting coregulation. Statistical analysis considering liver donor meta-data including correction for multiple testing revealed strongly elevated levels of miR-21, miR-34a, miR-130b, and miR-132 in cholestatic liver and of miR-21 and miR-130b during inflammation, as indicated by elevated C-reactive protein levels in serum. Although none of the miRNAs was strongly associated with sex, several miRNAs, including miR-34a and miR-200a/b, were positively correlated with age. Association analysis with ADME gene expression profiles and with cytochrome P450 gene expression phenotypes (mRNA, protein, enzymatic activity) revealed numerous significant correlations. Negatively affected protein and/or activity levels were observed for CYP1A1 (e.g., miR-132, miR-142-3p, miR-21), CYP2A6 (miR-142-3p, miR-21), CYP2C19 (e.g., miR-130b, miR-185, miR-34a), and CYP2E1 (miR-10a, let-7g, miR-200c). These data should be useful to further elucidate regulatory functions of miRNAs in liver pathophysiology and regulation of ADME gene expression.
Introduction
Cytochrome P450 (P450) and other drug metabolizing enzymes, drug transporters, and regulatory genes that are important for the absorption, distribution, metabolism, and excretion (ADME) of drugs and xenobiotic substances are typically regulated by a multitude of intrinsic and extrinsic factors, resulting in large interindividual variability of expression and function with clinical relevance (Ingelman-Sundberg et al., 2007; Zanger and Schwab, 2013). Interestingly, the importance of each of these factors differs among ADME genes such that each gene appears to be regulated by a unique set of factors. For example, CYP2D6 appears to be almost exclusively regulated by gene polymorphisms, whereas other enzymes including CYPs 1A2, 2C8, and 3A4 are less affected by genetic polymorphism but strongly inducible through transcriptional regulation by ligand-dependent receptors [e.g., aryl hydrocarbon receptor, pregnane X receptor (PXR), constitutive androstane receptor, peroxisome proliferator-activated receptor α (Plant, 2007; Yang et al., 2010; Thomas et al., 2013)]. Additional factors including sex and age (Yang et al., 2010; Zhang et al., 2011) as well as hepatic disease states such as cholestasis and inflammatory conditions (Morgan, 2009; Nies et al., 2009; Klein et al., 2010) can have marked influence on the expression and function of ADME genes.
Knowledge of the intrinsic and extrinsic factors that influence expression and function of ADME genes is a prerequisite for predicting variable pharmacokinetics and drug response. However, despite extensive research into the mechanisms of ADME variability, personalized prediction is still difficult, indicating that unrecognized factors may exist that need to be identified. In recent years a new type of regulation by non-coding RNAs, particularly microRNAs (miRNAs) has been shown to affect the expression of a large proportion of the genome. These single-stranded, noncoding RNA molecules consist of about 22 nucleotides that imperfectly hybridize to 3′-UTR or other regions of mRNAs, typically leading to translation inhibition and lower protein expression or to transcript degradation (Bartel, 2009). The large number of miRNAs, estimated at over 2000 different molecules per mammalian species, and their poorly defined binding specificities allow for a vast number of potential miRNA-target gene interactions, which has been estimated to comprise up to 60% of human mRNAs (Friedman et al., 2009). MicroRNAs are involved in virtually all cellular processes and were also identified as tumor suppressors or oncogenes (Abba et al., 2012). Interestingly, many miRNAs appear to be tissue specifically regulated, but nevertheless they may be found in various body fluids within stable exosomes, making them potentially interesting biomarker candidates for a variety of conditions and disorders (Gusachenko et al., 2013).
Theoretical and experimental studies suggest that miRNAs are involved in the regulation of ADME gene expression, thus potentially contributing to drug response and toxicity (Ramamoorthy and Skaar, 2011; Yokoi and Nakajima, 2013). For example, human CYPs 1B1, 2E1, and 3A4 have been shown to be posttranscriptionally regulated by miR-27b (Tsuchiya et al., 2006), miR-378 (Mohri et al., 2010), and miR-27b (Pan et al., 2009). Furthermore, indirect influences of miRNAs on ADME gene expression have been shown to occur via transcriptional regulators, e.g., downregulation of CYP3A4 via posttranscriptional repression of PXR by miR-148a (Takagi et al., 2008) or of CYP7A1 via downregulation of hepatocyte nuclear factor 4α by miR-24 and miR-34a (Takagi et al., 2010; Ramamoorthy et al., 2012). Further examples were recently summarized (Yokoi and Nakajima, 2013).
However, little information is presently available regarding the expression variability of miRNAs that may be involved in ADME gene regulation in human liver. Although large systematic studies have been performed to compare tissue-specific expression profiles of miRNAs (Barad et al., 2004; Landgraf et al., 2007), interindividual variation of expression was rarely studied, and most data on human liver expression have been obtained in context of hepatocellular carcinoma (Murakami et al., 2006; Jiang et al., 2008). In rat models, however, studies suggested that miRNA expression can also be affected by acute and chronic hepatocellular injuries (Yamaura et al., 2012).
In this study we selected 56 miRNAs that have predicted binding sites in 3′-UTR of important ADME genes and that are expressed in human liver. We then quantified these miRNAs in a large cohort (n = 92) of well-documented Caucasian human liver samples to determine their relative expression and population variability. Extensive correlation and association analyses identified extrinsic and intrinsic factors affecting miRNA expression and provided evidence for selective ADME regulation patterns.
Materials and Methods
Caucasian Human Liver Cohort.
Liver tissues and corresponding blood samples for genomic DNA extraction had been collected from patients undergoing liver surgery at the department of general, visceral, and transplantation surgery at the Campus Virchow, Humboldt University, Berlin, Germany. The study was approved by the ethics committees of the medical faculties of the Charité, Humboldt University and of the University of Tuebingen and conducted in accordance with the Declaration of Helsinki. Written informed consent was obtained from each patient. All tissue samples were examined by a pathologist, and only histologically nontumorous tissues were collected and stored at −80°C. For each patient, detailed documentation of clinical parameters was available concerning age, sex, smoking habits, alcohol consumption, presurgical drug exposure, presurgery liver serum parameters including gamma glutamyl-transferase (GGT), C-reactive protein (CRP), and cholestasis, as well as diagnosis leading to liver resection, as previously described (Nies et al., 2009, 2013; Klein et al., 2010). Patients who suffered from hepatitis, cirrhosis, or alcohol abuse were excluded. In this study we investigated 92 randomly selected human livers out of a set of 150 particularly well-characterized samples (40 men, 52 women; Table 1). Gene expression profiles on these livers by microarray analysis are publically available as previously described (Schröder et al., 2013).
Population demographics and serum parameters of 92 liver donors
miRNA Isolation and Quantification.
Total RNA was prepared from frozen liver tissue using mirVana Isolation Kit (Ambion, Austin, TX). Reverse transcription (1 μg of total RNA) was performed by using Megaplex RT Primers, Human Pool A v2.0 and the TaqMan Reverse Transcription Kit (Applied Biosystems, Darmstadt, Germany) following the protocol provided by the manufacturer. To amplify all microRNAs prior to quantitation by real-time quantitative polymerase chain reaction (qPCR), reverse transcription Megaplex PreAmp Primers, Human Pool A v2.0 were used along with the TaqMan PreAmp Master Mix (Applied Biosystems). Initially, expression of a larger set of 378 miRNAs by qPCR in four pools of 10 liver samples each (2×10 men and 2×10 women) was performed by using microfluidic cards TaqMan Low Density Array A v2.0 for humans (Applied Biosystems) and detected with the ABI 7900 HT Fast real-time reverse-transcription polymerase chain reaction system. Expression of 56 selected miRNAs (see Fig. 1) was quantified by high-throughput stem-loop real-time reverse-transcription polymerase chain reaction using predeveloped TaqMan assays (Applied Biosystems) on a Biomark high-throughput qPCR chip platform (Fluidigm Corporation, San Francisco, CA). Relative quantification was calculated by normalization to the endogenous control RNU48 and to the mean relative quantification = 2exp(−ddCt).

Expression variability of 56 ADME-related miRNAs in 92 human liver samples. The miRNAs were selected based on liver expression and presence of in silico predicted seed sequences in the 3′-UTRs of a panel of ADME genes. Expression was measured by using predeveloped TaqMan assays and relatively quantified by normalization to the endogenous control RNU48. The miRNAs are sorted according to their mean expression levels, with boxes and whiskers indicating minimum and maximum value and lower and upper quartile relative to the median which was set at 1. The scale at left indicates approximate expression levels relative to the lowest expressed miR-200c, which was set at 1.
Hepatic P450 Phenotype Analysis.
Total liver RNA was prepared by Trizol/QiagenRNeasy protocol as described previously (Gomes et al., 2009). P450 mRNA expression was quantified using either previously described self-designed TaqMan gene expression assays for CYP1A2 (Klein et al., 2010), CYP2A6 (Haberl et al., 2005), CYP2B6 (Hofmann et al., 2008), CYP2C19 (Burk et al., 2005), CYP2D6 (Toscano et al., 2006), CYP3A4 (Wolbold et al., 2003), and NADPH:cytochrome P450 reductase (POR; Gomes et al., 2009) or predeveloped TaqMan assays (Applied Biosystems) for CYP2C8 (Feidt et al., 2010), CYP2C9 (Feidt et al., 2010) ,and CYP2E1 (Hs00559368_m1 CYP2E1; Applied Biosystems) using the TaqMan 7500 system (Applied Biosystems). Raw data were normalized to 60S large ribosomal protein P0 determined in the same samples using the endogenous control assay (4326314E) from Applied Biosystems. A TaqMan assay for CYP1A1 was newly designed (Supplemental Table 1).
P450 and POR protein expression was quantified in human liver microsomes by Western blotting as described before (Lang et al., 2001; Zanger et al., 2001; Wolbold et al., 2003; Haberl et al., 2005; Gomes et al., 2009; Klein et al., 2010, 2012). Details for protein determination of CYP1A1, CYP2C8, CYP2C9, CYP2C19, and CYP2E1 will be published elsewhere. Determination of microsomal enzyme activities was carried out with enzyme-specific prototype substrates for CYP1A2 (phenacetin), CYP2A6 (coumarin), CYP2B6 (bupropion), CYP2C8 (amodiaquine), CYP2C9 (luciferin-H), CYP2C19 (S-mephenytoin), CYP2D6 (propafenone), CYP2E1 (chlorzoxazone), CYP3A4 (atorvastatin), and POR (cytochrome C) as described previously (Gomes et al., 2009).
Statistical Analysis.
All statistical analyses were performed using GraphPad Prism (GraphPad Software Inc., San Diego, CA) and R-2.15.0 (www.r-project.org) with additional packages quantreg 4.96 and coin 1.0-21. Spearman correlation tests were applied to study associations 1) among miRNAs, 2) between miRNAs and ADME genes, and 3) between miRNAs and P450 phenotypes. Wilcoxon-Mann-Whitney tests and Spearman correlation tests were used as appropriate to study univariate correlations between microRNAs and nongenetic factors. In addition, for each microRNA a median regression model with seven nongenetic factors (sex, age, nicotine and alcohol consumption, presurgical drug exposure, cholestasis, and C-reactive protein) was calculated to study corresponding multivariate interrelationships. Analysis of variance for multivariate median regression was applied to analyze the associations between miRNAs and P450 phenotypes, when taking nine different nongenetic factors into account (the 7 factors listed above plus serum bilirubin and GGT). To be more precise, for each phenotype, we used function anova.rq in R-package quantreg (with rank test-statistic and Wilcoxon score function) to compare two median regression fits: 1) with only the nine nongenetic factors as covariates versus 2) the nine nongenetic factors plus the miRNA considered. Where indicated, P values were adjusted for multiple testing by Bonferroni correction or the Benjamini-Hochberg procedure. Statistical significance was defined as P < 5%.
Results and Discussion
miRNA Selection for Detection in Human Liver Samples.
To select miRNAs that are of potential relevance for ADME gene regulation in liver, we first determined expression levels of 384 well-described miRNAs available on a predesigned array in pools of human liver samples. We then determined which of the liver-expressed miRNAs have predicted binding sites on a selection of 60 ADME genes, including the most important P450s, phase II enzymes, drug transporters, and transcriptional regulators (Rieger et al., 2011). By use of our previously developed miRNA ranking tool, MIRNA-DISTILLER, we combined prediction data from three miRNA databases, i.e., TargetScan (Friedman et al., 2009), microCosm (Griffiths-Jones et al., 2006), and miRDB (Wang, 2008), to select miRNAs according to number and strength of predicted binding sites on ADME genes and their expression level in liver (Rieger et al., 2011). In addition, we included the liver specific miRNA miR-122 (Lagos-Quintana et al., 2002) as well as miR-21, miR-19a/b, and miR-106a/b because of their high expression in liver, despite low ranking order for ADME gene regulation. The final set of 56 selected miRNAs predicted to regulate ADME genes and expressed in liver is shown in Supplemental Table 2.
Expression Profiling of Selected miRNAs in Human Liver Tissue.
As shown in Fig. 1, the overall most abundant microRNA in our liver cohort was the liver-specific miR-122, confirming reports by others (Lagos-Quintana et al., 2002; Landgraf et al., 2007). We also found high expression of the ubiquitous miR-21, which has a wide role in various biologic processes (Kumarswamy et al., 2011), of miR-27b, described to regulate CYP3A4 (Pan et al., 2009) and peroxisome proliferator-activated receptor α (Kida et al., 2011), and of miR-148a, described to regulate PXR (Takagi et al., 2008). Among the 10 most highly expressed miRNAs were miR-19b, described to be downregulated in fibrotic compared with normal human livers (Lakner et al., 2012), miR-106a, which has been involved in HCC (Murakami et al., 2006), and miR-24, targeting hepatocyte nuclear factor 4α (Takagi et al., 2010) and aryl hydrocarbon receptor nuclear translocator (ARNT) (Oda et al., 2012).
The 56 miRNAs showed highly variable expression, although none of them was normally distributed. Particularly broad distributions were observed for miR-22, miR-15a, miR-31, miR-200c, miR-539, and let-7f, which displayed variability from ~1000- to over 30,000-fold, whereas miR-26a, miR-125b, miR-28-3p, and let-7a displayed variability below 10-fold. We then analyzed whether miRNA expression levels were correlated to each other (Fig. 2). A high degree of inter-miRNA correlation was observed. Particularly highly correlated mRNA pairs were miR-19a and miR-19b [Speaman correlation (rs) = 0.95, Bonferroni-corrected P value < 0.001]; miR-17 and miR-106a (rs = 0.94, P < 0.001); let-7g and miR-26a (rs = 0.90, P < 0.001); and miR-148a and miR-101 (rs = 0.88, P < 0.001; Fig. 2, inset). These data are in part in agreement with published evidence. For example, high correlations among miRNAs miR-17, miR-19a/b, and miR-106a (compare with Fig. 2), which are involved in control of transforming growth factor beta signaling, correspond well to their presence within miRNA clusters and common regulation by c-myc (Petrocca et al., 2008; Kumar et al., 2013). Furthermore, let-7g and miR-26a have been found to be similarly regulated during cellular senescence (Maes et al., 2009). However, the data presented in Fig. 2 suggest that a considerable fraction of hepatic miRNAs is coregulated even if they are not derived from a common transcript (Baskerville and Bartel, 2005).

Correlation matrix of hepatic miRNA expression. Levels of individual miRNAs determined by quantitative PCR were correlated to each other and Spearman correlation coefficients (rs) were calculated and displayed in a grayscale ranging from 1 (perfectly correlated) to 0 (no correlation). Inset, diagram of the 10 strongest correlation pairs. Only significant results after Bonferroni correction for multiple testing are shown.
Influence of Nongenetic Factors on miRNA Expression.
A significant influence of the liver donor’s sex was only seen for miR-31, which was expressed at higher levels in men compared with women (Table 2). Age had a significant influence on expression of several miRNAs. The strongest correlations between miRNA expression and age were attributable to upregulation in the elderly observed for miR-34a, miR-200a, and miR-200b. These showed Spearman correlation coefficients greater than 0.35 and remaining statistically significant after correction for multiple testing (Supplemental Fig. 1A; Table 3). Interestingly, miR-34a was shown to be upregulated in senescent endothelial cells in culture and also in different organs of aged mice (Ito et al., 2010). Although age-dependent expression has also been observed for several other miRNAs including miR-21, miR-142-3p, and miR-200c (Dimmeler and Nicotera, 2013), most of the data available so far were from mice, cell-culture systems, or other tissues than liver.
Univariate analysis of nongenetic factors influencing miRNA expression
Bold letters emphasize significant results after correction for multiple testing (Benjamini-Hochberg).
Univariate analysis of age influencing miRNA expression
Bold letters emphasize significant results after correction for multiple testing (Benjamini-Hochberg).
Several miRNAs were associated with pathologic changes in liver function parameters. Thus, decreased liver function as indicated by elevated GGT was associated with greater than 1.5-fold increased levels of miR-34a, miR-21, miR-130b, miR-132, miR-142-3p, and miR-150 (Table 2). In patients with pathologically increased levels of CRP, an acute phase response protein synthesized by the liver used as marker for systemic inflammation, we discovered a significant sixfold upregulation of miR-130b (Supplemental Fig. 1B; Table 2), a finding that has not been reported before to the best of our knowledge. This result remained significant after correction for multiple testing and in a multivariate model considering seven factors as covariates (see Materials and Methods; Supplemental Table 3). MiR-130b was observed before to be downregulated in plasma of bile-duct ligation-induced cholestatic rats (Yamaura et al., 2012) and has been suggested as potential marker for hepatocellular carcinoma (Li et al., 2011). We also found increased expression of miR-21 in livers from donors with elevated CRP, a well investigated miRNA that plays a crucial role in many biologic and pathologic processes including inflammation (Kumarswamy et al., 2011). Several additional miRNAs correlated to elevated CRP; however, these were only statistically significant in univariate tests without correction for multiple testing (Table 2).
Strong differences between patients with and without cholestasis were observed; in particular, miR-21, miR-130b, miR-34a, and miR-132 showed greater than twofold increased levels, and these effects remained significant after correction for multiple testing (Supplemental Fig. 1D; Table 2). Multivariate modeling confirmed the associations of miR-21 and miR-34a with cholestasis (Supplemental Table 3). To our knowledge, the association of these two miRNAs with cholestatic conditions has not been described before. As miR-21 and miR-34a belong to the most extensively studied miRNAs showing a plethora of physiological and pathophysiological functions, it should be interesting to further investigate the mechanism of this relationship and their potential suitability as biomarkers for cholestasis and other liver diseases. In contrast, the liver specific miR-122 was downregulated in cholestasis as well as in patients with elevated bilirubin levels, although these effects were only statistically significant in univariate tests and without multiple testing corrections. Additional miRNAs with decreased levels in cholestatic tissues were miR-148a and miR-27b, among others (Table 2). Finally, regular alcohol consumption was significantly associated with higher miR-185 expression compared with donors not consuming alcohol (Supplemental Fig. 1C; Table 2), whereas smoking did not seem to have a significant effect.
Correlation of miRNA to ADME Gene Expression Levels.
We correlated the miRNA expression profiles to gene expression profiles obtained previously on these livers by microarray analysis (Schröder et al., 2013). As illustrated in Fig. 3, miRNAs were associated with both up- and downregulated ADME gene expression patterns. On the basis of the predominant type of regulation, there appeared to be two classes of miRNAs, i.e., those associated with lower gene expression (e.g., miR-132, miR-142-3p, miR-150, miR-185, miR200a/b, miR-21, miR-221, miR-223, miR-27a, miR-34a) and those associated with higher expression (e.g., miR-148a, miR-19a/b, miR-204, and others). ADME genes negatively correlated to miRNAs included, in particular, the CYPs 1A1, 1A2, 2C19, and 3A4; the UDP glucuronosyltransferases (UGTs) 2B7 and 2B17; the transporters ABCG2, SLC47A1, and SLCO1B1 and 1B3; the nuclear receptors LXRa (NR1H3), constitutive androstane receptor (NR1I3), glucocorticoid receptor (NR3C1), and RXRa (NR2B1). Mainly positive correlations were seen for ABCB1, ABCB11, ABCC2, and GSTP1. Because miRNA regulation does not necessarily affect transcript stability and mRNA levels, we did not systematically assess whether these data coincide with the predictions by the database algorithms used for selecting the miRNAs (Supplemental Table 2). It appears that there is good agreement for some miRNAs (e.g., of seven predicted targets of miR-142-3p that were analyzed, four were correlated) but not for others (e.g., of six predicted and measured miR-21 targets, only one, UGT2B7, was negatively correlated). As a limitation of the approach it should be noted that microarray data were used for these analyses and that no protein/activity data were available except for the P450s, discussed below. The data should nevertheless be valuable for exploratory purposes.

Heat map of correlation analysis between 56 different miRNAs and selected ADME genes. Columns represent hepatic mRNA expression of 60 ADME genes determined by microarray analysis and rows represent the individually assayed miRNAs. Heat map colors represent Spearman correlation coefficients as indicated by the color key (bottom). Significant correlations are marked by stars (*P < 0.05; **P < 0.01; ***P < 0.001). Correlations that remain significant after Benjamini-Hochberg adjustment of P values are framed. ABC, ATP-binding cassette; AHRR, aryl-hydrocarbon receptor repressor; DPYD, dihydropyrimidine dehydrogenase; GST, glutathione S-transferase; HMGCR, 3-hydroxy-3-methylglutaryl-CoA reductase; HNF, hepatocyte nuclear factor; INSIG, insulin induced gene; NAT, N-acetyltransferase; NR, nuclear receptor; PON, paraoxonase; PPAR, peroxisome proliferator-activated receptor; RXR, retinoid X receptor; SLC, solute carrier; SLCO, solute carrier organic anion transporter; SREBF, sterol regulatory element binding transcription factor; SULT, sulfotransferase; TPMT, thiopurine S-methyltransferase; VDR, vitamin D receptor.
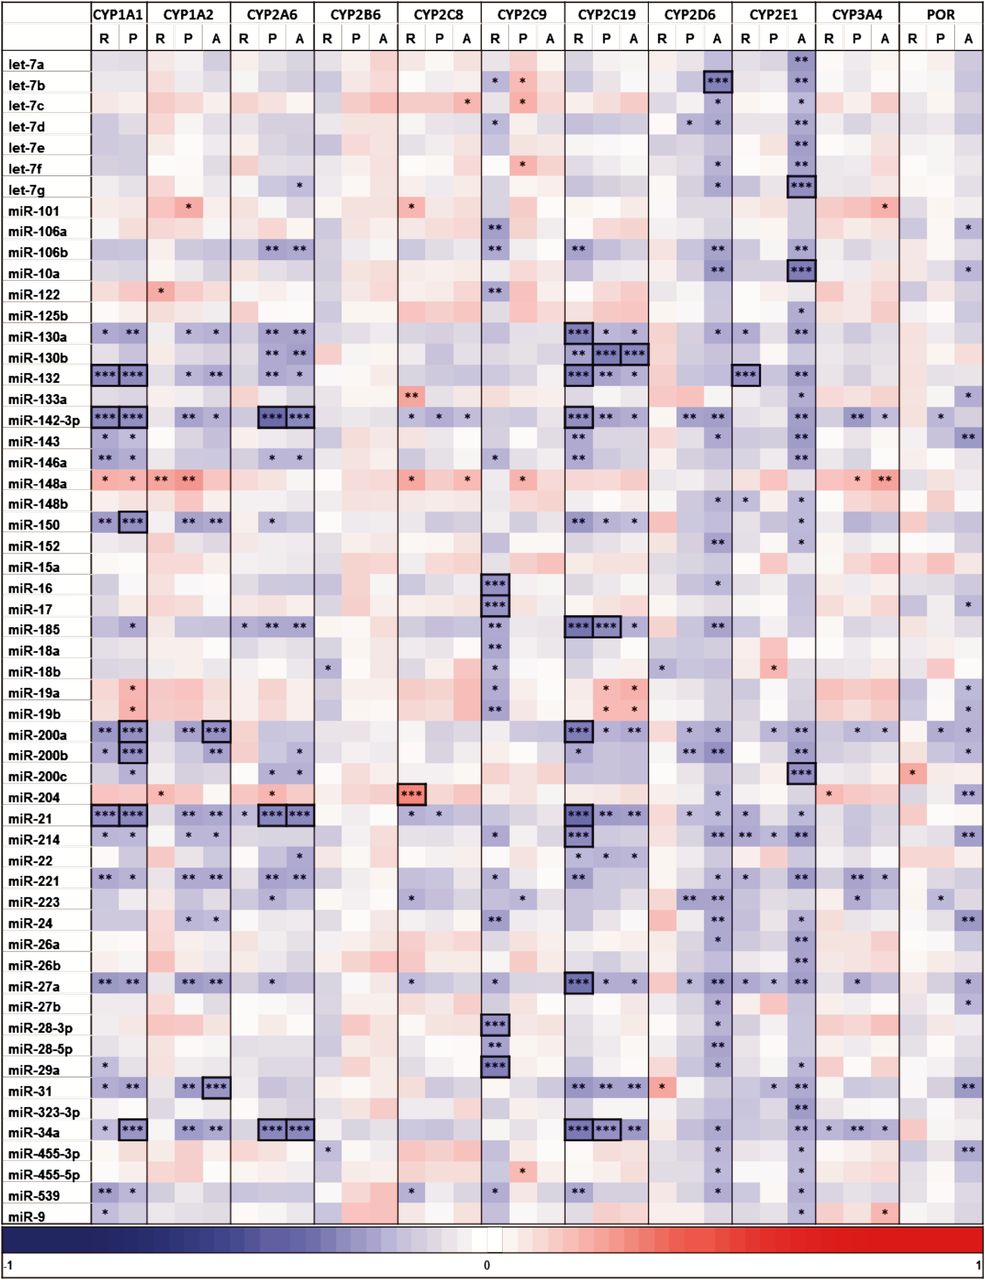
Correlation of miRNA to P450 Phenotypes.
Because major effects of miRNAs occur at the posttranscriptional level, we compared the hepatic miRNA levels further to protein and activity phenotypes determined for the 10 most important drug metabolizing P450s, as well as POR (Fig. 4; Table 4). For these genes, we attempted to validate the mRNA expression levels by qPCR data. It should be noted that the significant findings in Fig. 3 were largely reproduced for some CYPs, e.g., 1A1, 2C19, but not for others, e.g., 1A2, 3A4, indicating differences in the expression data. At the protein/activity level, most of the significant correlations were negative, whereas only few examples with apparently upregulated P450s were observed (e.g., for miR-148a, although only significant without multiple testing adjustment). Interestingly, DNA-methyltransferase 1 was verified as a target for miR-148a, resulting in positive correlations between miR-148a and DNA-methyltransferase 1 targets (Braconi et al., 2010). For example, decreased level of promoter methylation of CYP3A4 and PXR had previously been shown to correlate to increased mRNA expression (Habano et al., 2011; Kacevska et al., 2012). Several negative correlations on the protein/activity level were observed for CYPs 1A1/2, 2A6, 2C19, 2D6, and 2E1, which were linked to miR-130a/b, miR-132, miR-142-3p, miR-200a/b, miR-21, miR-27a, miR-31, and miR-34a. The strongest negative correlations at the protein level (rs < −0.35, P < 0.05) were observed for CYPs 1A1 (miR-142-3p: rs = −0.36, miR-200a: rs = −0.36, miR-200b: rs = −0.36), 2A6 (miR-142-3p: rs = −0.46), and 2C19 (miR-34a: rs = −0.35, miR-185: rs = −0.37). Interestingly, most of the negative correlations of CYPs 1A2, 2A6, 2D6, 2E1, and POR were not accompanied by significant changes at the transcript level, in agreement with posttranscriptional regulation by miRNAs.

Heat map of correlation analysis between miRNA and P450/POR phenotypes. Columns represent expression of mRNA (R, determined by TaqMan qPCR), protein (P), and activity (A) of 10 P450s and POR involved in detoxification. The following enzyme activities were measured (Gomes et al., 2009): CYP1A2, phenacetin O-deethylation; CYP2A6, coumarin O-deethylation; CYP2B6, bupropion hydroxylation; CYP2C8, amodiaquine N-demethylation; CYP2C9, luciferin-H oxidation; CYP2C19, S-mephenytoin 4′-hydroxylation; CYP2D6, propafenone 5-hydroxylation; CYP2E1, chlorzoxazone 6-hydroxylation; CYP3A4, atorvastatin ortho-hydroxylation, and POR, cytochrome C reduction. Heat map colors correspond to Spearman correlation coefficients (rs) as indicated by the color key (bottom). Significant correlations are marked by stars (*P < 0.05; **P < 0.01; ***P < 0.001). Correlations that remain significant after Benjamini-Hochberg adjustment of P values are framed.
Multivariate analysis of miRNAs associated with P450 phenotypes
miRNAs that have a predicted target sites within P450 3′- -UTRs are marked in bold.
In contrast to the above mentioned P450s, the negative correlations of CYP1A1 and CYP2C19, e.g., with miR-132, miR-142-3p, miR-21, miR-34a, and others were also seen at the transcript level, indicating direct regulation through transcript degradation or indirect transcriptional regulation. The latter possibility may be explained, for example, by miR-142-3p-mediated downregulation of the glucocorticoid receptor (Lv et al., 2012) or by miR-132 and miR-34a-mediated downregulation of the SIRT1 deacetylase, which could lead to the inactivation of several nuclear receptors involved in P450 regulation (Strum et al., 2009; Lee and Kemper, 2010). The remaining P450s seemed to be less affected by these miRNAs: CYP2C9 was negatively correlated to other miRNAs at the mRNA level only. Only few correlations, most of which did not withstand multiple testing adjustment, were seen for CYP2B6, CYP2C8 (to miR-204, positive), CYP3A4 (e.g., to miR-142-3p, negative, to miR-148a, positive, and at all levels to miR-34a), and POR (Fig. 4). In particular, we were not able to detect correlations between miR-27b and CYP3A4 (Pan et al., 2009) or miR-148a and either PXR or CYP3A4 (Takagi et al., 2008). The lack of correlation between miR-148a and CYP3A4 expression was also recently reported for Chinese liver donors (Wei et al., 2013). A possible explanation may be that miRNA regulation is often being studied in optimized in vitro model systems, whereas P450 expression in liver is multifactorial and miRNA effects on regulation may not be sufficiently strong to be detectable by correlation. Thus, the observed correlation coefficients were in the range −0.5 < rs < 0.5, indicating a modulatory role of miRNA regulation for ADME genes, in agreement with the current general view of miRNA regulation (Bartel, 2009).
Multivariate analysis taking seven nongenetic factors into account did not reveal several strong associations seen by univariate tests (e.g., the negative associations of miR-34a with CYPs 1A1, 1A2, 2A6, 2C19, and 3A4), whereas various new associations were also observed (compare Table 4 and Fig. 4). Furthermore, multivariate analysis revealed significant correlation between miRNAs miR-125b, miR-152, and miR-22 with age (Supplemental Table 3), which were not seen by univariate analysis (Table 4). These differences between univariate and multivariate analysis may be explained by the strong association of some miRNAs to pathophysiological conditions, which simultaneously affect P450 expression (e.g., inflammation). The mechanism of these correlations thus remains to be established. A further limitation to be mentioned is that we did not take into account the potential effect of genetic variation, which may occur either in the miRNA target genes, where they may affect the binding sites, or in the miRNA genes, where they may affect the miRNA seed sequence or structure and binding properties.
Conclusion
In this study we determined expression levels of 56 miRNAs with predicted binding sites in 3′-UTRs of important ADME genes in a well-documented cohort of 92 human surgery liver samples. Our data confirm and extend findings from previous studies that expression of some miRNAs is related to age and sex. Our data suggest that expression of certain miRNAs is strongly affected by hepatic pathophysiological conditions. In particular, several miRNAs including miR-21, miR-34a, and miR-130b were pronouncedly increased in cholestatic livers as well as during acute phase response, suggesting their potential usefulness as liver disease biomarkers. Correlation analyses revealed numerous associations between these and other miRNAs with ADME and cytochrome P450 expression phenotypes apparently resulting from both direct and indirect interactions. Although these associations need to be confirmed, they indicate potential for novel biomarkers in pharmacokinetics and hepatic disease.
Acknowledgments
The authors acknowledge the expert technical assistance of Igor Liebermann and Britta Klumpp (Stuttgart).
Authorship Contributions
Participated in research design: Rieger, Zanger.
Conducted experiments: Rieger, Klein.
Performed data analysis: Rieger, Klein, Winter, Zanger.
Wrote or contributed to the writing of the manuscript: Rieger, Winter, Zanger.
Footnotes
- Received January 19, 2013.
- Accepted March 12, 2013.
This study was supported by the German Federal Ministry of Education and Research Virtual Liver Network [Grant 0315755]; and by the Robert Bosch Foundation, Stuttgart, Germany.
↵
 This article has supplemental material available at dmd.aspetjournals.org.

Abbreviations
- ADME
- absorption, distribution, metabolism, excretion
- CRP
- C-reactive protein
- GGT
- gamma glutamyl-transferase
- miRNAs
- microRNAs
- P450
- cytochrome P450
- POR
- NADPH:cytochrome P450 reductase
- PXR
- pregnane X receptor
- qPCR
- real-time quantitative polymerase chain reaction
- rs
- Spearman correlation
- Copyright © 2013 by The American Society for Pharmacology and Experimental Therapeutics


