


Abstract
Drug-induced liver injury is the most frequent reason for market withdrawal of approved drugs, and is difficult to predict in animal models. Here, we analyzed transcriptomic data derived from short- and long-term cultured primary human hepatocytes (PHH) exposed to the well known human hepatotoxin chlorpromazine (CPZ). Samples were collected from five PHH cultures after short-term (1 and 3 days) and long-term (14 days) repeat daily treatment with 0.1 or 0.2 µM CPZ, corresponding to Cmax. Two PHH cultures were additionally treated with 1 µM CPZ, and the three others with 0.02 µM CPZ. Differences in the total number of gene changes were seen between donors and throughout treatment. Specific transcriptomic hepatotoxicity signatures were created for CPZ and consisted of inflammation/hepatitis, cholestasis, and liver proliferation in all five donors, as well as fibrosis and steatosis, which were observed in four of five donors. Necrosis was present in three of five donors, and an indicative signature of cirrhosis was observed after long-term 14-day repeat treatment, also in three of five donors. The inter-donor variability in the inflammatory response to CPZ treatment was associated with variability in the strength of the response of the transcriptomic hepatotoxicity signatures, suggesting that features of inflammation could be related to the idiosyncratic hepatotoxic effects of CPZ in humans.
Introduction
Drug-induced liver injury is the most frequent reason cited for market withdrawal of approved drugs (Lee, 2003). To detect hepatotoxic effects as early as possible in the process of drug development, in vitro liver models, such as primary hepatocytes, are increasingly being used (Tuschl et al., 2008; Gomez-Lechon et al., 2010). Primary hepatocytes have been shown to be the most relevant model for predicting in vivo xenobiotic metabolism (Blanchard et al., 2005; Foster et al., 2011), drug-drug interaction through a reversible or time-dependent inhibition of cytochromes P450 (P450s) (Zhao et al., 2005; Soars et al., 2007; Gomez-Lechon et al., 2010), interference with transporters (Soars et al., 2007; De Bruyn et al., 2011), and drug toxicity (Richert et al., 2003; Liguori et al., 2005; Li, 2009).
Microarray analysis has great utility for the elucidation of underlying mechanisms of hepatotoxicity (Richert et al., 2008; Lauer et al., 2009). In addition, large interindividual variability has been observed in both the basal expression (Rogue et al., 2012) and in response to treatment of many genes related to drug metabolism. Liguori et al. (2005) showed that, after 24 hours of treatment with trovafloxacin, gene changes varied across four different primary human hepatocyte (PHH) cultures. We have previously shown an important interdonor variability in the response of three PHH cultures to a 72-hour exposure to reference P450 inducers (Abadie-Viollon et al., 2010), and Goyak et al. (2008) reported that only a small set of genes was consistently deregulated across 10 PHH cultures, whereas relatively large gene sets were regulated uniquely in a given PHH culture in response to 24 hours of exposure to reference inducers.
To date, mainly short-term exposure in vitro toxicity studies have been reported (Lauer et al., 2009; Gerets et al., 2012), but effects in humans during long-term medication also need to be evaluated, and thus long-term repeat-dose toxicity assessments in in vitro systems need to be performed. The expression of many liver-specific genes decreases during the initial stage of cultivation of PHHs (Boess et al., 2003; Richert et al., 2006), often associated with declines in metabolic capacities (Richert et al., 2002; Binda et al., 2003; Madan et al., 2003). They are, however, maintained at acceptable levels over time in long-term cultures using sandwich configuration and an appropriate medium (Hewitt et al., 2007; Tuschl et al., 2009; Mueller et al., 2012). Prolonged exposure studies of PHH to drugs affecting major toxicity and metabolism pathways, such as ethanol during 14 days (van Pelt et al., 2003) or diclofenac during 23 days (Mueller et al., 2012), have indicated a good in vivo/in vitro correlation.
Chlorpromazine (CPZ) is the most widely used phenothiazine neuroleptic for the treatment of schizophrenic patients (Wojcikowski et al., 2010). CPZ clearance was demonstrated to be dependent on the patient’s body weight and lifestyle, which is a major problem for its therapeutic use (Pantuck et al., 1982; Chetty et al., 1994). An inter-donor P450 polymorphism is also recognized for CPZ pharmacokinetics, since it is extensively metabolized by CYP2D6 and CYP1A2 (Yeung et al., 1993; Yoshii et al., 2000). CPZ has been reported to be cytotoxic, and several of its metabolites, generated by both rat and human metabolism, are known to be equally or more cytotoxic than CPZ itself (Abernathy et al., 1977; Tavoloni and Boyer, 1980; Yeung et al., 1993). A species difference in the in vitro sensitivity of hepatocytes in monocultures has been reported, with an EC50 as low as 9 ± 6 µM CPZ in human hepatocytes (Gerets et al., 2012) compared with 110 µM in rats hepatocytes (Zhang et al., 2011). An incidence of 1–2% cholestasis has been reported in patients treated with CPZ at therapeutic doses of 2–5 mg/kg (Boelsterli et al., 1987; Horikawa et al., 2003; de Abajo et al., 2004). In contrast, CPZ was not hepatotoxic in preclinical toxicity studies; for example, CPZ did not cause cholestasis after 3-week repeated dosing at the highest dose of 20 mg/kg in rats (Tsao et al., 1983). More recently, Buchweitz et al. (2002) demonstrated the appearance of cholestasis in rats after one dose of CPZ (70 mg/kg body weight) given 2 hours after lipopolysaccharide administration. Involvement of an inflammatory process could indeed underlie the idiosyncrasy of CPZ since, in humans, CPZ-induced cholestasis has been associated with an infiltration of inflammatory cells, such as neutrophils and lymphocytes (Moradpour et al., 1994).
In the present study, the mRNA expression profile of PHHs was analyzed after single- and repeat-dose treatment with CPZ, with the aim to address mechanisms as well as interindividual variability of PHH.
Materials and Methods
Chemicals and Solutions.
Williams’ E medium GlutaMAX, fetal bovine serum (FBS), insulin-transferrin-selenium,sodium pyruvate, gentamicin, and Geltrex were purchased from Thermo Fisher Scientific, (Illkirch, France). Insulin, penicillin/streptomycin, dexamethasone, bovine serum albumin, dimethylsulfoxide (DMSO), Percoll, collagenase, and chlorpromazine hydrochloride were from Sigma-Aldrich (Saint-Quentin-Fallavier, France). Hepatocyte maintenance medium was from Lonza (Verviers, Belgium).
Isolation of Primary Human Hepatocytes.
Human liver tissue was obtained from resections from patients undergoing partial liver hepatectomy for therapy of hepatic tumors, with permission of the national ethics committees and regulatory authorities (Table 1). Biopsies (20–100 g) were removed from the safety margin of the tissue resected near the tumor. Human hepatocytes were isolated using a two-step perfusion technique as previously described by Richert et al. (2004) and Lecluyse and Alexandre (2010). Briefly, two to four hepatic vessels were cannulated and perfused with 0.5 mM EGTA-containing buffer for 10 minutes and then with a 0.02% collagenase-containing buffer for 20 minutes at 37°C. At the end of the perfusion, the resection was removed from the perfusion system and immersed into warm Hanks’ balanced salt solution containing 10% FBS (suspension buffer). Using tissue forceps and scissors, the Glisson’s capsule was gently torn and the hepatocytes released into the medium following gentle shaking and passing of the tissue between the tissue forceps, leaving behind the connective tissue and any undigested material. The cells were filtered through 850, 400, and 100 µm meshes and then centrifuged at 80g for 5 minutes at room temperature (RT). Cells were washed once in suspension buffer and once in Percoll-containing buffer (final concentration 28.8%) at 168g for 20 minutes at RT. The hepatocytes were washed again in suspension buffer at 80g for 5 minutes at RT, and cell viability and number were determined using the trypan blue (0.4%) exclusion method. Only preparations with more than 70% cell viability were used for further experiments.
Characteristics of the five human donors used for the transcriptomics analysis
Exposure to CPZ for Cell Viability.
To determine the toxicity of CPZ, PHH suspensions obtained after isolation were seeded onto collagen I–coated 96-well plates (Biocoat, Dutscher, France) at 0.05 × 10⁶ viable cells per well in 100 µl Williams’ E medium supplemented with 10% FBS, 4 µg/ml insulin, 1 µM dexamethasone, and gentamicin (50 µg/ml). After overnight culturing, the monolayer was overlaid with 350 µg/ml Geltrex in seeding medium without FBS for 24 hours. Seven concentrations of CPZ were tested (0, 1, 10, 20, 30, 40, and 50 µM) and either a resazurin or 3-(4,5-dimethylthiazol-2-yl)-2,5-diphenyltetrazolium bromide (MTT) test was performed after 1, 3, and 14 days of treatment. For the resazurin assay, cell monolayers were incubated for 30 minutes with 450 µM resazurin, and fluorescence was measured with an excitation wavelength at 530–560 nm and an emission wavelength at 590 nm. For the MTT assay, cell monolayers were incubated for 30 minutes with thiazolyl blue tetrazolium bromide (1 mg/ml), the supernatant was removed, and 100 µl per well of DMSO was added. After gentle shaking, the absorbance was measured at 595 nm. For the two assays, results were expressed as a percentage versus the vehicle control.
Culture and Exposure to CPZ for Transcriptomic Analysis.
The PHH suspension obtained after isolation was seeded, as described in the previous paragraph, onto collagen I–coated 6-well plates (Biocoat) at 2 × 10⁶ viable cells per well. Forty-eight hours after seeding, treatment with CPZ was started. The culture medium consisted of hepatocyte maintenance medium supplemented with 1% insulin-transferrin-selenium, 100 nM dexamethasone, and 50 µg/ml gentamicin. The medium was renewed every day, and a new overlay with Geltrex (350 µg/ml) was applied 6, 9, and 13 days after seeding.
Stock solutions of CPZ were made in DMSO: 0.01, 0.05, 0.1, and 0.5 mM CPZ. Stock solutions of CPZ were diluted in the appropriate medium to obtain 0.02, 0.1, 0.2, and 1 μM. Compound-containing medium was renewed every day until day 13. Cells not treated with CPZ but that received only the vehicle (DMSO) served as the control.
RNA Extraction.
After 1, 3, and 14 days of CPZ treatment, RNA was extracted for whole-transcriptome analysis. Cells were washed with 1× phosphate-buffered saline and scraped in RNAprotect Cell Reagent (Qiagen, Hilden, Germany). After centrifugation, cells were lysed in RLT Buffer Plus (Qiagen) complemented with 1% 2-mercaptoethanol, pipetted onto a QIAshredder spin column (Qiagen), and centrifuged for 2 minutes at 13,800g to ensure full homogenization. The lysates were kept at −80°C until RNA extraction.
Total RNA was extracted using the RNeasy Plus Mini Kit from Qiagen on the automated QIAcube robotic workstation (Qiagen), both according to the manufacturer’s protocols. The RNA quantity was assessed with the NanoDrop 2000 (Thermo Fisher Scientific, Waltham, MA), and the quality was determined with the Agilent 2100 Bioanalyzer (Agilent Technologies, Waldbronn, Germany).
Transcriptomics Processing.
Biotinylated complementary RNA was amplified with the Illumina TotalPrep-96 RNA Amplification kit (Ambion, Life Technologies GmbH, Darmstadt, Germany) according to the manufacturer’s protocol. After assessing the quantity (NanoDrop 2000) and the quality (Agilent 2100 Bioanalyzer) of the labeled complementary RNA, it was hybridized onto the appropriate Illumina BeadChips (HumanHT-12_v4; Illumina, Inc., San Diego, CA). The BeadChips were washed and stained using the Little Dipper Microarray Processor (SciGene Corporation, Sunnyvale, CA) and subsequently scanned with the Illumina BeadArray Reader (Illumina, Inc.). The GenomeStudio Data Analysis Software (Illumina, Inc.) was used to check the quality of the transcriptomic raw data and to make them accessible for further processing (Illumina, 2010; http://www.illumina.com/Documents/products/technotes/technote_gene_expression_data_quality_control.pdf). Transcriptomic raw data were log 2 transformed and quantile normalized before statistical analysis. Quantile normalization was performed as outlined in Bolstad et al. (2003) using the application package preprocessCore (http://www.bioconductor.org) written for the open-source statistical software R (http://www.R-project.org). Microarray data are available in the ArrayExpress database (www.ebi.ac.uk/arrayexpress) under accession number E-MTAB-1747.
Data Processing and Analysis.
Due to a large donor-to-donor variability, the transcriptomics results of the five PHH preparations were analyzed separately. Fold change values were calculated to compare gene expression measurements between corresponding time-matched vehicle controls and CPZ treatment conditions. Genes with a fold change value larger than 2 were regarded as upregulated, whereas genes with a fold change value smaller than −2 were regarded as downregulated. The total number of deregulated genes was plotted against treatment time and PHH donor to visualize time and donor effects on these numbers.
For each PHH donor and each time point, hepatic pathway hypotheses were generated using the Ingenuity Pathway Analysis version 7.0 software (IPA; Ingenuity Systems, Redwood City, CA). A pathway was selected when at least two-thirds of donors treated with 0.02 µM CPZ, three-fifths of donors with 0.1 or 0.2 µM CPZ, or one-half of donors with 1 µM had a P value ≤0.05 (this IPA-derived P value is calculated via Fisher’s exact test and reflects the likelihood that the association between a set of genes and a certain pathway is due to random chance).
A heat map illustrating fold change values of the genes involved in the identified hepatic signatures was created within the Analyst software (Genedata, Basel, Switzerland). To classify deregulated genes in hepatic signatures, the genes assigned to the different hepatic pathways according to IPA (Supplemental Table 1) were validated manually using current literature. In addition, these hepatic signatures were expanded by additional deregulated genes known to be involved in hepatotoxicity, taken from the literature (National Center for Biotechnology Information: Gene and PubMed; Weizmann Institute of Science: The GeneCards Human Gene Database).
The number of deregulated genes per hepatic signature was calculated separately for each hepatic signature, PHH donor, CPZ treatment concentration, and treatment time. Dot plots created with R, version 2.14.1, were used to compare numbers of deregulated genes across hepatic signatures, donors, and treatment times.
Results
Treatment Concentrations for Transcriptomic Analysis.
Within the European Seventh Framework Program Predict-IV (FP7/2007–2013), the CPZ repeat-treatment protocol of PHH was set to a daily exposure over a 14-day period with a concentration causing a maximum of 10% decrease in cell viability (TC10) and with a presumed non-cytotoxic concentration being one-tenth of TC10.
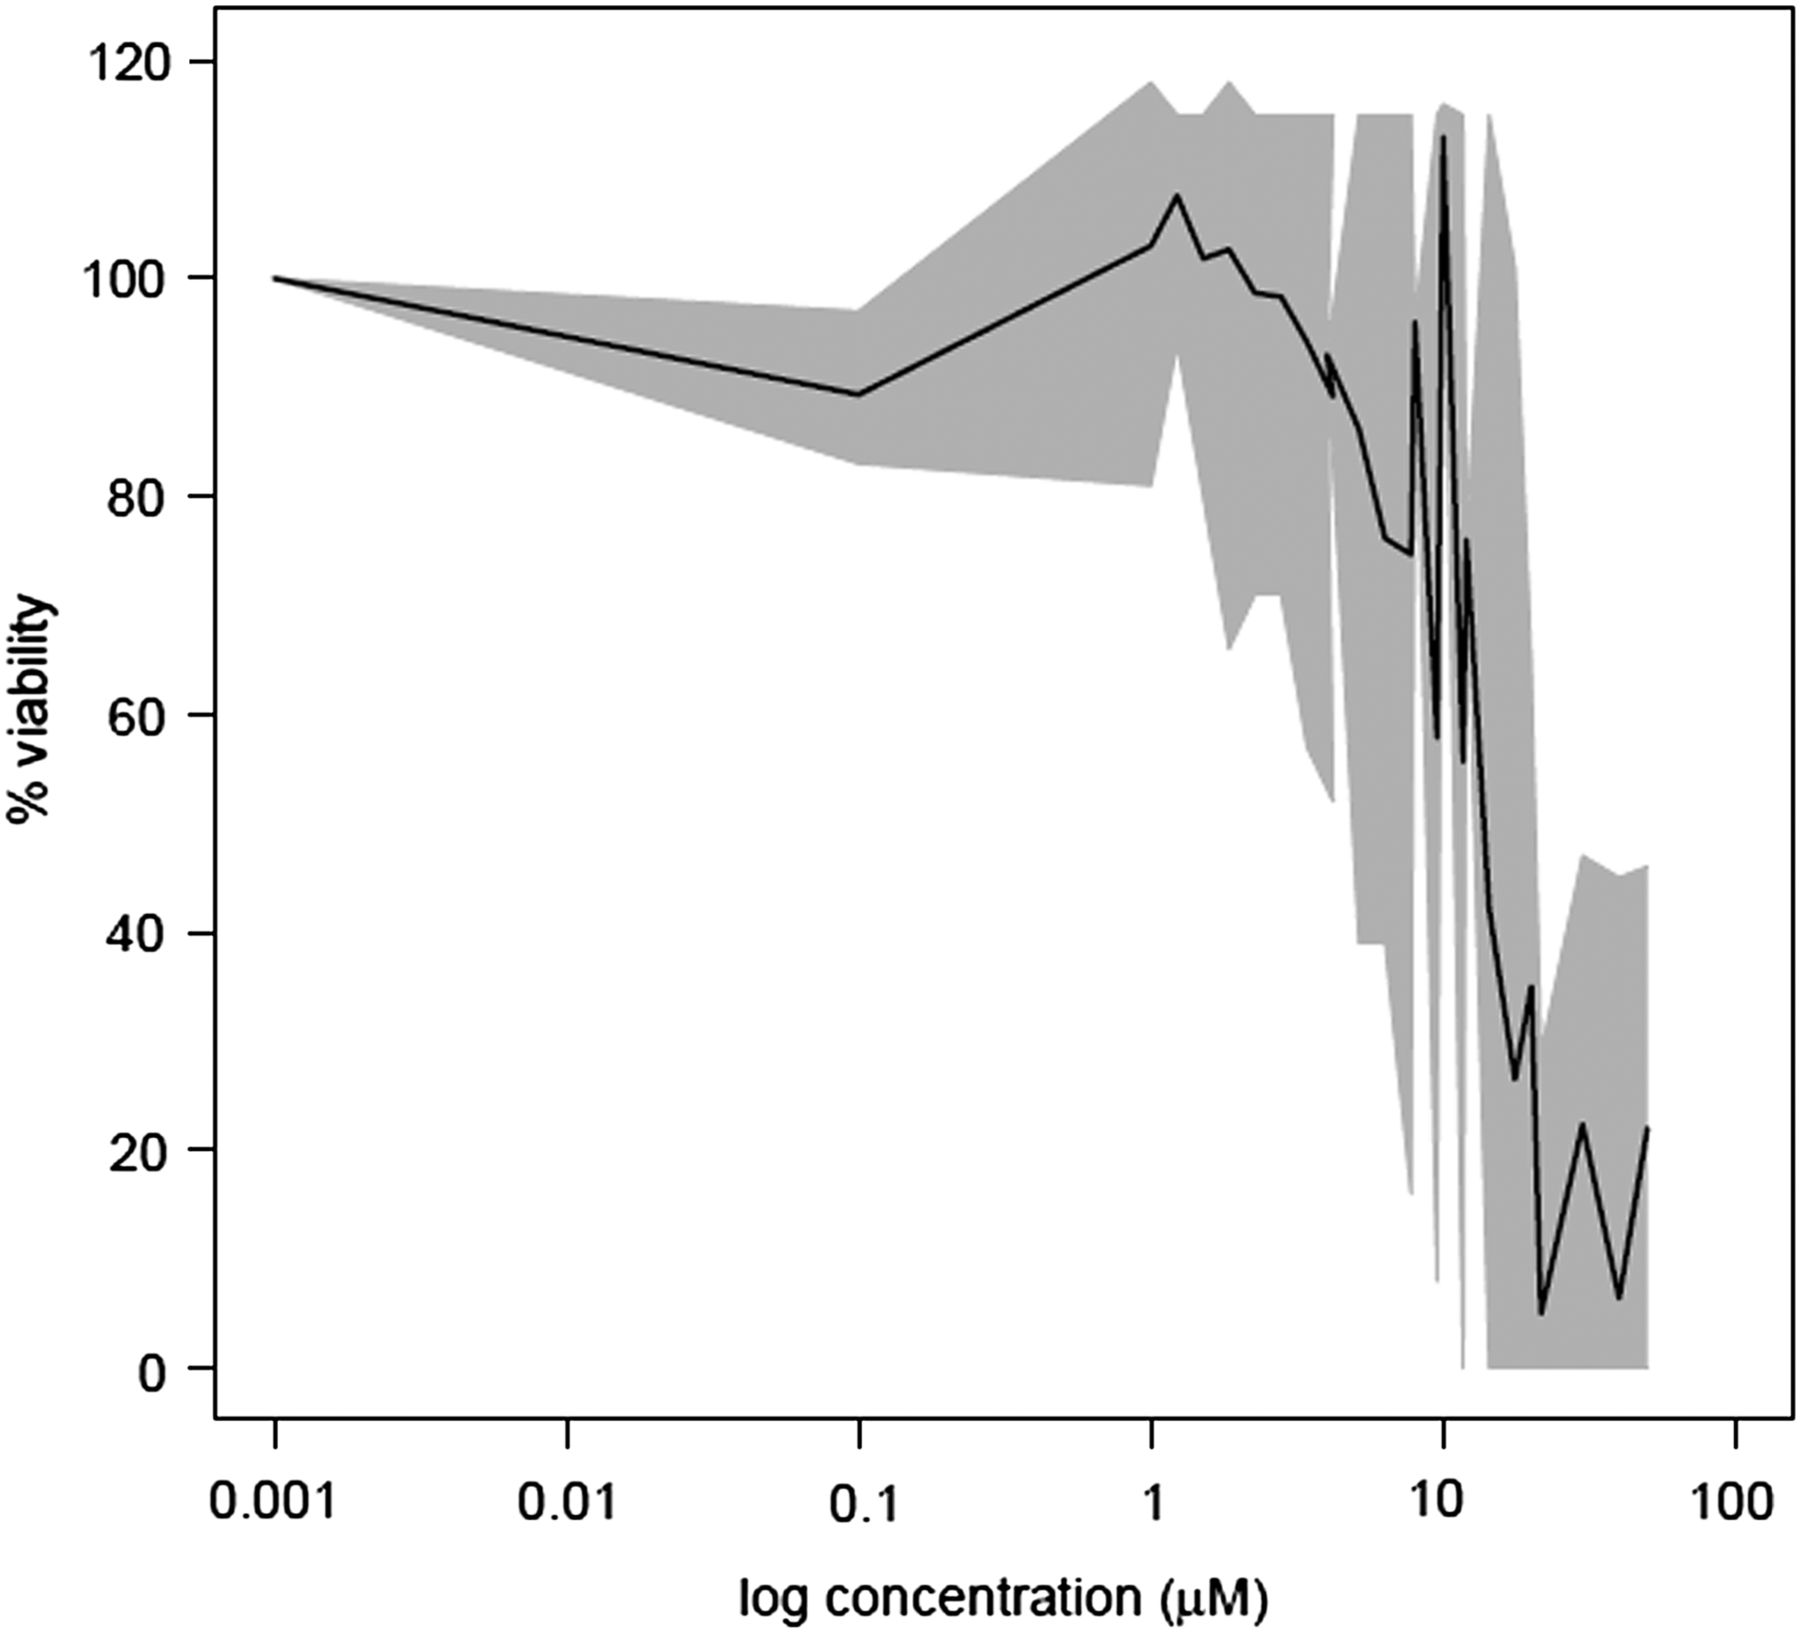
To determine the TC10 of CPZ in PHH, a preliminary cytotoxicity experiment was performed using a range of CPZ concentrations. Cell viability was assessed after short-term (1 day and 3 days) and long-term (14 days) CPZ repeat daily exposure. A large inter-donor variability in the response to CPZ cytotoxicity was observed, since the TC10 varied between 1 and 18 µM and TC50 between 3 and 35 µM from 13 donors after 3 days of treatment (Fig. 1) and ranged between 0.2 and 1 µM in three donors treated daily for up to 14 days. As this range of concentrations corresponded to reported Cmax in patients (0.16 µM) (Borges et al., 2011), PHHs (n = 5) were treated with 0.1 or 0.2 µM, i.e., TC10, and either 1 µM (n = 2), i.e., 10-fold TC10, or 0.02 µM (n = 3) CPZ, i.e., one-tenth of TC10.

Toxicity of CPZ after 3 days of treatment. The black line represents mean viability of 13 donors (in percentage of untreated control). The gray area reflects variability between the 13 donors, with area borders illustrating minimum and maximum viability of the donors. Viability was assessed by MTT or resazurin assays (see Materials and Methods).
Hepatotoxicity Signatures of CPZ.
A total of 34,693 genes were included in the transcriptomic analysis. Figure 2 shows a large variability between donors as well as between treatment times with respect to the total number of gene expression changes. With respect to short-term treatment, the total number of gene expression changes for a given donor ranged between 8 and 1062 genes after 1 day of treatment, and between 22 and 188 genes after 3 days of treatment. After 14 days of repeated treatment, the total number of gene expression changes per donor varied between 32 and 1499. The number of common genes deregulated at each time point for a given donor varied between 0 and 9, suggesting little biological significance for these genes. Indeed, these were pseudogenes and genes involved in cellular homeostasis (e.g., PCK1 [phosphoenolpyruvate carboxykinase 1] and HNRNPA2B1 [heterogeneous nuclear ribonucleoprotein A2/B1]) that were not included in the hepatic signatures described hereafter. This large variability indicates that a global analysis of gene expression data only makes sense when looking at each donor in isolation. Therefore, when looking into specific pathways of hepatotoxicity, we analyzed the five donors and the three CPZ treatment times individually.

Bar plot representing the total number of genes which changed at least a 2-fold (as compared with untreated control) for the five PHH cultures after 1, 3, and 14 days at 0.1 or 0.2 µM CPZ treatment.
First, functional analysis with IPA software was conducted on the whole gene expression profiles. Several hepatotoxicity signatures of CPZ at 0.1 or 0.2 µM were identified (Table 2). Cholestasis, fibrosis, hepatitis, inflammation, liver proliferation, necrosis, glutathione (GSH) depletion, and steatosis were identified after both short-term (1 or 3 days) and long-term (14 days) CPZ treatment, whereas genes related to the pathway giving rise to a signature of cirrhosis were deregulated only after 14 days.
Transcriptomic signature of PHH after short-term (1 or 3 days) and long-term (14 days) treatment with 0.02 µM (3 donors), 0.1–0.2 µM (5 donors), or 1 µM (2 donors) CPZ
These signatures were obtained with Ingenuity Pathway Analysis software. A specific pathway was selected when highlighted with a P value <0.05 in at least 2, 3, or 1 donor.
These IPA-derived hepatic signatures were thereafter expanded by further deregulated genes known to be involved in liver toxicity, as illustrated in Fig. 3. Signatures of liver inflammation/hepatitis, liver proliferation, and cholestasis were present in all donors. Cholestasis-related genes were observed as early as the first exposure, and in all five donors, this effect was maintained over the entire treatment time. Signatures of fibrosis/cirrhosis and steatosis were present in four of five donors, and steatosis was represented with a minimum of one deregulated gene after short-term treatment and two deregulated genes after prolonged treatment. Necrosis/GSH depletion/oxidative stress was present in three of five donors.
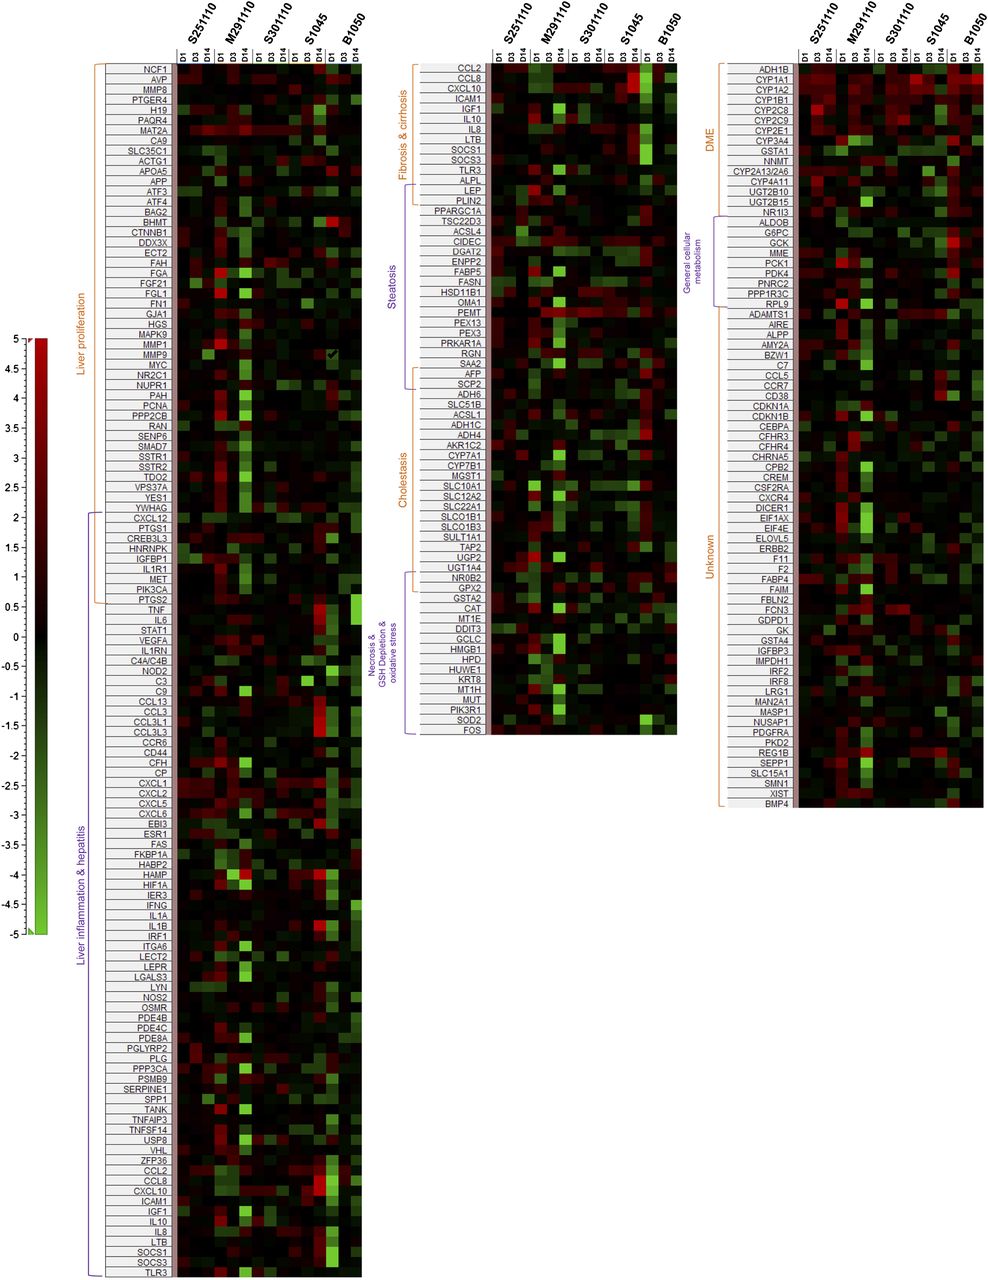
Heat map illustrating fold change values [red: upregulation; green: downregulation; black: (−1.3, 1.3)] of genes involved in hepatic signatures that were generated for five PHH donors treated after 1, 3, and 14 days at 0.1–0.2 µM CPZ.
Even though the hepatotoxicity signatures were present to some degree in all donors, differences could be highlighted. For example, PHH donor S251110 showed signs of necrosis only after short-term treatment with CPZ but no signs of fibrosis/cirrhosis, indicating only transient effects. PHH donor S301110 showed signs of fibrosis only after short-term treatment and no signs of cirrhosis, whereas liver inflammation appeared only after long-term treatment and no signs of necrosis were seen. PHH donor S1045 gave no signs of steatosis or necrosis. PHH donor B1050 showed no induction of steatosis after long-term treatment. PHH donor M291110 was the only donor showing all hepatic signatures after both short- and long-term CPZ treatment.
To better capture the time-dependent and donor-dependent hepatotoxicity response to CPZ treatment, we compared the number of gene expression changes across hepatic signatures, donors, and treatment times (Fig. 4). The number of gene expression changes after 3 days of treatment was less pronounced in all of five PHH donors as compared with 1 or 14 days of treatment.
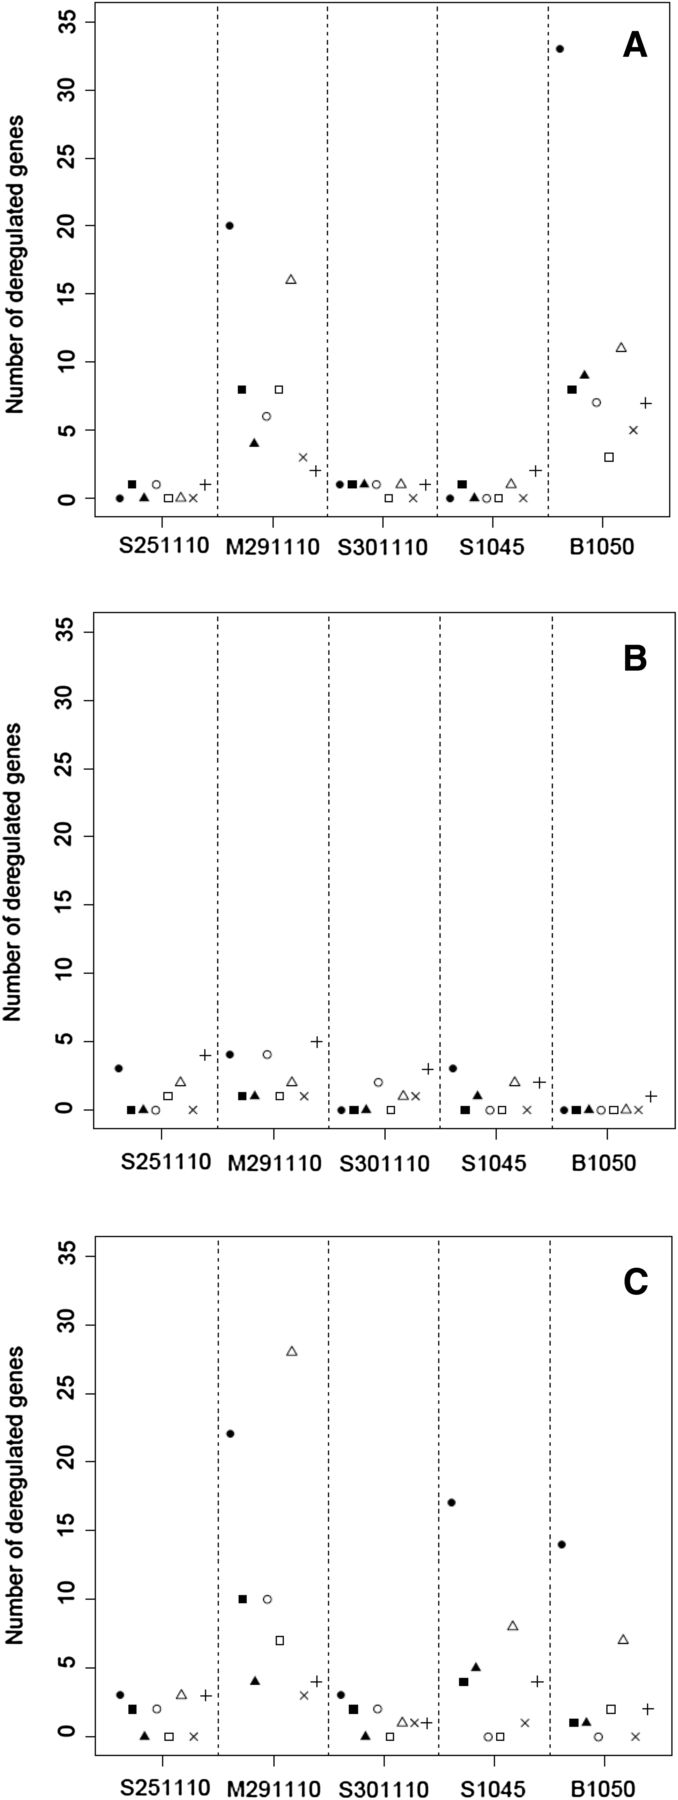
Number of up- or downregulated genes per hepatic signature (●, inflammation and hepatitis; ▪, cholestasis; ▴, fibrosis and cirrhosis; ○, steatosis; □, necrosis, GSH depletion, and oxidative stress; ×, general cellular metabolism; +, DME [drug metabolizing enzymes]) obtained for the five PHH cultures after 1 day (A), after 3 days (B), and after 14 days (C) of treatment with 0.1 or 0.2 µM CPZ.
Of particular relevance was the fact that at 1 and 14 days of CPZ treatment, donors with a large number of gene changes related to liver inflammation/hepatitis (M291110 and B1050) also showed large numbers of gene changes related to other specific hepatotoxic signatures.
With treatment concentrations of 0.02 µM [i.e., one-tenth of Cmax (n = 3)], fewer gene changes were observed, and with 1 µM [i.e., 10-fold Cmax (n = 2)], more gene changes were observed, but 85 and 66% of those genes were also deregulated with Cmax (0.1 or 0.2 µM) treatment concentrations, respectively (data not shown). Therefore, we can conclude that whatever the concentration used, the hepatic signatures were overall similar (Table 2), indicating that we could not define a concentration that did not induce adverse effects. Genes related to necrosis, GSH depletion, steatosis, fibrosis, cholestasis, inflammation, hepatitis, and liver proliferation pathways were deregulated after both short- and long-term treatment. Signs of cirrhosis were observed after both short- and long-term treatment with 1 µM CPZ, whereas at 0.1 and 0.2 µM, signs of cirrhosis appeared only after 14 days of treatment.
Discussion
After a 14-day treatment period with increasing concentrations of CPZ, the highest non-cytotoxic concentration observed in PHH was between 0.2 and 1 µM. These results are in accordance with the TC50 (9 ± 6 µM after 48 hours of treatment in PHH) reported by Gerets et al. (2012). The fact that these concentrations of CPZ are close to the reported Cmax levels in humans (Borges et al., 2011) prompted us to choose PHH repeat-treatment concentrations of 0.1 or 0.2 µM (n = 5), as well as one-tenth (0.02 µM, n = 3) and the 10-fold concentration (1 µM, n = 2) for transcriptomics analysis.
In the present study, we found that, after 3 days of treatment, fewer gene changes were induced compared with days 1 and 14. We have previously described that genes deregulated after 24 hours of treatment are not automatically deregulated after 72 hours, and this could represent an adaptation phase after the primary acute response on day 1 (Richert et al., 2009). Nevertheless, repeat exposure for up to 14 days provided valuable additional information in some donors (S251110, M291110, and S1045) and gave further insight into the mechanism of long-term CPZ-induced hepatotoxicity.
The CYP1A gene, one of the main P450s involved in CPZ metabolism (Wojcikowski et al., 2010) and producing a metabolite more toxic than the parent (Tavoloni and Boyer, 1980), was found to be upregulated in the present study after the first day and up to 14 days of treatment at 0.1 and 0.2 µM (2-fold) and 1 µM (3-fold) in PHHs. However, other mechanisms than increased CYP1A1/2-reactive metabolite formation are involved in CPZ cytotoxicity toward human hepatocytes, since a similar increase was observed in rat hepatocytes exposed to 1 µM CPZ without any overt signs of cytotoxicity (unpublished data). Interindividual CYP2D6-dependent reactive metabolite formation seems not to be directly related to toxicity. Indeed, donor B1050 displayed the highest expression in CYP2D6 (between 3- and 9-fold that of the other four donors) and a CYP2D6 activity of 1.5 pmol/min/mg cell protein compared with 0.5 pmol/min/mg cell protein for donor S1045, but was not more susceptible to CPZ toxicity than the latter (see later discussion).
The global hepatic signature obtained after 0.1 or 0.2 µM CPZ treatment generated using the IPA software was comparable in the five PHH cultures. Cholestasis is the main form of hepatotoxicity described in patients treated with CPZ, with an incidence of 1%–2% after treatment with therapeutic doses (Boelsterli et al., 1987; Regal et al., 1987). In all five donors, the gene expression changes are indicative of, according to IPA analysis, the cholestasis pathway. The hepatocyte uptake transporter sodium-taurocholate cotransporting polypeptide (SLC10A1) has been described to be downregulated during cholestasis (Lee and Boyer, 2000; Zollner et al., 2001). In the present study, sodium-taurocholate cotransporting polypeptide (SLC10A1) was downregulated in three of five donors after the first day of treatment at 0.02 and 0.2 µM (M291110 and S301110) and after 14 days of treatment at 0.1 µM (S1045). Organic cation transporter (SLC22A1) was downregulated in two of five PHH donors exposed to short-term (M291110) and long-term (S1045) 0.1 or 0.2 µM CPZ. The expression of the hepatocyte efflux transporter bile salt export pump (BSEP; ABCB11) has been reported to be either decreased (Zollner et al., 2001) or not affected (Lee and Boyer, 2000; Demeilliers et al., 2006) in patients with liver cholestasis. In the present study, BSEP, P-glycoprotein (ABCB1), and breast cancer resistance protein (ABCG2) were not transcriptionally deregulated at any treatment time in any of the donors after CPZ treatment. Since CPZ is known to inhibit uptake transporters, such as organic cation transporter 1 (SLC22A1) and efflux transporters such as BSEP (ABCB11), P-glycoprotein (ABCB1), and breast cancer resistance protein (ABCG2) (Pedersen et al., 2008), the results of the present study suggest a cellular feedback regulation at the transcriptional level of the uptake, but not secretory transporter proteins, to counteract the inhibition of canalicular transport of bile acids. Downregulation of CYP7A1, which is a major P450 involved in bile acid synthesis (Demeilliers et al., 2006), has also been described in cholestatic patients. CYP7A1 was deregulated in three of five donors and upregulated in two donors after short-term (B1050) or long-term treatment (S251110) and downregulated in M291110 after long-term treatment. Taken together, these data highlight feedback regulations at the transcriptional level by human hepatocytes exposed to CPZ, reflecting their attempts to reverse disturbances in bile acid homeostasis.
Fibrosis degenerating into cirrhosis was also described in patients with a lower sulfoxidation capacity (Larrey and Pageaux, 1997; Brind, 2007). Indeed, sulfoxidation mediates CPZ detoxification (Wojcikowski et al., 2010), and a poor capacity of sulfoxidation leads to an accumulation of toxic metabolites that could cause fibrosis and, eventually, cirrhosis. From the five studied PHH donors, two (M291110 and S301110) displayed transcriptional signs of fibrosis at both 0.02 and 0.2 µM with no signs of cirrhosis, whereas in two other donors (S1045 and B1050), fibrosis and cirrhosis were highlighted after both short- and long-term treatment, which might suggest a poor capacity of sulfoxidation in these donors. Our data did not indicate expression changes of genes involved in sulfoxidation, suggesting that changes at the post-translational level, not measurable by transcriptomics, might possibly lead to these adverse effects.
Signs of liver steatosis were also evident in PHH cultures treated with CPZ: upregulation of the CYP2E1 gene in three of five donors (M291110, S301110, S1045) and of the CYP4A11 gene in two of five donors (M291110 and S301110), two markers involved in lipid metabolism and known to be induced in patients with steatohepatitis (Jansen, 2004).
In the present study, transcriptomic data showed gene expression changes related to signs of necrosis, possibly due to the treatment with a concentration close to the TC10, thus causing cell damage. S251110 PHH culture showed signs of necrosis only after short-term treatment, whereas M291110 and B1050 showed these signs after both short- and long-term treatment. Liver regeneration has been described to be a defense mechanism of the liver to cytotoxicity (Lee, 2003; Hinson et al., 2010). The early signaling components tumor necrosis factor α (TNFα) and interleukin-6 (IL-6) secretion are known to cause upregulation of genes involved in liver regeneration, such as STAT1 (signal transducer and activator of transcription 1), MAPK (mitogen-activated protein kinase), or IGFBP1 (insulin-like growth factor binding protein 1), and upregulation of vascular endothelial growth factor gene (Li et al., 2002). In the present study, a strong upregulation of IL-6 was accompanied by an upregulation of MAPK9, IGFBP1, IL1RN, and vascular endothelial growth factor A (M291110) or STAT1 (S1045), whereas downregulation of TNFα and IL-6 genes was accompanied by a downregulation of IGFBP1, IL1RN, and STAT1 genes (B1050). All of these genes involved in liver regeneration were hardly affected when early signaling was not or only slightly deregulated (S251110 and S301110).
IL-6 and TNFα are also widely described to promote inflammatory events through the expansion and activation of T cells, differentiation of B cells, and the induction of acute-phase reactants by hepatocytes (Jones et al., 2001). TNFα gene polymorphisms are known to result in variable TNF production, which leads to interindividual drug toxicity in humans (Louis et al., 1998). Interestingly, when an inflammatory event was induced prior to CPZ treatment, cholestasis could be induced in rats (Buchweitz et al., 2002). In the present study, upregulation of IL-6 gene expression (M291110 and S1045) was accompanied by an upregulation of the IL-8 gene, another interleukin induced during liver inflammation, as well as several chemokines and chemokine receptors, such as CCL2 [chemokine (C-C motif) ligand 2] or CXCL2 [chemokine (C-X-C motif) ligand 2] genes. When the IL-6 gene was downregulated (B1050), many chemokine and receptor genes were also downregulated, and when the IL-6 gene was not deregulated (S251110 and S301110), no other genes of this IL-6 dependent inflammatory pathway were deregulated. It is also noteworthy that donors with TNF/IL-6–deregulated pathways (M291110, S1045, and B1050) presented more genes deregulated in other pathways, including cholestasis and fibrosis/cirrhosis. Taken together, these results support the hypothesis that features of inflammation could be related to the idiosyncratic effects of CPZ (Roth et al., 2003).
In summary, short- and long-term in vitro exposure of PHHs to CPZ at concentrations close to human Cmax (0.1 or 0.2 µM) induced six hepatotoxicity-related transcriptomic signatures: cholestasis, fibrosis/cirrhosis, liver proliferation, necrosis, liver inflammation/hepatitis, and steatosis. Interdonor variability in the inflammatory response of human hepatocyte cultures to CPZ treatment was associated with variability in the strength of these transcriptomic hepatoxicity signatures. Taken together, these results further suggest that features of inflammation could be related to the idiosyncratic hepatotoxic effects of CPZ in humans, and that pathway-specific analysis of gene expression profiles in individual human donor hepatocytes is associated with increased susceptibility to toxic effects of drugs.
Acknowledgments
The authors thank Claudia Klement (Non-Clinical Safety, Merck Serono, Merck KGaA) for processing the cell homogenates and running the Illumina BeadChips. The authors thank Dr. Thomas Zaccharias, Philippe Bachellier and Bruno Heyd for providing liver biopsies.
Authorship Contributions
Participated in research design: Parmentier, Truisi, Stanzel, Richert.
Conducted experiments: Parmentier, Truisi, Alexandre.
Contributed new reagents or analytic tools: Moenks, Lukas, Truisi.
Performed data analysis: Parmentier, Truisi, Stanzel, Kopp-Schneider, Moenks.
Wrote or contributed to the writing of the manuscript: Parmentier, Richert, Truisi, Mueller, Stanzel, Kopp-Schneider, Lukas, Alexandre, Hewitt.
Footnotes
- Received April 19, 2013.
- Accepted August 2, 2013.
This work was supported by EC FP7 (European Commission Seventh Framework Programme) Health Predict-IV “Profiling the toxicity of new drugs: A nonanimal-based approach integrating toxicodynamics and biokinetics” [Grant 202222].
C.P. and G.L.T. contributed equally to the work presented in this manuscript.
↵
 This article has supplemental material available at dmd.aspetjournals.org.

Abbreviations
- BSEP
- bile salt export pump
- CPZ
- chlorpromazine
- DMSO
- dimethylsulfoxide
- FBS
- fetal bovine serum
- GSH
- glutathione
- IL
- interleukin
- IPA
- Ingenuity Pathways Analysis
- MTT
- 3-(4,5-dimethylthiazol-2-yl)-2,5-diphenyltetrazolium bromide
- P450
- cytochrome P450
- PHH
- primary human hepatocytes
- RT
- room temperature
- TC10
- 10% decrease in cell viability
- TNFα
- tumor necrosis factor α
- Copyright © 2013 by The American Society for Pharmacology and Experimental Therapeutics


