


Abstract
Drug–drug interactions (DDIs) caused by the inhibition of hepatic uptake transporters such as organic anion transporting polypeptide (OATP) can affect therapeutic efficacy and cause adverse reactions. We investigated the potential utility of pitavastatin as an in vivo probe substrate for preclinically studying OATP-mediated DDIs using cynomolgus monkeys. Cyclosporine A (CsA) and rifampicin (RIF), typical OATP inhibitors, inhibited active uptake of pitavastatin into monkey hepatocytes with half-maximal inhibitory concentration values comparable with those in human hepatocytes. CsA and RIF increased the area under the plasma concentration–time curve (AUC) of intravenously administered pitavastatin in cynomolgus monkeys by 3.2- and 3.6-fold, respectively. In addition, there was no apparent prolongation of the elimination half-life of pitavastatin due to the decrease in both hepatic clearance and volume of distribution. These findings suggest that DDIs were caused by the inhibition of hepatic uptake of pitavastatin. CsA and RIF increased the AUC of orally administered pitavastatin by 10.6- and 14.8-fold, respectively, which was additionally caused by the effect of the CsA and RIF in the gastrointestinal tract. Hepatic contribution to the overall DDI for oral pitavastatin with CsA was calculated from the changes in hepatic availability and clearance, and it was shown that the magnitude of hepatic DDI was comparable between the present study and the clinical study. In conclusion, pharmacokinetic studies using pitavastatin as a probe in combination with drug candidates in cynomolgus monkeys are useful to support the assessment of potential clinical DDIs involving hepatic uptake transporters.
Introduction
Drug–drug interactions (DDIs) caused by the inhibition of drug transporters can increase the risk of adverse events along with the inhibition of drug-metabolizing enzymes. In this decade, transporter-mediated DDIs in humans have drawn considerable attention, and the study of transporters has yielded a substantial amount of literature, including many comprehensive reviews (Mizuno et al., 2003; Shitara and Sugiyama, 2006). In particular, several reports have focused on clinically relevant DDIs involving organic anion transporting polypeptide (OATP)-mediated inhibition of hepatic uptake (Kalliokoski and Niemi, 2009; Maeda et al., 2011). OATP1B1 and OATP1B3 are mainly expressed in the sinusoidal membrane of human hepatocytes and play an important role in the hepatic uptake of their substrate drugs. A typical example of OATP-mediated DDI is between cerivastatin and cyclosporine A (CsA). In this interaction, the area under the plasma concentration–time curve (AUC) of cerivastatin increased by 3.8-fold (Mück et al., 1999). It has been suggested that DDI was caused by the inhibition by CsA on at least partly OATP1B1-mediated uptake of cerivastatin in the liver (Shitara et al., 2003). Another OATP inhibitor, rifampicin (RIF), also increased AUC of atorvastatin by 6.8-fold in healthy volunteers (Lau et al., 2007). In 2012, draft guidance from the U.S. Food and Drug Administration (FDA) and guidelines from the European Medicines Agency stated the importance of DDIs related to the inhibition of OATP1B1 and OATP1B3 (CDER, 2012; CHMP, 2012).
In vitro assay systems are well established and have been used to assess the potential for OATP1B1 and OATP1B3 inhibition of drug candidates. To assess the clinical significance of OATP1B1 and OATP1B3 inhibition, it is also helpful to investigate pharmacokinetic alterations of a coadministered drug substrate in a suitable in vivo animal model in the early stage of the drug development process. For rodents and dogs, useful models have not been proposed partly because OATP1B1 shares only 64/65% and 69% amino acid sequence identities with its rat/mice ortholog Oatp1b2 and dog ortholog Oatp1b4, respectively (Hagenbuch and Meier, 2004; Gui and Hagenbuch, 2010). However, high levels of homology among gene and amino acid sequences (>95% and >93%, respectively) have recently been reported for OATP1B1 and OATP1B3 between humans and cynomolgus monkeys (White et al., 2006; Ebeling et al., 2011; Utoh et al., 2012). In in vitro functional characterization studies, it has been suggested that cynomolgus monkey OATP1B1, OATP1B3 substrate and inhibitor profiles were similar to those of humans (White et al., 2006; Maeda and Sugiyama, 2010; Shen et al., 2013). Hence, monkeys may be useful as a preclinical in vivo DDI model involving OATP inhibition. Previously, we reported that clinical DDIs related to P-glycoprotein (P-gp)-mediated transport and cytochrome P450 3A (CYP3A)-mediated metabolism were reproduced in cynomolgus monkeys (Ogasawara et al., 2007, 2009a, b; Ohtsuka et al., 2010). Tahara et al. (2006) reported that monkeys (rather than rats) were useful for predicting the DDI risks involving renal tubular transport in humans.
Our study investigated DDIs related to OATP-mediated inhibition of hepatic uptake using cynomolgus monkeys as a preclinical in vivo model. We used pitavastatin (a known human OATP substrate) as a probe. For pitavastatin, it has been suggested that OATP1B1-mediated hepatic uptake is the major elimination pathway in humans (Hirano et al., 2004). First, using monkey hepatocytes, we investigated the in vitro active uptake of pitavastatin and the effects of the typical OATP inhibitors CsA and RIF to evaluate the substrate as a potential in vivo probe for studying DDIs involving OATP-mediated hepatic uptake in monkeys.
The usefulness of cynomolgus monkeys to assess DDIs using rosuvastatin as an OATP substrate has been reported (Shen et al., 2013). However, those investigators used only orally administered rosuvastatin in combination with an OATP inhibitor, where the fraction absorbed and the intestinal availability of rosuvastatin were not known; therefore, it was not possible to estimate alterations associated only with the effect in the liver. In our study, we investigated the effects of CsA and RIF on the pharmacokinetics of pitavastatin after an intravenous dose to cynomolgus monkeys to show a significant contribution of the inhibition of hepatic uptake to the observed DDIs. In addition, we analyzed the effects of CsA and RIF on the pharmacokinetic changes of oral pitavastatin to ascertain the hepatic and prehepatic contribution to DDIs in monkeys.
Materials and Methods
Materials
Pitavastatin calcium was synthesized by Mitsubishi Tanabe Pharma Corporation (Osaka, Japan). [3H]Pitavastatin calcium (5 Ci/mmol) was purchased from American Radiolabeled Chemicals (St. Louis, MO). Atorvastatin hemicalcium was obtained from Tocris Bioscience (Bristol, UK) as the internal standard for pitavastatin analysis. Neoral was purchased from Novartis Pharma (Basel, Switzerland). CsA was obtained from Sigma–Aldrich (St. Louis, MO). Cyclosporine D was purchased from Toronto Research Chemicals (North York, ON, Canada) as the internal standard for CsA analysis. Oligonucleotides were synthesized by Greiner (Tokyo, Japan). Cryopreserved hepatocytes from humans (one donor) and cynomolgus monkeys (pooled from three animals) were provided by XenoTech (Lenexa, KS). All other reagents and solvents were of an analytic grade and were available commercially.
Animals
Animal experiments were conducted in Shin Nippon Biochemical Laboratories with prior approval from the Animal Ethics Committee. Male cynomolgus monkeys (4–6 kg) were supplied by Guangxi Grandforest Science Primate Company, Ltd. (Guangxi, China). The monkeys were housed in a temperature- and humidity-controlled room with a 12-hour light/dark cycle. The animals were fed a standard animal diet (HF Primate 5K91 12G 5K9J; Purina Mills, LLC, Vandalia, IL), and food was provided ad libitum, except during the overnight periods before dosing. If overnight fasting was employed, food was provided after 4-hour blood samples were obtained.
Quantification of OATP Transporter mRNA
Expression of cynomolgus monkey OATP1B1, OATP1B3, and OATP2B1 mRNAs was measured using total RNA extracted from liver samples by real-time reverse-transcription polymerase chain reaction (PCR), as described previously elsewhere (Uno et al., 2006). Briefly, reverse-transcription reactions were performed in a mixture containing 1 μg of total RNA, oligo (dT), and SuperScript III RT reverse transcriptase (Invitrogen, Carlsbad, CA) at 50°C for 1 hour, and a 25th of the reaction was used for the subsequent PCR. PCR amplification was conducted in a total volume of 20 ml using SYBR Green PCR Master Mix (Applied Biosystems, Foster City, CA) with the ABI PRISM 7500 sequence detection system (Applied Biosystems), according to the manufacturer’s protocols. The primers were used at the final concentrations of 300 nM, including 5′-CAATCATGGACCAAAATAAACATTTGGA-3′ and 5′-TTTCTCCCCTTAATAATGTGTTTCACTATCTG-3′ for OATP1B1, 5′-CAGCAATTAAAAACGTTCACATGGTATCTGTAG-3′ and 5′-GTTAGTTGGCAGCAGCATTGTCTTG-3′ for OATP1B3, and 5′-GTCTGGAGCTCCCACCATTATTGC-3′ and 5′-GTGGAGGAGCCAGAATGGAACACA-3′ for OATP2B1. To determine the relative expression level, the raw data were normalized with the 18S ribosomal RNA level based on three independent amplifications.
In Vitro Studies Using Cryopreserved Hepatocytes
Monkey and human cryopreserved hepatocytes were thawed and resuspended in Krebs–Henseleit buffer to give a cell density of 2.0 × 10⁶ viable cells/ml. The number of viable cells was determined by trypan blue staining. Before the uptake studies, cell suspensions were prewarmed in an incubator at 37°C for 2 minutes. Uptake studies were initiated by adding an equal volume of buffer containing radiolabeled pitavastatin with or without CsA and RIF to the cell suspension (final concentration of pitavastatin, 0.2 μM; final concentration of CsA, 0.1–10 μM; final concentration of RIF, 0.1–30 μM). After incubation at 37°C until the end of the incubation period, 100 μl of the incubation mixture was collected and placed in a centrifuge tube containing 100 μl of 2 M NaOH under a layer of 100 μl of oil (Hepatocyte Transporter Suspension Assay Kit; BD Biosciences, San Jose, CA), and the sample tube was subsequently centrifuged to separate hepatocytes. During this process, hepatocytes passed through the oil layer into the alkaline solution. After overnight incubation in alkali to dissolve hepatocytes, the centrifuge tube was cut and each compartment was transferred to a scintillation vial. The compartment containing dissolved cells was neutralized with 100 μl of 2 M HCl, and mixed with a scintillation cocktail. The radioactivity was measured in a liquid scintillation counter.
In Vivo Studies
The intravenous and oral dosing solutions of pitavastatin were prepared in saline and 0.5% (w/v) hydroxypropylcellulose aqueous vehicle, respectively. For the dosing solutions of CsA, Neoral Oral Solution (100 mg/ml) was used. The dosing solutions of RIF were prepared in saline containing 10% (v/v) 0.1 M hydrochloric acid. Four animals received pitavastatin alone intravenously at 0.1 and 0.3 mg/kg and orally at 0.3 mg/kg with at least a 1-week washout period to obtain the control values of the pharmacokinetic parameters.
The dose of orally administered pitavastatin to cynomolgus monkeys was selected to achieve similar plasma concentrations to those at the clinical dose (Hasunuma et al., 2003). CsA and RIF were orally administered at doses of 75 and 20 mg/kg, respectively, which were administered 4 hours and 1 hour before intravenous and oral administration of pitavastatin at 0.3 mg/kg, respectively. For the evaluation of recovery, we administered pitavastatin orally 2 weeks after the treatment with CsA and found that the pharmacokinetic parameters of pitavastatin returned to near baseline levels. Therefore, the treatment with inhibitors was followed by at least a 2-week washout period before animals were used for the next experiment.
For all studies, blood was collected from the femoral vein into a heparinized syringe at predose and at 15 and 30 minutes as well as at 1, 2, 4, 6, 8, 10, 24, 48, 96, and 120 hours after pitavastatin administration. Blood was also collected 5 minutes after intravenous administration of pitavastatin. Blood was stored frozen until analysis of CsA. Plasma was separated from blood by centrifugation and stored frozen until analysis of pitavastatin. Urine was collected for 24 hours on ice after intravenous administration of pitavastatin alone at 0.3 mg/kg. The volume of the collected urine was measured, and the urine was frozen until analysis of pitavastatin.
Analytic Procedure
Determination of Pitavastatin Concentration in Plasma or Urine Samples.
We added 10 μl of 50% (v/v) acetonitrile aqueous solution and 500 μl of internal standard solution (acetonitrile containing 20 ng/ml atorvastatin) to 100-μl aliquots of plasma samples or 150-μl aliquots of urine samples. After the mixtures were centrifuged, 100 μl of supernatants was added to 100 μl of 10 mM ammonium formate solution (pH 3.0). Pitavastatin concentrations were determined using an LC10A chromatography system (Shimadzu, Kyoto, Japan) and an API 3000 mass spectrometer (AB SCIEX, Framingham, MA). Reverse-phase chromatographic separation was achieved on a CAPCELL PAK C18 MGII column (2.0 × 150 mm, 5.0-μm particle size; Shiseido, Tokyo, Japan). The mobile phase consisted of 10 mM ammonium formate, pH 3.0 (A) and acetonitrile (B). The column was kept at 40°C. The conditions for elution and flow rate for plasma samples were as follows: 85% B and 0.2 ml/min (0.0–4.0 minutes), 100% B and 0.4 ml/min (4.0–6.0 minutes), and 85% B and 0.4 ml/min (6.0–8.0 minutes). The flow rate for urine samples was 0.4 ml/min. The gradient conditions for elution were as follows: 40% B (0.0–1.0 minutes), 40–75% B (1.0–7.0 minutes), and 100% B (7.0–10.0 minutes), The mass spectrometer was operated in positive mode using electrospray ionization at a capillary voltage of 5.5 kV and at a source temperature of 300°C. Declustering potential, focusing potential, and entrance potential were 60, 230, and −10, respectively, for pitavastatin and atorvastatin. The mass transition and collision energy of pitavastatin were m/z 442→290 and 40 eV, respectively, and those of atorvastatin were m/z 559→440 and 32 eV, respectively, in multiple reaction monitoring.
Determination of CsA Concentration in Blood Samples.
In total, 30 μl of methanol/acetonitrile (1:1, v/v), 150 μl of ultrapure water, and 150 μl of aqueous 0.1 M zinc sulfate solution were added to 30-μl aliquots of blood samples. After thorough mixing, 300 μl of internal standard solution (acetonitrile containing 20 ng/ml cyclosporine D) was added to the mixtures. The mixtures were centrifuged, and 40 μl of supernatants was added to 200 μl of ultrapure water/methanol/acetonitrile (2:1:1, v/v/v). CsA concentrations were determined using an LC10A chromatography system (Shimadzu) and an API 4000 mass spectrometer (AB SCIEX). Reverse-phase chromatographic separation was achieved on a CP ChromSpher column (2.0 × 150 mm; Varian Chrompack, Middelburg, the Netherlands). The mobile phase consisted of 10 mM ammonium formate, pH 3.0 (A) and methanol (B). The flow rate was 0.8 ml/min, and the column was kept at 65°C. The gradient conditions for elution were 30% B (0.0–1.5 minutes), 70% B (1.5–2.0 minutes), 70–97% B (2.0–2.1 minutes), 97% B (2.1–3.5 minutes), 97%−30% B (3.5–3.6 minutes), and 30% B (3.6–4.5 minutes). The mass spectrometer was operated in positive mode using electrospray ionization at a capillary voltage of 5.5 kV and at a source temperature of 400°C. The declustering potential and entrance potential were 80 and 25, respectively, for CsA and cyclosporine D. The mass transition and collision energy of CsA were m/z 1220→1202 and 25 eV, respectively, and those of cyclosporine D were m/z 1234→1216 and 25 eV, respectively, in multiple reaction monitoring.
Data Analysis
[3H]Pitavastatin uptake by cryopreserved hepatocytes was expressed as the uptake volume (μl/106 cells), given as the amount of radioactivity-associated cells (dpm/106 cells) divided by their concentrations in the incubation medium (dpm/μl). To determine the concentrations of CsA and RIF resulting in a 50% decrease in the uptake clearance (IC50), we first determined the uptake clearances (μl/106 cells/min) by dividing the uptake volume by the incubation time in monkey and human cryopreserved hepatocytes. IC50 was determined by nonlinear regression analysis using WinNonlin version 6.2.0.495 (Pharsight Inc., Mountain View, CA).
Peak plasma concentrations (Cmax) and the time to reach peak plasma concentrations (Tmax) were directly obtained by observation. Estimation of the terminal elimination rate constant (λ) was performed by log-linear regression of the last 3 or 4 concentration–time points. The terminal elimination half-life (t1/2) was calculated using the relationship t1/2 = 0.693/λ. The AUC was calculated using the trapezoidal rule up to the last measurable concentration, and AUC was extrapolated to infinity using the λ value unless stated otherwise. Total plasma clearance (CLtotal) was calculated as the intravenous dose divided by the AUC after intravenous administration (AUCiv). For intravenous administration, the steady-state volume of distribution (Vss) was calculated using Vss = MRT · CLtotal, with the mean residence time (MRT) defined as the area under the first moment of the plasma concentration–time profile divided by AUCiv. The bioavailability (F) was determined from the AUC after oral administration (AUCpo) divided by the AUCiv at each dose of 0.3 mg/kg. The nonhepatic contribution to the systemic clearance of pitavastatin was negligible; therefore, hepatic blood clearance was assumed to be equal to total blood clearance. The hepatic extraction ratio (EH) and hepatic availability (FH) were estimated by the following equations:
 where RB is the blood/plasma concentration ratio (0.74) (Pharmaceuticals and Medical Devices Agency, Japan, http://www.info.pmda.go.jp/shinyaku/P200300016/index.html) and QH is the hepatic blood flow rate (44 ml/min/kg) (Hosea et al., 2009). Oral bioavailability is a fraction absorbed (FA), intestinal availability (FG), and FH, as given by the following equation:
 The product of FA·FG is estimated as follows:
 The magnitude of DDI is expressed as an AUC ratio (AUC′/AUC) in the presence and absence of a perpetrator. In the case of oral administration of a victim drug, it is expressed by the following equation:
 Based on this equation, the value of (FH′/FH)·(CLtotal/CLtotal′) was calculated to obtain an estimate of the hepatic contribution to the overall magnitude of DDI for an orally administered victim drug.
Statistical Analysis
Pharmacokinetic parameters, with the exception of Tmax, were logarithmically transformed before statistical analysis. All statistical tests were performed using SAS software version 9.1.3 (SAS Institute, Cary, NC). Statistical differences in the pharmacokinetic parameters were calculated by a two-tailed paired Student’s t test. In all cases, P < 0.05 was considered statistically significant.
Results
Expression of Cynomolgus Monkey OATP mRNAs in Liver.
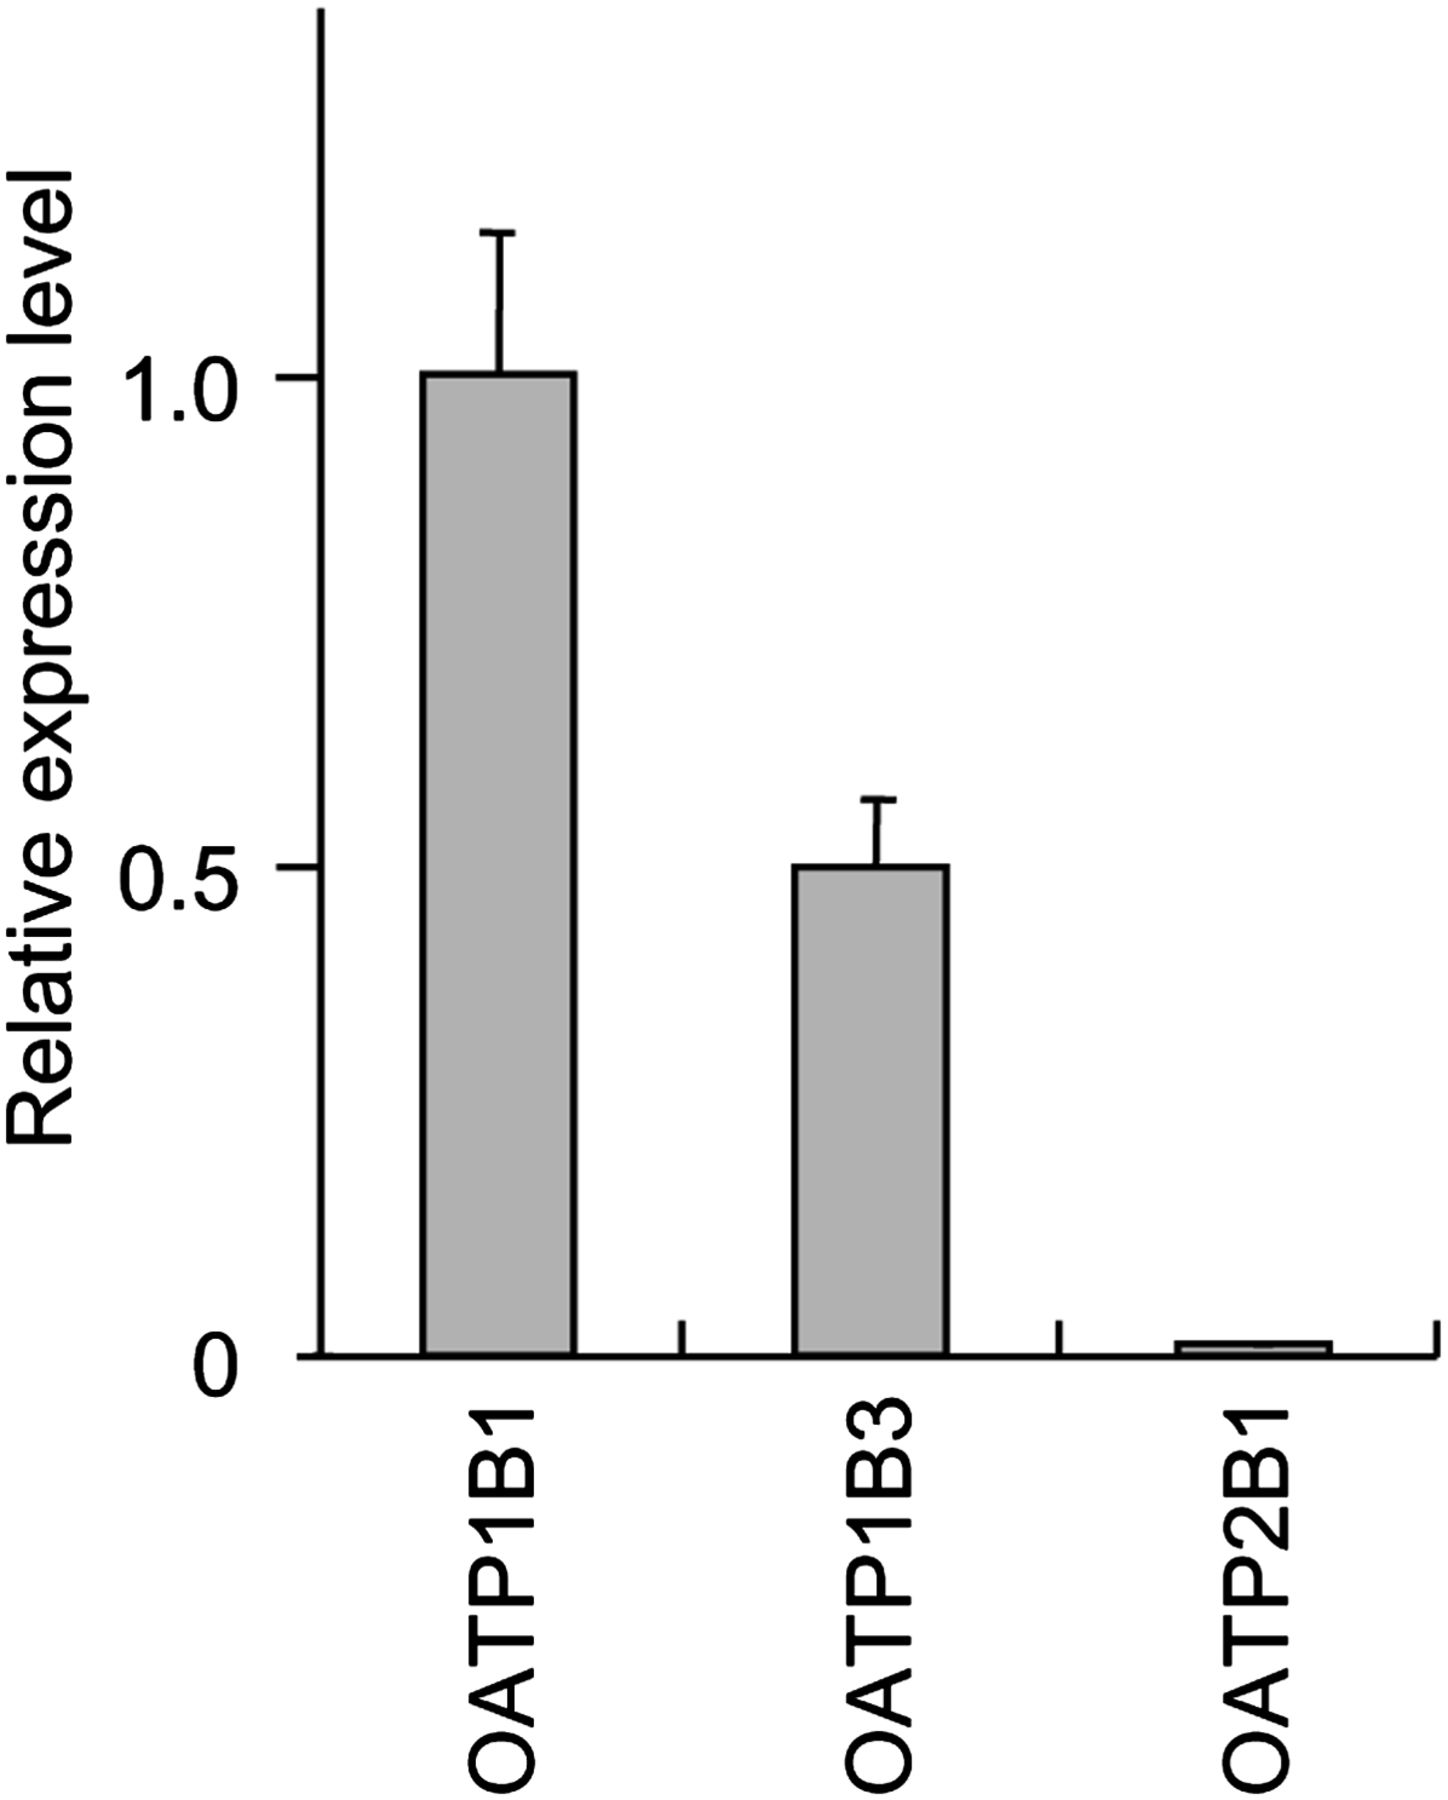
We quantified cynomolgus monkey OATP1B1, OATP1B3, and OATP2B1 mRNAs in liver to assess relative expression level of each OATP. OATP2B1 is also expressed in the sinusoidal membrane of human liver (Tamai et al., 2001). From the results of real-time reverse-transcription PCR (Fig. 1), the mRNA expression level of cynomolgus monkey OATP1B1 in liver was the highest in OATP1B1, OATP1B3, and OATP2B1, and that of OATP1B3 was subsequently high, and that of OATP2B1 was much lower than OATP1B1 and OATP1B3.

Expression of cynomolgus monkey OATP mRNAs in liver. Cynomolgus monkey OATP1B1, OATP1B3, and OATP2B1 mRNAs were quantified in liver. Expression level of each OATP mRNA was normalized to the 18S rRNA level and is shown as the average ± S.D. from three independent amplifications. Expression value of OATP1B1 mRNA was adjusted to 1, to which all other expression levels were adjusted accordingly.
Uptake of [3H]Pitavastatin into Monkey and Human Hepatocytes and the Inhibitory Effects of CsA and RIF.
Time profiles of the uptake of [3H]pitavastatin were examined using monkey and human cryopreserved hepatocytes (Fig. 2). The uptake of [3H]pitavastatin at 37°C increased with time for each species. In contrast, the uptake was much lower at ice-cold temperature compared with that at 37°C for each species, and the uptake at 37°C was inhibited by excess cold pitavastatin. At ice-cold temperature, passive diffusion might be altered as membrane fluidity decreases; however, uptake clearance was markedly decreased in the presence of excess cold pitavastatin, indicating that active transport is significantly involved. The transporter activities of monkey and human cryopreserved hepatocytes were confirmed by the uptake of [3H]estradiol-17β-D-glucuronide as a typical substrate for human OATP (data not shown). CsA and RIF inhibited [3H]pitavastatin uptake in a concentration-dependent manner in monkeys as well as humans (Fig. 3), and IC50 values of CsA and RIF were shown in Table 1. In humans, Using human OATP1B1-expressing cells, the inhibition constant (Ki) values of CsA and RIF were reported to be 0.24 and 0.48 μM, respectively (Hirano et al., 2006). The pitavastatin uptake inhibition potential was almost comparable between the human OATP1B1 and human hepatocytes for CsA and RIF, respectively.

Time profiles of [3H]pitavastatin uptake into monkey (A) and human (B) hepatocytes. The uptake was determined at two concentrations (●, 0.2 μM; ○, 1 mM) at 37°C and 0.2 μM at ice-cold temperature (△). Each point represents the mean ± S.E. (n = 3). The time point of 5 minutes at 0.2 μM represents the mean (n = 2).

Inhibitory effect of CsA (A, C) and RIF (B, D) on the uptake of [3H]pitavastatin into monkey hepatocytes (A, B) for 2 minutes and human hepatocytes (C, D) for 5 minutes (●, 0.2 μM pitavastatin; ○, 1 mM pitavastatin; △, 0.2 μM pitavastatin with inhibitor). Each point represents the mean ± S.E. (n = 3 or 4).
IC50 values of CsA and RIF on the uptake of [3H]pitavastatin into monkey and human hepatocytes
Each value represents the mean ± S.E.
Pharmacokinetics of Pitavastatin in Cynomolgus Monkeys.
The pharmacokinetic parameters of pitavastatin were determined in cynomolgus monkeys after intravenous and oral administration (Fig. 4; Table 2). Clear dose dependence for CLtotal and Vss was not observed after intravenous administration at 0.1 or 0.3 mg/kg. The urinary excretion of unchanged pitavastatin after an intravenous dose of 0.3 mg/kg was <3% of dose, indicating that hepatic elimination was the major systemic elimination pathway for pitavastatin. These data suggest that pitavastatin exhibited linear hepatic clearance in the range of doses studied. Furthermore, CLtotal values were much lower than QH, which suggested that pitavastatin had a low-to-moderate hepatic clearance in monkeys. By contrast, pitavastatin showed low-to-moderate F at 0.3 mg/kg, indicating that pitavastatin showed low-to-moderate FA · FG. The Cmax and the AUC of orally administered pitavastatin to cynomolgus monkeys were comparable to those in humans; in the clinical study, the Cmax and the AUC of orally administered pitavastatin at 2 mg were 27.6 ng/ml and 76.9 ng⋅h/ml, respectively (Hasunuma et al., 2003).
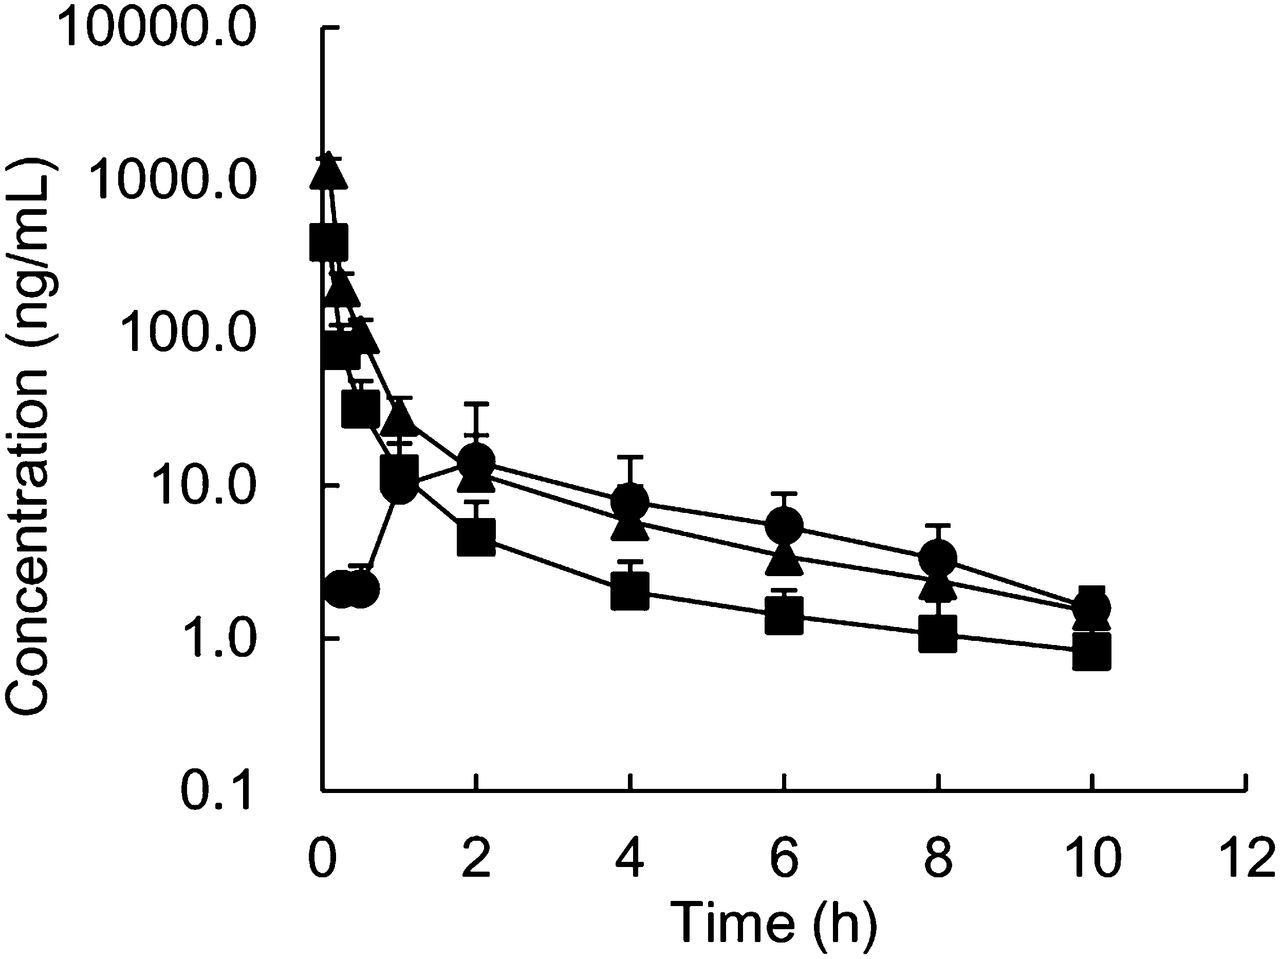
Plasma concentration–time profiles of pitavastatin after single intravenous (▪, 0.1 mg/kg; ▴, 0.3 mg/kg) and oral (●, 0.3 mg/kg) administration to male cynomolgus monkeys. Each point represents the mean ± S.D. of data from four monkeys.
Pharmacokinetic parameters of pitavastatin after single intravenous and oral administration to male cynomolgus monkeys
Each value represents the mean ± S.D. of four monkeys. The fe is the urinary excretion rate of unchanged drug.
Effects of CsA and RIF on Pharmacokinetics of Pitavastatin in Cynomolgus Monkeys.
We investigated the effects of CsA and RIF on the pharmacokinetics of pitavastatin after intravenous and oral administration to cynomolgus monkeys (Fig. 5, 6; Table 2, 3). CLtotal after intravenous administration was significantly decreased by 67% and 68% in combination with CsA and RIF, respectively, which was accounted for by the decrease in hepatic clearance. The Vss of pitavastatin after intravenous administration was decreased by 31% and 30% in the presence of CsA and RIF, respectively; although, the difference was not statistically significant. The t1/2 value did not change significantly in both combinations. Cmax and AUC after oral administration of pitavastatin were significantly increased by 13.1- and 10.6-fold in combination with CsA, respectively, and 18.2- and 14.8-fold in combination with RIF, respectively. Hepatic contribution to DDI for an oral dose of pitavastatin was clearly observed as the product of FH′/FH multiplied by CLtotal/CLtotal′ (4.5 for CsA and 5.0 for RIF), although the overall magnitude of DDI (AUCpo′/AUCpo) was much higher (10.6 for CsA and 14.8 for RIF) (Table 3). The increase in Cmax and AUCpo was therefore additionally accounted for by an increase in the absorption ratio and/or intestinal availability in the presence of CsA and RIF. The pharmacokinetic parameters of pitavastatin returned to nearly control levels 2 weeks after CsA treatment; Cmax and AUCpo were 13.5 ng/ml and 60.0 ng·h/ml, respectively.
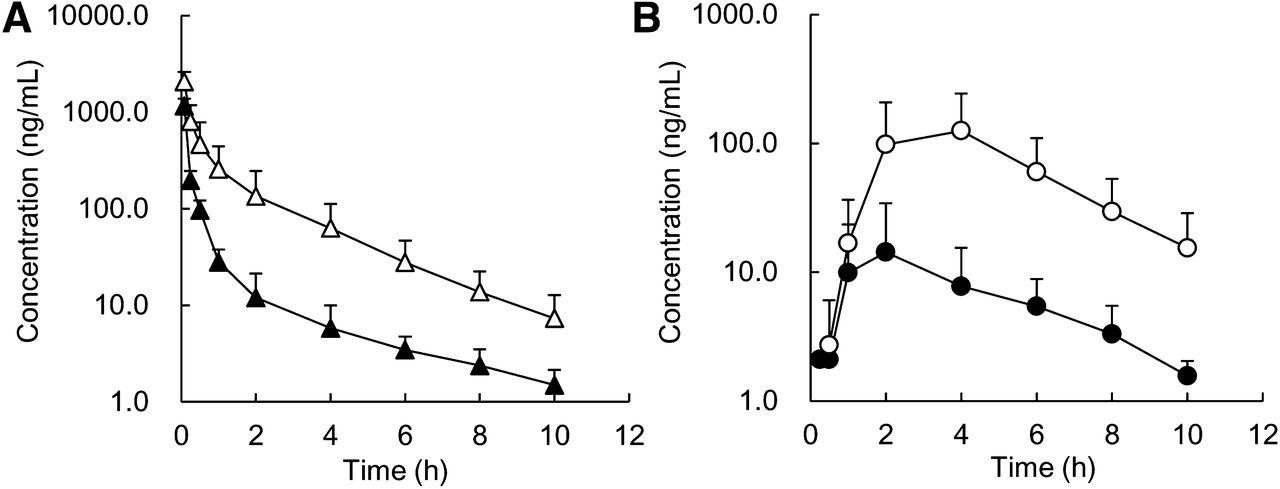
Effects of CsA (75 mg/kg, p.o.) on the plasma concentration–time profiles of pitavastatin after intravenous (A: ▴, control; △, with CsA) and oral (B: ●, control; ○, with CsA) administration to male cynomolgus monkeys at a dose of 0.3 mg/kg. CsA was administered 4 hours and 1 hour before intravenous and oral administration of pitavastatin. The same data as those in Fig. 4 are represented for the plasma concentrations for the control. Each point represents the mean ± S.D. of data from four monkeys.

Effects of RIF (20 mg/kg, p.o.) on the plasma concentration–time profiles of pitavastatin after intravenous (A: ▴, control; △, with RIF) and oral (B: ●, control; ○, with RIF) administration to male cynomolgus monkeys at a dose of 0.3 mg/kg. RIF was administered 4 hours and 1 hour before intravenous and oral administration of pitavastatin, respectively. The same data as those in Fig. 4 are represented for the plasma concentrations for the control. Each point represents the mean ± S.D. of data from four monkeys.
Pharmacokinetic parameters of pitavastatin (0.3 mg/kg) after single intravenous and oral administration to male cynomolgus monkeys in combination with CsA and RIF
Each value represents the mean ± S.D. of four monkeys. CsA or RIF was administered 4 hours and 1 hour before intravenous and oral administration of pitavastatin, respectively. AUC′, CLtotal′, and FH′ refer to the parameters in the presence of a perpetrator.
Blood Concentration–Time Profiles of CsA in Cynomolgus Monkeys.
Blood concentration–time profiles of CsA after oral administration to monkeys are shown in Fig. 7. The maximum blood concentrations (Cmax, blood) of CsA combined with intravenous and oral administrations of pitavastatin were 1154 and 921 ng/ml, respectively. We calculated the area under the blood concentration–time profile of CsA up to 4 hours after dosing of pitavastatin (AUCblood, 0–4 hours) to compare the clinical data (Hasunuma et al., 2003); the AUCblood, 0–4 hours of CsA combined with intravenous and oral administrations of pitavastatin were 3526 ng·h/ml and 2646 ng·h/ml, respectively. Although the dose of CsA used in the present study was higher than that used in the clinical DDI study (2 mg/kg) with pitavastatin, Cmax, blood and AUCblood, 0–4 hours were comparable between monkeys and humans; Cmax, blood and AUCblood, 0–4 hours of CsA in the clinical study were 938 ng/ml and 2008 ng·h/ml, respectively.

Blood concentration–time profiles of CsA after oral administration to male cynomolgus monkeys in combination with intravenous (A) and oral (B) administration of pitavastatin. CsA was administered 4 hours and 1 hour before intravenous and oral administration of pitavastatin, respectively. Each point represents the mean ± S.D. of data from four monkeys.
Discussion
Relative mRNA expression levels of cynomolgus monkey OATP1B1 and OATP1B3 in liver were much higher than that OATP2B1. Previous studies using human hepatocytes showed a similar tendency in the relative protein expression levels of human OATP1B1, OATP1B3, and OATP2B1 (Hirano et al., 2004, 2006). Therefore, it was suggested that the relative expression levels of these OATPs in liver are similar between cynomolgus monkeys and humans. In addition, high levels of homology have been reported among gene and amino acid sequences for these OATPs between the species (White et al., 2006; Ebeling et al., 2011; Utoh et al., 2012), and also it has been suggested that these OATPs substrate and inhibitor profiles were similar between the species (White et al., 2006; Maeda and Sugiyama, 2010; Shen et al., 2013).
We showed that pitavastatin was actively transported into monkey hepatocytes as well as human hepatocytes. We also found that pitavastatin uptake inhibition potential was comparable between the species for CsA and RIF, which are typical inhibitors of human OATP1B1 and OATP1B3. Therefore, we investigated pitavastatin as a possible in vivo probe for assessing DDIs caused by the inhibition of hepatic uptake transporters in monkeys. Reportedly, OATP1B1 is the major transporter involved in pitavastatin uptake into human hepatocytes, with a minor contribution from OATP1B3 and OATP2B1 (Hirano et al., 2006). However, the relative contribution of the OATPs to the hepatic uptake of pitavastatin in monkeys is not known, and further studies are necessary to better understand the mechanism of hepatic uptake at the molecular level in monkeys.
The in vivo study showed that hepatic elimination was the major pathway for the elimination of pitavastatin in monkeys as well as in humans. In the examination using liver microsomes, intrinsic clearance values for CYP-mediated and UDP-glucuronosyl transferase (UGT)-mediated metabolism of pitavastatin in monkeys were higher by 5.2- and 11.2-fold, respectively, compared with those in humans (Uno et al., 2007); however, pitavastatin had a low-to-moderate hepatic clearance value in monkeys, as reported in humans (409.5 ml/min) (CDER, 2009a). These findings raise the possibility that hepatic metabolism does not make the dominant contribution to the hepatic elimination of pitavastatin. On the other hand, monkeys had lower oral bioavailability (F = 0.16) than humans (F = 0.53), which was probably due to low absorption from the gut lumen and/or metabolism in the intestine (FA·FG = 0.25). Pitavastatin is also a substrate of efflux transporters and metabolic enzymes, such as P-gp, breast cancer resistance protein (BCRP), multidrug resistance-associated protein 2 (MRP2), CYP2C, and UGT in humans (Yamada et al., 2003; Hirano et al., 2005, 2006; Uno et al., 2007; Korzekwa et al., 2012). Also, mRNA expression of monkey orthologs of the transporters and the monkey CYP2C in the gastrointestinal tract of cynomolgus monkeys has been reported (Nakanishi et al., 2010; Utoh et al., 2012). Pitavastatin was also metabolized by CYP2C and UGT in monkeys, although a monkey-specific CYP2C isoform (CYP2C76) was shown to be involved in pitavastatin metabolism (Yamada et al., 2003; Uno et al., 2007). Therefore, such efflux transporters and/or metabolic enzymes could play a significant role in limiting oral bioavailability in monkeys.
We investigated the pharmacokinetic alteration of pitavastatin after intravenous administration to monkeys in combination with CsA and RIF. CLtotal of pitavastatin was significantly decreased by 67% and 68% in combination with CsA and RIF, respectively. In addition, there was no clear change in the plasma elimination half-life of pitavastatin in combination with CsA or RIF. These findings suggest that the distribution volume (Vd) of pitavastatin was decreased by treatment with CsA and RIF, according to the following equation:

Actually, a 31% and 30% decrease in Vss was observed by treatment with CsA and RIF, respectively; although, this difference was not statistically significant. Taking into consideration that pitavastatin is probably distributed predominantly to the liver in monkeys, as reported in rats (Kimata et al., 1998), it is suggested that the decrease in distribution volume probably reflects the inhibitory effects of hepatic uptake by CsA and RIF. It is also notable that if presently observed DDIs were exclusively explained by the inhibition of hepatic metabolism, the elimination half-lives of pitavastatin in the presence of CsA and RIF would be longer compared with that in the case of pitavastatin alone. These findings suggest that the inhibition of hepatic uptake plays a significant role in the pharmacokinetic change of pitavastatin after intravenous administration to monkeys. Although it is not commonly used in clinical settings, intravenous dosing can be employed to ascertain the contribution of intestinal and hepatic DDIs of orally administered drugs and provide better understanding of changes in tissue distribution. CsA and RIF were orally administered 4 hours before an intravenous dose of pitavastatin. Preliminarily, we administered pitavastatin intravenously 1 hour after the oral dose of CsA; the changes in plasma concentrations of pitavastatin were smaller than those with a dosing interval of 4 hours (data not shown). It was suggested that 1 hour of interval was too short for blood CsA concentrations to reach a maximum level at early time points after intravenous dosing of pitavastatin (Fig. 7B), likely resulting in only partial inhibition of hepatic uptake. On the other hand, when we used a dosing interval of 4 hours, blood CsA concentrations reached a maximum level at the time of intravenous dosing of pitavastatin (Fig. 7A). Therefore, the dosing regimen should be carefully considered in monkey DDI studies using intravenous dosing.
Cmax and AUC were increased by 13.1- and 10.6-fold, respectively, when pitavastatin was orally administered in combination with CsA. Calculation of the changes in CLtotal, FH, and FA·FG values with CsA in monkeys revealed that the increase in AUCpo was attributed not only to a decrease in hepatic clearance but also to an increase in the fraction absorbed from the gut lumen and/or decrease in intestinal first-pass metabolism. Indeed, CsA is known to inhibit human P-gp, BCRP, MRP2, and CYP2C (Yoshida et al., 2012). In humans, pitavastatin is reportedly absorbed completely from the gastrointestinal tract (CDER, 2009a), which indicates that the plasma concentrations of oral pitavastatin could be mainly elevated by the decrease in hepatic clearance. In a clinical DDI study by Hasunuma et al. (2003), combined administration of CsA increased AUCpo by 4.6-fold. This was comparable with the magnitude of the hepatic DDI presently observed with CsA in cynomolgus monkeys, which was calculated as (FH′/FH)·(CLtotal/CLtotal′). This finding seems to be consistent with the in vitro observation that the inhibitory potencies for CsA on pitavastatin uptake into hepatocytes were comparable between monkeys and humans. The estimate of FH may be affected by QH values. However, even if the relatively high QH value reported so far, such as 51.3 ml/min/kg (Luttringer et al., 2003), were used, the value of (FH′/FH)·(CLtotal/CLtotal′) was calculated to be 4.2, which was similar to that shown in Table 3. Importantly, we used the same relative timing of administration of CsA and oral pitavastatin as that in the clinical DDI study, and the blood concentrations of CsA between the studies were comparable.
RIF also increased the plasma concentrations of pitavastatin after oral dosing to monkeys to a greater extent than that after intravenous dosing. RIF could possibly increase FA·FG by the inhibition of the efflux transporters and/or the metabolic enzymes, as observed with CsA (Lau et al., 2006; Reitman et al., 2011; Yoshida et al., 2012). The magnitude of hepatic DDI, estimated as the value of (FH′/FH)·(CLtotal/CLtotal′), was higher than that in a clinical DDI report, in which Cmax and AUCpo of pitavastatin increased by 2.0- and 1.3-fold, respectively (CDERb, 2009). The reason for the apparent discrepancy was not attributable to the dose of or the plasma exposure to RIF; the geometric mean of Cmax in the clinical study was 8.9 μg/ml after oral dosing at 600 mg and that in monkeys was 10.2 μg/ml after an oral dose of 25 mg/kg, as we reported previously (Ohtsuka et al., 2010). Rather, the dosing regimen was substantially different in the clinical study, in which pitavastatin was administered after multiple doses of RIF; therefore, the inhibitory effect on the hepatic uptake of pitavastatin may be masked by the induction of metabolizing enzymes and/or transporters.
In conclusion, we conducted DDI studies using pitavastatin, a substrate of human OATP, to assess transporter-mediated hepatic uptake inhibition in cynomolgus monkeys. The plasma concentrations of intravenously and orally administered pitavastatin in cynomolgus monkeys were significantly elevated in combination with CsA and RIF, which are typical inhibitors of human OATP, and the magnitude of the hepatic DDI after orally administered pitavastatin in combination with CsA was comparable between humans and monkeys. Thus, pharmacokinetic studies using pitavastatin as a probe in combination with drug candidates in cynomolgus monkeys are useful to support the assessment of potential clinical DDIs involving hepatic uptake transporters, although further studies are necessary to better understand the mechanism of hepatic uptake of pitavastatin at the molecular level in monkeys.
Acknowledgments
The authors thank Yasuo Takamatsu, general manager of DMPK Research Laboratories, for the encouragement and great interest in this study.
Authorship Contributions
Participated in research design: Takahashi, Ohtsuka, Uno, Utoh, Yamazaki, Kume.
Conducted experiments: Takahashi, Ohtsuka, Yoshikawa, Tatekawa.
Contributed new reagents or analytic tools: Takahashi, Ohtsuka, Uno, Yoshikawa, Tatekawa.
Performed data analysis: Takahashi, Ohtsuka, Yoshikawa, Tatekawa.
Wrote or contributed to the writing of the manuscript: Takahashi, Ohtsuka, Kume.
Footnotes
- Received May 9, 2013.
- Accepted August 8, 2013.
Abbreviations
- AUC
- area under the plasma concentration–time curve
- BCRP
- breast cancer resistance protein
- CL
- clearance
- CsA
- cyclosporine A
- CYP3A
- cytochrome P450 3A
- DDI
- drug–drug interaction
- MRP2
- multidrug resistance-associated protein 2
- OATP
- organic anion transporting polypeptide
- PCR
- reverse-transcription polymerase chain reaction
- P-gp
- P-glycoprotein
- RIF
- rifampicin
- UGT
- UDP-glucuronosyl transferase
- Copyright © 2013 by The American Society for Pharmacology and Experimental Therapeutics


