


Abstract
Naturally occurring furanocoumarin compounds psoralen (PRN) and isopsoralen (IPRN) are bioactive constituents found in herbaceous plants. They are widely used as active ingredients in several Chinese herbal medicines. In this study, the CYP1A2 inhibitory potential of PRN and IPRN was investigated in rats in vitro and in vivo as well as in human liver microsomes. Both compounds exhibited reversible and time-dependent inhibition toward rat microsomal cyp1a2. The IC50, kinact, and KI values were 10.4 ± 1.4 μM, 0.060 ± 0.002 min−1, and 1.13 ± 0.12 μM for PRN, and 7.1 ± 0.6 μM, 0.10 ± 0.01 min−1, and 1.95 ± 0.31 μM for IPRN, respectively. In human liver microsomal incubations, potent reversible CYP1A2 inhibition was observed for both compounds, with IC50 values of 0.26 ± 0.01 μM and 0.22 ± 0.03 μM for PRN and IPRN, respectively. However, time-dependent inhibition was only observed for IPRN, with kinact and KI values of 0.050 ± 0.002 min−1 and 0.40 ± 0.06 μM, respectively. Coadministration with PRN or IPRN significantly inhibited cyp1a2 activity in rats, with the area under the curve (AUC) of phenacetin increasing more than 5-fold. Simcyp simulation predicted that PRN would cause 1.71- and 2.12-fold increases in the phenacetin AUC in healthy volunteers and smokers, respectively. IPRN, on the other hand, would result in 3.24- and 5.01-fold increases in phenacetin AUCs in healthy volunteers and smokers, respectively. These findings represent the first detailed report comparing the potential drug–drug interactions of PRN and IPRN, and provide useful information for balancing safe and efficacious doses of PRN and IPRN.
Introduction
Psoralen (PRN) and isopsoralen (IPRN) are active ingredients of the “buguzhi” traditional Chinese medicine, which is the dried seed of Psoralea corylifolia L. PRN and IPRN are also found in many other traditional Chinese medicines, such as double teeth angelica root and coastal glehnia root. PRN and IPRN have been widely used clinically as the principal constituents in more than 20 clinically used herbal formulas such as the Haigou pill, the Shouwu pill, and the Wenweishu tablet. PRN and IPRN are primarily used clinically to treat various skin diseases such as psoriasis, vitiligo, and chronic graft versus host disease (Conforti et al., 2009). Photochemotherapy with oral PRN and UVA radiation (PUVA) is an effective treatment for many proliferative skin disorders. In 1982, the US Food and Drug Administration approved the use of PUVA to treat psoriasis (Stern, 2007). It is estimated that more than 140,000 patients undergo PUVA treatment 2–3 times a week (Pearce et al., 2006). Clinical trial results showed that PRN along with its chemical derivatives, supplemented with exposure to sunlight, is more effective for treatment of psoriasis. In one study, 49 patients underwent 6 months of P. corylifolia treatment. Of these patients, 14% were cured and another 19% regained pigmentation on at least two-thirds of the affected skin (Chopra et al., 2013). In recent years, extensive studies investigated the pharmacological activities of PRN and IPRN. Wang et al. (2011) reported an increase in tumor cell apoptosis after treatment with PRN and IPRN.
It was reported that natural furanocoumarin compounds often show potent inhibition to cytochrome P450 (P450). The compound 6′,7′-dihydroxybergamottin was the first furanocoumarin reported as a rat cyp3a inhibitor (Edwards et al., 1996). Other compounds in this family, such as bergamottin, imperatorin, isoimperatorin, and trioxsalen, were reported to inhibit CYP3A4, CYP2D6, CYP2C19, CYP2E1, CYP2B6, rat cyp1a1, hCYP1A2, or P-glycoprotein (Baumgart et al., 2005; Paine et al., 2005; Iwanaga et al., 2010). PRN and IPRN have been reported to inhibit recombinant hCYP1A2 (Peterson et al., 2006; Kang et al., 2011). Apseloff et al. (1990) reported that 8-methoxypsoralen was an inhibitor and inducer of theophylline metabolism in rats and an inhibitor in humans (induction was not studied). These studies suggest that the chemical structure of furanocoumarin is prone to the impact of P450 enzymes, which further causes drug interactions (Bendriss et al., 1996; Tantcheva-Poór et al., 2001; Guo and Yamazoe 2004).
CYP1A2 is one of the major P450 isoforms that mediates biotransformation of some important clinical drugs such as theophylline, clozapine, imipramine, and paracetamol. Coadministration of CYP1A2 inhibitors with these drugs may cause severe adverse effects because some of them have a narrow therapeutic index (Mann et al., 1959; Dahlin et al., 1984; Sessler and Cohen, 1990; Shad, 2008). CYP1A2 also plays an important role in carcinogenesis by metabolic activation of a variety of procarcinogenic compounds, such as aflatoxins, heterocyclic aromatic amines, nitrosamines, and polycyclic aromatic hydrocarbons, to form highly reactive carcinogenic intermediates (Shimada and Fujii-Kuriyama, 2004; Chow et al., 2010). Inhibition of CYP1A2 activity may result in the reduced formation of the reactive intermediates and may consequently affect carcinogenesis. As widespread used active ingredient in Chinese medicines, PRN and IPRN are surprisingly not well investigated to date for their potential for interaction with CYP1A2 substrate drugs, it is important to understand the potential effects of PRN and IPRN might have on the inhibition of CYPs, and the consequence of risk and benefits of using these Chinese medications.
This study aimed initially to evaluate the inhibitory effects of PRN and IPRN in vitro on major rat and human cytochrome P450s. We further focused on CYP1A2 because we found that PRN and IPRN inhibit CYP1A2. Time-dependent inhibition was first identified using an IC50 shift assay. Enzyme kinetic studies were performed to further characterize the mechanism of inhibition and to differentiate the inhibitory properties between PRN and IPRN. In the rat drug–drug interaction (DDI) study, α-naphthoflavone was included to compare the interaction potentials of PRN and IPRN with this known CYP1A2 inhibitor. In an attempt to predict human DDI risk, physiologically based pharmacokinetic models were investigated for both PRN and IPRN, and the DDI potentials on CYP1A2 were predicted in both healthy volunteers and smokers.
Materials and Methods
Chemicals.
PRN, IPRN, and propranolol were purchased from the National Institute of Food and Drug Control (Beijing, China) with purity greater than 99%. The structures of PRN and IPRN are shown in Fig. 1. Phenacetin, acetaminophen, tolbutamide, 4-hydroxytolbutamide, S-mephenytoin, 4-hydroxymephenytoin, dextromethorphan, dextrorphan, midazolam, and 1′-hydroxymidazolam were purchased from Sigma (St. Louis, MO). α-naphthoflavone and β-nicotinamide adenine dinucleotide phosphate (NADPH) were purchased from Roche Molecular Biochemicals (Indianapolis, IN). Pooled rat liver microsomes (RLMs) and human liver microsomes (HLMs) were provided by BD Gentest (Woburn, MA). All other reagents and solvents were of analytical grade and commercially available.
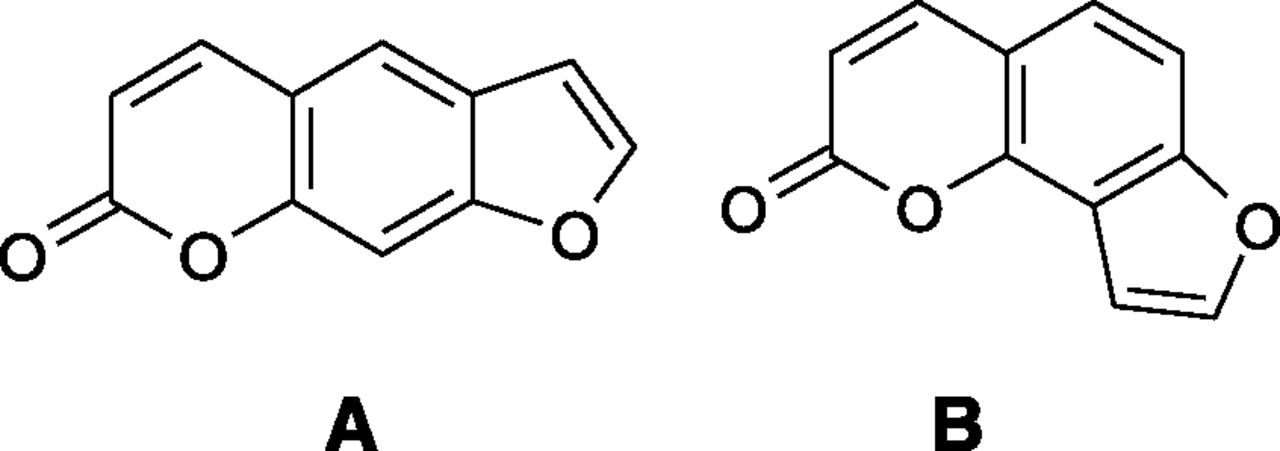
Chemical structures of PRN (A) and IPRN (B).
Animals.
Male Sprague-Dawley rats (200–240 g) were obtained from the Beijing Experimental Animal Center (Beijing, China). Animals were housed in a temperature- and humidity-controlled room with a 12-hour light/dark cycle. They were fed standard laboratory chow and had ad libitum access to water. The animal experiments were conducted in the Beijing Center for Drug Safety Evaluation (Beijing, China) and according to a protocol approved by the center’s Institutional Animal Care and Use Committee, which was in compliance with the guidelines of the International Association for Assessment and Accreditation of Laboratory Animal Care.
Quantification of PRN, IPRN, and P450 Probe Substrate Metabolites.
PRN, IPRN, phenacetin, and acetaminophen were quantitatively measured using an Agilent 6410 triple quadrupole mass spectrometer (Agilent Technologies, Santa Clara, CA) equipped with an Agilent 1290 Infinity ultra high-performance liquid chromatography (UHPLC) system and a ZORBAX SB-C18 column (50 mm × 2.1 mm, 3.5 μm i.d.). The mobile phase consisted of 5 mM ammonium formate solution containing 0.1% formic acid (A) and acetonitrile containing 0.1% formic acid (B). The following gradient program was applied: 0–1 minute 30% B, 1–1.5 minutes 30% B to 95% B, 1.5–3.5 minutes 95% B, and 3.5–4 minutes 95% B to 30% B, followed by re-equilibration of 0.5 minute. The column temperature was set at 25°C. The flow rate was 0.3 ml·min−1. For quantification, the instrument was operated in electrospray ionization positive-ion multiple reaction monitoring mode with the following optimized tandem mass spectrometry (MS/MS) conditions: transfer capillary temperature at 320°C, spray voltage of 4000 V, and sheath gas of 25 psi. The selected transitions were m/z 187→131 for PRN and IPRN, m/z 152→110.1 for acetaminophen, m/z 180→110.1 for phenacetin, and m/z 260→116.2 for propranolol (internal standard). Optimized collision energy values were 15 eV, 10 eV, 12 eV, and 16 eV, respectively. The determination method was partially validated following the US Food and Drug Administration (2001) guidance. The linear ranges for quantitation of PRN, IPRN, phenacetin, and acetaminophen were 2–2000 ng/ml and 1–1000 ng/ml, respectively. The within-run precisions did not exceed 10% and accuracies were within 10% for quality control samples at low, medium, and high concentrations (n = 3 for 5 ng/ml, 90 ng/ml, and 1600 ng/ml for PRN, IPRN, and phenacetin, respectively; n = 3 for 2 ng/ml, 50 ng/ml, and 800 ng/ml for acetaminophen, respectively) . The lower limit of quantitation was set at 2 ng/ml for PRN, IPRN, and phenacetin and at 1 ng/ml for acetaminophen because the analyte peaks were identifiable, discrete, and reproducible with 20% precision and 80%–120% accuracy. The recovery was greater than 90% and the matrix effect was negligible. The detection of other P450 probe substrate metabolites (4-hydroxytolbutamide for CYP2C9, 4-hydroxymephenytoin for CYP2C19, dextrorphan for CYP2D6, and 1′-hydroxymidazolam for CYP3A4) followed a previously published method (Zhong et al., 2012).
IC50 Determination.
To determine the IC50 values of PRN and IPRN, P450 substrate concentrations in the incubation mixture were selected to be around their Km. Seven different concentrations of PRN and IPRN were used, from 0.05 µM to 100 µM in RLMs and from 0.005 µM to 50 µM in HLMs. Incubations were carried out at 37°C in a shaking water bath. The final incubation mixtures contained RLMs or HLMs (0.5 mg/ml), phenacetin (50 µM), tolbutamide (120 µM), S-mephenytoin (40 µM), dextromethorphan (5 µM), midazolam (5 µM), and NADPH (1.0 mM) in 100 mM sodium phosphate buffer (MgCl2 3.3 mM, pH 7.4). The reactions were started by the addition of NADPH after preincubation of RLMs or HLMs, test drug, and P450 substrate at 37°C for 5 minutes. All incubations were stopped at 10 minutes by the addition of 200 µl chilled acetonitrile containing propranolol (200 ng/ml). After centrifugation at 14,000 × g for 10 minutes, the supernatant was collected and analyzed by the above-described UHPLC-MS/MS method. Positive controls, such as α-naphthoflavone (0.025–100 μM in RLMs and 0.0004–5 μM in HLMs), were included in this study. Stock solutions of the test drugs were prepared in acetonitrile. The final concentration of acetonitrile in incubates was less than 0.2% (v/v). All measurements were performed in triplicate.
IC50 Shift Assay.
IC50 shift experiments were performed to evaluate the potential of time-dependent inhibition by PRN and IPRN on CYP1A2. Multiple concentrations of PRN or IPRN were incubated in 2 mg/ml protein concentrations of RLMs (0.05–100 µM) or HLMs (0.005–50 µM) with or without NADPH for 30 minutes. Vehicle controls were run to account for any decrease in enzyme activity caused by incubation under these conditions. All measurements were performed in triplicate. After the inactivation incubation, a portion of the inactivation mixture (20 μl) was added to a mixture containing 50 μM phenacetin and NADPH (1.0 mM) in 180 μl of 100 mM potassium phosphate buffer (MgCl2 3.3 mg, pH 7.4) and further incubated for 10 minutes. After a significant IC50 shift was observed from the shift experiment, the KI and kinact values were further determined in an inactivation kinetic assay, the traditional dilution assay.
Inactivation Kinetic Assay.
Inactivation kinetic experiments were conducted with six concentrations of PRN (0, 0.1, 0.3, 1, 3, and 10 μM) or IPRN (0, 0.05, 0.15, 0.5, 1.5 and 5 μM) along with RLMs (2 mg/ml) and NADPH (1.0 mM) in 100 mM potassium phosphate buffer (MgCl2 3.3 mM, pH 7.4). In HLMs, the experiment was only performed for IPRN with the same concentration range as in RLMs because the IC50 shift was only observed for IPRN. A 20-μl aliquot of the mixture was taken at 0, 5, 10, 20, or 30 minutes and added to separate vials containing a 180-μl mixture of 50 μM phenacetin and NADPH (1.0 mM) to initiate subsequent 10-minute incubation to determine CYP1A2 activity. All measurements were performed in triplicate.
LogD7.4 Determination.
LogD7.4 was measured using the fully automated-shake flask method. Phosphate buffer (pH 7.4) and oil solutions (n-octanol) were used. The value was calculated using Eq. 1: (1)where Concinitial is the concentration of compound in the initial aqueous solution, Concfinal is the concentration of compound in the final aqueous phase, Vaq is the volume of aqueous solution, and Voct is the volume of octanol (Stopher and McClean, 1990).
Caco-2 Assay.
Caco-2 cells were seeded onto transwell assay plates, and the assay was performed with 21- to 28-day confluent monolayer cells. A final 10-μM concentration of PRN and IPRN was used to determine passive permeability (dimethyl sulfoxide concentration <1%). Transwell studies were conducted at 37°C for 2 hours. The compound was placed in the apical side to assess permeability in the A→B (apical to basolateral) direction. Samples were analyzed by LC-MS/MS. The apparent permeability coefficient (Papp) values were calculated with Eq. 2: (2)where A is the insert surface area, C0 is initial donor drug concentration, and dQ/dt is the amount of drug transported within a given time period.
Plasma Protein and Microsomal Protein Binding.
Plasma protein binding of PRN and IPRN was determined at 10 μM in rat and human plasma, using rapid equilibrium dialysis devices (Thermo Fisher Scientific, Waltham, MA). In each species, pooled plasma was obtained from at least five donor subjects with plasma from males and females pooled separately. All measurements were performed in triplicate. Plasma samples were incubated at 37°C and oscillated at 100 rpm for 4 hours. At the end of dialysis, 50 μl each of postdialysis samples from the buffer and the plasma chambers were pipetted into separate microcentrifuge tubes, and 50 μl plasma was then added to the buffer samples while an equal volume of phosphate-buffered saline to the collected plasma samples. For protein precipitation, 200 μl precipitating agent (acetonitrile/methanol 1:1, v/v, containing 200 ng/ml internal standard) was added to the diluted samples. After centrifugation at 14,000 × g for 10 minutes, the remaining PRN and IPRN in the supernatant were analyzed by LC-MS/MS. The unbound fraction (%fu) was calculated as shown in Eq. 3:
 (3)
(3)The microsomal protein binding assay followed a previously published method (Lu et al., 2006), in which microsomes (0.5 mg/ml) were mixed with 10 μM test compound in 100 mM phosphate buffer (pH 7.4) containing 3 mM MgCl2 (the dialysis buffer) and were subject to overnight equilibrium dialysis. All measurements were performed in triplicate. Concentrations of PRN and IPRN in the receiving side (after a 1:0.5 dilution in control microsomes) and donor side (after a 1:2 dilution with dialysis buffer) were determined using the LC-MS/MS method. The free fractions were calculated as shown in Eq. 4:
 (4)
(4)Blood Partitioning.
The blood/plasma concentration ratios of PRN and IPRN were determined after incubation of PRN and IPRN (10 μM) in rat and human blood (0.5 ml) for 3 hours. After the incubation, 50-μl aliquots were removed, the remaining blood was centrifuged at 3000 × g for 10 minutes, and 50-μl aliquots of plasma were removed. Concentrations of PRN and IPRN in whole blood and plasma were determined using the LC-MS/MS method. All of the incubations were performed in triplicate. The blood/plasma concentration ratio (Rbp) was calculated as shown in Eq. 5:
 (5)
(5)Hepatic Clearance Assay.
For microsomal clearance, triplicate samples of PRN and IPRN (10 μM final concentration, below or around the km values) were incubated at 37°C with RLMs or HLMs (0.5 mg/ml) in 100 mM potassium phosphate buffer with 3.3 mM MgCl2 (pH 7.4). NADPH (1.0 mM) was added to initiate the incubation. Aliquots were removed at 0, 10, 20, 30, 45, 60, and 90 minutes and added to equal volumes of precipitating agent to stop the reaction. After centrifugation at 14,000 × g for 10 minutes, the remaining parent drug in the supernatant was analyzed by LC-MS/MS. Negative controls were conducted by adding drug but omitting the NADPH. The clearance was calculated using a first-order decay equation (Lu et al., 2006).
Animal Experiments.
Twenty male Sprague-Dawley rats were randomly divided into four groups (n=5 rats each). During the morning of the experiment, PRN (5 mg/kg), IPRN (5 mg/kg), α-naphthoflavone (7 mg/kg) (positive control) (Bachmann et al., 1993), or vehicle was dosed intravenously for each group, respectively. The 5 mg/kg dose of PRN and IPRN was selected based on maximum doses in humans (60 mg/d, p.o.) considering the difference in body surface area and oral bioavailability. After 15 minutes, all of the rats received an intravenous dose of phenacetin (5 mg/kg). The dosing formulations were prepared with 40% saline and 60% polyethylene glycol 400. The concentrations were 5 mg/ml for PRN and IPRN injection solutions and 7 mg/ml for α-naphthoflavone. Blood samples (0.25 ml, over disodium EDTA) were taken from the right cannulated jugular vein before dosing (at 0 minutes) and at 0.03, 0.08, 0.25, 0.5, 1, 2, 4, 6, 8, and 12 hours after phenacetin dosing. Plasma was collected by centrifugation and stored at −20°C until analysis.
Simcyp Simulation.
The Simcyp population-based simulator (version 11; Simcyp Limited, Sheffield, UK) was used in this study. The experimental data in Table 1 were used to build the PRN and IPRN compound profiles. Simulations were performed in healthy subjects (n = 100, 50% men, aged 40–65 years). A population of smokers was constructed by modifying the CYP1A2 abundance in healthy subjects from 52 to 94 pmol/mg microsomal protein to mimic individuals who smoke >20 cigarettes per day (Plowchalk and Rowland Yeo, 2012). The Simcyp default phenacetin profile was used without further modification. The maximum allowed daily doses of PRN and IPRN (60 mg; Chinese Pharmacopoeia Commission, 2010) were used to predict the worst-case scenario of DDI. Simulation was extended to 10 days (steady state) for both the perpetrator and victim drugs. For parameters not listed in Table 1, Simcyp default or predicted values were used.
Input data of PRN and IPRN for Simcyp simulation
Data Analysis.
In the in vitro reversible inhibition assay, the LC-MS/MS peak area of acetaminophen (and dextrorphan for the HLM assay only) formed at each concentration relative to the control (percentage of remaining activity) was plotted against the concentration of the inhibitor (log transformed). The IC50 values were calculated using nonlinear regression analysis with GraphPad Prism 5 software (GraphPad Software Inc., San Diego, CA). In the in vitro time-dependent inhibition assay, the natural logarithm of remaining microsomal CYP1A2 activity was plotted against the preincubation time at each inhibitor concentration to obtain the observed rates of CYP1A2 inactivation (kobs). The kinact and KI values were then estimated by nonlinear regression using Eq. 6 (Jones et al., 1999).
 (6)
(6)In the rat in vivo DDI study, pharmacokinetic parameters of phenacetin were calculated using the standard noncompartmental module of WinNonlin (version 5.2.1; Pharsight Corp, Mountain View, CA). The t test was used to compare whether the drug-treated group differed from the control group. P values < 0.05 indicate statistical significance.
Results
Inhibition of PRN and IPRN on CYP1A2 Activity.
PRN and IPRN showed moderate inhibition of cyp1a1/2 with IC50 values of 10.4 ± 1.4 µM and 7.1 ± 0.6 µM in RLMs, respectively, but no inhibition toward human P450 substrates of CYP2C9, CYP2C19, CYP2D6, and CYP3A4. PRN and IPRN also showed potent inhibition of CYP1A2 in HLMs with IC50 values of 0.26 ± 0.01 µM and 0.22 ± 0.03 µM, respectively, and moderate inhibition of CYP2D6 with IC50 values of 3.60 ± 0.31 µM and 8.49 ± 1.45 µM, respectively, with no inhibition toward CYP2C9, CYP2C19, and CYP3A4 (Table 2). To investigate whether PRN and IPRN caused time-dependent inhibition on CYP1A2, the two compounds were preincubated at various concentrations prior to the addition of phenacetin. Significant IC50 shifts were observed for both PRN and IPRN after 30-minute preincubation in the presence of NADPH. IC50 shifts for PRN and IPRN were 169-fold and 20-fold in RLMs and 0.76-fold and 7.6-fold in HLMs, respectively (Fig. 2). This observation suggested that PRN and IPRN could be potential time-dependent inhibitors of CYP1A2 in rats and humans (IPRN only). The compound α-naphthoflavone, a known competitive inhibitor of CYP1A1/2, was included in this study and an IC50 value of 0.02 ± 0.002 µM was observed in HLMs, which is in agreement with published values (Moody et al., 1999; Weaver et al., 2003). As expected, a left shift of IC50 was not observed for α-naphthoflavone upon 30-minute preincubation. Instead, an approximately 10-fold right shift was observed that was probably due to the loss of parent compound via metabolism during the 30-minute preincubation. Furafylline, a known CYP1A2 time-dependent inhibitor, was also included as a positive control and had a left shift from an IC50 of 5.77 ± 0.03 µM to 0.096 ± 0.000 µM after 30-minute preincubation.
P450 inhibition of PRN and IPRN in RLM and HLM incubations
The highest concentrations of PRN and IPRN tested in RLM and HLM incubations were 100 µM and 50 µM, respectively. The column headings show human P450 isozymes, and the same substrates were used for RLM studies. n = 3.

Effects of PRN and IPRN on phenacetin O-deethylation (percentage of control activity) with or without NADPH. (A and B) The IC50 shift of phenacetin inhibition curves in RLMs after 30-minute preincubation with or without NADPH. (C and D) The IC50 shift of phenacetin inhibition curves in HLMs after 30-minute preincubation with or without NADPH. The data presented in the figure are the means of reduplicated samples (n = 3).
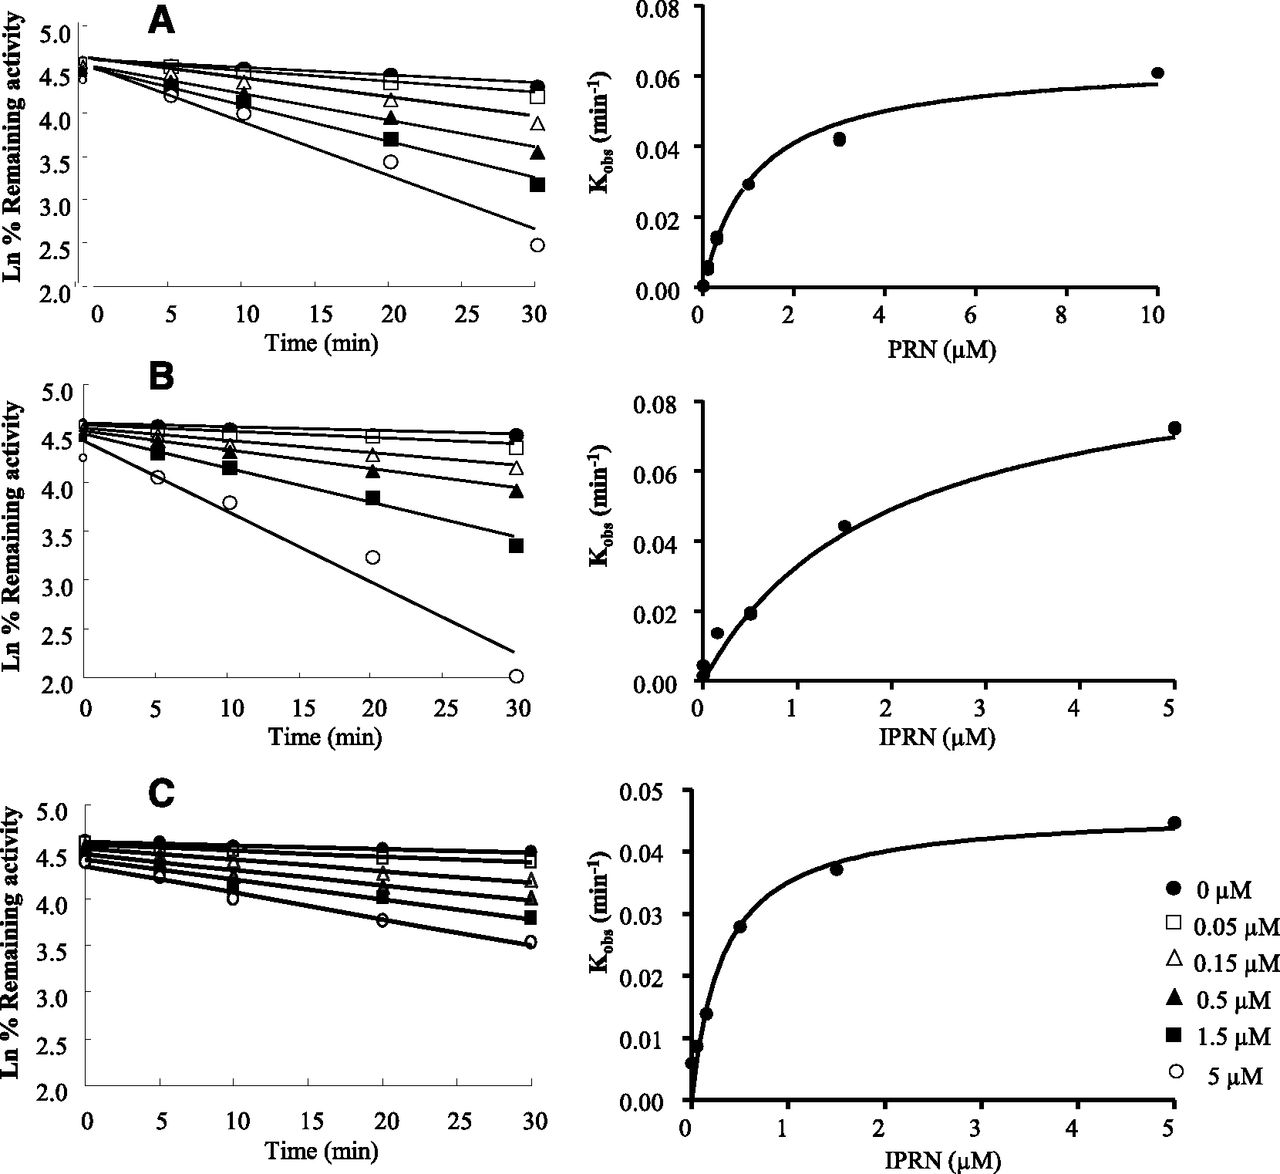
Time-Dependent Inactivation of CYP1A2 by PRN and IPRN.
The CYP1A2 inactivation kinetics by both PRN and IPRN were time dependent and concentration dependent. The time course data were analyzed to determine the initial rate constants of inactivation at various concentrations for PRN and IPRN (Fig. 3). The rate constant for maximal inactivation at saturation (kinact) and the concentration required to produce one-half the maximal rate of CYP1A2 inactivation (KI) were determined to be 0.060 ± 0.002 min−1 and 1.13 ± 0.12 μM for PRN and 0.10 ± 0.01 min−1 and 1.95 ± 0.31 μM for IPRN in rats, respectively, and 0.050 ± 0.002 min−1 and 0.40 ± 0.06 μM for IPRN in humans (Table 1). These results indicated that the KI values of PRN and IPRN are much lower than the known CYP1A2 mechanism-based inhibitors. For example, furafylline has a KI of 6.9 μM toward phenacetin (Tassaneeyakul et al., 1994), whereas dihydralazine has a KI of 42 μM toward phenacetin (Masubuchi and Horie, 1999). In this study, α-naphthoflavone was included as a negative control and furafylline was included as a positive control (KI = 1.49 ± 0.40 µM and kinact = 0.12 ± 0.01 min−1).

Preincubation time- and concentration-dependent inhibition of phenacetin O-deethylation by PRN (0–10 µM) in RLMs (A) or IPRN (0–5 µM) in RLMs (B) and IPRN (0–5 µM) in HLMs (C). The rate of inactivation of CYP1A2 activity by each inhibitor concentration (Kobs) was determined by linear regression analysis of the natural logarithm of the percentage of activity remaining versus preincubation time data (left). The KI and kinact values were calculated by nonlinear regression analysis of the Kobs versus PRN or IPRN concentration [I] data according to Eq. 6 (right). The data presented in the figure are the means of reduplicated samples (n = 3).
In Vivo Inhibitory Effects of PRN and IPRN on Phenacetin Pharmacokinetics.
To eliminate the influence of absorption, we assessed the effects of PRN and IPRN on the pharmacokinetics of phenacetin in rats dosed intravenously. The known CYP1A2 inhibitor α-naphthoflavone was tested in parallel as a positive control. The plasma concentration-time profiles of phenacetin for different dosing groups are presented in Fig. 4. The corresponding pharmacokinetic parameters are summarized in Table 3. The total plasma clearance of phenacetin obtained in the control group of this study was 54.3 ml/min per kilogram, which is close to the rat hepatic blood flow rate (55.2 ml/min per kilogram; Davies and Morris, 1993). The clearance of phenacetin dramatically decreased in the groups that were coadministered phenacetin with PRN (10.3 ml/min per kilogram) or IPRN (10.2 ml/min per kilogram). These results indicated that PRN and IPRN predominantly inhibited the metabolism of phenacetin in liver because phenacetin is known to be mainly cleared in liver by metabolism (Raaflaub and Dubach, 1975). The t1/2 also increased by 3.4-fold and 4.0-fold after treatment with PRN or IPRN, respectively. Another significant change was in the area under the curve (AUC), which increased more than 5-fold in both the PRN- and IPRN-treated groups, suggesting that PRN and IPRN are strong inhibitors of rat cyp1a2 at the given doses. In comparison, treatment with α-naphthoflavone, a competitive CYP1A2 inhibitor, clearance of phenacetin also significantly decreased, as the exposure of phenacetin increased (approximately 1.8-fold). However, at a similar dose, the inhibition of α-naphthoflavone was weaker than that of PRN or IPRN.

Mean (± S.D.) plasma concentration-time profiles in rats after a single i.v. dose of phenacetin (5 mg/kg) and PRN or IPRN coadministrated with phenacetin at an i.v. dose of 5 mg/kg (n = 5).
Pharmacokinetics of phenacetin after coadministration of α-naphthoflavone, PRN, or IPRN
Intravenous doses were as follows: 5 mg/kg phenacetin, 7 mg/kg α-naphthoflavone, 5 mg/kg PRN, and 5 mg/kg IPRN. Results are expressed as the mean ± SD. n = 5.
Prediction of Human DDI Using Simcyp Simulation.
Table 1 lists the parameters of PRN and IPRN determined in vitro. These parameters include logD7.4, intrinsic clearance, blood-plasma partitioning, plasma and microsomal protein binding, Caco-2 permeability, reversible inhibition potential (IC50), and time-dependent inhibition potential (kI and kinact, IPRN only).
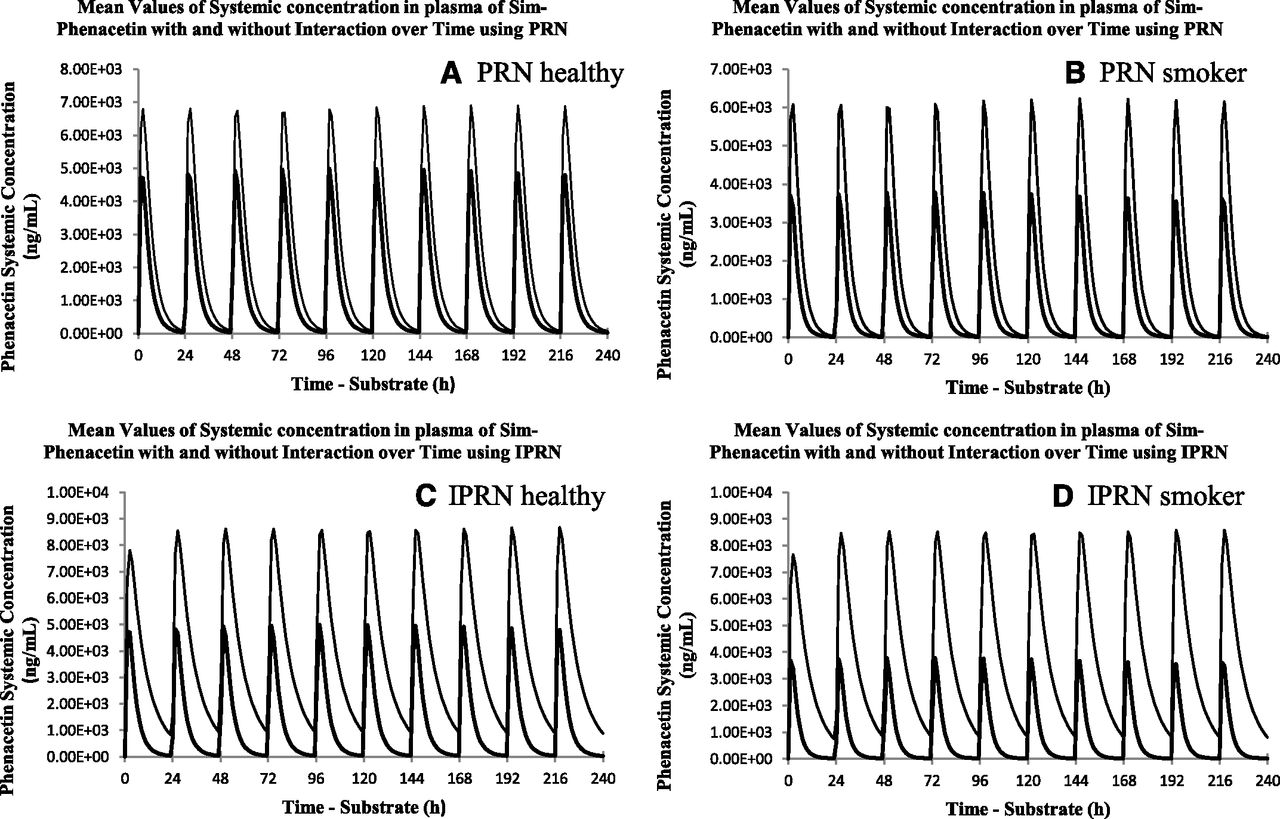
Simcyp simulations were performed in healthy subjects and smokers. Fig. 5 presents 10-day simulations of plasma concentration-time profiles of a 1500 mg daily dose of phenacetin with a 60 mg daily dose of PRN or IPRN (the maximum doses in humans; Chinese Pharmacopoeia Commission, 2010). The DDI data, summarized in Table 4, showed that 60 mg PRN increased the AUC of phenacetin by 1.71-fold and 2.12-fold in healthy volunteers and smokers, respectively, whereas 60 mg IPRN increased the AUC of phenacetin by 3.24-fold and 5.01-fold in healthy volunteers and smokers, respectively. The more potent inhibition of IPRN compared with PRN is attributed to both reversible and time-dependent inhibition of CYP1A2. In smokers, CYP1A2 activity was much higher without the inhibition of IPRN; therefore, changes in clearance and AUC were more profound after the addition of IPRN.

Simcyp simulation results of phenacetin AUC0–24 at 1400 mg daily × 10 in the presence of IPRN (60 mg daily × 10) and absence of IPRN in healthy subjects (A) and smokers (B), or the presence of PRN (60 mg daily × 10) and absence of PRN in healthy subjects (C) and smokers (D). The outer curves represent phenacetin concentration in the absence of PRN or IPRN. The inner curves represent phenacetin concentration in the presence of PRN or IPRN.
Simcyp predicted phenacetin PK parameters in the presence or absence of PRN or IPRN
Discussion
It is commonly believed that there are species differences in metabolism for some drugs. Therefore, selecting an appropriate animal species and probe substrate is crucial for in vitro–in vivo correlation. The CYP1A2 enzyme is known to be expressed in all mammalian livers, with few species differences in function or regulation and high amino acid sequence homology (Parkinson and Ogilvie, 2008). Phenacetin is a substrate widely used as an in vitro and in vivo probe (except for in beagle dogs; Whiterock et al., 2012) to measure CYP1A2 activity because the metabolism of phenacetin to acetaminophen is thought to be a selective CYP1A2-mediated reaction (Distlerath et al., 1985; Tassaneeyakul et al., 1993). Hence, in the present study, the inhibitory effects of PRN and IPRN on CYP1A2-mediated metabolism were assessed in vitro and in vivo in rats and in vitro in humans using phenacetin as the probe substrate. A recent study reported that including bovine serum albumin (BSA) in CYP1A2 microsomal incubation resulted in enhanced CYP1A2 activity by reducing the apparent Km values that mainly attribute to the quenching of inhibitory effects by long-chain fatty acid residue in the HLM preparation by BSA (Wattanachai et al., 2012). Since including BSA in microsomal incubation has not become a standard practice in the pharmaceutical industry, the addition of BSA was not applied in this study. However, if BSA were used in this study, different parameters of inhibition by PRN and IPRN would be observed, likely toward lower values of IC50, Ki, and kinact. Thus, higher DDI potential would be predicted in Simcyp simulation.
To our knowledge, this study is the first to reveal and compare the reversible and time-dependent inhibitory activities of CYP1A2 by PRN and IPRN (which is the angular isomer of PRN) obtained in vitro and in vivo with the same substrate in identical assay systems. The inhibitory activity of PRN or IPRN on rat cyp1a2 without preincubation was relatively moderate, with IC50 values of 10.4 µM and 7.1 µM, respectively. From the available literature, typical plasma concentrations of PRN and IPRN were less than 400 ng/ml after the clinical dose of herbal medications containing PRN and IPRN (Gu et al., 2009; Li et al., 2009). This concentration is lower than the IC50 values in rats but is much higher than the IC50 values in humans. The direct inhibition of cyp1a2 by PRN and IPRN in rats would be minimal. However, much stronger inhibitory effects were observed when PRN and IPRN were preincubated in the presence of NADPH. The significant IC50 shifts and much lower KI values (1.13 µM for PRN and 1.95 µM for IPRN) indicated that time-dependent inhibition could be the primary contributor toward the cyp1a2 inhibition by PRN and IPRN observed in rats. In comparison, the inhibition of cyp1a2 by the selective inhibitor α-naphthoflavone was only through reversible inhibition, because no IC50 shift was observed after preincubation with NADPH. To further validate interactions of phenacetin with PRN or IPRN, in vivo inhibition experiments were conducted in rats. The same dose level (5 mg/kg) was used for PRN and IPRN because of the similar content of these two active ingredients present in P. corylifolia L and many other commonly used Chinese herbal medications. It was confirmed that the plasma exposure of phenacetin was significantly increased by concomitant administration of either PRN or IPRN. The AUC of phenacetin in concomitant dose groups increased more than 5-fold compared with the phenacetin control group. The ratios of acetaminophen to phenacetin also decreased accordingly, suggesting that the formation of the metabolite was inhibited. When phenacetin was coadministered with α-naphthoflavone (7 mg/kg), a known CYP1A2 reversible inhibitor, the AUC of phenacetin increased no more than 2-fold. In earlier rat pharmacokinetic studies, a 12.5 mg/kg dose of α-naphthoflavone had an AUC0–24 of 526 µg⋅h/ml (Wang and Morris, 2008), whereas a 9.12 mg/kg dose of PRN and IPRN resulted in AUC0–24 values of 278 and 425 µg⋅h/ml, respectively (Feng et al., 2010). Thus, the exposure in rats after a 7 mg/kg dose of α-naphthoflavone was marginally higher than that after a 5 mg/kg dose of PRN or IPRN. Given the fact that Ki values of α-naphthoflavone (1.37 µM) are lower than that of PRN and IPRN (10.4 and 7.1 µM), the higher inhibition of phenacetin metabolism observed in rats when phenacetin is coadministered with PRN or IPRN could be attributed to time-dependent inhibition by PRM and IPRN.
Both PRN and IPRN showed a more potent reversible inhibition in HLMs compared with RLMs. In addition, time-dependent inhibition was only observed with IPRN. In an attempt to assess the potential human DDI risk, Simcyp simulations were conducted to predict phenacetin AUC changes under the coadministration of PRN or IPRN by allowing perpetrator and victim doses at the same time for 10 days. Because of the combined effect of reversible inhibition and time-dependent inhibition, IPRN showed higher DDI potential than PRN. Furthermore, coadministration of IPRN was predicted to have more profound DDIs in smokers with induced CYP1A2 activity. CYP1A2 is responsible for the metabolism of some drugs. CYP1A2 also reportedly metabolizes some naturally occurring chemicals and environmental contaminants and converts some of them to mutagenic and carcinogenic active metabolites, along with CYP1A1, which is mostly present in the lung (Peterson et al., 2006; Chang et al., 2013). Some well known examples are the biotransformation of polyaromatic hydrocarbons into their reactive metabolites that potentially cause DNA damage, leading to cancers (Lehr and Jerina, 1977). Thus, inhibition of CYP1A2 by PRN and IPRN, as constituents of traditional Chinese medicines, in smokers may attenuate the damaging effects of CYP1A2 induction by cigarette smoking in addition to their therapeutically beneficial effects. It is also known that smoking induces both CYP1A1 (mostly present in the lung) and CYP1A2 (mostly present in liver), and phenacetin is substrate for both CYP1A1 and CYP1A2. In the Simcyp simulation, a default phenacetin profile was used as a CYP1A2 substrate to illustrate CYP1A2-mediated DDI, since most of the DDIs are mediated by CYP1A2. However, if both CYP1A1 and CYP1A2 in liver as well as in lung are considered, the predicted DDI potential could be different depending on the respective inhibition potential of PRN and IPRN toward CYP1A1 and CYP1A2.
Naturally occurring furanocoumarins exist in two structural types: linear furanocoumarins and angular furanocoumarins. Previous studies reported different CYP3A4 inhibitory properties for linear and angular types of furanocoumarins, and linear furanocoumarins are more potent CYP3A4 reversible inhibitors (Guo et al., 2000). PRN and IPRN represent the linear and angular furanocoumarins, respectively. In the present study, no significant difference in reversible and time-dependent inhibition was found in rat in vitro and in vivo cyp1a2 inhibition between PRN and IPRN, as well as in the human liver microsomal reversible inhibition study except the inhibition was more potent in HLM. However, in HLMs, time-dependent CYP1A2 inhibition was only observed with the angular furanocoumarin, IPRN. This difference may be attributed to that difference in compounds although they are in the same class, different enzymes and probe P450 substrate specificity (Cai et al., 1993, Paine et al., 2004; Prince et al., 2006). It remains to be seen whether the angular furanocoumarins are generally more prone to the formation of more reactive epoxide metabolites, similar to the well established Bay Region theory of polyaromatic hydrocarbons (Lehr and Jerina, 1977; Chang et al., 2013). The observation of time-dependent inhibition for both PRN and IPRN in rats but only IPRN in humans warrants future investigation.
In summary, the present study was conducted to investigate the inhibitory potential of PRN and IPRN, constituents of traditional Chinese medicines, on CYP1A2. The results obtained from in vitro and in vivo studies showed that these two furanocoumarins are potent time-dependent inhibitors of rat cyp1a2. More potent reversible inhibition was observed in HLM incubations. Furthermore, only the angular furanocoumarin IPRN was found to be a time-dependent inhibitor in HLMs. Human DDI is predicted to be approximately 2- to 3-fold in healthy individuals and up to 5-fold in smokers. On the other hand, the profound inhibition of CYP1A2 by these compounds in smokers may attenuate the damaging effect of CYP1A2 induction by cigarette smoking in addition to their therapeutically beneficial effect. These findings provide useful information for the safe and effective usage of PRN and IPRN in the clinic. We suggest the dosage of common clinically used drugs metabolized by CYP1A2, such as theophylline and clozapine, be monitored when they are coadministered with Chinese medicines containing PRN or IPRN.
Authorship Contributions
Participated in research design: Zhuang, Li, Lu.
Conducted experiments: Zhuang, Zhong, Xiao.
Performed data analysis: Zhuang, Zhong, Li, Lu.
Wrote or contributed to the writing of the manuscript: Zhuang, Li, Lu.
Footnotes
- Received June 4, 2013.
- Accepted August 23, 2013.
This research was supported by the Chinese National Science and Technology Major Special Project on Major New Drug Innovation [Grants 2008ZXJ09006001 and 2012ZX09301003001].
Abbreviations
- AUC
- area under the curve
- BSA
- bovine serum albumin
- CYP3A4
- CYP3A4/5
- DDI
- drug–drug interaction
- HLM
- human liver microsome
- IPRN
- isopsoralen
- LC-MS/MS
- liquid chromatography coupled to tandem mass spectrometry
- MS/MS
- tandem mass spectrometry
- NADPH
- nicotinamide adenine dinucleotide phosphate
- P450
- cytochrome P450
- PUVA
- psoralen and UVA radiation
- PRN
- psoralen
- RLM
- rat liver microsome
- UHPLC
- ultra high-performance liquid chromatography
- Copyright © 2013 by The American Society for Pharmacology and Experimental Therapeutics


