


Abstract
Solute carrier (SLC) transporters regulate the cellular influx and disposition of endogenous and xenobiotic compounds, including anticancer agents such as the multikinase inhibitors (MKIs). Recent evidence suggests that MKIs may also inhibit SLC-dependent transport of coadministered drugs, although present information on the relative susceptibilities of multiple SLC transporters is limited. This study evaluated 18 MKI drugs and metabolites as inhibitors of prototypic substrate uptake by 13 SLC transporters that were overexpressed in human embryonic kidney cells. Organic anion transporting polypeptides (OATPs) 1A2, 1B3, and 2B1, organic anion transporter 3 (OAT3), and organic cation transporter 1 (OCT1) were inhibited by most MKIs, whereas substrate uptake by OATP1B1, OAT1, 2, and 4, OCT2 and 3, and organic zwitterion/cation transporter 1 (OCTN1) was less susceptible to inhibition; OCTN2 was also inhibited by cediranib. In further studies, IC50 values were determined for the most effective MKIs, and erlotinib and cediranib were found to be potent competitive inhibitors of OATP2B1 (Ki = 41 nM) and OATP1A2 (Ki = 33 nM), respectively. From predictive approaches, several MKI-SLC interactions were found to be of potential in vivo significance.
Introduction
Multikinase inhibitor (MKI) drugs target defective signaling pathways that promote the growth and survival of tumor cells. Although MKIs generally produce fewer adverse effects than conventional anticancer drugs, a number have been implicated in toxicities, as well as pharmacokinetic and other interactions that may decrease the safety and efficacy of coadministered drugs (Swaisland et al., 2005; van Erp et al., 2009; Di Gion et al., 2011).
Most pharmacokinetic interactions involving MKIs that have been described to date have focused on biotransformation enzymes and efflux transporters (Liu et al., 2010; Scheffler et al., 2011; Filppula et al., 2012; Gu et al., 2014). However, solute carrier (SLC) transporters are determinants of drug uptake into cells and drug disposition. SLC transporters include organic anion transporting polypeptides (OATPs), organic anion transporters (OATs), organic cation transporters (OCTs), and organic zwitterion/cation transporters (OCTNs). A number of studies have demonstrated that MKIs are important SLC transporter substrates (van Erp et al., 2009; Minematsu and Giacomini, 2011; Hu et al., 2014).
Inhibition of SLC transporters may decrease the efficacy and clearance of coadministered drugs. Several MKIs inhibit the cellular influx of important SLC substrates (Minematsu and Giacomini, 2011; Karlgren et al., 2012; Hu et al., 2014). At present, however, information on the selectivity of inhibitory interactions across major SLC is not readily available, especially for some of the newer MKIs. The present study assessed the capacity of 18 MKIs to inhibit substrate uptake by 13 OATP, OAT, OCT, and OCTN proteins that were overexpressed in human cells. Predictive estimates of the potential in vivo significance of potent inhibitory interactions were also undertaken. The major finding was that the MKIs erlotinib, cediranib, and gefitinib inhibit the activity of specific human influx transporters that could impair the efficacy of coadministered drugs or precipitate pharmacokinetic drug interactions.
Materials and Methods
Chemicals and Biochemicals.
Sorafenib and its metabolites (N′-hydroxymethylsorafenib N-oxide, sorafenib N-oxide, N′-hydroxymethylsorafenib, N′-desmethylsorafenib, and N′-desmethylsorafenib N-oxide) were synthesized as described previously (Ghassabian et al., 2012). Other MKIs were purchased from Selleck Chemicals (Houston, TX).
[3H]Estrone-3-sulfate (E3S; 57.3 Ci/mmol), [3H]cholecystokinin octapeptide (CCK-8; 97.5 Ci/mmol), and [3H]1-methyl-4-pyridinium acetate (MPP+; 82.1 Ci/mmol) were purchased from PerkinElmer (Melbourne, VIC, Australia). [3H]Para-aminohippuric acid (60 Ci/mmol), [3H]L-ergothioneine (1.7 Ci/mmol), and [14C]L-carnitine (56 mCi/mmol) were purchased from BioScientific Pty. Ltd. (Gymea, NSW, Australia). Unless otherwise stated, cell culture media and all reagents were obtained from Invitrogen (Mount Waverley, VIC, Australia).
Plasmid cDNAs encoding human OATP1A2 (reference sequence: NM_005075.1), OATP1B1 (AB026257.1), OATP1B3 (NM_019844), and OATP2B1 (NM_007256) were obtained from United BioResearch Pty. Ltd. (Dural, NSW, Australia); those encoding human OAT1 (NM_004790.4), OAT2 (NM_006672.2), OAT3 (NM_004254.2), OCT1 (NM_003057.2), OCT2 (NM_003058.2), and OCT3 (NM_021977.2) were from Australian Biosearch (Balcatta, WA, Australia); and those encoding human OCTN1 (NM_003059) and OCTN2 (NM_003060) were obtained from Gene-Ethics (Asia) Pty. Ltd. (The Franklin, Singapore). Human OAT4 cDNA was obtained as described previously (Zhou et al., 2010).
Transport Studies in Transfected Human Embryonic Kidney 293 Cells.
Transporter substrate uptake assays were conducted essentially as described elsewhere (Zhou et al., 2010, 2011). Human embryonic kidney 293 cells (HEK293; American Type Culture Collection, Manassas, VA) were cultured in Dulbecco’s modified Eagle’s medium supplemented with 10% fetal bovine serum (37°C) and were seeded in 48-well human fibronectin–coated plates (2 × 10⁵ cells/well). Twenty-four hours later, cells were transfected (0.32 μg of plasmid cDNA/well; Lipofectamine 2000; Invitrogen) and substrate uptake assays were conducted after a further 24 hours, as described by Zhou et al. (2011). Protein was estimated by the method of Bradford (1976).
In these experiments, substrate concentrations were as follows: OATP1A2, OATP1B1, OATP2B1, and OAT3 ([3H]E3S 300 nM, 68.8 nCi); OATP1B3 ([3H]CCK-8 2 nM, 23.4 nCi); OAT1 ([3H]para-aminohippuric acid 5 µM, 144 nCi); OAT2 ([3H]E3S 2 μM, 138 nCi, pH 5.5); OAT4 ([3H]E3S 300 nM, 138 nCi); OCT1, OCT2, and OCT3 ([3H]MPP+ 100 nM, 98.5 nCi); OCTN1 ([3H]L-ergothioneine 5 μM, 40.8 nCi); and OCTN2 ([14C]L-carnitine 5 μM, 6.72 nCi). MKIs were added to confluent cells in dimethylsulfoxide (0.1% final concentration), and uptake was terminated after 8 minutes by rapidly washing the cells with ice-cold phosphate-buffered saline; substrate uptake was linear under these conditions. The cells were then solubilized in 0.2 M NaOH, neutralized with 0.2 M HCl, and aliquoted for liquid scintillation counting (Ultima Gold scintillation cocktail, Tri-Carb 2810TR; PerkinElmer, Waltham, MA). Uptake was standardized to the amount of protein in each well and corrected for passive permeability by subtraction of the background counts of vector transfected cells. Inhibitor concentrations up to 100 μM did not alter apparent uptake rates. Experiments were performed in triplicate wells on three separate occasions except for those involving OCTs 1–3 and OAT2, which were conducted in duplicate.
Inhibition Studies.
MKIs were tested initially at 10 µM. When inhibition exceeded 50%, IC50 values were determined (eight concentrations) in triplicate and repeated in three separate experiments. Kinetic studies were undertaken for inhibitory interactions where IC50 < 0.1 µM (OATP2B1- and OATP1A2-mediated uptake of E3S by erlotinib and cediranib, respectively). Michaelis-Menten parameters were determined by nonlinear regression (Prism 6.0; GraphPad Software Inc., La Jolla, CA), and Ki values and mode of inhibition were determined from Lineweaver-Burk and Dixon plots and appropriate replots (Segel, 1975); kinetic experiments were conducted on three occasions.
In Vitro–In Vivo Predictions.
The potential in vivo significance of the potent inhibitory interactions that were identified in vitro in transfected HEK293 cells was assessed, as outlined elsewhere (Ito et al., 1998; Giacomini et al., 2010).
Where available, literature data on the maximal plasma concentrations of MKIs (Cmax) and unbound fraction in plasma (fu) were used to calculate maximal unbound MKI concentrations in plasma (Cmax,u). IC50 and Cmax,u data were then analyzed according to eq. 1. If fu values for particular MKIs were not available, a conservative estimate was used (fu = 0.1):
 (1)
(1)Cmax,u/IC50 values ≥0.1 indicated that the IC50 was less than 10-fold the unbound maximal systemic concentration of MKI in plasma (Cmax,sys) in cells expressing OAT or OCT proteins; these interactions were analyzed further. The maximal unbound concentration of unbound MKI in portal blood at the entrance to the liver [Cmax,u(portal)] was calculated using the following equation (Ito et al., 1998; Giacomini et al., 2010):
 (2)
(2)where fu is the unbound fraction of the MKI in plasma, rB is the blood-to-plasma concentration ratio, Dose is the maximum oral dose of the MKI, Fa is the reported oral bioavailability of the MKI, ka is the absorption rate constant, and Qh is hepatic blood flow rate (1.61 l/min; Ito et al., 1998). Two values of ka were evaluated: 0.1/min, which is the theoretical maximal value considering gastric emptying rate (Ito et al., 1998), and 0.03/min, as suggested by Giacomini et al. (2010).
R values were then calculated as follows:
 (3)
(3) (4)
(4)Physicochemical Properties.
The structures of the test MKIs are shown in Fig. 1. Physicochemical parameters for MKIs were determined [molecular weight, the logarithm (base 10) of the oil/water partition coefficient calculated by the fragment approach (cLogP), total polar surface area (PSA), number of rotatable bonds, hydrogen bond–donor groups and hydrogen bond–acceptor groups (ChemBioDraw Ultra 13.0; PerkimElmer)] and used in linear and multiple regression analysis to evaluate relationships between IC50 values for inhibition of SLC-mediated substrate uptake.

Structures of MKIs used in this study.
Data Analysis and Statistics.
Initial inhibition data were analyzed by one-way analysis of variance, and Bonferroni’s multiple comparison test was used to detect differences from control (Prism 6.0). IC50 and Michaelis-Menten kinetic parameters were determined by nonlinear regression.
Results and Discussion
Eighteen MKIs were tested for the capacity to modulate substrate uptake by 13 SLC transporters expressed in HEK293 cells (Fig. 1). Initial screening at the 10 µM concentration identified a number of potent inhibitory interactions (>50% inhibition); IC50 values were determined for these interactions (Table 1). Ten MKIs exhibited IC50 values in the range 0.03–3.77 µM for the inhibition of E3S uptake by OATP1A2, with only lapatinib, bosutinib, and sorafenib and its metabolites exhibiting <50% inhibition when tested at the 10 µM concentration. OATP2B1-mediated E3S uptake was also inhibited by gefitinib, nilotinib, afatinib, erlotinib, pelitinib, and neratinib (IC50 values 0.03–2.68 µM). In contrast, OATP1B3-mediated CCK-8 uptake was only effectively inhibited by neratinib and erlotinib, whereas IC50 values were determined for inhibition of MPP+ uptake by OCT1 and L-carnitine uptake by OCTN2 by bosutinib and cediranib, respectively (Table 1). In contrast, substrate uptake by OATP1B1; OATs 1, 2, and 4; OCTs 2 and 3; and OCTN1 was less readily inhibited by the present group of MKIs.
Inhibition of SLC transporter–dependent substrate uptake by MKI drugs
Data are presented as IC50 values or means ± S.D. of three individual reactions expressed as percentage of control (solvent alone).
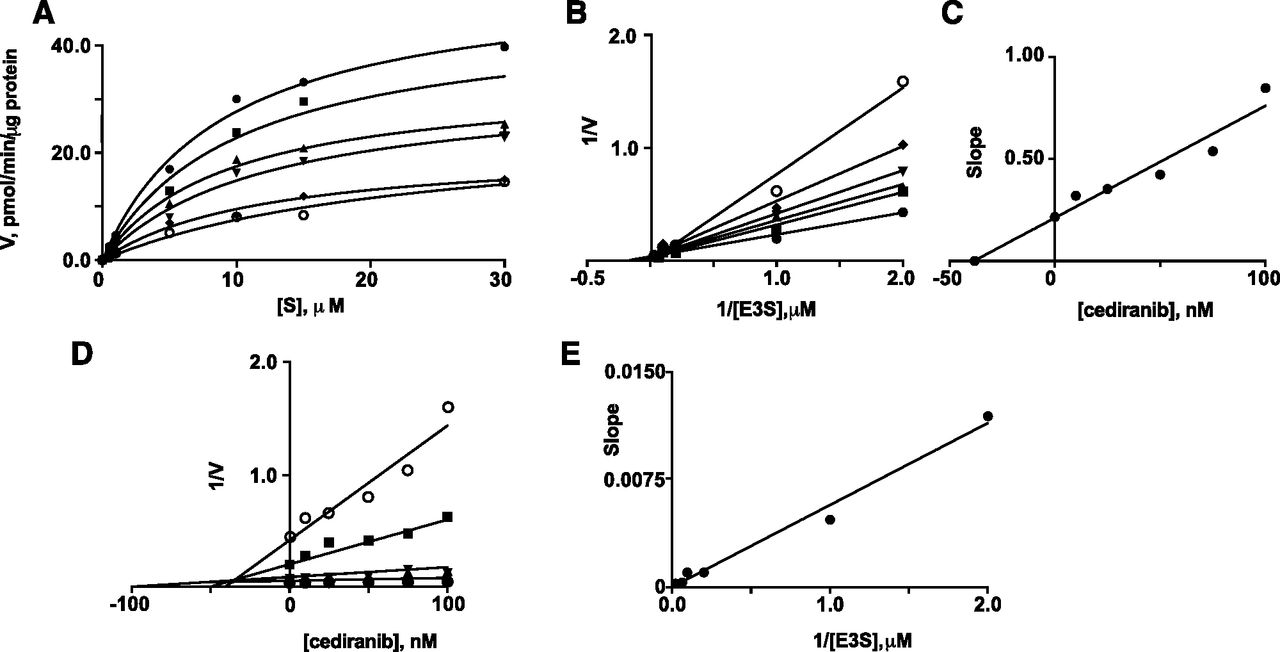
Two particularly potent interactions were identified—inhibition of OATP2B1-mediated E3S uptake by erlotinib and inhibition of OATP1A2-mediated E3S uptake by cediranib (IC50 values 0.03 µM). Kinetic constants were determined for E3S uptake by OATP2B1 (Km 3.4 ± 0.8 µM and Vmax 21.3 ± 2.1 pmol/min per µg protein; Fig. 2A); previous studies in transfected HEK293 and Caco-2 cells reported similar Km values for E3S uptake of 8.1 and 1.6 µM, respectively (Nozawa et al., 2004; Sai et al., 2006). Inhibition of E3S transport by erlotinib exhibited a Ki of 41 nM (Fig. 2, B and C). Dixon and Dixon slope replot analyses were consistent with competitive inhibition (Fig. 2, D and E; Segel, 1975). In the case of E3S uptake by OATP1A2, the Km was 9.0 ± 1.1 µM and Vmax was 52.8 ± 2.6 pmol/min per µg protein (Fig. 3A); cediranib was found to be a competitive inhibitor of E3S uptake by OATP1A2 (Ki 33 nM; Fig. 3). Previous studies in transfected HEK293 and Chinese hamster ovary cells reported similar Km values for E3S uptake by OATP1A2 of 12.5 and 2.4 µM, respectively (Cui et al., 2001; Gui et al., 2008).
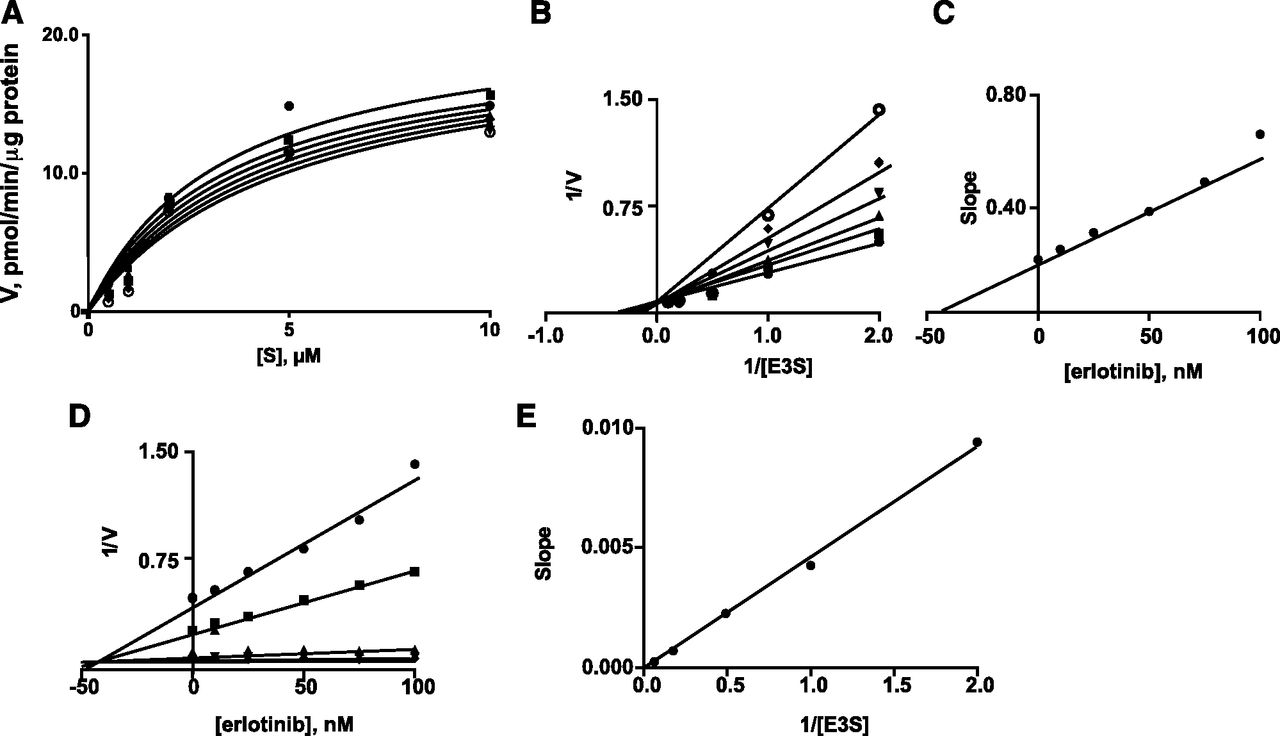
Inhibition by erlotinib of OATP2B1-mediated E3S uptake in transfected HEK293 cells. (A) Michaelis-Menten plots of E3S uptake in the presence of different concentrations of erlotinib: (●) 0 nM, (▪) 10 nM, (▴) 25 nM, (▾) 50 nM, (◆) 75 nM, and (o) 100 nM. (B) Lineweaver-Burk plots of the data. (C) Replot of the slopes from the Lineweaver-Burk plots. (D) Dixon plots in the presence of different concentrations of E3S: (●) 0.5 µM, (▪) 1 µM, (▴) 2 µM, (▾) 5 µM, and (◆) 10 µM. (E) Replot of the slopes from the Dixon plots. Units of E3S uptake (V): pmol/min per µg protein. A representative analysis from three individual experiments is shown; kinetic constants varied by less than 8%.

Inhibition by cediranib of OATP1A2-mediated E3S uptake in transfected HEK293 cells. (A) Michaelis-Menten plots of E3S uptake in the presence of different concentrations of cediranib: (●) 0 nM, (▪) 10 nM, (▴) 25 nM, (▾) 50 nM, (◆) 75 nM, and (o) 100 nM. (B) Lineweaver-Burk plots of the data. (C) Replot of the slopes from the Lineweaver-Burk plots. (D) Dixon plots in the presence of different concentrations of E3S: (o) 0.5 µM, (▪) 1 µM, (▾) 5 µM, (▴) 10 µM, (◆) 15 µM, and (●) 30 µM. (E) Replot of the slopes from the Dixon plots. Units of E3S uptake (V): pmol/min per µg protein. A representative analysis from three individual experiments is shown; kinetic constants varied by less than 8%.
Predictive approaches were used to assess the potential in vivo significance of potent in vitro inhibitory interactions. In these approaches, values for the unbound drug concentrations in plasma and IC50 data were analyzed using eq. 1. It has been proposed that the criterion Cmax,u/IC50 ≥ 0.1 (i.e., that the unbound peak serum concentration is at least one-tenth of that required for 50% inhibition in vitro) should be met for potential clinical significance (Ito et al., 1998; Giacomini et al., 2010). As shown in Table 2, inhibition of OATP1A2, OATP1B3, and, in particular, OATP2B1 by erlotinib; inhibition of OATP1A2 by cediranib; inhibition of OATP2B1 by gefitinib; and inhibition of OAT3 by nilotinib met this criterion. In further analyses, the unbound steady-state concentration of these MKIs in portal blood was calculated (eq. 2). In these calculations, two values for the absorption rate constant (ka) were tested, 0.03 and 0.1, which represent conservative and apparent maximal rates of intestinal absorption, respectively. IC50 values and, where determined, Ki values were then analyzed by eq. 3 and 4 to determine R values that reflect the predicted increase in drug exposure from the available MKI entering the liver; the criterion R > 2.0 is taken as the cutoff and predicts a 2-fold increase in drug exposure (Ito et al., 1998; Giacomini et al., 2010). Thus, the inhibition of OATP2B1-dependent uptake by erlotinib could have great potential significance (R = 16.1–45.0; Table 3). Inhibition of OATP1A2 by cediranib and inhibition of OATP2B1 by gefitinib may also be significant (R = 2.00–5.43), but R values for the other interactions only exceeded the criterion at the higher ka value (Table 3).
In vitro IC50 values for inhibition of SLC transporter-mediated substrate uptake by MKIs and in vivo unbound plasma concentrations (Cmax,u)
Parameters used to calculate Cmax,u(portal) and R values for MKIs with Cmax,u/IC50 > 0.1
Data were obtained from the following references: Frohna et al., 2006; Hazarika et al., 2008; Hughes et al., 2009; van Erp et al., 2009; Yamamoto et al., 2009; Tanaka et al., 2010; Larson et al., 2012; McTigue et al., 2012; O’Brien and Fallah Moghaddam, 2013.
The present findings suggest that there is potential for interaction between erlotinib or gefitinib and substrates of OATP2B1, which include drugs such as montelukast, aliskiren, and certain statins, and endogenous molecules, such as sulfated estrogens, thyroxine, and taurocholate (Noé et al., 2007; Roth et al., 2012). Similarly, erlotinib and cediranib may elicit interactions with OATP1A2 substrates that include the anticancer agents imatinib, methotrexate, and hydroxyurea (Hu et al., 2008; Walker et al., 2011; Roth et al., 2012). Erlotinib may also precipitate interactions with OATP1B3 that also transports drugs, such as the anticancer agents docetaxel, hydroxyurea, imatinib, methotrexate, and paclitaxel (Smith et al., 2005; Walker et al., 2011; Roth et al., 2012).
The MKIs tested belong to four heterocyclic classes. As shown in Fig. 1, six are substituted quinazolines, four are quinolone derivatives, nilotinib and the sorafenib analogs are substituted pyridines, and sunitinib is an indolinone. The three most effective transporter inhibitors, erlotinib, gefitinib, and cediranib, are substituted quinazolines, suggesting that this structural moiety mediates potent inhibition. However, other members of the class—afatinib, lapatinib, and vandetanib—were not especially potent inhibitors. Attempts to define a structure activity relationship using common medicinal chemistry descriptors such as cLogP, number of rotatable bonds/H-bond acceptors/H-bond donors, and PSA were inconclusive. Erlotinib, gefitinib, and cediranib all had relatively small PSAs, seven to eight rotatable bonds, seven H-bond acceptors, and only one H-bond donor (Table 4). In contrast, the inactive quinazolines lapatinib and afatinib had larger PSAs that may contribute to decreased permeability and two H-bond donor atoms; both vandetanib and lapatinib had high cLogP values. Previous studies have shown that lipophilic character is negatively correlated with inhibition of some SLC transporters (Minematsu and Giacomini, 2011) but is a determinant of substrate interactions with OATs and OATPs (Chang et al., 2005; Kaler et al., 2007; De Bruyn et al., 2013).
Physicochemical properties of MKIs
Data calculated using ChemBioDraw Ultra 13.0 Suite (PerkinElmer).
At present, there is a limited amount of information regarding the capacity of MKI drugs to interact with human influx transporters. Several of the drugs have been found to be substrates or inhibitors of organic cation transporters (Minematsu and Giacomini, 2011; Roth et al., 2012) and organic anion transporters (Roth et al., 2012; Hu et al., 2014). The present findings that erlotinib is a potent inhibitor of E3S uptake by OATP2B1, whereas OATP1B1 and OATP1B3 are less responsive to the drug, are consistent with an earlier report (Karlgren et al., 2012). However, the interactions of MKIs with SLC transporters may also be influenced by the particular substrate used in assays (Izumi et al., 2013) and by the duration of incubations (Shitara et al., 2013). In the present study, CCK-8 uptake by OATP1B3 was inhibited by erlotinib with an IC50 of 1.19 µM, whereas the IC50 for inhibition of estradiol 17β-glucuronide uptake was higher at 44 µM (Karlgren et al., 2012). Similarly, two studies conducted in different cell types reported apparently conflicting findings that sorafenib was (Zimmerman et al., 2013) and was not (Hu et al., 2009) transported by OATP1B1. These authors suggested that cell context may affect xenobiotic transport. In this regard, it was reported recently that sorafenib was a potent inhibitor of docetaxel transport in OATP1B1-transfected Flp-In-T-Rex293 cells after a 15-minute preincubation (IC50 ∼0.07 µM; Hu et al., 2014), whereas E3S uptake by OATP1B1 in HEK293 cells (without preincubation) was only weakly inhibited in the present study by two sorafenib metabolites.
MKI-SLC transporter interactions could impair drug clearance if the transporter has a major exclusive role in elimination, but it is also very likely that impaired uptake into target cells could diminish efficacy. Unlike pharmacokinetic interactions, which are readily identified by altered drug concentrations in serum and may produce toxicity, decreased uptake into cells is more difficult to detect since this compartment cannot be sampled conveniently. However, such interactions may lead to failure of therapy, and further studies, including uptake studies in cancer cell lines and pharmacokinetic interaction studies in vivo, are now required to directly test the clinical significance of the MKI-SLC interactions detected in the present study.
Authorship Contributions
Participated in research design: Johnston, Zhou, Murray.
Conducted experiments: Johnston, Rawling, Chan, Zhou.
Contributed new reagents or analytic tools: Rawling.
Performed data analysis: Johnston, Chan, Zhou, Murray.
Wrote or contributed to the writing of the manuscript: Johnston, Rawling, Zhou, Murray.
Footnotes
- Received May 14, 2014.
- Accepted August 27, 2014.
This work was supported by a grant from Cancer Council New South Wales [Grant RG09-14]. R.A.J. was the recipient of a Northcote Graduate Scholarship Award from The Britain-Australia Society.
Abbreviations
- CCK-8
- cholecystokinin octapeptide
- cLogP
- calculated logarithm (base 10) of the oil/water partition coefficient
- Cmax,u
- maximal unbound MKI concentrations in plasma
- Cmax,u(portal)
- maximal unbound concentration of unbound MKI in portal blood at the entrance to the liver
- E3S
- estrone-3-sulfate
- fu
- unbound fraction in plasma
- ka
- absorption rate constant
- MKI
- multikinase inhibitor
- MPP+
- 1-methyl-4-pyridinium acetate
- OAT
- organic anion transporter
- OATP
- organic anion transporting polypeptide
- OCT
- organic cation transporter
- OCTN
- organic zwitterion/cation transporter
- PSA
- polar surface area
- SLC
- solute carrier
- Copyright © 2014 by The American Society for Pharmacology and Experimental Therapeutics


