


Abstract
Human cytochrome P450 2E1 (CYP2E1) catalyzes the metabolism of numerous xenobiotics, including acetaminophen and ethanol. CYP2E1 expression is known to be extensively regulated by post-transcriptional and post-translational mechanisms. A previous study had reported that a single-nucleotide polymorphism (SNP) 1561A>G in the 3′-untranslated region (3′-UTR) of CYP2E1 leads to a decreased CYP2E1 mRNA level in human peripheral blood mononuclear cells. In this study, we examined the possibility that microRNA(s) (miR) may be involved in the SNP-mediated modulation of CYP2E1 expression. Genotyping and sequencing analyses revealed that another SNP, 1556T>A, in the 3′-UTR was in complete linkage disequilibrium with the SNP 1561A>G. We termed the alleles with 1556T and 1561A or 1556A and 1561G haplotype I or II, respectively. A luciferase assay revealed that miR-570 recognizes the CYP2E1 3′-UTR of haplotype I but not haplotype II. Human embryonic kidney 293 (HEK293) cell lines stably expressing human CYP2E1 that included the 3′-UTR of haplotype I or II (HEK/2E1(I) or HEK/2E1(II) cells, respectively) were established. Overexpression of miR-570 significantly decreased the CYP2E1 protein level in the HEK/2E1(I) cells but not in the HEK/2E1(II) cells. In seven human livers with diplotype I/I, the CYP2E1 protein levels were inversely correlated with the miR-570 levels, but no relationship was observed in 25 human livers with diplotypes I/II and II/II. Collectively, it was demonstrated that human CYP2E1 was regulated by miR-570 in a genotype-dependent manner. This report describes the first proof that SNP in 3′-UTR of human P450 affects binding of miRNA to modulate the expression in the liver.
Introduction
Human cytochrome P450 2E1 (CYP2E1) is responsible for the metabolism of a large number of relatively small xenobiotics, including acetaminophen, isoniazid, chlorzoxazone, ethanol, carbon tetrachloride, and N-nitrosodimethylamine (Lu and Cederbaum, 2008). CYP2E1 is induced by such substrates including isoniazid, ethanol, and acetone, resulting in enhancement of their clearance (Bolt et al., 2003). It should be noted that post-transcriptional or post-translational regulation appears to be involved in the CYP2E1 induction by chemicals (Song et al., 1986). Roberts et al. (1995) have proposed a mechanism for the CYP2E1 induction as the stabilization of the protein. In addition, a previous study reported that there is no positive correlation between the CYP2E1 mRNA levels and chlorzoxazone 6-hydroxylase activity, a probe activity for CYP2E1 in 15 human liver samples (Sumida et al., 1999). Collectively, these data indicate that post-transcriptional regulation would be responsible for the constitutive and inducible expression of CYP2E1 in human liver.
Previously, we reported that CYP2E1 is negatively regulated by miR-378, a mechanism for the post-transcriptional regulation (Mohri et al., 2010). MicroRNAs (miRNAs, miR), an evolutionarily conserved class of endogenous ∼22-nucleotide noncoding RNAs, bind to the 3′-untranslated regions (3′-UTR) of target mRNAs causing translational repression or mRNA degradation (Bartel, 2004). To date, over 2,500 miRNAs have been identified in humans, and it has been estimated that 60% of human mRNAs could be targeted by miRNAs (Bartel, 2004; Friedman et al., 2009). Previously, we found that miRNAs regulate human xenobiotic-metabolizing enzymes such as CYP1B1 (Tsuchiya et al., 2006) and CYP2A6 (Nakano et al., 2015). Another research group reported that human CYP2C8 is also regulated by miRNAs (Zhang et al., 2012).
Recently, Liao et al. (2011) reported that a single-nucleotide polymorphism (SNP), 1561A>G, located in the 3′-UTR of CYP2E1 is linked with the decreased expression level of CYP2E1 mRNA in human peripheral blood mononuclear cells (PBMC). However, the underlying mechanism remains to be clarified. Because miRNAs usually bind to the 3′-UTR, it is possible that a SNP in the 3′-UTR may cause the binding of miRNA to be gained or lost (Chen et al., 2008). In this study, we investigated whether the SNPs in the 3′-UTR of CYP2E1 affect its regulation by miRNA.
Materials and Methods
Chemicals and Reagents.
The pGL3-promoter vector, phRL-TK vector, pTARGET vector, and a dual-luciferase reporter assay system were purchased from Promega (Madison, WI). Lipofectamine 2000, Lipofectamine RNAiMAX, the miRVana miRNA mimic for miR-570, miR-378, and negative control 1 were purchased from Life Technologies (Carlsbad, CA). RNAiso, random hexamer, and SYBR Premix Ex Taq were obtained from Takara (Shiga, Japan). ROX and ReverTra Ace were purchased from Stratagene (La Jolla, CA) and Toyobo (Osaka, Japan), respectively. All primers and oligonucleotides were commercially synthesized at Hokkaido System Sciences (Sapporo, Japan). G418 was obtained from Wako Pure Chemicals (Osaka, Japan). Rabbit anti-human CYP2E1 polyclonal antibody and rabbit anti-human glyceraldehyde-3-phosphate dehydrogenase (GAPDH) polyclonal antibody were purchased from Santa Cruz Biotechnology (Santa Cruz, CA) and IMGENIX (San Diego, CA), respectively. IRDye 680 goat anti-rabbit IgG and goat anti-mouse IgG were from LI-COR Biosciences (Lincoln, NE). Restriction enzymes were from New England Biolabs (Ipswich, MA). All other chemicals and solvents were of the highest grade commercially available.
Genomic DNA Extraction from Human Blood Samples.
Blood samples were obtained from 50 European-American, 50 African-American, and 50 Japanese healthy participants, all of whom provided written informed consent. Genomic DNA was extracted from the human blood samples using the Puregene DNA isolation kit (Qiagen, Tokyo, Japan). The study using genomic DNA samples was approved by the ethics committees of Kanazawa University (Kanazawa, Japan) and the Human Studies Committee of Washington University School of Medicine (St. Louis, MO).
Genotyping Assays of CYP2E1 c.1556T>A and c.1561A>G Alleles.
To genotype the 1556T>A, an allele-specific PCR (AS-PCR) analysis was performed. The primers used were 1556T-S or 1556A-S and 3′-UTR-AS (Table 1). The PCR mixture contained the genomic DNA (100 ng), 1× PCR buffer [67 mM Tris-HCl, pH 8.8, 16.6 mM (NH4)2SO4, 0.45% Triton X-100, 0.02% gelatin], 1.5 mM MgCl2, 0.2 mM dNTPs, 0.4 µM of each primer, and 0.5 U of Taq polymerase in a final volume of 25 µl. After an initial denaturation at 94°C for 3 minutes, the amplification was performed with denaturation at 94°C for 30 seconds, annealing at 58°C for 30 seconds, and extension at 72°C for 15 seconds for 35 cycles, followed by a final extension at 72°C for 5 minutes. The PCR product was subjected to electrophoresis using a 2% agarose gel.
Sequences of oligonucleotides used in this study
To genotype the 1561A>G, a PCR restriction fragment length polymorphism analysis was performed. The PCR product was digested with BstB I. The digestion patterns were determined using electrophoresis in a 4% agarose gel. The 1561A allele yielded a 141-bp (base pair) fragment, whereas the 1561G allele yielded 110-bp and 32-bp fragments.
Construction of Reporter Plasmids.
Fragments containing +1519 to +1561 of the human CYP2E1 mRNA haplotype I (5′-TGT GGA GGACAC CCU GAACCC CCC GCT TTC AAA CAA GTT TTC A-3′) and haplotype II (5′-TGT GGA GGACAC CCU GAACCC CCC GCT TTC AAA CAA GAT TTC G-3′) were cloned into the pGL3p vector at the XbaI site downstream of the luciferase gene. These plasmids were termed pGL3/MRE(I) [pGL3-microRNA recognition element (I)] and pGL3/MRE(II), respectively. A fragment containing the sequence perfectly matching the mature miR-570, 5′-CTA GAG CAA AGG TAA TTG CTG TTT TCG T-3′ (the sequence complementary to miR-570 is italicized) was cloned into the pGL3-promoter vector, resulting in pGL3/c-miR-570.
Cell Cultures and Luciferase Assay.
Human embryonic kidney derived HEK293 cells obtained from American Type Culture Collection (Rockville, MD) were cultured in Dulbecco’s modified Eagle’s medium (Nissui Pharmaceutical, Tokyo, Japan) containing 4.5 g/l glucose, 10 mM HEPES, and 10% fetal bovine serum (Invitrogen/Life Technologies, Carlsbad, CA). HepaRG cells purchased from KAC (Kyoto, Japan) were seeded into six-well plates at a density of 2 × 10⁴ cells/well in Williams’ E medium supplemented with 10% fetal bovine serum, 100 U/ml penicillin, 100 μg/ml streptomycin, 5 μg/ml insulin, 2 mM glutamine, and 50 μM hydrocortisone hemisuccinate. After 2 weeks, the HepaRG cells were further cultured in the same medium supplemented with 2% dimethyl sulfoxide for 2 weeks to obtain confluent differentiated cultures with the maximal functional activities. These cells were cultured at 37°C under an atmosphere of 5% CO2, 95% air.
The various luciferase reporter plasmids (pGL3) were transiently transfected with the phRL-TK plasmid into the HEK293 cells. Briefly, the day before transfection, the cells were seeded onto 24-well plates. After 24 hours, 190 ng of the pGL3 plasmid, 10 ng of the phRL-TK plasmid and the miR-570 mimic or control were cotransfected using Lipofectamine 2000. After incubation for 48 hours, the cells were lysed with a passive lysis buffer, and the luciferase activity was then measured with a luminometer (Wallac, Turku, Finland) using the dual-luciferase reporter assay system.
Establishment of HEK293 Cell Lines Stably Expressing Human CYP2E1 Haplotype I or Haplotype II.
The expression plasmids for CYP2E1 including the 3′-UTR of haplotype I (pTARGET/2E1(I)) and the HEK293 cell lines stably expressing the human CYP2E1 haplotype I (HEK/2E1(I) cells) were previously established (Mohri et al., 2010). To construct the expression plasmid for CYP2E1 (II), the c.1556T>A and c.1561A>G mutations were introduced into the pTARGET/2E1 (I) through site-directed mutagenesis using a Quick Change II XL site-directed mutagenesis kit (Stratagene). The primers used were SDM-S and SDM-AS (Table 1). The constructed plasmid was termed pTARGET/2E1 (II). The nucleotide sequence of the plasmid was confirmed by DNA sequencing analysis. To establish the HEK293 cell lines stably expressing the human CYP2E1 haplotype II (HEK/2E1(II) cells), HEK293 cells were seeded into 24-well plates, and 500 ng of the pTARGET/2E1(II) plasmids were transfected using Lipofectamine 2000 according to the manufacturer’s protocols. Forty-eight hours after transfection, the cells were passaged and subsequently grown in medium containing 400 mg/ml G418 at dilutions from 1:10 to 1:1000. The selective medium was replaced every 3 to 4 days, and individual G418-tolerant colonies were selected after 2 weeks in culture. The tolerant clones were screened by Western blot analysis. The CYP2E1 protein levels were confirmed to be sustained regardless of the repeated subculture.
Transfection of miR-570 and the miR-378 Mimic into HEK/2E1(I), HEK/2E1(II), or HepaRG Cells, and Preparation of Cell Homogenates and Total RNA.
The miRNA mimic was transfected into the HEK/2E1(I), HEK/2E1(II), or HepaRG cells as follows: the day before transfection, the HEK/2E1(I) or HEK/2E1(II) cells were seeded onto six-well plates. After 24 hours, 10 nM miR-570 mimic, miR-378 mimic, or control was transfected into the HEK/2E1(I) and HEK/2E1(II) cells using Lipofectamine RNAiMAX. The differentiated HepaRG cells were similarly transfected with the miRNA mimic. After incubation for 48 hours, the cells were harvested and suspended in a small amount of TGE buffer [10 mM Tris-HCl, 20% glycerol, 1 mM EDTA (pH 7.4)], disrupted using three freeze-thaw cycles, and homogenized. The total RNA was prepared using RNAiso according to the manufacturer’s protocols.
Human Livers and Preparation of Genomic DNA, Microsomes, and Total RNA.
Human liver samples from 16 donors were supplied by the National Disease Research Interchange (Philadelphia, PA) through the Human and Animal Bridging Research Organization (Chiba, Japan), and samples from 10 donors were obtained from autopsy materials that had been discarded after pathologic investigation in Iwate Medical University (Morioka, Japan). The use of the human livers was approved by the ethics committees of Kanazawa University (Kanazawa, Japan) and Iwate Medical University (Morioka, Japan). Genomic DNA samples were extracted from the 32 human liver samples using a Puregene DNA isolation kit (Qiagen) according to the manufacturer’s protocols. Microsomes were prepared according to the method described previously elsewhere (Mohri et al., 2010). The protein concentrations were determined using the Bradford protein assay reagent (Bio-Rad Laboratories, Hercules, CA) with γ-globulin as a standard. Total RNA was prepared using RNAiso, and the integrity was confirmed by estimating the ratio of the band densities of the 28S and 18S rRNA.
SDS-PAGE and Western Blot Analyses of CYP2E1.
The cell homogenates from HEK/2E1(I), HEK/2E1(II) or HepaRG cells (30 μg) and human liver microsomes (20 μg) were separated on 7.5% SDS-PAGE and transferred to Immobilon-P transfer membranes (Millipore, Billerica, MA). The membranes were probed with rabbit anti-human CYP2E1 or rabbit anti-human GAPDH antibodies and the corresponding fluorescent dye-conjugated second antibodies. The band densities were quantified with an Odyssey Infrared Imaging system (LI-COR Biosciences). The CYP2E1 protein levels were normalized to the GAPDH protein levels.
Real-Time Reverse-Transcription Polymerase Chain Reaction for CYP2E1.
The cDNA was synthesized from the total RNA using ReverTra Ace (Stratagene). The primers for human CYP2E1 and GAPDH were described previously elsewhere (Tsuchiya et al., 2004; Mohri et al., 2010). A 1-μl portion of the reverse-transcribed mixture was added to a PCR mixture containing 10 pmol of each primer, 12.5 μl of SYBR Premix Ex Taq solution, and 75 nM Rox in a final volume of 25 μl. The PCR conditions were as follows: after an initial denaturation at 95°C for 30 seconds, the amplification was performed by denaturation at 94°C for 4 seconds, annealing and extension at 58°C for 20 seconds for 40 cycles. The real-time reverse-transcription polymerase chain reaction (RT-PCR) was performed using an Mx3000P instrument (Stratagene) with the MxPro QPCR software. The CYP2E1 mRNA levels were normalized to the GAPDH mRNA levels.
Real-Time RT-PCR for Mature miR-570 and miR-378.
The expression levels of mature miR-570 and miR-378 were determined by using TaqMan microRNA assay (Applied Biosystems, Foster City, CA). The cDNA templates were prepared using a TaqMan microRNA Reverse Transcription kit, which uses the stem-loop reverse primers according to the manufacturer’s protocols. The product of the reverse transcription reaction was mixed with the TaqMan Universal PCR Master Mix and the TaqMan MicroRNA assay reagents containing the forward and reverse primers as well as the TaqMan probe for miR-570 and miR-378. The PCR conditions were as follows: after an initial denaturation at 95°C for 10 minutes, the amplification was performed by denaturation at 95°C for 15 seconds, annealing and extension at 60°C for 60 seconds for 40 cycles. The expression levels of U6 small nuclear RNA (U6 snRNA) were also determined by using the TaqMan microRNA assay and were used to normalize the miR-570 and miR-378 levels.
Statistical Analyses.
The ethnic differences in the allele frequencies were tested using Fisher’s exact method. The statistical significance was determined by analysis of variance followed by Dunnett’s multiple comparisons test or Turkey’s test. The comparisons between two groups was made using the unpaired, two-tailed Student’s t test. The correlation analyses were performed using Pearson’s product-moment method. P < 0.05 was considered statistically significant.
Results
Genotyping for Two SNPs in CYP2E1 3′-UTR.
According to NCBI database, another SNP, 1556 T>A, is present close to the 1561A>G in CYP2E1 3′-UTR. Therefore, we performed genotyping for these SNPs by using genomic DNA samples from 50 European-American, 50 African-American, and 50 Japanese subjects. Schemes and representative results of the genotyping are shown in Fig. 1. It was discovered that these two SNPs were in complete linkage disequilibrium. We termed the alleles with 1556T and 1561A or 1556A and 1561G haplotype I or II, respectively. The allele frequencies of haplotype II were 84%, 75%, and 58% in European-American, African-American, and Japanese subjects, respectively, and they were in accordance with the Hardy-Weinberg equation (Fig. 1E). The allele frequency of haplotype II in the Japanese subjects was statistically significantly lower than those of the European Americans (P < 0.001) or African Americans (P < 0.05).
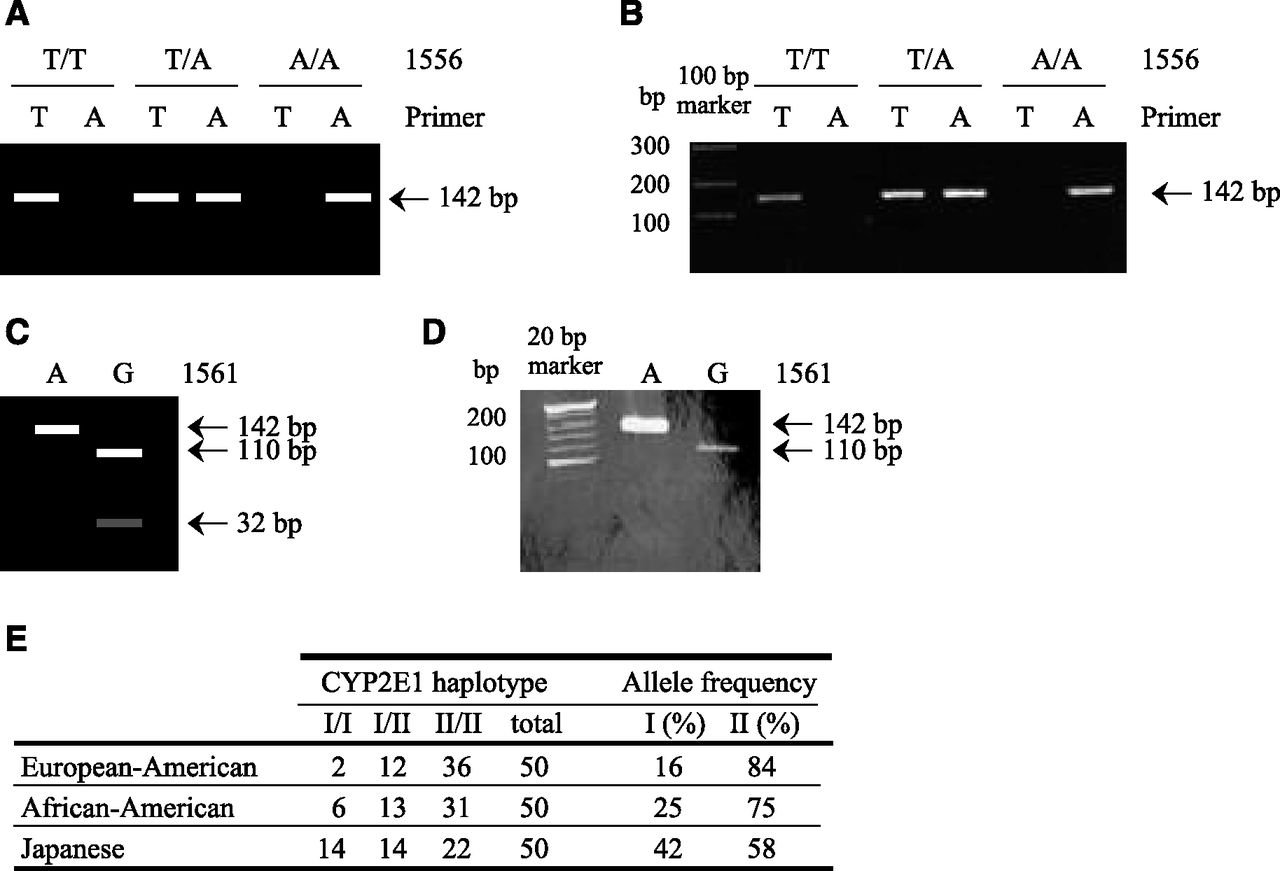
Genotyping of 1556T>A and 1561A>G of CYP2E1. Schematic (A) and representative (B) AS-PCR patterns for 1556T>A. Schematic (C) and representative (D) PCR restriction fragment length polymorphism patterns for 1561A>G. (E) Allele frequencies of the haplotypes of SNPs in the 3′-UTR of CYP2E1 in three populations.
CYP2E1 Expression Levels with Different CYP2E1 Diplotypes.
To investigate whether the SNPs in the 3′-UTR affect CYP2E1 expression, the CYP2E1 mRNA and protein levels in a panel of 32 individual human livers were compared among the different diplotypes. Among the 32 liver samples, seven samples were I/I, 10 samples were I/II, and 15 samples were II/II. The overall variability ranges of the CYP2E1 mRNA and protein levels in the 32 samples were 18-fold and 26-fold, respectively. The CYP2E1 mRNA and protein levels in the 32 human livers were related to the diplotypes. The CYP2E1 mRNA levels tended to be lower in diplotype II/II than in I/II or I/I (Fig. 2A), and this result coincided with the previous report using PBMC (Liao et al., 2011). On the other hand, the CYP2E1 protein levels tend to be higher in diplotype II/II than in I/I (Fig. 2B), although there was no statistically significant differences between these groups. These results suggest that the CYP2E1 protein level was higher in samples with haplotype II than in those with haplotype I due to regulation at the post-transcriptional level.

CYP2E1 mRNA (A) and protein levels (B) in human livers with various CYP2E1 diplotypes. The CYP2E1 mRNA and protein levels in a panel of 32 human livers were measured by real-time RT-PCR and Western blot analysis, respectively, and were normalized to the GAPDH levels. The data are the means of two independent experiments. The values represent the levels relative to that of the lowest one.
Luciferase Assay to Investigate Whether the SNPs in MRE Affect the Recognition of miR-570.
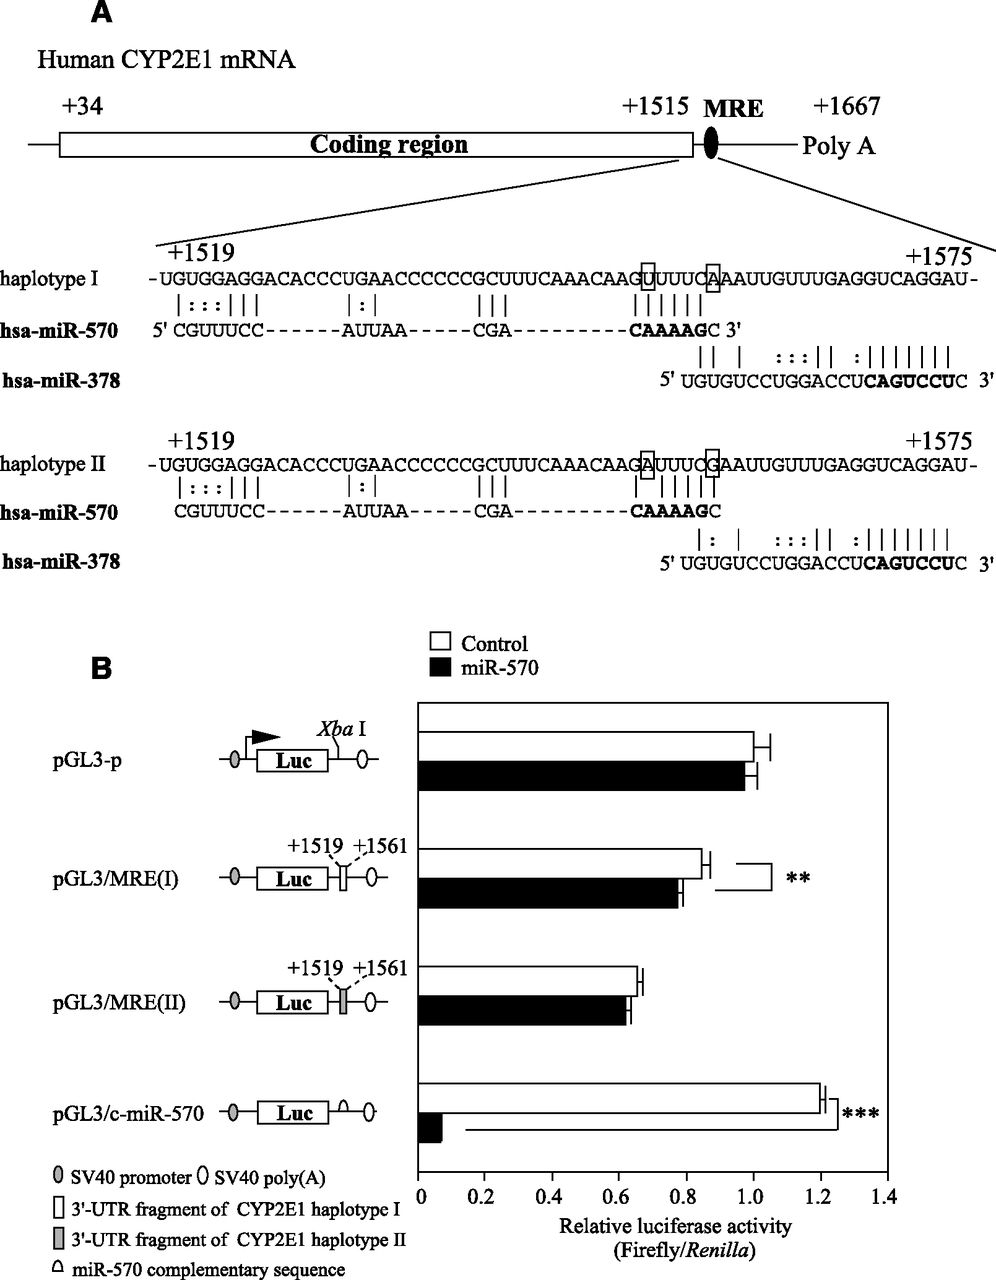
We surmised that miRNA(s) might be involved in the difference in the CYP2E1 expression level between diplotypes. By a computational search using MicroSNiPer (http://epicenter.ie-freiburg.mpg.de/services/microsniper/), miR-570 was predicted to bind to the sequence around the SNPs. The miRNA recognition element (MRE) of miR-570 is closely located upstream of the MRE of miR-378, which was found to regulate CYP2E1 expression in our previous study (Mohri et al., 2010) (Fig. 3A).

Luciferase assay using plasmids containing the MRE in the 3′-UTR of human CYP2E1 mRNA. (A) Schematic representation of the human CYP2E1 haplotypes I and II mRNA, and the predicted target sequences of miR-570. The numbering refers to the 5′ end of the mRNA as 1. The MRE of miR-570 and miR-378 are located in the 3′-UTR of the human CYP2E1 mRNA (from +1519 to +1561 and from 1559 to 1575, respectively). Bold letters indicate the seed sequence. 1556T>A and 1561A>G are shown in rectangles. (B) Luciferase assay using reporter plasmids containing various fragments downstream of the firefly luciferase gene. The reporter plasmids (190 ng) were transiently transfected with the phRL-TK plasmid (10 ng) and the miR-570 mimic or negative control 1 (control) into HEK293 cells. The firefly luciferase activity for each construct was normalized to the Renilla luciferase activity. The values represent the values relative to the pGL3-p plasmid. Each column represents the mean ± S.D. of three independent experiments. *P < 0.05.
To investigate whether the SNPs in the MRE of miR-570 affect the recognition of miR-570, a luciferase assay using reporter plasmids containing fragments including MRE of CYP2E1 haplotype I or II was performed with HEK293 cells. When the pGL3/c-miR-570 plasmid containing the miR-570 complementary sequence was assayed, the luciferase activity was significantly (P < 0.001) decreased (5.5% of control) by the cotransfection with the miR-570 mimic, suggesting that the overexpressed miR-570 was functional. The luciferase activity of the pGL3/MRE(I) plasmid was slightly (92% of control) but significantly (P < 0.05) decreased, whereas that of the pGL3/MRE(II) plasmid was not affected (Fig. 3B). These results suggest that miR-570 recognizes the MRE of the CYP2E1 haplotype I.
Effects of Overexpression of miR-570 and miR-378 on CYP2E1 Protein and mRNA Levels in HEK293 Stable Transformants.
To investigate whether miR-570 and miR-378 regulate CYP2E1 expression in a haplotype-dependent manner, these miRNAs were overexpressed in HEK/2E1(I) and HEK/2E1(II) cells. When miR-570 was transfected into the HEK/2E1(I) cells, the CYP2E1 protein level was significantly (P < 0.001) decreased (60% of control) (Fig. 4A), whereas this did not occur in the HEK/2E1(II) cells (Fig. 4B). The overexpression of miR-378 decreased the CYP2E1 protein expression levels in the HEK/2E1(I) cells (29% of control) (Fig. 4A) in accordance with the our previous results (Mohri et al., 2010). A similar down-regulation by miR-378 was obtained in the HEK/2E1(II) cells (Fig. 4B). The CYP2E1 mRNA levels were not changed by the overexpression of miR-570 but were decreased by the overexpression of miR-378 in both cell lines (Figs. 4, C and D). These results indicated that miR-570 and miR-378 regulate CYP2E1 expression in haplotype-dependent and haplotype-independent manners, respectively.

Effects of the overexpression of miR-570 or miR-378 on the CYP2E1 level. The CYP2E1 protein levels in the HEK/2E1(I) (A) and HEK/2E1(II) (B) cells 48 hours after the transfection with 10 nM miR-570, miR-378 mimic, or negative control 1 (control) were determined using Western blot analysis and were normalized to the GAPDH protein levels. The CYP2E1 mRNA levels in the HEK/2E1(I) (C) and HEK/2E1(II) (D) cells were determined using real-time RT-PCR analysis and were normalized to the GAPDH protein level. The values represent the levels relative to no transfection (NT). Each column represents the mean ± S.D. of three independent experiments. *P < 0.05 and ***P < 0.001.
Effects of Overexpression of miR-570 and miR-378 on the CYP2E1 Protein and mRNA Levels in HepaRG Cells.
We investigated whether miR-570 and miR-378 regulate endogenous CYP2E1 using HepaRG cells. The genotype of the HepaRG cells was I/I. When miR-570 or miR-378 was transfected into the HepaRG cells, the CYP2E1 protein level was significantly (P < 0.05) decreased (68 or 60% of control) (Fig. 5A). The CYP2E1 mRNA level was not changed by the overexpression of miR-570 and was decreased (76% of control) by miR-378 (Fig. 5B). These results suggest that the endogenous CYP2E1 haplotype I is regulated by miR-570 and miR-378.

Effects of the overexpression of miR-570 or miR-378 on the endogenous CYP2E1 level in HepaRG cells. (A) The CYP2E1 protein levels in HepaRG cells 48 hours after the transfection of 10 nM miR-570, miR-378 mimic, or negative control 1 (control) were determined by Western blot analysis and were normalized to the GAPDH protein levels. (B) The CYP2E1 mRNA levels in HepaRG cells were determined by real-time RT-PCR analysis and were normalized to the GAPDH protein level. The values represent the levels relative to no transfection (NT). Each column represents the mean ± S.D. of three independent experiments. *P < 0.05 and ***P < 0.001.
Relationship between the Expression Levels of CYP2E1 mRNA, CYP2E1 Protein, miR-570, and miR-378 in the Human Liver.
To evaluate the significance of the miR-570- and miR-378-dependent down-regulation of CYP2E1 in human livers, we examined the relationship among the expression levels of CYP2E1 mRNA, CYP2E1 protein, miR-570, and miR-378 in 32 individual human liver specimens. The CYP2E1 protein levels were not positively correlated with the CYP2E1 mRNA levels (Rs = −0.19) (Fig. 6A), suggesting that post-transcriptional regulation plays an important role in the CYP2E1 expression in human liver. The miR-570 and miR-378 levels showed 21-fold and 46-fold variability, respectively, and showed a significant positive correlation with each other (Rs = 0.82, P < 0.001) (Fig. 6B). The miR-570 levels were inversely correlated with the CYP2E1 protein levels (Rs = −0.52, P < 0.01) (Fig. 6C) but not with mRNA levels (Rs = −0.63, P < 0.001) (Fig. 6D). Similarly, the miR-378 levels were inversely correlated with the CYP2E1 protein levels (Rs = −0.63, P < 0.001) (Fig. 6E) but not with mRNA levels (Rs = 0.45, P > 0.05) (Fig. 6F).

Relationships between (A) CYP2E1 mRNA and protein levels; (B) miR-378 and miR-570 levels; (C) miR-570 and CYP2E1 protein levels; (D) miR-570 and mRNA levels; (E) miR-378 and CYP2E1 protein levels; and (F) miR-378 and mRNA levels. The mature miR-570 and miR-378 levels in 32 human livers were determined by real-time RT-PCR and normalized to the U6 small nuclear RNA (snRNA) levels. The data shown are the mean of two independent experiments. The values represent the levels relative to that of the lowest one.
When the relationships were examined within each diplotype, an inverse correlation was observed between miR-570 and the CYP2E1 protein level in the seven human livers with diplotype I/I (Rs = −0.96, P < 0.01), but no relationship was observed in the other diplotypes, I/II (Rs = −0.35) and II/II (Rs = -0.41) (Fig. 6C). The miR-378 expression levels were inversely correlated with the CYP2E1 protein levels in all diplotypes (Fig. 6E). These results suggest that the CYP2E1 haplotype I is regulated by miR-570 in haplotype-dependent manner and by miR-378 in a haplotype-independent manner in human livers.
Discussion
Earlier studies have suggested that post-transcriptional or post-translational regulation is more important than transcriptional regulation for CYP2E1 expression in the human liver. Previously, we reported that CYP2E1 is regulated by miR-378 (Mohri et al., 2010). The present study sought to expand the role of miRNA(s) in CYP2E1 regulation in the human liver. It has been reported that a SNP 1561A>G located in the 3′-UTR of CYP2E1 leads to the decreased expression level of CYP2E1 mRNA in PBMC (Liao et al., 2011). MicroRNAs mainly bind to the 3′-UTR of target mRNAs to regulate their expression.
We hypothesized that the difference in the CYP2E1 mRNA levels between the genotypes might be due to differences in miRNA recognition. We found that another SNP, 1556T>A was in complete linkage disequilibrium with the 1561A>G SNP. Consistent with the previous report that used PBMCs, the CYP2E1 mRNA levels in the human livers were higher in those with diplotype I/I than those with diplotypes I/II or II/II (Fig. 2A). Despite the lower mRNA levels in samples with haplotype II, the protein levels tended to be higher in diplotype II/II or haplotype I/II than diplotype I/I (Fig. 2B), suggesting the involvement of post-transcriptional regulation. Accordingly, we surmised that miRNA(s) regulate CYP2E1 haplotype I but not haplotype II in human liver.
By in silico analysis, we searched for miRNAs for which binding might be affected by the SNPs in CYP2E1 3′-UTR. Because miR-570 was predicted as a candidate that recognizes only haplotype I, we investigated whether miR-570 might be involved in the different expression of CYP2E1 between two haplotypes. No miRNAs that would bind only to haplotype II were predicted. The overexpression of miR-570 in the HEK/2E1(I) cells significantly reduced the CYP2E1 protein expression but not the mRNA level (Fig. 4, A and C). In the HEK/2E1(II) cells, the CYP2E1 expression was not affected (Fig. 4, B and D). In both cell types, the overexpression of miR-378 significantly decreased the CYP2E1 expression.
These results suggest that miR-570 and miR-378 regulate CYP2E1 expression in genotype-dependent and -independent manners, respectively. The difference would be observed because 1556T>A is located in the sequence complementary to the seed sequence of miR-570 but not in that of miR-378 (Fig. 3A). Supporting this result, the endogenous CYP2E1 protein was down-regulated by miR-570 in the HepaRG cells, in which the CYP2E1 was diplotype I/I (Figs. 5, A and B). Collectively, these results indicated that the CYP2E1 haplotype I was down-regulated by miR-570 by translational repression, not by mRNA degradation.
In a correlation analysis using a panel of 32 human lives, the miR-570 expression levels were inversely correlated with the CYP2E1 protein levels in samples of diplotype I/I but not with the other diplotypes (Fig. 6C), supporting the cell-based experiments. On the other hand, miR-378 showed a significant inverse correlation with the CYP2E1 protein levels in all diplotypes (Fig. 6E). These results suggest that the genotype-dependent down-regulation by miR-570 as well as the genotype-independent regulation by miR-378 greatly impact the CYP2E1 expression in human livers. As negative controls, we performed correlation analysis between miR-570 levels and CYP3A4 protein levels, or miR-25 levels and CYP2E1 protein levels, because these miRNAs were not predicted as a regulator of such genes by computer analyses. There were no significant correlations between them (data not shown), indicating that the relationship between miR-570 levels and CYP2E1 expression levels is specific.
Surprisingly, there was a positive correlation between the levels of miR-570 and miR-378 (Fig. 6B), even though their chromosomal locations are different. Although the reason for this correlation was not clear, two possibilities can be considered. The first is that common factors are involved in the regulation of miR-570 and miR-378 expression. The second is that miR-570 indirectly affects the expression of miR-378, and vice versa. The gene coding miR-378 is within the intron 1 of the peroxisome-proliferator-activated receptor-γ coactivator 1β (PGC1β) gene on human chromosome 5. It has been shown that miR-378 is coexpressed with PGC1β in various tissues of mouse (Carrer et al., 2012) and that the HER2 signaling pathway leads to expression of PGC1β and miR-378 in human breast cancer cells (Eichner et al., 2010), indicating that the expression of miR-378 would parallel that of PGC1β.
For miR-570, an intergenic miRNA located on human chromosome 3, previous studies have reported that treatment with estradiol decreased the miR-570 expression level in the human breast cancer-derived MCF-7 cells (Cicatiello et al., 2010) and that the miR-570 expression level was low in alcoholic liver disease (Liu et al., 2013). However, information on the regulation of miR-570 expression is very limited. It would be of interest to investigate the cause of the interindividual differences of miR-570 and miR-378 and their relationship.
A previous in silico study indicated that SNPs in 3′-UTR of P450 isoforms could alter the miRNA binding to their mRNA (Ramamoorthy and Skaar, 2011), but there was no experimental evidence. We provided the first evidence that SNPs in the 3′-UTR of human P450 affects the binding of miRNAs to modulate its expression. The SNPs in the CYP2E1 3′-UTR, as well as the miR-570 and miR-378 levels in human liver, would be the causal factors for the interindividual variability in CYP2E1 expression in human livers.
Authorship Contributions
Participated in research design: Nakano, Fukami, Nakajima.
Conducted experiments: Nakano.
Contributed new reagents or analytic tools: Nakano, Mohri, Takamiya, McLeod.
Performed data analysis: Nakano, Nakajima.
Wrote or contributed to the writing of the manuscript: Nakano, Nakajima.
Footnotes
- Received May 26, 2015.
- Accepted July 21, 2015.
↵1 Current affiliation: Department of Forensic Medicine, Nagoya City University Graduate School of Medical Sciences, Kawasumi, Nagoya, Japan.
↵2 Current affiliation: Moffitt Cancer Center, Tampa, Florida.
This work was supported by Grant-in-Aid for Scientific Research (B) from Japan Society for the Promotion of Science [24390039].
Abbreviations
- AS
- allele specific
- CYP
- cytochrome P450 isoform
- GAPDH
- glyceraldehyde-3-phosphate dehydrogenase
- HEK293
- human embryonic kidney 293 cells
- miRNA
- microRNA
- MRE
- microRNA recognition element
- PBMC
- peripheral blood mononuclear cells
- PCR
- polymerase chain reaction
- PGC1β
- peroxisome-proliferator-activated receptor-γ coactivator 1β
- RT-PCR
- reverse-transcription polymerase chain reaction
- SNP
- single-nucleotide polymorphism
- 3′-UTR
- 3′-untranslated region
- Copyright © 2015 by The American Society for Pharmacology and Experimental Therapeutics


