


Abstract
The epidermal growth factor receptor (EGFR) regulates cellular expression levels of breast cancer resistance protein (humans: ABCG2, rodents: Abcg2) via its downstream signaling pathways. Drugs that inhibit EGFR signaling (e.g., tyrosine kinase inhibitors, antibodies) may lead to ABCG2-mediated drug-drug interactions (DDIs) by changing the disposition of concomitantly administered ABCG2 substrate drugs. In this study, we used positron emission tomography and magnetic resonance imaging to compare disposition of the model Abcg2 substrate [11C]erlotinib in a mouse model of hepatocyte-specific deletion of EGFR (EGFR∆hep mice, n = 5) with EGFRfl/fl control mice (n = 6), which have normal EGFR expression levels in all tissues. Integration plot analysis was used to estimate the rate constants for transfer of radioactivity from the liver into bile (kbile) and from the kidney into urine (kurine). EGFR∆hep mice showed significantly lower radioactivity concentrations in the intestine (1.6-fold) and higher radioactivity concentrations in the urinary bladder (3.2-fold) compared with EGFRfl/fl mice. Kbile was significantly decreased (3.0-fold) in EGFR∆hep mice, whereas kurine was by 2.2-fold increased. Western blot analysis of liver tissue confirmed deletion of EGFR and showed significant decreases in Abcg2 and increases in P-glycoprotein (Abcb1a/b) expression levels in EGFR∆hep versus EGFRfl/fl mice. Our data show that EGFR deletion in hepatocytes leads to a reduction in Abcg2-mediated hepatobiliary clearance of a probe substrate accompanied by a shift to renal excretion of the drug, which raises the possibility that EGFR-inhibiting drugs may cause ABCG2-mediated DDIs.
Introduction
The ATP-binding cassette (ABC) transporter breast cancer resistance protein (ABC subfamily G member 2, humans: ABCG2, rodents: Abcg2) influences drug disposition as it recognizes diverse drugs and drug metabolites as its substrates (e.g., rosuvastatin, sulfasalazine, mitoxantrone, topotecan, prazosin, dantrolene, ciprofloxacin, erlotinib, gefitinib) (Lee et al., 2015; Mao and Unadkat, 2015). ABCG2 is expressed in the canalicular (bile-facing) membrane of hepatocytes and in the brush-border membrane of kidney proximal tubule cells, where it promotes hepatobiliary and urinary excretion of drugs or drug metabolites. ABCG2 also limits oral absorption of drugs in the small intestine and restricts the distribution of drugs in the brain, often in concert with P-glycoprotein (ABC subfamily B member 1, humans: ABCB1, rodents: Abcb1a/b), in brain capillary endothelial cells forming the blood-brain barrier. Alterations in ABCG2 transport activity from genetic polymorphisms or drug-drug interactions (DDIs) may lead to changes in the disposition of ABCG2 substrates, which may affect drug safety and efficacy. So far, ABCG2-mediated DDIs have been mainly studied in the intestine (Kruijtzer et al., 2002; Allred et al., 2011; Kusuhara et al., 2012; Custodio et al., 2014), and considerably less information is available with respect to DDIs that lead to changes in the hepatobiliary excretion of drugs. This is most likely related to the fact that intestinal DDIs can be assessed by studying drug plasma pharmacokinetics, whereas hepatic ABCG2-mediated DDIs may lead only to changes in drug concentrations in the liver and intestine without pronounced changes in drug plasma pharmacokinetics. For a better understanding of tissue DDIs, noninvasive positron emission tomography (PET) imaging with radiolabeled drugs has been proposed as a useful tool (Kusuhara, 2013; Langer, 2016).
Apart from direct inhibition of ABCG2, certain drugs may interfere with regulatory pathways controlling transporter expression in tissue, which could also give rise to transporter-mediated DDIs. It has, for instance, been shown in vitro using different cell lines that the epidermal growth factor receptor (EGFR) regulates cellular ABCG2 expression levels via its downstream signaling pathways [i.e., phosphatidyl-inositol 3-kinase (PI3K)/Akt, mitogen-activated protein kinase (MAPK)] (Takada et al., 2005; Meyer zu Schwabedissen et al., 2006; Pick and Wiese, 2012; Porcelli et al., 2014) (Fig. 1). EGFR-targeting tyrosine kinase inhibitors (TKIs) (e.g., gefitinib, erlotinib, afatinib, osimertinib), which are frequently used in the clinic for cancer treatment, inhibit EGFR-signaling pathways and may therefore cause a reduction in tissue ABCG2 expression levels, which could affect disposition of concomitantly administered ABCG2-substrate drugs; however, in vivo data on EGFR-mediated regulation of tissue ABCG2 expression levels are scarce. A possible confounding factor in the study of the influence of EGFR inhibition on ABCG2-mediated drug disposition may be the fact that most TKIs also directly inhibit ABCG2 transport activity (Hegedüs et al., 2012; D’Cunha et al., 2016). Recently, transgenic mouse models with cell type–specific hepatic deletion of EGFR have been described (Natarajan et al., 2007; Lanaya et al., 2014). Such mouse models lend themselves to studying in vivo the regulation of ABCG2 by EGFR in a “nonpharmacological” approach. A previous PET study has shown that hepatobiliary excretion of [11C]erlotinib is mediated in mice by Abcg2 (Traxl et al., 2015).
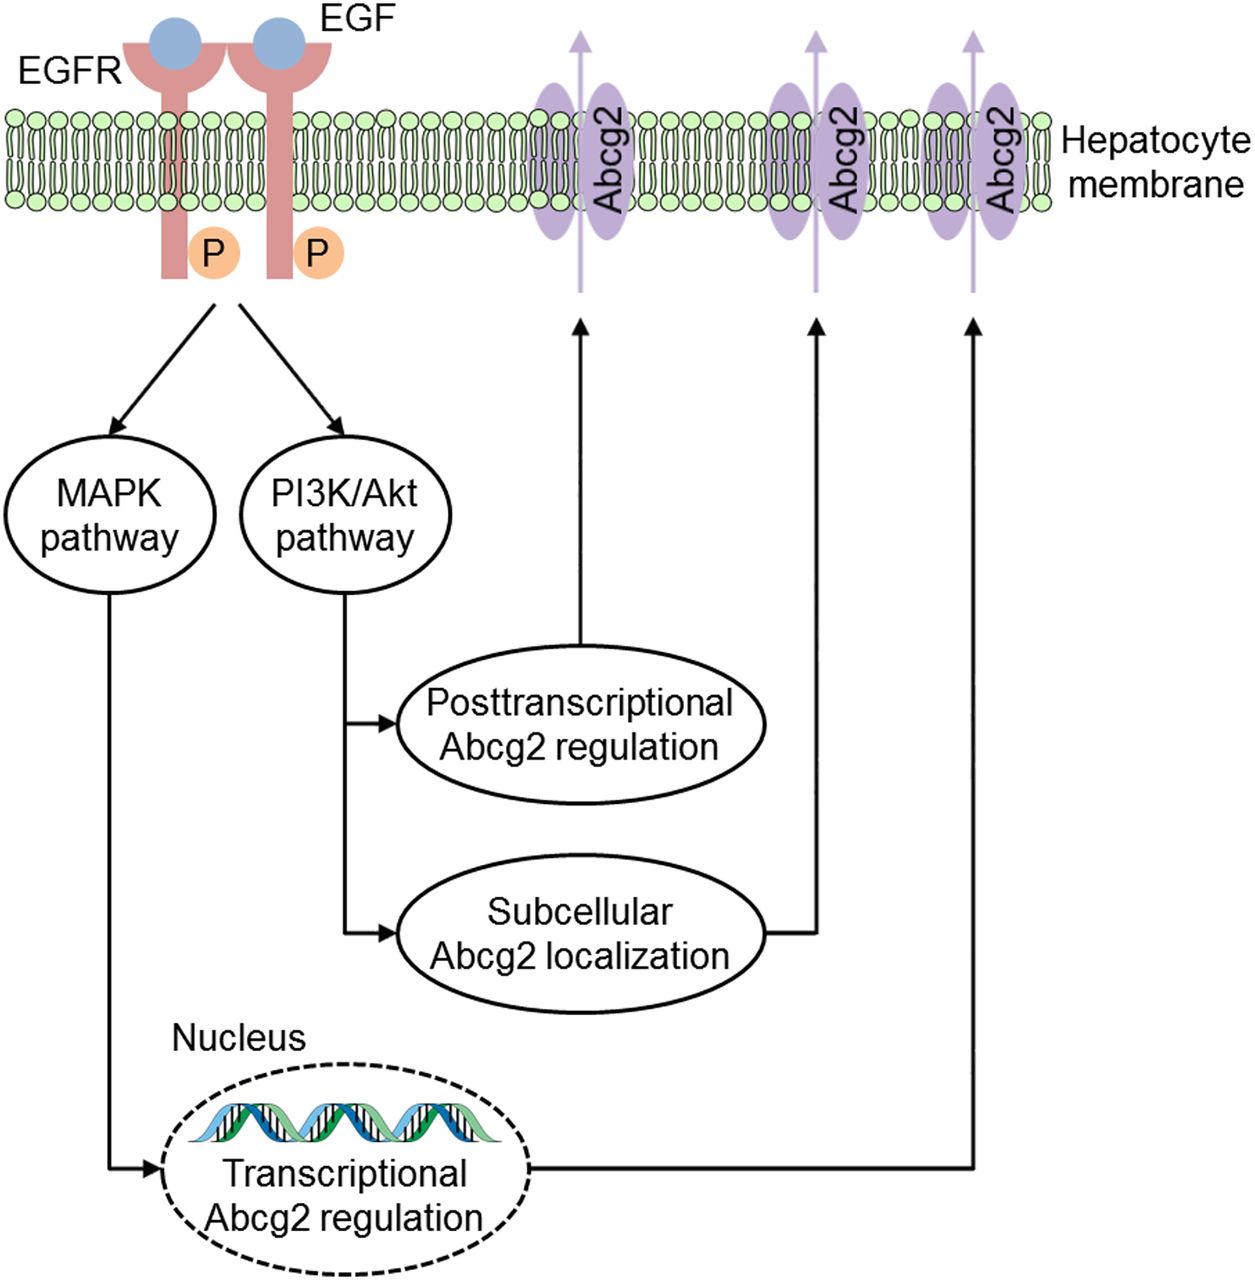
Schematic illustration of a simplified model showing how the EGFR regulates cellular Abcg2 expression levels. After ligand binding, the EGFR tyrosine kinase activates several downstream signal transduction pathways, including the mitogen-activated protein kinase (MAPK) and the phosphatidyl-inositol 3-kinase (PI3K)/Akt pathway. It has been shown that EGF increases cellular Abcg2 expression via the MAPK pathway on both mRNA and protein levels (Meyer zu Schwabedissen et al., 2006). Furthermore, numerous studies suggested that EGF influences posttranscriptional regulation and subcellular localization of Abcg2 via the PI3K/Akt pathway (Mogi et al., 2003; Takada et al., 2005; Pick and Wiese, 2012; Porcelli et al., 2014).
In the present study, we used [11C]erlotinib as a model Abcg2 substrate and compared its hepatic disposition, using PET and magnetic resonance (MR) imaging, in EGFR∆hep mice, which specifically lack EGFR in hepatocytes, with EGFRfl/fl mice, which have normal EGFR expression in all tissues. We hypothesized that deletion of EGFR in hepatocytes will lead to reduced hepatobiliary excretion of [11C]erlotinib as a result of the downregulation of hepatic Abcg2.
Materials and Methods
Chemicals and Drugs.
Unless otherwise stated, all chemicals were obtained from Merck (Darmstadt, Germany) or Sigma-Aldrich (St. Louis, MO). All chemicals were used without further purification and were of at least analytic grade.
Animals.
Healthy male EGFR∆hep (lacking EGFR in hepatocytes of the liver, but not in other tissues) and EGFRfl/fl (harboring a loxP-flanked EGFR allele, having normal EGFR expression in all tissues) littermate control mice with a C57BL/6 background were generated as described previously (Natarajan et al., 2007) and bred in the mouse facilities of the Medical University of Vienna (Division of Decentralized Biomedical Research Facilities) according to federal guidelines and guidelines of the Medical University of Vienna (BMWFW-66.009/0199-WF/II/3b/2014). At the time of the experiment, animals weighed 22–33 g (EGFRfl/fl: 31.2 ± 1.6 g, EGFR∆hep: 25.7 ± 3.3 g) and were 13–15 weeks old. Animals were housed in individual ventilated polysulfon type III cages (five to six animals per cage) under controlled environmental conditions (24.0 ± 0.6°C, 40%–70% humidity, 12-hour light/dark cycle) with free access to tap water and standard rodent diet (Ssniff Spezialdiäten, Soest, Germany). An acclimatization period of at least 1 week was allowed before the animals were used in the experiments. All animal experiments were approved by the national authorities (Amt der Niederösterreichischen Landesregierung), and all study procedures were performed in accordance with the European Communities Council Directive of September 22, 2010 (2010/63/EU).
Radiotracer Synthesis.
[11C]Erlotinib was synthesized by O-[11C]methylation of 6-O-desmethyl-erlotinib (OSI-420, Syncom BV, Groningen, The Netherlands) as described previously (Bahce et al., 2013). Specific activity at the time of injection was 74.8 ± 35.2 GBq/µmol (n = 11 batches), and radiochemical purity was >98%. For i.v. administration to animals, [11C]erlotinib was formulated in 0.1 mM hydrochloric acid in physiologic saline at an approximate concentration of 555 MBq/ml.
PET/MR Imaging.
EGFRfl/fl (n = 6) and EGFR∆hep (n = 5) mice each underwent an MR scan followed by a dynamic PET scan after i.v. injection of [11C]erlotinib. For imaging, animals were preanesthetized in an induction chamber using isoflurane (Abbott Laboratories, Maidenhead, UK) and placed on a heated (37°C) animal bed, and the lateral tail vein was cannulated. Body temperature and respiration rate were constantly monitored (SA Instruments, Stony Brook, NY). Isoflurane anesthesia (1.5%–2.5% in oxygen) and heating were maintained for the entire imaging period. Anatomic whole-body MR imaging was performed on a 1-Tesla benchtop ICON scanner (Bruker, Ettlingen, Germany) using a modified T1-weighted gradient echo sequence (T1-fast low-angle shot) with the following parameters: echo time = 5 ms; repetition time = 25 ms; flip angle = 25°; field of view = 76 × 28 × 24 mm; matrix = 253 × 93; 32 slices; slice thickness = 0.75 mm; scan time = 6.25 minutes. For PET imaging, the animal bed was transferred into the gantry of a microPET Focus 220 system (Siemens Medical Solutions, Knoxville, TN), and a 10-minute transmission scan using a 57Co point source was recorded. Subsequently, [11C]erlotinib (46.9 ± 14.6 MBq, corresponding to 0.47 ± 0.54 µg (range: 0.07–2.05 µg) of unlabeled erlotinib, n = 11 batches) was administered as an i.v. bolus over 1 minute via the lateral tail vein, and a 90-minute dynamic PET scan was initiated at the start of radiotracer injection with an energy window of 250–750 keV and a timing window of 6 ns.
Postimaging Procedures.
At the end of the PET scan, a terminal blood sample was withdrawn from the retro-orbital sinus vein, and the animals were sacrificed by cervical dislocation while still under deep anesthesia. The liver was removed, and the radioactivity of blood aliquots was measured in a Wallac Wizard 1470 γ-counter (PerkinElmer, Wellesley, MA). For protein extraction, total liver tissue was homogenized using a Precellys CK28 lysing kit (Bertin, Rockville, MD) containing the respective lysis buffer (for total cell extracts: RIPA buffer containing 50 mM Tris, pH 8.0, 150 mM sodium chloride, 1% Triton X-100, 0.5% sodium deoxycholate and 0.1% SDS; for membrane-enriched cell extracts: 50 mM HEPES, pH 7.3, 150 mM sodium chloride, 10% glycerol, 1% Triton X-100, 1 mM EDTA, and 1.5 mM magnesium chloride). The tissue was lysed using a Precellys Evolution Homogenizer (Bertin Instruments, Montigny-le-Bretonneux, France). Cell extracts were snap-frozen in liquid nitrogen and stored at −80°C until further processing.
Western Blotting.
For Western blotting, frozen extracts were thawed and centrifuged at 12,000g at 4°C for 10 minutes. The protein concentration of the cleared lysate was determined using the Pierce BCA Protein Assay Kit (Thermo Fisher Scientific, Waltham, MA). Fifteen micrograms of lysed protein was resuspended in denaturing protein-loading buffer and left at room temperature for 10 minutes. Proteins were separated by SDS-PAGE and transferred to polyvinylidene difluoride membranes. To determine EGFR, Abcg2, and Abcb1a/b protein expression levels, the following monoclonal rabbit antibodies were used in 1:1000 dilutions: EGFR (EGFR (D38B1) XP rabbit monoclonal antibody no. 4267), Abcg2 (ABCG2 (D5V2K) XP rabbit monoclonal antibody no. 42078), and Abcb1a/b (anti-P glycoprotein antibody [EPR10364-57] (ab170904)). α-Tubulin (monoclonal anti-α-tubulin antibody produced in mice) was used as the loading control in a 1:500 dilution. For analysis of protein expression levels in liver tissue, all obtained bands were quantified by densitometry using ImageJ software (National Institutes of Health, Bethesda, MD) and normalized to α-Tubulin.
PET Data Analysis.
The dynamic PET data were sorted into 25 frames, which incrementally increased from 5 seconds to 20 minutes. All PET images were reconstructed using Fourier rebinning of the three-dimensional sinograms followed by a two-dimensional filtered back-projection with a ramp filter, resulting in a voxel size of 0.4 × 0.4 × 0.796 mm3. The standard data correction protocol was applied to the dynamic PET data, including normalization, injection decay correction, and attenuation correction. By applying a calibration factor derived from imaging a cylindrical phantom with a known radioactivity concentration, PET units were converted into units of radioactivity. Using the medical image data examiner software AMIDE (Loening and Gambhir, 2003), the left ventricle of the heart (image-derived blood curve), liver, gallbladder, duodenum, intestine, left kidney, and urinary bladder were manually outlined on coregistered PET/MR images, and concentration-time curves expressed in units of percent of the injected dose per milliliter or per gram (%ID/mL or %ID/g) were derived. It was assumed that the sum of radioactivity in the gallbladder, the duodenum, and the intestine represented radioactivity in the bile excreted from the liver. From the concentration-time curves, the area under the curve (AUC) from 0 to 90 minutes was calculated using Prism 7 software (GraphPad Software, La Jolla, CA).
Integration Plot Analysis.
To estimate the rate constants for transfer of radioactivity from blood into liver (kuptake,liver, milliliters per minute per gram liver), from blood into kidney (kuptake,kidney, milliliters per minute per gram kidney), from liver into bile (kbile, min−1), and from kidney into urine (kurine, min−1), a graphical analysis method (integration plot) was used as described previously (Shingaki et al., 2015; Traxl et al., 2015). kuptake,liver and kuptake,kidney were measured from 0.3 to 3.5 minutes after radiotracer injection using the integration plot method and eq. 1:
 (1)where Ct,organ is the radioactivity concentration in the liver or kidney at time t, and Ct,blood is the radioactivity concentration in the left ventricle of the heart at time t. AUC0–t,blood represents the area under the concentration-time curve in the left ventricle of the heart from time 0 to time t. Kuptake,organ can be obtained by performing linear regression analysis of a plot of Ct,organ/Ct,blood versus AUC0-t,blood/Ct,blood and calculating the slope of the regression line. VE is the y-intercept of the integration plot.
Kbile and kurine were measured from 12.5 to 65 minutes after radiotracer injection using the integration plot method and eq. 2: (2)where Ct,organ is the radioactivity concentration in the intestine (including the gallbladder and duodenum) or urinary bladder at time t. AUC0–t,organ represents the area under the concentration-time curve in the liver or kidney from time 0 to time t. Kfluid (kbile or kurine) can be obtained by performing linear regression analysis of a plot of Ct,organ versus AUC0–t,organ and calculating the slope of the regression line. VE is the y-intercept of the integration plot.
Statistical Analysis.
All values are given as mean ± S.D. Statistical differences between groups were analyzed by two-tailed unpaired t tests using Prism 7 software. To assess correlations, the Pearson correlation coefficient (r) was calculated. The level of statistical significance was set to a P value of less than 0.05.
Results
[11C]Erlotinib Disposition in EGFRfl/fl and EGFR∆hep Mice.
We acquired [11C]erlotinib PET/MR scans in EGFRfl/fl mice, which have normal EGFR expression in all tissues and in EGFR∆hep mice, in which EGFR was deleted in hepatocytes but not in other tissues. Representative coregistered coronal whole-body PET summation and MR images are shown in Fig. 2, indicating lower radioactivity content in the duodenum and intestine and higher radioactivity content in the urinary bladder of EGFR∆hep mice compared with EGFRfl/fl mice. In Figs. 3 and 4, concentration-time curves and AUCs of [11C]erlotinib in blood, liver, and intestine are shown for both mouse models. Blood radioactivity concentrations were significantly, by 1.5-fold, higher in EGFR∆hep than in EGFRfl/fl mice (blood AUC, EGFRfl/fl: 263±48 %ID/mL*min, EGFR∆hep: 397±93 %ID/mL*min). Also, liver AUCs were significantly, by 1.4-fold, increased in EGFR∆hep compared with EGFRfl/fl mice, but liver-to-blood AUC ratios were not significantly different between the two mouse models (Table 1). Radioactivity concentrations in the intestine (including the gallbladder and duodenum) were significantly, by 1.6-fold, lower in EGFR∆hep mice (intestine AUC, EGFRfl/fl: 1340±368 %ID/g*min, EGFR∆hep: 866±86 %ID/g*min).
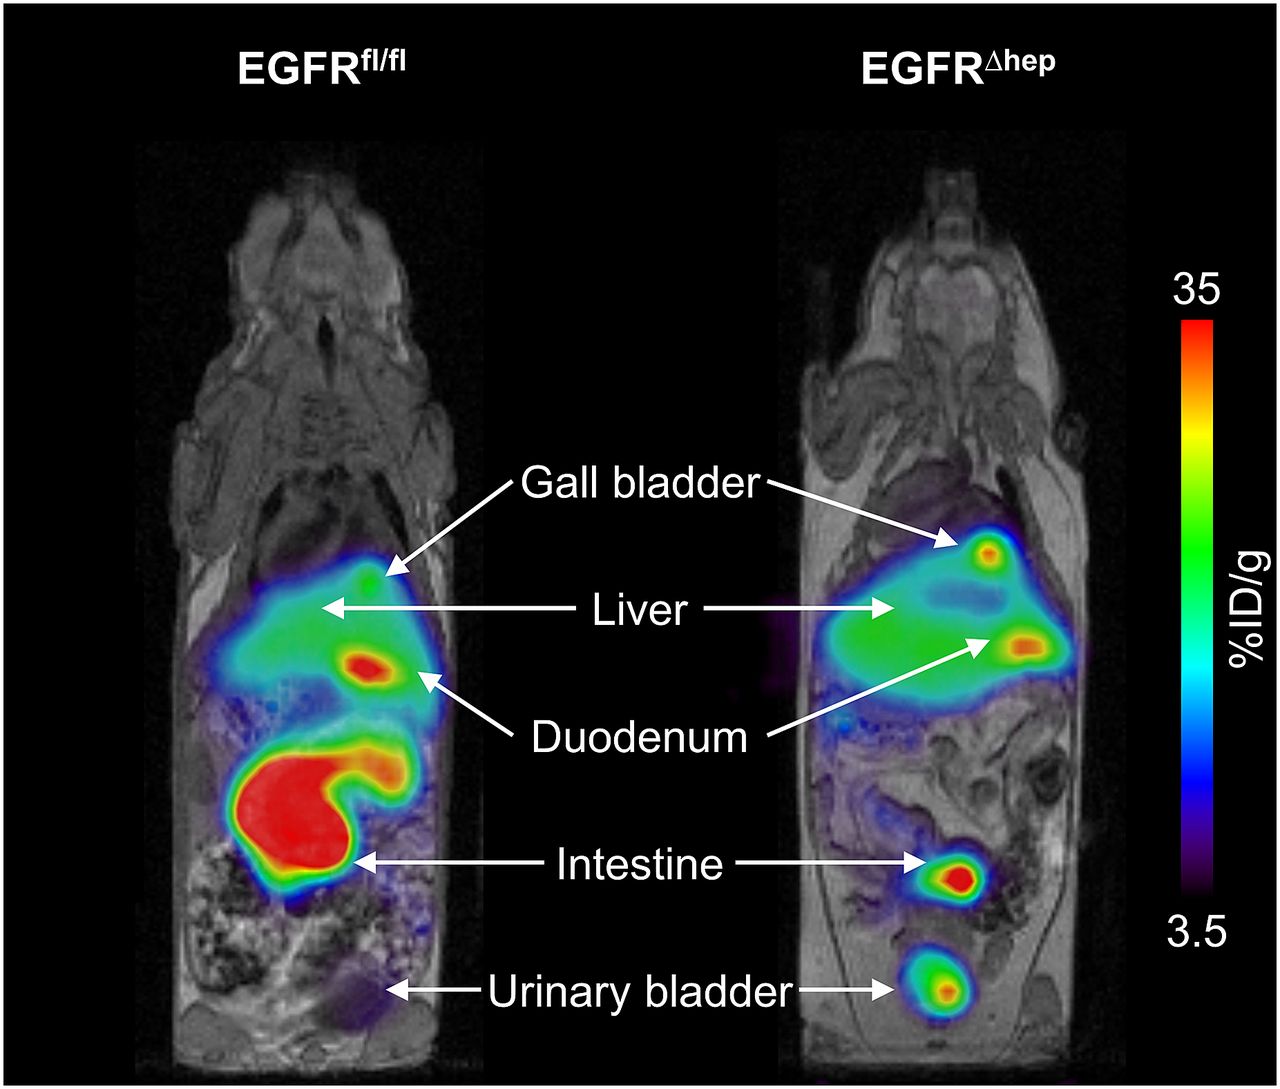
Representative coregistered coronal whole-body [11C]erlotinib PET summation (0–90 minutes) and MR (T1-weighted gradient echo sequence) images of an EGFRfl/fl (left) and an EGFR∆hep (right) mouse. Anatomic structures are indicated by arrows. Radiation scale is set from 3.5% to 35% of the injected dose per gram (%ID/g) tissue.

Concentration-time curves (mean %ID/mL or %ID/g ± S.D.) of [11C]erlotinib in blood (A), liver (B), and intestine (C), including gallbladder and duodenum) and liver-to-blood ratios (mean ± S.D.) over time (D) in EGFRfl/fl mice (filled circles, n = 6) and EGFR∆hep mice (open triangles, n = 5).
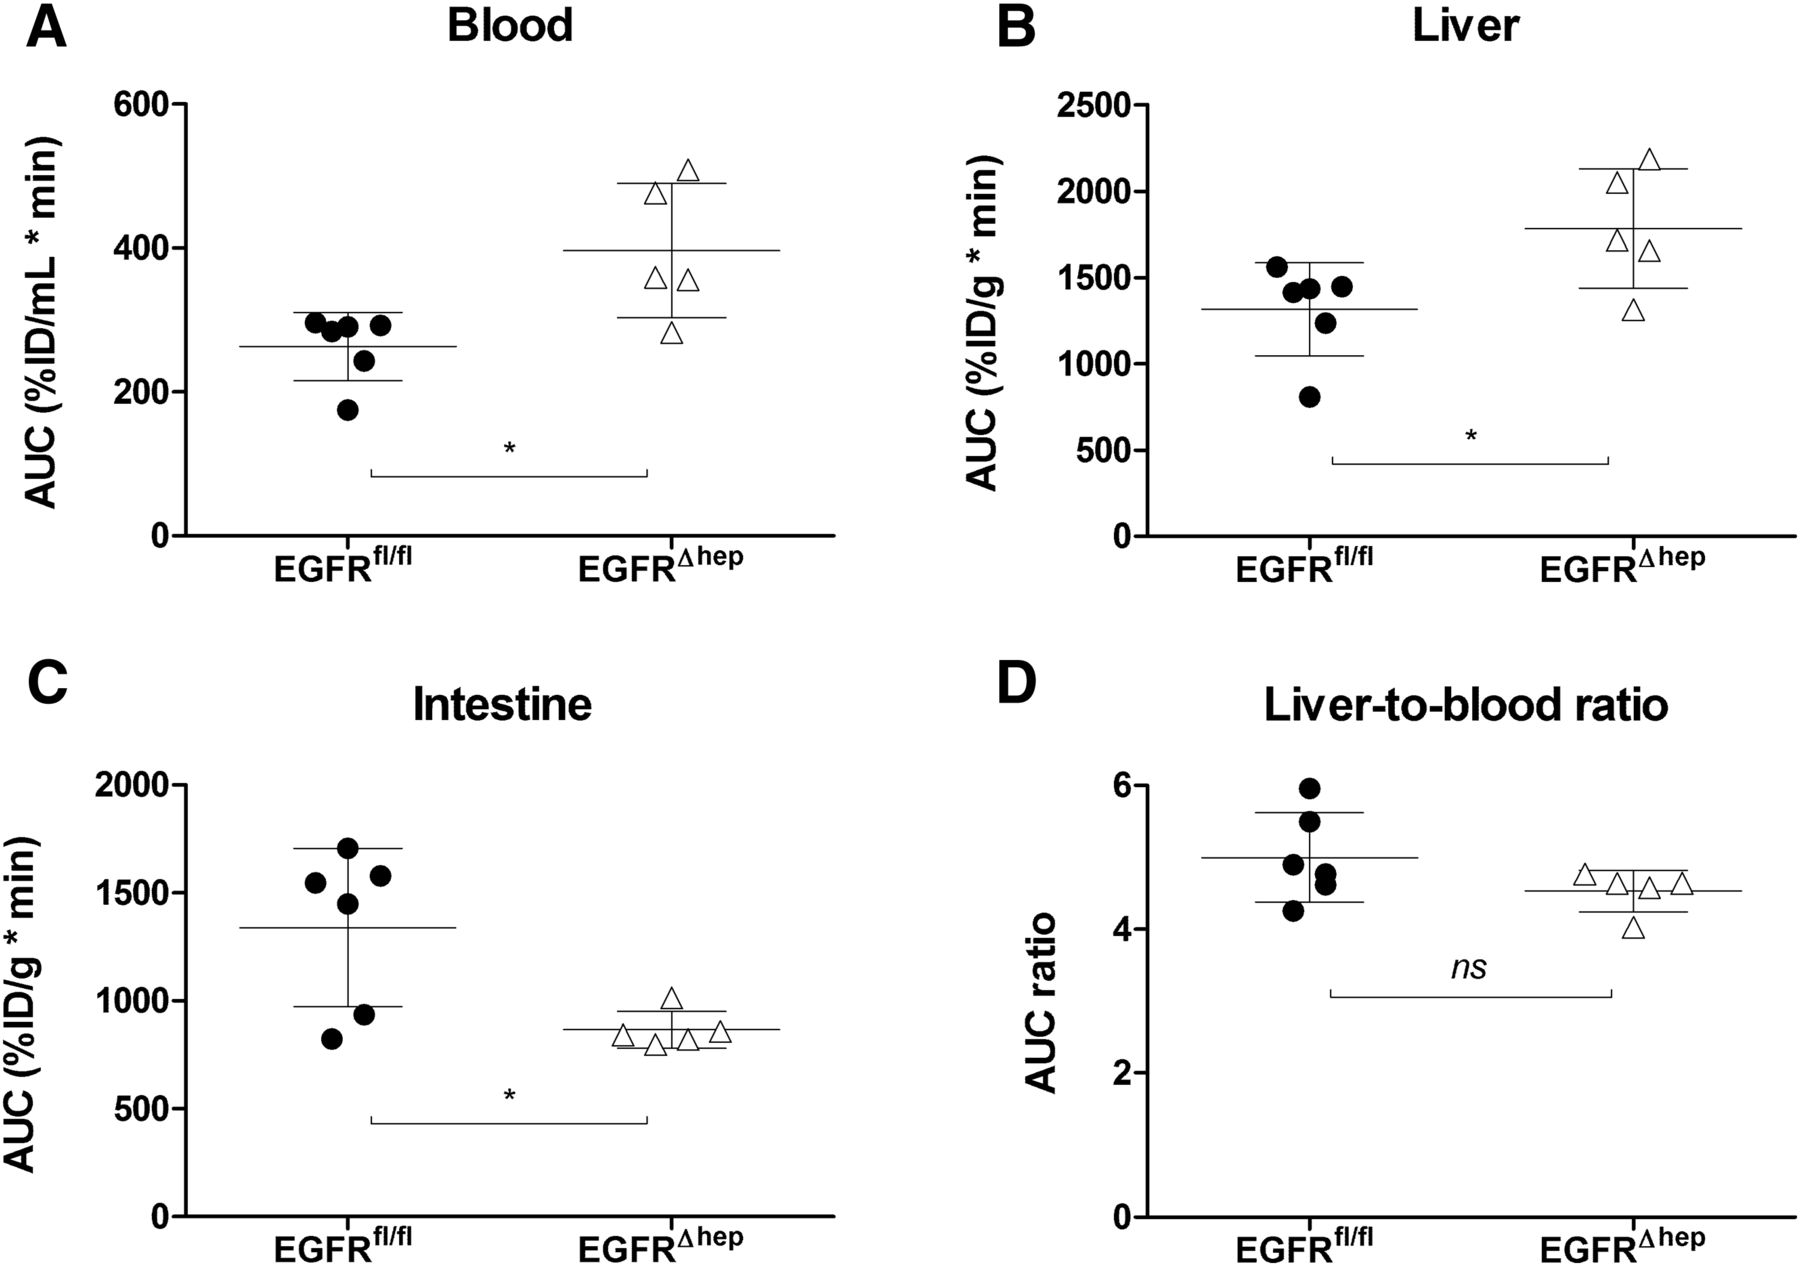
Areas under the [11C]erlotinib concentration-time curves (AUC, mean ± S.D.) for blood (A), liver (B) and intestine (C), including gallbladder and duodenum) and liver-to-blood (D) AUC ratios (mean ± S.D.) in EGFRfl/fl mice (filled circles, n = 6) and EGFR∆hep mice (open triangles, n = 5). ns, not significant, *P < 0.05, two-tailed unpaired t test.
Pharmacokinetic parameters (mean ± S.D.) of [11C]erlotinib in EGFRfl/fl mice (n = 6) and in EGFR∆hep mice (n = 5)
To quantitatively evaluate hepatic disposition of [11C]erlotinib, we used a graphical analysis approach (integration plot analysis) using an image-derived blood curve to estimate the rate constants for transfer of radioactivity from blood into liver (kuptake,liver) and from liver via bile into duodenum and intestine (kbile). Radioactivity concentrations measured in the left ventricle of the heart in the last PET frame (70–90 minutes after radiotracer injection) showed a good correlation (r = 0.735, P < 0.05) with radioactivity concentrations measured with a γ-counter in the venous blood sample collected at the end of the PET scan (data not shown). In Fig. 5, integration plots and kuptake,liver and kbile values are shown for both mouse models. Kuptake,liver was not significantly different, whereas Kbile was significantly, by 3.0-fold, decreased in EGFR∆hep compared with EGFRfl/fl mice (Table 1).
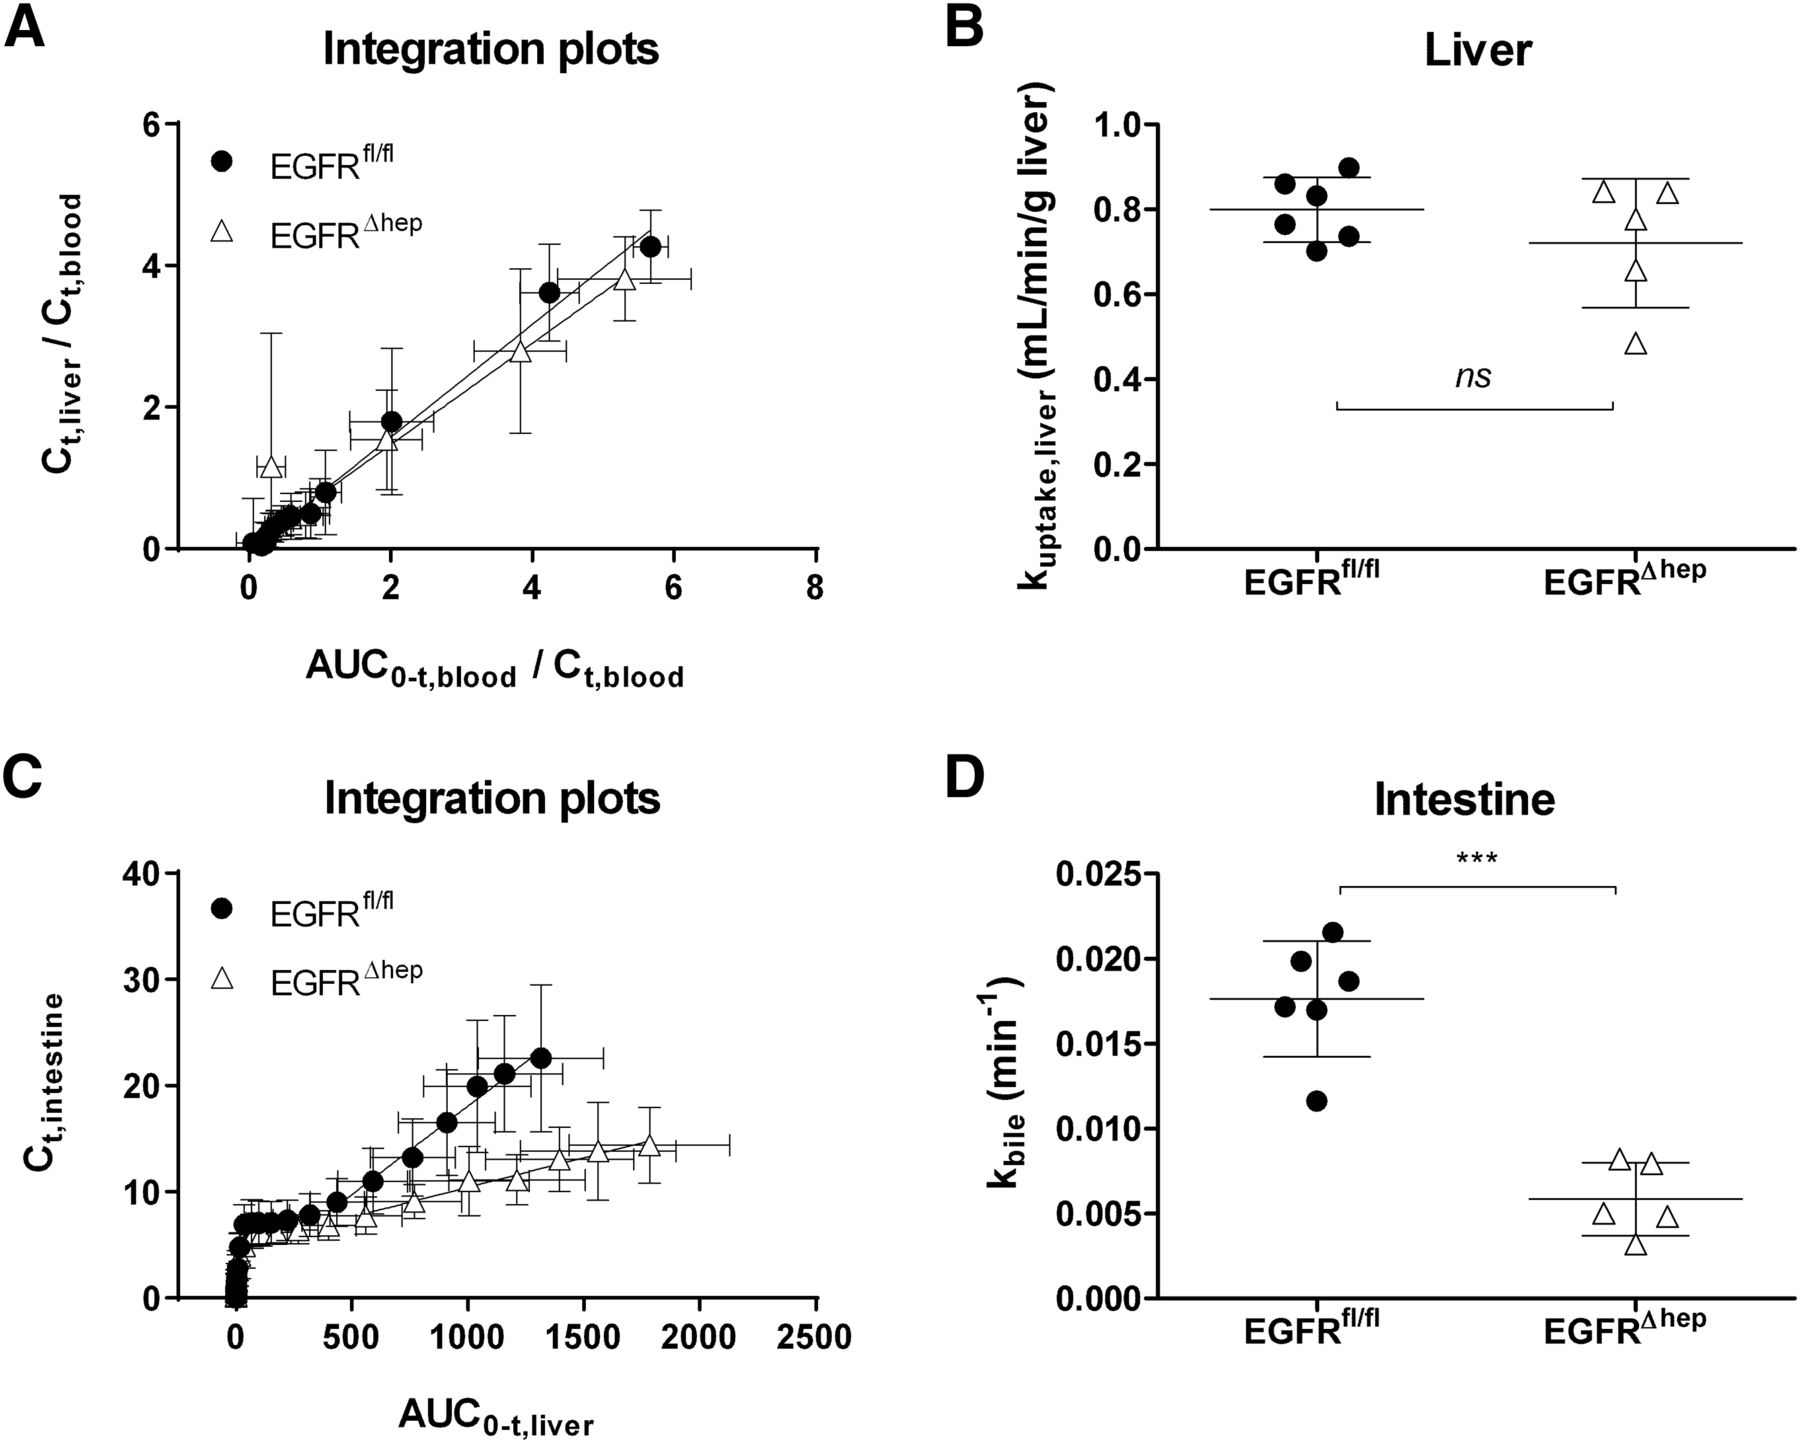
Integration plots (mean ± S.D.) to estimate the rate constants for transfer of radioactivity from blood into liver (kuptake,liver) (A and B) and from liver into bile (kbile) (C and D) in EGFRfl/fl mice (filled circles, n = 6) and EGFR∆hep mice (open triangles, n = 5) mice. See Materials and Methods section for the definition of variables used in the integration plots. Kuptake,liver and kbile correspond to the slopes of the linear regression lines. ns, not significant, ***P < 0.001, two-tailed unpaired t test.
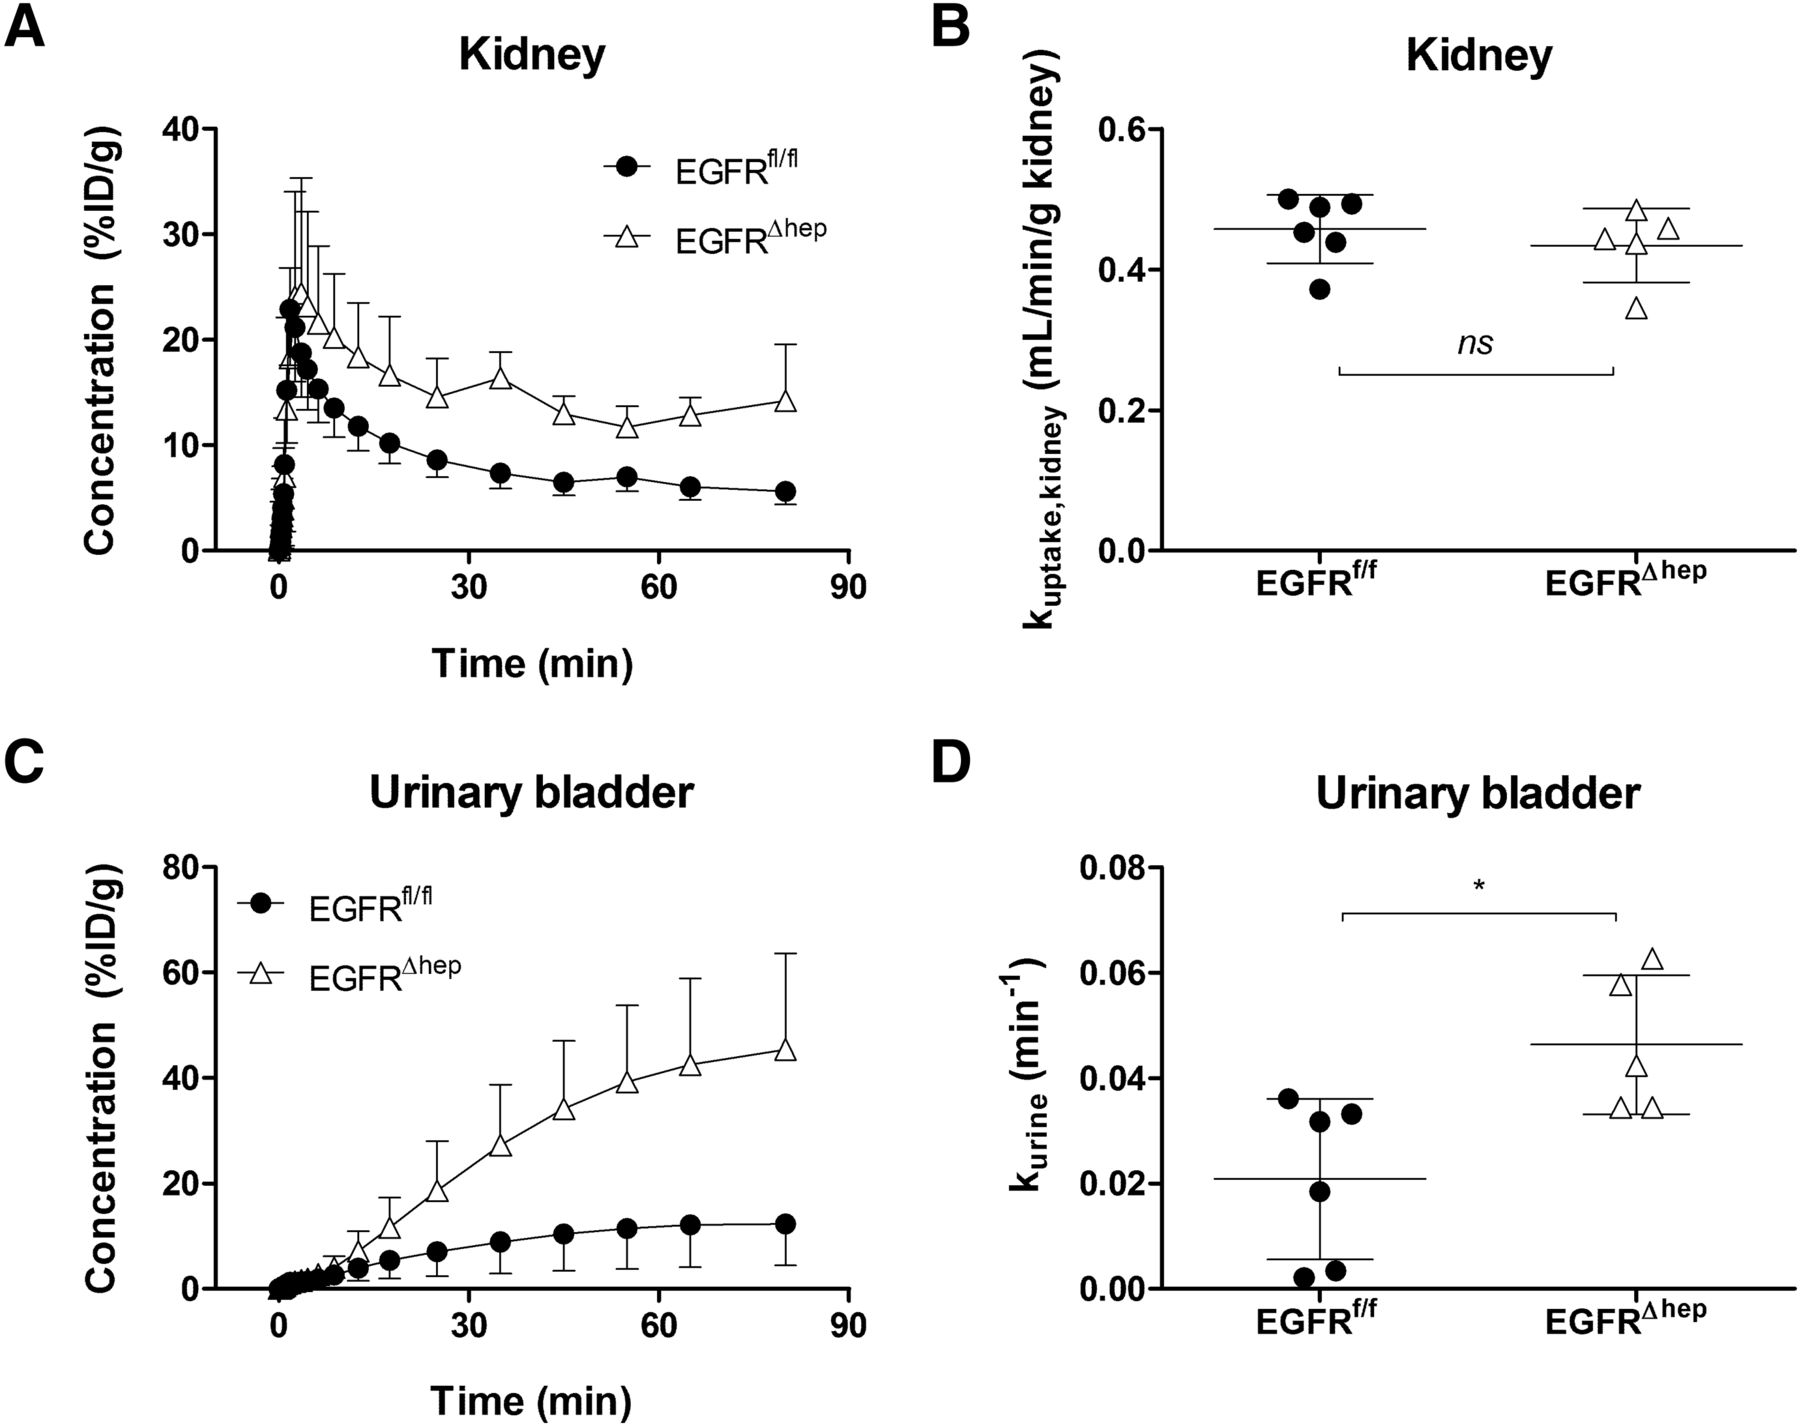
We also studied the distribution of [11C]erlotinib to the kidney and the urinary bladder and estimated the rate constants for transfer of radioactivity from blood into the kidney (kuptake,kidney) and from the kidney into the urine (kurine) (Fig. 6; Table 1). Radioactivity concentrations in the urinary bladder were significantly, by 3.2-fold, higher in EGFR∆hep mice (urinary bladder AUC, EGFRfl/fl: 683±441 %ID/g*min, EGFR∆hep: 2171±866 %ID/g*min). Kuptake,kidney values did not differ between the two mouse models, whereas kurine was significantly, by 2.2-fold, higher in EGFR∆hep mice.

Concentration-time curves (mean %ID/g ± S.D.) of [11C]erlotinib in left kidney (A) and urinary bladder (C) and rate constants for transfer of radioactivity from blood into kidney (kuptake,kidney) (B) and from kidney into urine (kkurine) (D) in EGFRfl/fl mice (filled circles, n = 6) and EGFR∆hep mice (open triangles, n = 5). ns, not significant, *P < 0.05, two-tailed unpaired t test.
EGFR, Abcb1a/b, and Abcg2 Protein Expression Levels in Liver Tissue.
Western blot analysis of liver tissue collected at the end of PET imaging confirmed an almost complete absence of EGFR protein expression levels in total cell extracts of EGFR∆hep mice compared with levels in EGFRfl/fl mice (on average 16.2-fold reduction, P < 0.05) (Fig. 7, A and B). The residual low EGFR signal in EGFR∆hep mice most likely derives from nonparenchymal cells, in which EGFR was not deleted. In EGFR∆hep mice, Abcg2 protein expression levels were significantly lower in total (on average, 2.9-fold), as well as in membrane-enriched (on average, 2.5-fold) cell extracts compared with EGFRfl/fl mice (Fig. 7, A and D), suggesting that the absence of EGFR does not affect the localization of the Abcg2 protein. In contrast, Abcb1a/b protein expression levels in the liver of EGFR∆hep mice were significantly increased in total cell extracts (on average, 3.1-fold), with a similar tendency in membrane-enriched cell extracts (on average, 2.3-fold) (Fig. 7, A and C).

Western blot analysis of EGFR, Abcb1a/b, and Abcg2 protein expression levels in liver tissue collected after the PET scan from EGFRfl/fl mice (n = 3) and EGFR∆hep mice (n = 3) using membrane-enriched and total cell extracts (A). Bands were quantified by densitometry using ImageJ software, and protein expression levels were normalized to α-tubulin, which was used as loading control (B–D). ns, not significant, *P < 0.05, **P < 0.01, two-tailed unpaired t test.
Discussion
In this study, we compared the hepatic disposition of a microdose of the model Abcg2 substrate [11C]erlotinib in EGFR∆hep and EGFRfl/fl mice to assess the EGFR-mediated regulation of hepatic Abcg2 transport activity. EGFR∆hep mice have a cell type-specific deletion of EGFR in hepatocytes, whereas EGFRfl/fl mice have normal EGFR expression levels in all tissues. EGFR∆hep mice are healthy and do not display any phenotypical abnormalities except for a reduction in body weight (Natarajan et al., 2007). As there is evidence for sex specific differences in EGFR pathways in the liver of mice (Wang et al., 2016) and as the assessment of these sex differences was not the subject of the present study, we focused on male mice in our experiments. Several previous studies have provided evidence for a regulatory link between EGFR signaling and ABCG2 expression (Fig. 1). It has been shown that the epidermal growth factor (EGF) can induce cell-surface expression of ABCG2 via the MAPK pathway (Meyer zu Schwabedissen et al., 2006). Moreover, the PI3K/Akt pathway, a downstream signal transduction pathway of EGFR, plays a crucial role in the posttranscriptional regulation of ABCG2 expression and its subcellular localization (Mogi et al., 2003; Takada et al., 2005; Pick and Wiese, 2012; Porcelli et al., 2014). For instance, treatment of ABCG2-overexpressing LLC-PKI cells with a PI3K inhibitor resulted in an internalization of ABCG2 from the apical surface and a decrease in the relative expression level of ABCG2 on the cell surface (Takada et al., 2005). These regulatory pathways may either be exploited, for instance, to overcome transporter-mediated chemoresistance of cancer cells, or they could also lead to unwanted DDIs, when a drug that interferes with EGFR signaling is combined with another drug that is transported by ABCG2. Most studies examining the regulation of ABC transporters have used cellular systems, and few in vivo data are available to assess whether modulation of regulatory pathways translates into alterations of transporter-mediated disposition of probe substrates (Slosky et al., 2013; Wang et al., 2014). Recent work has shown that PET with radiolabeled transporter substrates is a powerful tool to noninvasively measure the activities of different ABC and solute carrier transporters in the living organism (Kusuhara, 2013; Langer, 2016).
Erlotinib is a first-generation EGFR-targeting TKI and is approved for the treatment of non–small cell lung and pancreatic cancer. Erlotinib has also been suggested as potential treatment of hepatocellular carcinoma, although a recent phase 3 study was unable to demonstrate survival improvement with erlotinib in advanced-stage HCC (Zhu et al., 2015). Erlotinib is excreted predominantly via the hepatobiliary route; in humans, 83% of an i.v. dose was excreted in feces and only 8% in urine (Ling et al., 2006). Erlotinib is a substrate of ABCG2 and ABCB1 (Kodaira et al., 2010) and has been shown to inhibit these transporters at higher concentrations (Shi et al., 2007). Moreover, there is evidence that erlotinib downregulates cellular ABCG2 expression levels via EGFR inhibition (Porcelli et al., 2014). We recently demonstrated that kbile of [11C]erlotinib was 1.3-, 2.3-, and 2.8-fold reduced in Abcb1a/b(−/−), Abcg2(−/−), and Abcb1a/b(−/−)Abcg2(−/−) mice, respectively, relative to wild-type mice (Traxl et al., 2015). Moreover, we found that most of the radioactivity in plasma, liver, and bile was composed of unmetabolized [11C]erlotinib after i.v. injection of the radiotracer into wild-type mice, whereas only radiolabeled metabolites were detected in urine. These data provided evidence that hepatobiliary excretion of [11C]erlotinib is mediated in mice by Abcg2 and, to a lesser extent, by Abcb1a/b, suggesting that [11C]erlotinib may be used as a PET probe substrate to measure Abcg2 transport activity in the liver. In the present study, we used [11C]erlotinib to investigate whether the deletion of EGFR in hepatocytes leads to changes in hepatic Abcg2 transport activity. To obtain quantitative pharmacokinetic parameters of hepatic disposition of [11C]erlotinib, we estimated the transfer rate constants of radioactivity from blood into the liver (kuptake,liver) and from the liver into bile (kbile) using integration plot analysis (Shingaki et al., 2015; Traxl et al., 2015) (Fig. 5). Kbile is a parameter that has been used in other studies to assess canalicular ABC transport activities, such as that of Abcg2, in the liver of mice (Takashima et al., 2013).
Kuptake,liver values were not significantly different in EGFR∆hep and EGFRfl/fl mice and ranged from 0.72 to 0.80 mL/min per gram of liver tissue, corresponding to a hepatic extraction ratio of 0.72–0.80 (assuming a hepatic blood flow rate in mice of approximately 1.0 mL/min per gram of liver tissue) (Davies and Morris, 1993) (Fig. 5B). Kuptake,liver values in EGFRfl/fl mice were comparable to those measured in an earlier study in another mouse strain (FVB wild-type mice, kuptake,liver: 0.734 ± 0.106 mL/min per gram of tissue), indicating good reproducibility of our analytical method (Traxl et al., 2015). There is evidence that hepatic uptake of [11C]erlotinib is transporter-mediated, as reflected by a decrease in kuptake,liver in wild-type mice coinjected with a therapeutic dose of unlabeled erlotinib compared with mice that only received a PET microdose of [11C]erlotinib (Traxl et al., 2015); however, in contrast to certain low-permeability drugs, for which hepatic disposition is to a large extent transporter-mediated (e.g., statins), erlotinib is a highly lipophilic compound that can be expected to also penetrate cellular membranes by passive diffusion. Kbile was 3.0-fold lower in EGFR∆hep mice (Fig. 5D), suggesting a decrease in the biliary excretion of [11C]erlotinib. The decrease in total, as well as in membrane-bound, hepatic Abcg2 expression levels in EGFR∆hep mice as revealed by Western blot analysis (Fig. 7D) suggested transcriptional regulation of Abcg2 protein levels by EGFR rather than an alteration in the membrane localization of Abcg2. Interestingly, there was an increase in hepatic Abcb1a/b expression levels (Fig. 7C), which is in line with another study that assessed changes in transporter expression levels in human conditionally immortalized proximal tubule epithelial cells after treatment with the EGFR recombinant antibody cetuximab; significant decreases occurred in ABCG2 mRNA and increases were seen in ABCB1 mRNA (Caetano-Pinto et al., 2017). Our data thus support the premise that hepatobiliary excretion of [11C]erlotinib is, to a larger extent, dependent on Abcg2 than on Abcb1a/b, as kbile was decreased in EGFR∆hep mice despite an apparent upregulation of canalicular Abcb1a/b. Our data also provide evidence that [11C]erlotinib PET is a sensitive tool to measure changes in Abcg2 transport activity in the liver.
Despite the decrease in radioactivity excreted into bile, liver profiles were parallel (Fig. 3B) and liver-to-blood AUC ratios were not significantly different in both mouse models, with a tendency for lower values in EGFR∆hep mice (Fig. 4D). On the other hand, blood AUC values were significantly higher in EGFR∆hep mice (Fig. 4A). This result could be related to an increase in the transfer of [11C]erlotinib across the basolateral (sinusoidal) membrane from the liver into the blood in EGFR∆hep mice, possibly involving basolateral efflux transporter(s), as potential compensatory mechanism for the decrease in biliary excretion. However, this remains speculative as the rate constant for transfer of radioactivity from liver into blood could not be determined with the presently used analysis approach.
Because erlotinib partly undergoes urinary excretion (Ling et al., 2006), we also measured distribution of [11C]erlotinib to the kidneys and urinary bladder (Fig. 6). In a previous study, we found that urinary excretion of radioactivity after i.v. injection of [11C]erlotinib was quite low in wild-type mice and markedly increased in Abcg2(−/−) and Abcb1a/b(−/−)Abcg2(−/−) mice (Traxl et al., 2015), suggesting a shift from hepatobiliary to renal excretion (which was apparently not mediated by renal Abcg2 and Abcb1a/b), when hepatobiliary excretion was impaired owing to knockout of Abcg2. A similar phenomenon was observed in the present study, in which kurine was 2.2-fold higher in EGFR∆hep compared with EGFRfl/fl mice (Fig. 6D).
Our in vivo data confirm previous in vitro data showing that EGFR signaling can regulate ABCG2 expression levels (Mogi et al., 2003; Takada et al., 2005; Meyer zu Schwabedissen et al., 2006; Pick and Wiese, 2012; Porcelli et al., 2014). We provide, to our knowledge, the first evidence that EGFR deletion in hepatocytes translates in vivo into a decrease in Abcg2 transport activity leading to changes in the disposition of an Abcg2 probe substrate. Our findings may have clinical relevance as they raise the possibility that treatment with EGFR inhibitors, such as TKIs or antibodies, may alter hepatic ABCG2 transport activity and thereby lead to changes in hepatobiliary clearance of concomitantly administered ABCG2 substrate drugs, which potentially could lead to hepatotoxicity of drugs but also could prove beneficial in the treatment of liver tumors by prolonging the residence times of anticancer drugs in the liver, if their biliary excretion is dependent on ABCG2 transport activity. It should be noted that our study was conducted with a microdose of erlotinib (∼120-fold lower than a human oral therapeutic dose of 2 mg/kg). As erlotinib itself is a potent inhibitor of ABCG2 (IC50: 0.13 µM) (Noguchi et al., 2009), ABCG2 transport activity may be saturated in the liver at therapeutic erlotinib doses, which may result in less pronounced effects of EGFR deletion on the disposition of a therapeutic dose of erlotinib. Transgenic mouse models with cell type-specific deletion of regulatory pathways or transporters may serve as valuable tools to assess the impact of transporters on drug disposition.
Acknowledgments
We thank Johann Stanek, Thomas Filip, Michael Sauberer, and Mathilde Löbsch (AIT Austrian Institute of Technology GmbH) for performing the PET/MR imaging experiments.
Authorship Contributions:
Participated in research design: Komposch, Wanek, Langer, Sibilia.
Conducted experiments: Traxl, Komposch, Glitzner, Wanek, Mairinger.
Performed data analysis: Traxl, Komposch, Glitzner, Wanek, Mairinger, Langer.
Wrote or contributed to the writing of the manuscript: Traxl, Komposch, Glitzner, Wanek, Mairinger, Langer, Sibilia.
Footnotes
- Received June 20, 2017.
- Accepted August 4, 2017.
↵1 A.T., E.G., and K.K. contributed equally to this study.
↵2 O.L. and M.S. had equal responsibility for this study.
This work was supported by the Austrian Science Fund (FWF) [Grants F3518-B20, F3513-B20] and by the Lower Austria Corporation for Research and Education (NFB) [Grants LS12-006, LS15-003].
Abbreviations
- ABC
- adenosine triphosphate-binding cassette
- ABCB1
- human ABC subfamily B member 1, also known as P-glycoprotein
- Abcb1a/b
- rodent ABC subfamily B member 1A and 1B, also known as P-glycoprotein
- ABCG2
- human ABC subfamily G member 2, also known as breast cancer resistance protein
- Abcg2
- rodent ABC subfamily G member 2, also known as breast cancer resistance protein
- AUC
- area under the curve
- DDI
- drug-drug interaction
- EGFR
- epidermal growth factor receptor
- EGFR∆hep
- transgenic mice lacking EGFR in hepatocytes
- EGFRfl/fl
- transgenic mice harboring a loxP-flanked EGFR allele
- PET
- positron emission tomography
- TKI
- tyrosine kinase inhibitor
- Copyright © 2017 by The American Society for Pharmacology and Experimental Therapeutics


