


Abstract
The aim of this study was to evaluate different physiologically based modeling strategies for the prediction of human pharmacokinetics. Plasma profiles after intravenous and oral dosing were simulated for 26 clinically tested drugs. Two mechanism-based predictions of human tissue-to-plasma partitioning (Ptp) from physicochemical input (method Vd1) were evaluated for their ability to describe human volume of distribution at steady state (Vss). This method was compared with a strategy that combined predicted and experimentally determined in vivo rat Ptp data (method Vd2). Best Vss predictions were obtained using method Vd2, providing that rat Ptp input was corrected for interspecies differences in plasma protein binding (84% within 2-fold). Vss predictions from physicochemical input alone were poor (32% within 2-fold). Total body clearance (CL) was predicted as the sum of scaled rat renal clearance and hepatic clearance projected from in vitro metabolism data. Best CL predictions were obtained by disregarding both blood and microsomal or hepatocyte binding (method CL2, 74% within 2-fold), whereas strong bias was seen using both blood and microsomal or hepatocyte binding (method CL1, 53% within 2-fold). The physiologically based pharmacokinetics (PBPK) model, which combined methods Vd2 and CL2 yielded the most accurate predictions of in vivo terminal half-life (69% within 2-fold). The Gastroplus advanced compartmental absorption and transit model was used to construct an absorption-disposition model and provided accurate predictions of area under the plasma concentration-time profile, oral apparent volume of distribution, and maximum plasma concentration after oral dosing, with 74%, 70%, and 65% within 2-fold, respectively. This evaluation demonstrates that PBPK models can lead to reasonable predictions of human pharmacokinetics.
In the drug discovery process considerable resources are required to assess the pharmacokinetic (PK) properties of potential drug candidates in vivo in animals. To optimize the use of such in vivo testing, there has been a growing interest in predicting the PK behavior of drug candidates (Theil et al., 2003; van de Waterbeemd and Gifford, 2003). If sufficiently reliable, such simulations could also help to select the most promising candidates for development and reject those with a low probability of success (van de Waterbeemd and Gifford, 2003).
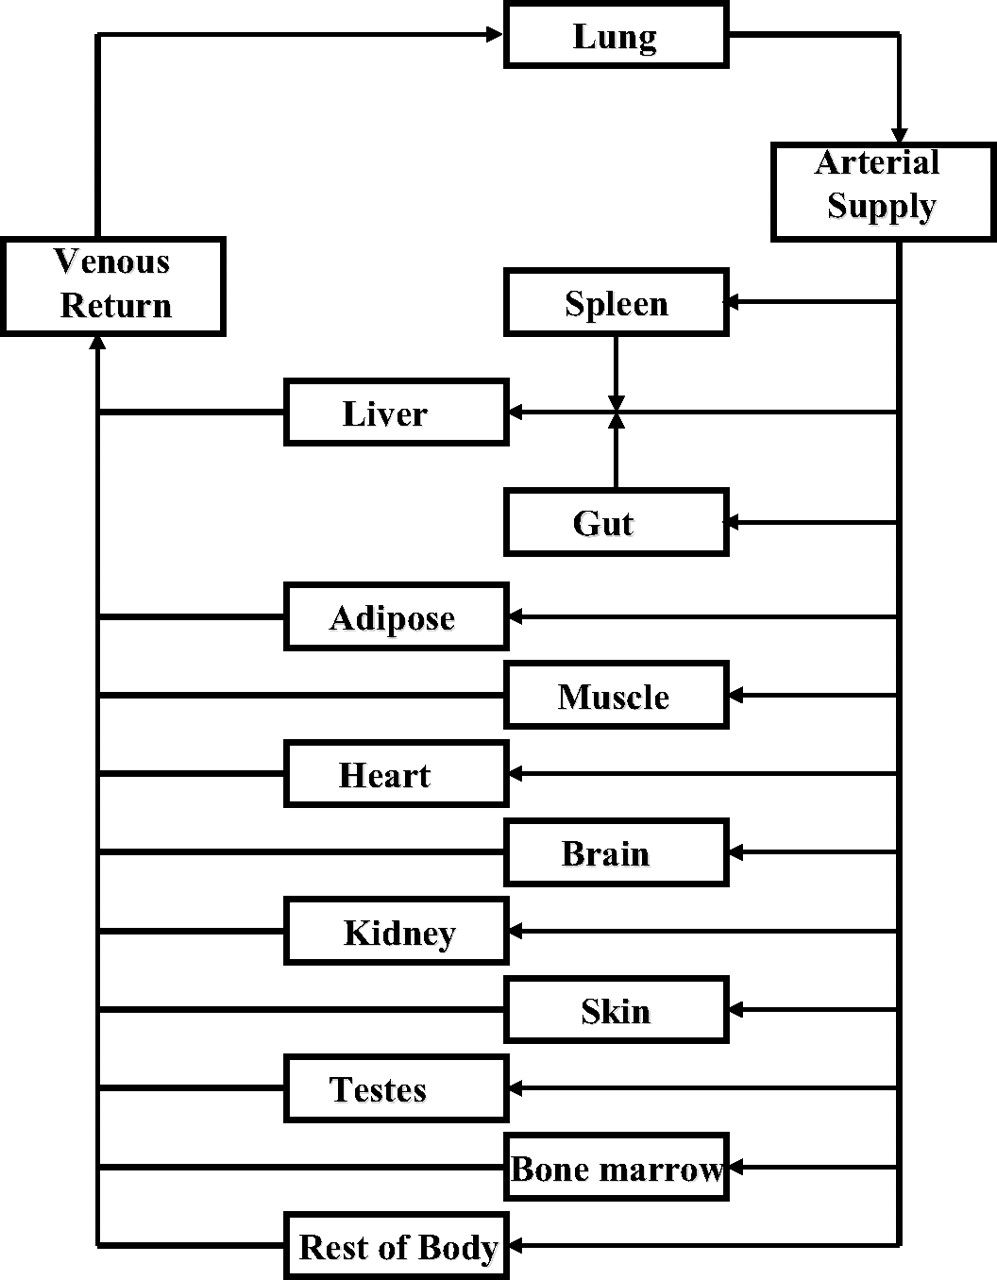
The majority of the approaches to predict human PK developed to date typically focus on the drug's behavior in individual processes of absorption, distribution, metabolism and excretion (ADME). The characterization of a drug's PK in a complex biological system is best described by assembling these processes in one global model. In this context, physiologically based pharmacokinetics (PBPK) models have been developed (Bischoff, 1986). PBPK models map the complex drug transport scheme onto a physiologically realistic compartmental structure (Fig. 1). The major structural elements of the PBPK disposition model are derived from the anatomical structure of the organism; therefore, the model structure is predetermined and basically independent of the drug of interest. The PBPK model input parameters include both a drug-independent and a drug-specific subset. The first subset comprises data underlying the physiological processes (e.g., blood flow), and the second subset comprises drug-specific biochemical parameters. The latter consists of the drug's in vivo intrinsic clearance (CLint) of each organ involved in its elimination, in addition to estimates of the drug's tissue-to-plasma coefficient (Ptp) for each model compartment. Prediction of the rate and extent of absorption can be obtained using semiphysiologically based absorption models, such as the advanced compartmental absorption and transit (ACAT) model (Yu and Amidon, 1999; Agoram et al., 2001). As depicted in Fig. 1, the ACAT model may serve as a time-dependent input function to the disposition model, thereby creating a combined absorption-distribution PBPK model.

Scheme of the generic disposition PBPK model for simulation of full plasma and tissue concentration-time profiles in rat and human. An overview of all physiological values is given in Table 3. Estimation of rate and extent of oral absorption from the gut was obtained using ACAT (Yu and Amidon, 1999; Agoram et al., 2001). For more details on all methods used, refer to Materials and Methods.
Although PBPK models have been widely used in areas such as risk assessment to predict the PK behavior of toxic chemicals, their application in support of drug discovery and development has remained limited, most probably as a result of their mathematical complexity and the labor-intensive drug-specific input data required. However, more recently, a variety of in vitro based prediction tools have been developed for the estimation of PBPK model input parameters (Theil et al., 2003). Such prediction tools require commonly determined biochemical and physicochemical drug-specific input and thus allow for the prediction of ADME parameters before any in vivo experiment. As examples of such prediction tools, mechanistic equations have been developed for the prediction of fraction of oral dose absorbed (Agoram et al., 2001; Willmann et al., 2004), tissue partitioning (Ptp) (Poulin and Theil, 2000; Poulin et al., 2001; Rodgers et al., 2005a), apparent volume of distribution at steady state (Vss) (Poulin and Theil, 2002), and hepatic plasma clearance (CLH) (Houston and Carlile, 1997; Austin et al., 2002; Ito and Houston, 2004). In a previous study, we also evaluated a variety of physiologically based prediction tools for the prediction of rat PK (De Buck et al., 2007).
The aim of the present work was to further evaluate these prediction tools for their ability to predict human PK parameters by simulation of full plasma concentration-time profiles after both intravenous and oral administration. Although recent studies have addressed a similar question, the overall prediction accuracy obtained was in the lower range, particularly for predictions of Vss and in vivo terminal half-life (in vivo t½) (Parrott et al., 2005b; Jones et al., 2006a). In the present study, a more comprehensive range of approaches toward the prediction of Vss and CLH was explored, including two mechanism-based Vss predictions from physicochemical input, as well as approaches that combine the use of both predicted and experimentally determined in vivo rat Ptp. For each of the approaches tested, the influence of interspecies differences in plasma protein binding on prediction accuracy was investigated. The role of relative drug binding in plasma and in vitro drug matrices was also considered with respect to CLH projection from in vitro metabolism data. Whereas the basic tenet of pharmacokinetics states that the unbound drug concentration in the plasma dictates clearance, our previous report in rat using microsomes has suggested that in vitro CLint may provide a better estimate of in vivo CLH of total rather than unbound drug (De Buck et al., 2007). To further investigate the effect of relative drug binding, predictions of human CLH were performed each time under two variations, either by incorporating or disregarding such binding factors. Methods to predict Vss and CL were combined to predict in vivo t½, and the ACAT model was tested for its ability to predict the area under the oral concentration-time profile (AUC), the oral apparent volume of distribution (Vd/F), and peak plasma concentration (Cmax). To determine whether a successful prediction in rat correlates with a successful prediction in human, the accuracy of each method was assessed within both species.
Materials and Methods
Compounds and Sources of in Vitro and in Vivo Parameters. The set of compounds (n = 26) included in this analysis were taken from those brought into clinical development at Johnson & Johnson Pharmaceutical Research and Development (Beerse, Belgium). Compounds were selected based on the availability of historical data on the in vivo preclinical (rat) and clinical PK, as well as of each of the following experimentally determined biochemical and physicochemical parameters: unbound fraction in plasma (fup), unbound fraction in microsomal or hepatocyte incubation (fuinc), basic and acidic dissociation constants (pKa), n-octanol:water partition coefficient of the non-ionized species (log Pow), aqueous solubility at defined pH conditions or solubility in simulated intestinal fluid (SIF), in vitro CLint determined in hepatic microsomes or hepatocyte suspension cultures, and the blood-to-plasma concentration ratio (RB). Summaries of the available in vitro and in vivo PK data are shown in Tables 1 and 2, respectively.
In vitro and in silico physicochemical and biochemical properties of the 26 compounds
Summary of the preclinical (rat) and clinical pharmacokinetic data for the 26 compounds
The 26 compounds in the data set cover a broad range of small molecules from a variety of discovery programs. The majority of compounds (n = 19) were moderate-to-strong bases (pKa of protonated base >7.0); three were neutral or weakly ionized at physiological pH (weak base). The remaining compounds were one weak acid, one strong acid, and two zwitterions. The lipophilicity (log Pow) ranged between 1.11 and 5.5, and fup ranged from 0.001 to 0.867. Aqueous solubility was highly variable with values at physiological pH ranging from 0.003 mg/ml to 74 mg/ml. Vss in humans varied from limited (30 L) to widespread (>1000 L). In the rat, major elimination pathways included hepatic metabolism, renal excretion, or a combination of the two. In humans, total body clearance from plasma (CL) varied from less than 10% of hepatic blood flow (Qh) to more than 70% of Qh.
Model Structure. The Gastroplus 5.1.0 generic PBPK model and its built-in mass balance differential equations were used for all simulations (Simulations Plus Inc., Lancaster, CA). In brief, the model (Fig. 1) was composed of 14 tissue compartments, including lung, spleen, liver, gut, adipose tissue, muscle, heart, brain, kidney, skin, testes, red marrow, yellow marrow, and rest of the body, which were linked by the venous and arterial blood circulation. It was assumed that drug distributes instantaneously and homogenously within each tissue compartment, and uptake of drug within each tissue compartment was limited by the blood flow (perfusion rate-limited uptake). The default Gastroplus settings of all physiological data used in the rat and human PBPK models are summarized in Table 3. The methods used for estimating the PBPK model input data on CLH, renal plasma clearance (CLR), Ptp values, and absorption rate are described below.
Physiological values for tissue volumes and blood flow in rat and human
Default values taken from Gastroplus software 5.10.0 generic rat and human PBPK model.
Prediction of Human and Rat Ptp and Vss: Method Vd1. Predicted values of rat and human Ptp for each tissue compartment of Fig. 1 were obtained from drug-specific physicochemical parameters using the following mechanistic tissue composition-based equation developed by Poulin and coworkers (Poulin and Theil, 2002): 
where P is the anti-logged value of log Pow for a nonadipose tissue or is the vegetable oil/buffer partition coefficient for both the ionized and nonionized species at pH 7.4 (Dvow) for adipose tissue. Dvow was calculated from log Pow using the Henderson-Hasselbalch equations and the following relationship: log Pvow = 1.115 · log Pow - 1.35 (Leo et al., 1971). V is the fractional tissue volume content of neutral lipids (NL), phospholipids (PH), or water (W) in tissue (T) and plasma (p). The physiological data on human and rat values used for VNLT, VNLp, VPHT, VPHp, VWT, and VWp have been described in the literature (Poulin and Theil, 2002). The fraction unbound in tissue (fut) in eq.1 was estimated as follows: 
where RA is the ratio of albumin concentration found in tissue over plasma. For lipophilic and highly protein-bound compounds, it has been assumed that for adipose tissue, RA equals 0.15, whereas for nonadipose tissue, RA equal 0.5 (Ellmerer et al., 2000; Poulin and Theil, 2002).
Finally, rat and human Vss values were calculated by Gastroplus software according to the equation of Sawada et al. (1984) in which Vss equals the plasma volume in addition to the sum of each Ptp multiplied by its respective tissue volume.
Prediction of Human and Rat Ptp and Vss: Method Vd2. For rat Ptp and Vss, experimental rat Ptp values were determined under in vivo conditions (single oral or intravenous dose) as the ratio of the AUC calculated over a minimum of five time points, assuming pseudoequilibrium. All experimentally determined in vivo rat Ptp values used within this study are summarized in Table 2. In instances where the in vivo Ptp was not available for a compound, the value for that tissue compartment (Fig. 1) was predicted using the tissue composition-based equation as described by Rodgers et al. (2005a). In brief, for strong bases (pKa > 7.0), Ptp of unbound drug (Ptpu) was calculated using eq. 3: 
where V is the fractional tissue volume of neutral lipids (NL), neutral phospholipids (NP), extracellular water (EW), and intracellular water (IW), [AP]t is the concentration of acidic phospholipids in tissue, all physiological data on VEW, VIW, VNL, VNP and [AP]t for both adipose and nonadipose tissue have been described in the literature (Rodgers et al., 2005a), pKa represents the dissociation constant of the protonated base, and Pvow is the anti-logged value of log Pvow (calculated from Pow as described above). Ka is the association constant of the compound with the acidic phospholipids, and was calculated from eq. 4: 
where Ptpu,BC is the Ptpu of the red blood cell (BC) and thus equals the erythrocyte-to-plasma concentration ratio (E/P) divided by fup. E/P was calculated from the RB and hematocrit (H), as follows: E/P = (RB - (1 - H))/H. For weak bases (pKa < 7; JNJ5, JNJ25, JNJ26), acids (JNJ13, JNJ22), and zwitterions (JNJ17, JNJ19) Ptp values were predicted using a modification of eq. 3, as described by Rodgers and Rowland (2006). It should be noted that for all compounds, Ptp estimates for testes and rest of body compartment were taken from method Vd1, since the published equations by Rodgers and Rowland (2006) do not allow for prediction of these values.
For human Ptp and Vss, all rat Ptp values obtained as described in this section were scaled to human with the assumption that the human Ptpu is equal to the rat Ptpu: 
Finally, rat and human Vss values were calculated by Gastroplus software (Simulations Plus Inc.) as mentioned under method Vd1.
Prediction of CLH, CLR, and CL: Method CL1. For metabolically cleared compounds, the liver compartment of the PBPK model was provided with input data on CLH, which was calculated in three steps.
First, the in vitro hepatic CLint (l/h/mg microsomal protein or l/h/106 cells) was determined from a typical microsomal or hepatocyte substrate depletion or kinetic assay (Kantharaj et al., 2003), and was scaled to in vivo CLint (l/h), accounting for the microsomal recovery or hepatocellularity and liver weight as described by Houston (1994): 
where SF (scaling factor) represents the milligrams of microsomal protein or million cells per gram of liver multiplied by the grams of liver weight. A microsomal recovery of 40 mg of microsomal protein/g of liver (Pelkonen et al., 1973; Ito and Houston, 2005) was used for both rat and human. A hepatocellularity of 125 and 120 million cells/g of liver was used for rat and human, respectively (Iwatsubo et al., 1996, 1997). Human and rat standard liver weight was 1400 g (20 g/kg body weight) and 11.25 g (45 g/kg body weight), respectively (Houston, 1994; Obach et al., 1997).
Second, the hepatic blood clearance (CLH,blood,) was calculated using the commonly used equation of the well stirred liver model: 
where Qh is the hepatic blood flow (human, 90 l/h; rat, 0.828 l/h). Experimental values for fup, fuinc, RB, and in vivo CLint are presented in Table 1. Third, because Gastroplus requires input data on CLH, CLH,blood was converted to CLH (CLH = RB · CLH,blood).
For renally cleared compounds, the prediction of human CLR was obtained using the glomerular filtration rate (GFR) ratio approach as described by Lin (1998): 
where rat CLR,unbound (l/h/kg) is the CLR corrected for rat fup (CLR/fup) and the GFR ratio between rat and human is 4.8 (Lin, 1998). Predicted CL was calculated as the sum of the predicted CLH and CLR.
Prediction of CLH, CLR, and CL: Method CL2. Our previous study and those by others using in vitro metabolism data have suggested that in vitro CLint may provide a better estimate of in vivo CLH of total rather than unbound drug (Obach et al., 1997; De Buck et al., 2007). Therefore, CLH predictions were also assessed using method CL2 under the assumption that fup/RB and fuinc effectively nullify in the liver model calculation, negating the measurement of either process: 
CLH,blood was converted to CLH as described above. The prediction of human CLR from rat data was identical to that found by method CL1. Predicted CL was calculated as the sum of the predicted CLH and CLR.
Prediction of in Vivo t½: Method Vd1/CL1 and Method Vd2/CL2. Prediction of in vivo t½ relies on the prediction of both Vss and CL. Two different approaches were tested for their ability to predict in vivo t½. First, method Vd1 was combined with method CL1 (i.e., method Vd1/CL1) since this combination predicts CLH according to the most widely accepted approach toward the use of fup/RB and fuinc (eq. 7) (Jones et al., 2006a), and requires minimal data input for prediction of Vss. For comparison, method Vd2 was combined with method CL2 (i.e., method Vd2/CL2) since this combination predicts Vss and CL according to this approach, which was also found to provide the best results in rat. Predicted values of in vivo t½ were taken from the Gastroplus software interface (Simulations Plus Inc.).
The ACAT Model and Prediction of Oral AUC. Prediction of oral AUC relies on the prediction of both CL and the extent of absorption. CL was predicted using either method CL1 or method CL2 as described above. The extent of absorption was predicted using the Gastroplus ACAT model (Yu and Amidon, 1999; Agoram et al., 2001). For all simulations, the ACAT model was provided with experimentally determined data on log Pow, pKa, aqueous buffer solubility or solubility in SIF at defined pH, effective human jejunal permeability (Peff), and dose (D) administered (Table 1). Apparent permeability (Papp) was measured using a typical Caco-2 permeability assay and converted to Peff using the following correlation: log Peff,human = 0.6532 · log Papp,caco-2 - 0.3036 (Sun et al., 2002). In instances where Caco-2 data were not available (n = 4, Table 1), in silico estimates of human Peff were obtained by the artificial neural network model in ADMETPredictor version 1.3.2 (Simulations Plus Inc.). The extent to which paracellular and transcellular routes are used in drug transport is influenced by the fraction of ionized and un-ionized species, which, in turn, depends upon the pKa of the drug and the pH of the solution (Ungell et al., 1998). To account for such regional changes in permeability, the Gastroplus built-in “Opt logD-model” was applied (for a detailed description, see manual of Gastroplus 5.1.0). In brief, the model assumes that the regional absorption rate coefficient for each gastrointestinal compartment can be calculated as the product of the Peff (jejunal permeability at pH 6.5) and an absorption scale factor (ASF) specific for each gastrointestinal compartment. An estimate of ASF for each compartment is obtained based on the premise that a linear relationship with a negative slope exists between the deviation of the log D from the neutral log P (ΔlogDpH) and the change in the log of the permeability coefficients at the two pH values: 
where C1 and C2 are two proprietary fitted constants accomplished through a series of many thousands of simulations. The Gastroplus ACAT physiology was “Human-Physiological-Fasted”. Metabolic first-pass extraction was assumed to depend only on CLH.

A and B, prediction accuracy for the physiologically based predictions of human Vss obtained using method Vd1 (A) and method Vd2 (B). C and D, prediction accuracy for the physiologically based predictions of human total body clearance from plasma (CL) obtained using method CL1 (C) and method CL2 (D). For more details on all methods used, refer to Materials and Methods. Lines signify unity and 2-fold errors between predicted and experimentally determined parameters.
Prediction of Vd/F and Cmax after Oral Dosing. Prediction of both Vd/F and Cmax rely on the prediction of Vss, CL, and the rate and extent of absorption. The rate and extent of absorption were predicted using the ACAT model as described above. Vss and CL were predicted using either method Vd1/CL1 or method Vd2/CL2 as described above. Predicted values of Cmax were taken from the Gastroplus software interface (Simulations Plus Inc.). The predicted Vd/F was calculated from the predicted CL/F multiplied by the predicted in vivo t½/ln 2. Predicted CL/F was calculated as D divided by predicted AUC after oral dosing.
Prediction of Plasma Concentrations after Oral Dosing. Predictions of individual plasma concentrations after oral dosing were obtained using the ACAT model (as described above), which served as a time-dependent input to the disposition model composed of either method Vd1/CL1 or method Vd2/CL2 as described above.
Calculation of the in Vivo Pharmacokinetic Parameters. Noncompartmental analysis was performed using WinNonLin version 4.01 (Pharsight, Mountain View, CA) to calculate CL from the relationship CL = D/AUC, and Vss was determined as Vss = Dose · AUMC/(AUC)2. Absolute oral bioavailability (F) was calculated as the ratio of dose-normalized AUC after oral and intravenous administration using the mean of individual AUCs.
Success Criteria. Success of predictions was assessed by the root mean squared prediction error (rmse) and the average-fold error (afe) as measures of precision and bias, respectively, with equal value to under- and overpredictions: 

A prediction method with an afe ≤ 2 was considered successful. Predicted PK parameters and plasma concentration-time profiles were deemed accurate if they agreed with mean experimental in vivo values within a factor of 2 (Obach, 1999; Poulin and Theil, 2002).
Results
Prediction of Vss. There were 19 compounds that had human intravenous PK data suitable for assessment of Vss predictions. The correlations between observed and predicted human Vss using methods Vd1 and Vd2 are presented in Fig. 2, A and B, respectively. The parameters for the accuracy of the predictions using methods Vd1 and Vd2 are given in Tables 4 and 5, respectively. The simplest approach (method Vd1) predicted human Vss within 2-fold of observed for only 6 compounds (32%, Fig. 2A). In contrast, method Vd2 resulted in more accurate predictions with 16 compounds within 2-fold of observed (84%, Fig. 2B). Although method Vd2 showed slight bias toward overprediction, the bias and precision were typically much better than with method Vd1 as indicated by the decreased afe and rmse values (Tables 4 and 5). Using method Vd2, the correction for differences in plasma binding between rat and human resulted in better predictions than when binding differences were ignored (Table 6). Ignoring binding differences yielded more bias and a lower precision, but also a decrease in the number of compounds that were within 2-fold error (Table 6). Furthermore, if in Method Vd2 all experimentally determined in vivo rat Ptp values were substituted by their predicted counterparts, a general decrease in accuracy was observed, irrespective of correction for plasma binding (Table 6).
Statistics for the predicted human pharmacokinetic parameters obtained using method Vd1 and method CL1
See Materials and Methods for more details on prediction of each parameter using method Vd1 and/or method CL1.
Statistics for the predicted human pharmacokinetic parameters obtained using method Vd2 and method CL2
See Materials and Methods for more details on prediction of each parameter using method Vd2 and/or method CL2.
Effect of plasma protein binding and source of rat Ptp data on prediction accuracy of human Vss using method Vd2
For more details on method Vd2, see Materials and Methods.
Vss prediction accuracy was also assessed in rat to test whether a successful prediction approach in rat indicates that prediction in human would be successful. Method Vd2 was the best predictor of rat Vss, with 73% within 2-fold of observed (n = 26) (Table 7). As expected, when all experimentally determined in vivo rat Ptp values were substituted by their predicted counterparts, a general decrease in accuracy of method Vd2 was observed. The poorest predictor was method Vd1, which predicted only 12 compounds of 26 within 2-fold of observed (42%, Table 7).
Statistics for the predicted rat pharmacokinetic parameters
For more details on methods Vd1, Vd2, CL1, and CL2, see Materials and Methods.
Prediction of CL. The accuracy of clearance predictions refers to the total plasma clearance (CL) when intravenous data were available (n = 19). The correlations between observed and predicted human CL using method CL1 are shown in Fig. 2C. Method CL1, which included both blood and microsomal or hepatocyte binding, yielded several underpredictions of CL, and only 10 compounds were predicted within 2-fold of mean observed values (53%, Table 4). As a result, a strong bias (afe) and poor precision (rmse) were observed (Table 4). Despite the overall poor accuracy of the method, prediction of the renal component, i.e., CLR, was found to be accurate. CLR predictions (n = 4) were 6.4 l/h, 18 l/h, 0.74 l/h, and 19 l/h for JNJ4, JNJ12, JNJ19, and JNJ20, respectively, and therefore, all predictions were within 2-fold of observed (Table 4).

Prediction accuracy for the physiologically based predictions of human in vivo terminal half-life (in vivo t½) obtained using method Vd1/CL1 (A) and method Vd2/CL2 (B). For more details on all methods used, refer to Materials and Methods. Lines signify unity and 2-fold errors between predicted and experimentally determined parameters.

Prediction accuracy for the physiologically based predictions of human area under the plasma concentration-time curve after oral dosing (AUC) and absolute oral bioavailability (F, insets) obtained using the ACAT model and method CL1 (A), and the ACAT model and method CL2 (B). For more details on all methods used, refer to Materials and Methods. Lines signify unity and 2-fold errors between predicted and experimentally determined parameters.
The correlations between observed and predicted human CL using method CL2 are shown in Fig. 2D. This method predicted CL within 2-fold of observed for 14 compounds (74%, Fig. 2D). Predictions showed limited afe, and rmse value was strongly decreased compared with method CL1 (Table 5). To further substantiate these findings, prediction of CL using both methods CL1 and CL2 was also assessed in rat for all compounds (n = 26). Table 7 indicates that method CL2 yielded more accurate predictions in rat compared with method CL1. Method CL1 projected rat CL within a 2-fold error for only 9 compounds (35%), whereas method CL2 projected rat CL within 2-fold error for 22 compounds (85%).
Prediction of in Vivo t½. The accuracy of the in vivo t½ predictions refers to the terminal in vivo t½ after intravenous administration when intravenous data were available (n = 19), and to the terminal in vivo t½ after oral dosing when only oral data were available (n = 7). Fig. 3, A and B illustrate the correlations between the observed and predicted values of in vivo t½ using method Vd1/CL1 and method Vd2/CL2, respectively. Method Vd1/CL1 was a poor predictor of in vivo t½ in this analysis in that only seven compounds were within 2-fold of observed (27%, Fig. 3A), with high bias toward overprediction (afe) and poor precision (rmse) (Table 4). These results were expected based on the results of the individual methods Vd1 and CL1. In contrast, method Vd2/CL2 resulted in more accurate predictions of in vivo t½ with 18 compounds within 2-fold of observed (69%, Fig. 3B). More importantly, there was significantly less bias (afe) and higher precision (rmse) (Table 5).
Prediction of AUC and F after Oral Dosing. There were 23 compounds that had human oral PK data for assessment of oral AUC, and 16 compounds that had both intravenous and oral PK data for assessment of F. The correlations between the observed and predicted oral AUC and F were obtained using the ACAT model in combination with either method CL1 or method CL2 and are presented in Fig. 4, A and B, respectively. Method CL1 predicted oral AUC within 2-fold of observed for only 8 compounds (35%, Fig. 4A), and a strong bias toward overprediction was observed for both oral AUC (Fig. 4A) and F (Fig. 4A, inset). In contrast, method CL2 predicted oral AUC within 2-fold of observed for 17 compounds (74%, Fig. 4B). Prediction of both oral AUC (Fig. 4B) and F (Fig. 4B, inset) showed less bias and higher precision as indicated by a decreased afe and rmse value (Tables 4 and 5), respectively.
Prediction of Vd/F and Cmax after Oral Dosing. The accuracy of the Vd/F predictions was assessed on all compounds intended for the oral route (n = 23). Figure 5 illustrates the correlations between the observed and predicted values of Vd/F using the ACAT model in combination with either method Vd1/CL1 (Fig. 5A) or method Vd2/CL2 (Fig. 5B). Method Vd1/CL1 was a poor predictor of Vd/F in that only 5 predictions were within 2-fold of observed (22%, Fig. 5A), with bias toward overprediction (afe) and poor precision (rmse) (Table 4). In contrast, method Vd2/CL2 resulted in more accurate predictions of Vd/F with 16 compounds within 2-fold of observed (70%, Fig. 5B). Although this method showed slight bias toward underprediction, the bias and precision were better than those obtained with method Vd1/CL1 as indicated by the decreased afe and rmse values (Tables 4 and 5).

A and B, prediction accuracy for the physiologically based predictions of the apparent volume of distribution after oral administration (Vd/F) obtained using the ACAT model and method Vd1/CL1(A) or the ACAT model and method Vd2/CL2 (B). C and D, prediction accuracy for the physiologically based predictions of the peak plasma concentration after oral dosing (Cmax) obtained using the ACAT model and method Vd1/CL1 (C) or the ACAT model and method Vd2/CL2 (D). For more details on all methods used, refer to Materials and Methods. Lines signify unity and 2-fold errors between predicted and experimentally determined parameters.
The correlations between the observed and predicted Cmax using the ACAT model in combination with either method Vd1/CL1 or method Vd2/CL2 are presented in Fig. 5, C and D, respectively. Both methods had similar accuracy to predict Cmax (Tables 4 and 5).
Prediction Accuracy of Oral Plasma Concentrations. There were 23 compounds that had suitable data for assessment of oral plasma concentrations. In Fig. 6, the simulated plasma concentration-time profiles using the ACAT model in combination with either method Vd1/CL1 (Fig. 6, solid line) or method Vd2/CL2 (Fig. 6, dotted line) are shown, together with the observed data (Fig. 6, open squares). In general, method Vd2/CL2 yielded the best agreement between the mean observed and predicted plasma values, as indicated by the afe and rmse values (Table 8).
Statistics for the predicted human plasma concentrations after oral dosing
For details on prediction of oral plasma concentrations using method Vd1/CL1 and method Vd2/CL2, see Materials and Methods.
Discussion
The use of whole-body PBPK modeling is becoming more popular within the pharmaceutical industry. This is due to a combination of estimating the PK characteristics of compounds as early as possible, with making efficient and informed selection on which compounds to progress (van de Waterbeemd and Gifford, 2003; Jones et al., 2006a). The development of mechanism-based prediction tools for the assessment of Ptp and CLH based on in vitro data has greatly contributed to the early applications of PBPK modeling (Theil et al., 2003). Although these prediction tools show great promise, it has been recognized that inaccurate predictions will occur if the underlying assumptions of the mechanistic equations are not met (Parrott et al., 2005b; Jones et al., 2006a). Therefore, more studies are required to assess how the prediction accuracy as well as the type of data needed will vary depending on the approach, the type of chemistry, and the prediction system used. To the best of our knowledge, the current study represents the first attempt to explore how an integrated use of both experimental and predicted data can improve PK predictions using whole-body PBPK modeling. A dataset of 26 compounds formed the reference data in our study. It is acknowledged that the number of compounds might be below the optimum to draw general conclusions about the usefulness of the approaches investigated; nevertheless, it is still large enough to show some clear trends.
The present evaluation indicates that the type of tissue distribution data used must be carefully considered. The most accurate approach toward prediction of human Vss considered a combined set of predicted and experimental in vivo rat Ptp data (84% within 2-fold, method Vd2), whereas predictions based on physicochemical input alone were rather poor (32% within 2-fold, method Vd1). This finding illustrates that Vss predictions can be improved by considering limited experimental in vivo rat Ptp data (Table 2). Experimental Ptp data must, however, be carefully selected since Vss is largely determined by Ptp of adipose and muscle tissues (Bjorkman, 2002), which were available for most of the compounds (Table 2). A second clear trend was that correction of rat Ptp data for interspecies differences in plasma protein binding yielded better predictions compared with when binding differences were ignored (84% versus 53% within 2-fold). This observation was anticipated because in scaling tissue distribution from rat to human, the unbound human Ptp values are generally assumed to be identical to those of rat (Sawada et al., 1984). Nevertheless, in the case of basic drugs, the accuracy of this assumption remains uncertain since electrostatic interactions with acidic phospholipids have been identified as a major factor controlling tissue distribution (Rodgers et al., 2005b), and an interspecies variability in the acidic phospholipids has been indicated (Rodgers et al., 2005a).

Predictions of human plasma concentration-time profiles after oral dosing using the ACAT model and either method Vd1/CL1 (dotted line) or Method Vd2/CL2 (solid line) for: A, JNJ1; B, JNJ2; C, JNJ3; D, JNJ4; E, JNJ7; F, JNJ8; G, JNJ9; H, JNJ10; I, JNJ11; J, JNJ12; K, JNJ13; L, JNJ14; M, JNJ15; N, JNJ16; O, JNJ18;P, JNJ19; Q, JNJ20; R, JNJ21; S, JNJ22; T, JNJ23; U, JNJ24; V, JNJ25; and W, JNJ26. The observed data are shown in open squares. For more details on all methods used, refer to Materials and Methods.
Mechanistic equations to predict tissue distribution from physicochemical input have been developed by Poulin and Theil (Poulin and Theil, 2000, 2002; Poulin et al., 2001), who reported that for a set of 123 drugs, 80% of the predicted Vss values were within 2-fold of observed. In the current study, the overall prediction accuracy using these equations was reduced to 42% and 32% within 2-fold of observed for rat and human, respectively. A decreased prediction accuracy of these equations was also observed by others (Parrott et al., 2005a; Jones et al., 2006a). This may be explained by distribution processes that are not covered in these equations, such as active transport or ionic interactions of charged bases with acidic phospholipids of cell membranes. In the Poulin and Theil (2002) equation, ionic interactions are not included and tissue binding is extrapolated from plasma protein binding. We have shown that using this approach, tissue binding of bases is prone to underestimation, particularly for strong bases that have low plasma protein binding such as JNJ4, JNJ10, and JNJ20 (De Buck et al., 2007). In this study, however, the Vss of most compounds was overpredicted, despite the fact that they were bases (Fig. 2A). Although this finding may be explained by a limitation in membrane permeation, this explanation seems rather unlikely given the overall high permeability of the compounds within our dataset. Another explanation may be a consistent overprediction of Ptp values of adipose tissue, which is a major contributor to the total Vss. For example, Vss prediction can be easily biased by the investigator's choice on the RA value for adipose tissue (eqs. 1 and 2). In this study and those by others, it has been assumed that the RA value for adipose tissue equals 0.15 (Jones et al., 2006a). However, in the original work of Poulin and Theil (2002), the RA value for adipose tissue was assumed to be 0. Future work will assess whether an optimization of the RA value based on the outcome of the prediction in rat may improve prediction accuracy.
The decision of whether to incorporate blood binding (fup/RB) and in vitro incubation matrix binding (fuinc) in CLH predictions remains controversial (Obach, 1999; Riley et al., 2005; De Buck et al., 2007). The inclusion of both unbound fractions has been suggested as the generally acceptable approach. However, our results and those by others demonstrate that in the case of some compound classes, especially basic ones, disregarding all binding values may yield the most accurate predictions (method CL2, 74% within 2-fold) (Obach, 1997, 1999; De Buck et al., 2007), whereas inclusion of both correction factors yielded large underpredictions (method CL1, 53% within 2-fold). It is acknowledged, however, that underpredictions (Fig. 2C) may prevail because the contribution of extrahepatic metabolism and biliary clearance to CL has been neglected; therefore, scaled microsomal or hepatocyte data may not always be able to fully project CL. To the best of our knowledge, oxidative microsomal metabolism was the major route of elimination for the compounds within this study. Despite these uncertainties, our findings obtained in human were in agreement with those obtained in rat, suggesting that an assessment of the prediction accuracy in rat could be used to guide which approach is most likely to succeed. For renally cleared compounds (JNJ4, JNJ12, JNJ19, JNJ20), the empirical GFR approach successfully extrapolated human CLR from rat data. This is in agreement with previous reports that have achieved good predictions of CLR using this approach (Lin, 1998; Jones et al., 2006a).
The ability to successfully predict a drug's dosing regimen by predicting human in vivo t½ is of tremendous value in the compound selection process. The most accurate prediction of in vivo t½ was obtained using method Vd2/CL2 (69% within 2-fold). In contrast, in vivo t½ prediction was strongly biased toward overprediction using a combination of methods Vd1 and CL1, most probably as a result of overprediction of Vss and underprediction of CL, respectively (Table 4). These results indicate that accurate predictions of both Vss and CL are critical in the prediction of in vivo t½.
In the prediction of oral AUC, both the CL and fraction of oral dose absorbed are important. As expected, the most accurate predictions of AUC were obtained using the most accurate input on CL (method CL2). For the purpose of this study, intestinal wall metabolism was ignored, yet the prediction of oral absorption parameters was on the whole quiet successful, suggesting that the contribution of intestinal metabolism may be low. It is acknowledged that this represents a shortcoming, and ideally its contribution should be considered. Estimates of fraction of oral dose absorbed were obtained using the ACAT model and were based on the drug's in vitro input on permeability and solubility. Unfortunately, in this dataset there were only two BCS class III compounds (high solubility and low permeability) for which the limiting effect of permeability could be assessed (JNJ10, JNJ12). For such compounds, accurate estimates of permeability are imperative for successful predictions. In this study, converted Caco-2 permeability data provided accurate predictions, whereas inaccurate predictions were observed using in silico predicted counterparts (data not shown). The vast majority of the compounds were highly permeable and belong to either BCS class I (high solubility) or BCS class II (low solubility). For BCS class II compounds, the outcome of simulations may be sensitive to the nature and accuracy of the solubility input. Aqueous solubility data may not reflect actual solubility in vivo, resulting in a strong bias toward underprediction of bioavailability (Parrott et al., 2005b; Jones et al., 2006a). For two compounds that were practically insoluble in aqueous media (JNJ21, JNJ24), solubility measurements in SIF were found to provide a good alternative.
Prediction of Vd/F and Cmax rely on the rate of absorption as well as the methods used for prediction of CL and Vss. The ACAT model may serve as a time-dependent input function of PBPK disposition models and thus allows prediction of full plasma concentration-time profiles. As expected, the most accurate prediction of Vd/F was obtained using method Vd2/CL2 (70% within 2-fold), whereas prediction was strongly biased toward overprediction using method Vd1/CL1 (21% within 2-fold). In contrast, prediction of Cmax (65% within 2-fold) was less sensitive to the choice of methods used for prediction of Vss and CL. This may be explained by time-dependent prediction errors, which are usually more pronounced on terminal plasma concentrations (Fig. 6).
In summary, these results and those by others demonstrate that a generic physiologically based prediction approach can lead to reasonable predictions of human pharmacokinetics (Jones et al., 2006a,b). However, the prediction accuracy may vary depending on the approach, and significant mis-predictions can occur when the underlying assumptions of the model or prediction tool are not met. PBPK model validation on each of the key input parameters using in vitro assays in combination with preclinical data remains the recommended strategy for human PBPK modeling.
Acknowledgments
We thank the many colleagues at Johnson & Johnson Pharmaceutical Research and Development (Beerse, Belgium) who have generated data used in these analyses, with a special thanks to everybody who currently supports the in vitro and in vivo pharmacokinetic studies and bioanalytical assays.
Footnotes
-
doi:10.1124/dmd.107.015644.
-
ABBREVIATIONS: PK, pharmacokinetic(s); ACAT, advanced compartmental absorption and transit model; ADME, absorption, distribution, metabolism, and excretion; AUC, area under the plasma concentration-time curve; AUMC, area under the first moment curve; BCS, Biopharmaceutical Classification Scheme; CL, total body clearance from plasma; CL/F, total body clearance from plasma after oral administration; CLH, hepatic plasma clearance; CLH,blood, hepatic blood clearance; CLint, intrinsic clearance; CLR, renal clearance from plasma; Cmax, peak plasma concentration after oral administration; D, dose; F, absolute oral bioavailability; fuinc, unbound fraction in microsomal or hepatocyte incubation; fup, unbound fraction in plasma; GFR, glomerular filtration rate; in vivo t½, in vivo terminal half-life; log Pow, n-octanol:water partition coefficient of the non-ionized species; PBPK, physiologically based pharmacokinetics; Ptp, tissue-to-plasma partition coefficient; Ptpu, tissue-to-plasma partition coefficient of the unbound drug; Qh, hepatic blood flow; RA, ratio of albumin concentration found in tissue over plasma; RB, blood-to-plasma concentration ratio; SF, scaling factor; SIF, simulated intestinal fluid; Vd/F, apparent volume of distribution after oral administration; Vss, apparent volume of distribution at steady state.
- Received March 5, 2007.
- Accepted July 3, 2007.
- The American Society for Pharmacology and Experimental Therapeutics


