


Abstract
Milnacipran (Savella) inhibits both norepinephrine and serotonin reuptake and is distinguished by a nearly 3-fold greater potency in inhibiting norepinephrine reuptake in vitro compared with serotonin. We evaluated the ability of milnacipran to inhibit and induce human cytochrome P450 enzymes in vitro. In human liver microsomes, milnacipran did not inhibit CYP1A2, 2B6, 2C8, 2C9, 2C19, or 2D6 (IC50 ≥ 100 μM); whereas, a comparator with dual reuptake properties [duloxetine (Cymbalta)] inhibited CYP2D6 (IC50 = 7 μM) and CYP2B6 (IC50 = 15 μM) with a relatively high potency. Milnacipran inhibited CYP3A4/5 in a substrate-dependent manner (i.e., midazolam 1′-hydroxylation IC50 ≈ 30 μM; testosterone 6β-hydroxylation IC50 ≈ 100 μM); whereas, duloxetine inhibited both CYP3A4/5 activities with equal potency (IC50 = 37 and 38 μM, respectively). Milnacipran produced no time-dependent inhibition (<10%) of P450 activity, whereas duloxetine produced time-dependent inhibition of CYP1A2, 2B6, 2C19, and 3A4/5. To evaluate P450 induction, freshly isolated human hepatocytes (n = 3) were cultured and treated once daily for 3 days with milnacipran (3, 10, and 30 μM), after which microsomal P450 activities were measured. Whereas positive controls (omeprazole, phenobarbital, and rifampin) caused anticipated P450 induction, milnacipran had minimal effect on CYP1A2, 2C8, 2C9, or 2C19 activity. The highest concentration of milnacipran (30 μM; >10 times plasma Cmax) produced 2.6- and 2.2-fold increases in CYP2B6 and CYP3A4/5 activity (making it 26 and 34% as effective as phenobarbital and rifampin, respectively). Given these results, milnacipran is not expected to cause clinically significant P450 inhibition or induction.
- SNRI, selective serotonin-norepinephrine reuptake inhibitor
- PK, pharmacokinetic(s)
- PMs, poor metabolizers
- EMs, extensive metabolizers
- P450, cytochrome P450
- FDA, U.S. Food and Drug Administration
- DMSO, dimethyl sulfoxide
- HPLC, high-performance liquid chromatography
- ANOVA, analysis of variance
- AUC, area under the curve
- INR, international normalized ratio.
Milnacipran (Savella), which was recently approved for the treatment of fibromyalgia, is a dual reuptake inhibitor of norepinephrine and serotonin, which is distinguished by an approximately 3-fold greater potency in inhibiting norepinephrine reuptake in vitro compared with serotonin reuptake (Vaishnavi et al., 2004). These two neurotransmitters have been shown to exert significant modulatory effects on peripheral and central pain processing (Dubner and Hargreaves, 1989). Selective serotonin-norepinephrine reuptake inhibitors (SNRIs) such as duloxetine and venlafaxine are more potent inhibitors of serotonin reuptake than norepinephrine reuptake, whereas the converse is true of milnacipran (Vaishnavi et al., 2004).
Milnacipran is well absorbed (85–90%) after oral administration and has linear pharmacokinetics (PK) over the therapeutic dose range (Delini-Stula, 2000). The terminal elimination half-life in plasma is 6 to 8 h, and steady-state levels can be predicted from single-dose PK data, indicating the absence of autoinhibition or autoinduction. Milnacipran is eliminated primarily by renal excretion of the unchanged drug (50–60%), conjugation to form a carbamoyl glucuronide (∼20%), and N-dealkylation by cytochrome P450 (mainly CYP3A4) to N-desethyl milnacipran (∼8%) (Puozzo and Leonard, 1996; Delini-Stula, 2000; Tsuruta et al., 2000; Puozzo et al., 2005; Forest Research Institute, personal communication). Metabolism by cytochrome P450 plays only a minor role in the elimination of milnacipran (Caccia, 1998; Grzesiak et al., 2000; Sawada and Ohtani, 2001; Puozzo et al., 2002). Consequently, genetic polymorphisms in CYP2D6 and inhibition of this enzyme do not affect the pharmacokinetics of milnacipran (Puozzo et al., 2005), in contrast to the situation with many selective serotonin-reuptake inhibitors and tricyclic antidepressants (Bertilsson et al., 2002; Preskorn et al., 2007). The PK profile of milnacipran is the same in both CYP2D6 poor metabolizers (PMs) and extensive metabolizers (EMs), and this finding also holds for CYP2C19 PMs and EMs (Puozzo et al., 2005). Limited to no modification of the pharmacokinetic profile is expected when milnacipran is coadministered with fluoxetine (a strong CYP2D6 inhibitor) or carbamazepine (an inducer of CYP2B6, CYP3A4, and several other enzymes) (Puozzo et al., 2002, 2005, 2006).
From the perspective of drug-drug interactions, drugs can be viewed as victims (objects) or perpetrators (precipitants) (Ogilvie et al., 2008). Milnacipran has low victim potential because its clearance is not heavily dependent on metabolism by a single drug-metabolizing enzyme; hence, its PK profile is not significantly affected by the genetic polymorphisms, P450 inhibitors, or P450 inducers that affect the disposition of other antidepressant drugs. More than half of the drug (50–60%) is eliminated unchanged in urine, which indicates that kidney function is the primary determinant of the elimination of milnacipran. The in vitro studies described in this report were designed to evaluate the perpetrator potential of milnacipran. The enzyme-inducing potential of milnacipran was evaluated in three preparations of freshly cultured human hepatocytes and focused on the major inducible human P450 enzymes, namely CYP1A2, 2B6, 2C8, 2C9, 2C19, and 3A4/5. CYP2D6 was not examined because this enzyme is recognized by the FDA as being noninducible (Draft Guidance for Industry: Drug Interaction Studies: Study Design, Data Analysis and Implications for Dosing and Labeling, 2006, http://www.fda.gov/downloads/Drugs/GuidanceComplianceRegulatoryInformation/Guidances/ucm072101). The ability of milnacipran to function as a direct-acting and metabolism-dependent inhibitor of P450 enzymes was evaluated with human liver microsomes. The enzymes evaluated included CYP1A2, 2B6, 2C8, 2C9, 2C19, 2D6 and 3A4/5 (with two substrates), as recommended by the FDA (http://www.fda.gov/downloads/Drugs/GuidanceComplianceRegulatoryInformation/Guidances/ucm072101; Huang et al., 2008). In the P450 inhibition study, the SNRI duloxetine (Cymbalta) was included as a comparator. The structures of milnacipran and duloxetine are shown in Fig. 1. The in vitro studies described herein were conducted in accordance with the FDA's draft guidance document on the conduct of in vitro metabolism studies (http://www.fda.gov/downloads/Drugs/GuidanceComplianceRegulatoryInformation/Guidances/ucm072101) and the principles promulgated by Tucker et al. (2001), Bjornsson et al. (2003), and Huang et al. (2008).
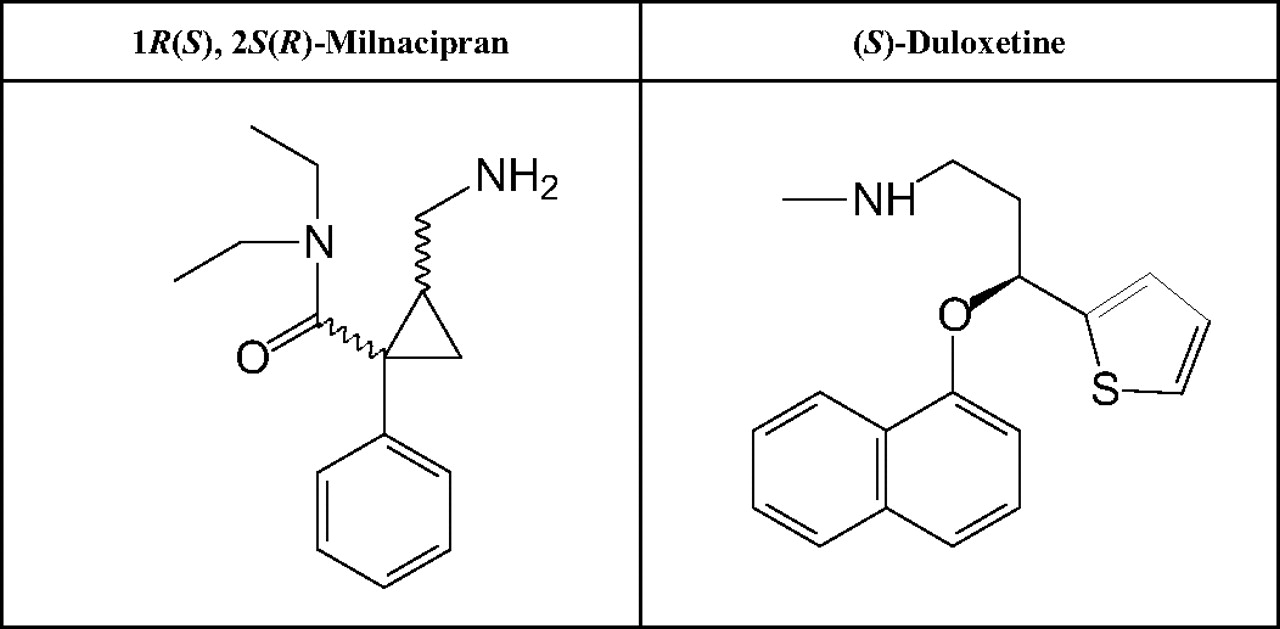
Structures of the dual reuptake inhibitors milnacipran (Savella) and duloxetine (Cymbalta).
Materials and Methods
Chemicals and Reagents.
Milnacipran and duloxetine were provided by Forest Research Institute (Jersey City, NJ). Stock solutions of milnacipran (10 and 50 mM) and duloxetine (10 mM) were prepared in high-purity water for P450 inhibition studies and in dimethyl sulfoxide (DMSO) for enzyme induction studies.
The following reagents were purchased from Sigma-Aldrich (St. Louis, MO): bupropion HCl, dextromethorphan, diclofenac, 4′-hydroxydiclofenac, (±)-4′-hydroxymephenytoin, 6β-hydroxytestosterone, midazolam, phenacetin, and testosterone. Acetaminophen, N-desethylamodiaquine, dextrorphan, and 1′-hydroxymidazolam were purchased from Cerilliant Corporation (Round Rock, TX). Amodiaquine was purchased from U.S. Pharmacopeia (Rockville, MD). S-Mephenytoin was purchased from Toronto Research Chemicals Inc. (North York, ON, Canada). Hydroxybupropion, ITS+ (insulin, human transferring, and selenious acid), and Matrigel were purchased from BD Biosciences (Bedford, MA). Dulbecco's modified Eagle's medium, GlutaMAX-1, insulin, minimum essential medium-nonessential amino acids, modified Eagle's medium (Dr. Chee's modification), and liquid penicillin-streptomycin were purchased from Invitrogen (Carlsbad, CA). PureCol was purchased from Inamed BioMaterials (Fremont, CA). Fetal bovine serum was purchased from SAFC Biosciences (Lenexa, KS). Loctite 4013 was purchased from the Loctite Corporation (Rocky Hill, CT). The BCA Protein Assay Kit was purchased from Pierce Chemical (Rockford, IL). All other reagents were obtained from commercial sources, most of which have been described elsewhere (Robertson et al., 2000; Madan et al., 2003; Ogilvie et al., 2006).
Test System.
Pooled human liver microsomes (n = 16, mixed gender) were prepared and characterized at XenoTech, LLC (Lenexa, KS). Human hepatocytes from nontransplantable livers were prepared at XenoTech from three individual donors, all white men (ages 51, 74, and 77); initial cell viabilities were 83, 93, and 77%, respectively.
In Vitro P450 Inhibition.
The ability of milnacipran and duloxetine to inhibit the major drug-metabolizing P450 enzymes in a direct and time-dependent manner was investigated with a pool of human liver microsomes (pool of 16 individuals), as described by Ogilvie et al. (2006, 2008). In brief, duplicate incubations were conducted at 37 ± 1°C in 400-μl incubation mixtures containing potassium phosphate buffer (50 mM, pH 7.4), MgCl2 (3 mM), EDTA (1 mM, pH 7.4), an NADPH-generating system (consisting of 1 mM NADP, 5 mM glucose 6-phosphate, and 1 unit/ml glucose-6-phosphate dehydrogenase) and P450 marker substrate as indicated in Table 1. Reactions were initiated by the addition of the NADPH-generating system and terminated after 5 min by an equal volume of acetonitrile (v/v) containing an appropriate internal standard, as summarized in Table 1. Precipitated protein was removed by centrifugation (920g for 10 min at 10°C). Calibration and quality control metabolite standards were prepared in zero time incubations. The analytical procedures are summarized in Table 1.
Experimental conditions for measuring microsomal P450 activity for enzyme inhibition studies
To evaluate milnacipran and duloxetine as direct-acting inhibitors, pooled human liver microsomes (≤0.1 mg/ml) were incubated with P450 marker substrates (at concentrations approximately equal to the Km, as shown in Table 1) in the presence and absence of milnacipran or duloxetine (at concentrations ranging from 0.1 to 100 μM) to determine the IC50 value.
To examine their ability to act as time-dependent inhibitors, milnacipran or duloxetine (at the same concentrations used to evaluate direct inhibition) were preincubated at 37 ± 1°C, in duplicate, with human liver microsomes and an NADPH-generating system for 30 min. After the preincubation period, the marker substrate (at a concentration approximately equal to its Km) was added, and the incubation was continued for 5 min to measure residual P450 activity. Reactions were terminated after 5 min by the addition of an equal volume of acetonitrile (containing the appropriate internal standard) (Table 1). Known direct-acting and metabolism-dependent inhibitors were included as positive controls, most of which appear on the FDA's list of recommended or accepted in vitro inhibitors (http://www.fda.gov/downloads/Drugs/GuidanceComplianceRegulatoryInformation/Guidances/ucm072101; Ogilvie et al., 2008). Samples were analyzed as described under Analytical Methods.
In Vitro P450 Induction.
The ability of milnacipran to induce or suppress the expression of P450 enzymes was investigated in primary cultures of freshly isolated human hepatocytes with a Matrigel overlay. After a 2-day adaptation period, three preparations of cultured human hepatocytes from three separate human livers were treated once daily for 3 consecutive days with milnacipran (3, 10, and 30 μM) or one of three prototypical P450 inducers, namely omeprazole (100 μM), phenobarbital (750 μM), and rifampin (10 μM), at the final concentrations indicated. Milnacipran and the positive controls were dissolved in DMSO, and hepatocytes treated with DMSO (final concentration 0.1%, v/v) served as negative controls. The isolation, culturing, and treatment procedures were performed essentially as described by Madan et al. (2003). Human hepatocytes were harvested 24 h after the third treatment to prepare microsomes, as described by Madan et al. (2003). Microsomes (0.004–0.02 mg/ml) were incubated with phenacetin (80 μM), bupropion (500 μM), amodiaquine (20 μM), diclofenac (100 μM), S-mephenytoin (400 μM), and testosterone (250 μM) for 10 to 30 min to measure CYP1A2, 2B6, 2C8, 2C9, 2C19, and 3A4/5 activity, respectively, essentially as described above (see In Vitro P450 Inhibition). Samples were analyzed as described under Analytical Methods (see below).
Analytical Methods.
All analyses of P450 enzyme activities were performed with validated high-performance liquid chromatography (HPLC)-tandem mass spectrometry methods. The mass spectrometry equipment was either an ABI Sciex (Applied Biosystems/MDS Sciex, Foster City, CA) API 2000, API 3000, or API 4000 mass spectrometer with Shimadzu HPLC pumps and autosampler systems (Shimadzu, Kyoto, Japan). The HPLC columns used were as follows: Waters Atlantis C18 (5-μm particle size, 50 × 2.1 mm) (Waters, Milford, MA) preceded by a Phenomenex Luna C-8 guard column (4.0 × 2.0 mm) (Phenomenex, Torrance, CA) or Waters Atlantis (5-μm particle size, 100 × 2.1 mm) (Waters) preceded by a Phenomenex Luna C-8 guard column (4.0 × 2.0 mm) (Phenomenex). Formic acid or ammonium acetate-based mobile phases were used for all sample analyses and flow rates ranged from approximately 0.55 to 0.90 ml/min. All columns were maintained at ambient temperature during analysis. Metabolites were quantified by back calculation of a weighted (1/x), linear, least-squares regression. The regression fit was based on analyte/internal standard peak area ratios calculated from calibration standard samples, which were prepared from authentic metabolite standards. Peak areas were integrated with an Analyst data system (version 1.4.1 or 1.4.2; Applied Biosystems/MDS Sciex).
Statistical Analyses.
P450 inhibition data were processed with a validated, custom software program (DI IC50 LCMS Template, version 2.0.3) for the Microsoft Excel (Office 2000, version 9.0; Microsoft, Redmond, WA), and IC50 values were determined by nonlinear regression with XLfit3 (version 3.0.5; ID Business Solutions Ltd., Guildford, Surrey, UK). XLfit is an Excel add-in program that is a component of the validated DI IC50 LCMS Template, version 2.0.3. This software uses the Levenberg-Marquardt algorithm to perform nonlinear regression fitting of the data to the following four-parameter sigmoidal-logistic IC50 equation:
Background was set to zero with a range up to 100 to express data as a percentage of control. This software has been verified for its ability to calculate IC50 values that lie within the concentration range of the inhibitor studied. When less than 50% inhibition is observed, the data are not extrapolated; hence, IC50 values are reported as being greater than the highest concentration of inhibitor tested.
P450 induction data were processed with a validated, custom software program (EI Interim Data Engine, version 1.2.1) for Microsoft Excel (Office 2003, version 11.0; Microsoft). Statistically significant differences between group means were calculated by equal variance and normality tests to determine whether the data were parametrically distributed. For parametrically distributed data sets, a one-way repeated-measures analysis of variance (ANOVA) was performed to determine whether there were significant differences between the group means. For nonparametrically distributed data sets, a Kruskal-Wallis ANOVA was performed. The ANOVA was followed by a Dunnett's post hoc test to identify the group means that were significantly different from the control values (p < 0.05 or 5% level of significance). This statistical test is designed for multiple comparisons with a mean, such as comparing multiple treatment groups with a control group. Statistical analyses were performed with the SigmaStat Statistical Analysis System (version 2.03; Systat Software, Inc., San Jose, CA). The enzyme-inducing effects of milnacipran and the prototypical inducers were compared in terms of relative effectiveness, which was calculated as follows:
The positive controls for CYP1A2 and CYP2B6 induction were omeprazole and phenobarbital, respectively. For all other P450 enzymes the positive control was rifampin.
Results
In Vitro P450 Inhibition.
Milnacipran and duloxetine (0.1–100 μM) were evaluated for their abilities to inhibit P450 activity in pooled human liver microsomes with P450-selective substrates at concentrations approximately equal to the Km. In the case of CYP3A4/5, two substrates were used (testosterone and midazolam), as recommended by the FDA (http://www.fda.gov/downloads/Drugs/GuidanceComplianceRegulatoryInformation/Guidances/ucm072101). Before measuring P450 activity, the test articles were preincubated with NADPH-fortified human liver microsomes for 0 or 30 min to assess the potential for time-dependent inhibition. The results are summarized in Figs. 2 and 3 and Table 2.

Effects of milnacipran and duloxetine on selected P450 activities with and without a 30-min preincubation with NADPH-fortified human liver microsomes. For each P450 enzyme assayed, the substrate concentration was approximately equal to the Km (see Table 1 for details).

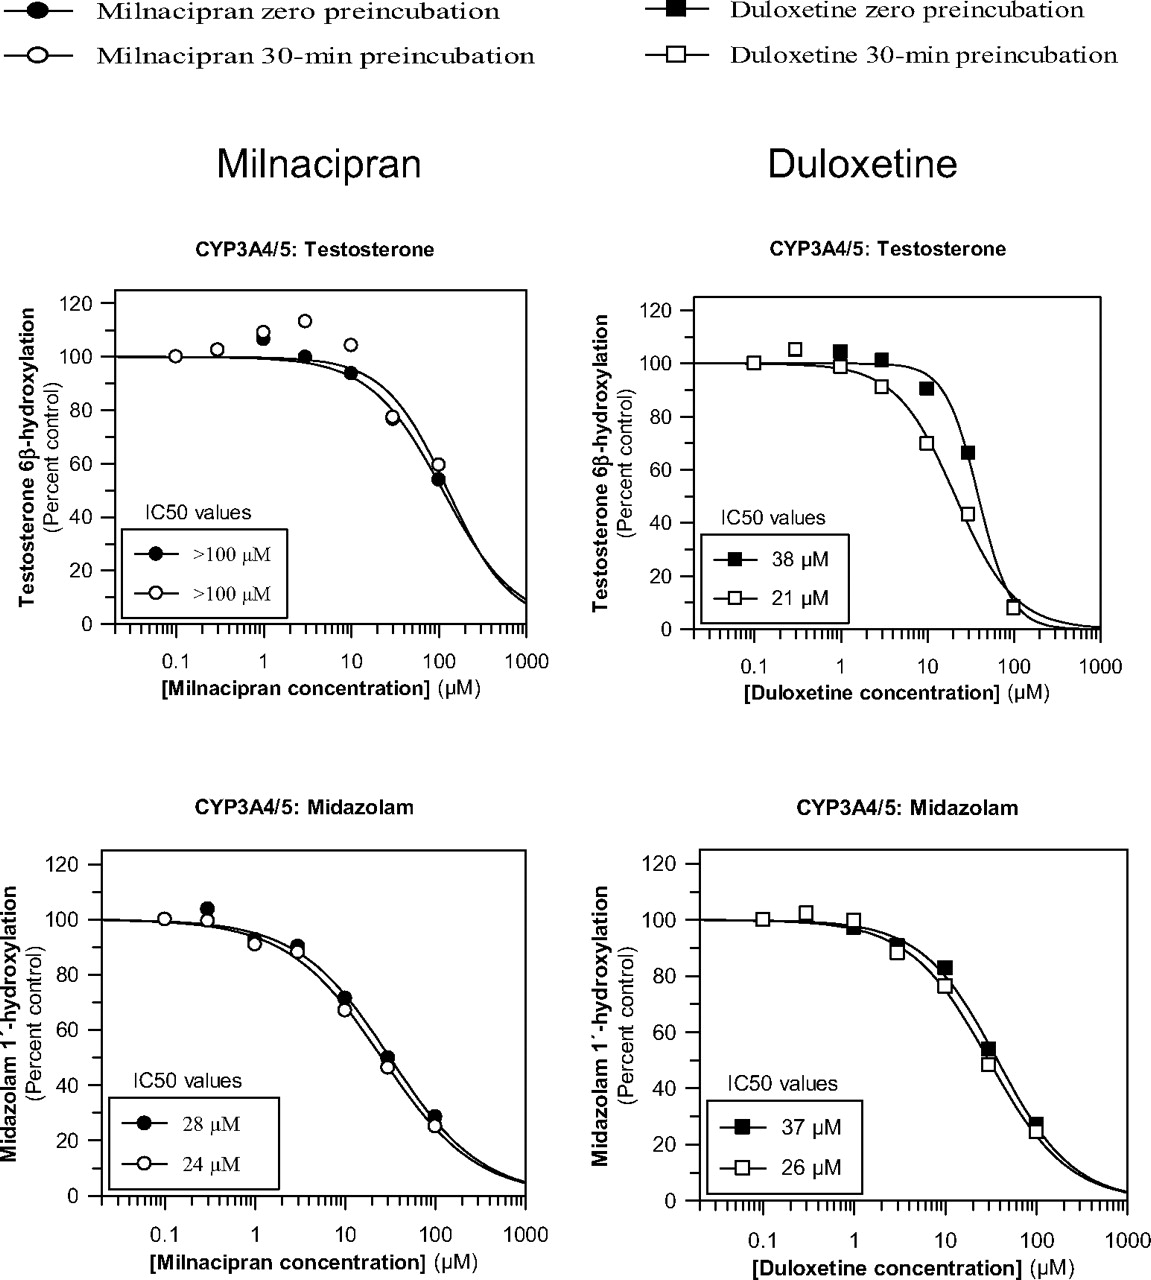
Effects of milnacipran and duloxetine on CYP3A4/5 activity toward testosterone and midazolam with and without a 30-min preincubation with NADPH-fortified human liver microsomes. The concentration of testosterone and midazolam was approximately equal to the Km (see Table 1 for details).
Comparison of milnacipran and duloxetine as inhibitors of selected P450 enzymes with and without a 30-min preincubation with NADPH-fortified human liver microsomes
Milnacipran did not inhibit CYP1A2, 2B6, 2C8, 2C9, 2C19, or 2D6 (IC50 ≥ 100 μM), as shown in Fig. 2. Duloxetine inhibited some of these enzymes more potently than milnacipran, inhibiting CYP2D6 with an IC50 of 7 μM and CYP2B6 with an IC50 of 15 μM. As shown in Fig. 2, preincubation of milnacipran with NADPH-fortified human liver microsomes did not increase its inhibitory effect on CYP1A2, 2B6, 2C8, 2C9, 2C19, or 2D6. In contrast, duloxetine produced time-dependent inhibition of CYP1A2, 2B6, and 2C19 as indicated by the leftward shift in IC50 curves after the 30-min preincubation period. The 30-min preincubation period slightly decreased the inhibitory effect of duloxetine on CYP2D6 (Fig. 2).
As shown in Fig. 3, milnacipran inhibited CYP3A4/5 in a substrate-dependent manner inasmuch as it inhibited midazolam 1′-hydroxylation (IC50 = 28 μM) more potently than it inhibited testosterone 6β-hydroxylation (IC50 = ∼100 μM). Inhibition of midazolam 1′-hydroxylation was also evaluated with a wider range of milnacipran concentrations (up to 500 μM), which indicated an IC50 value of 31 μM, thereby confirming the original estimate of 28 μM (data not shown). Duloxetine also directly inhibited CYP3A4/5, with IC50 values of 37 and 38 μM for the 1′-hydroxylation of midazolam and the 6β-hydroxylation of testosterone, respectively, suggesting that the inhibition is not dependent on substrate. Milnacipran did not produce time-dependent inhibition (<10%) of CYP3A4/5 activity, whereas duloxetine did produce time-dependent inhibition of CYP3A4/5 activity toward testosterone and midazolam (although the time-dependent inhibition toward midazolam was to a lesser extent) (Fig. 3).
In Vitro P450 Induction.
To evaluate the enzyme-inducing potential of milnacipran, three preparations of freshly isolated human hepatocytes were cultured and treated once daily for 3 consecutive days with milnacipran (3, 10, or 30 μM) or one of three prototypical enzyme inducers, namely, omeprazole (100 μM), phenobarbital (750 μM), and rifampin (10 μM). Microsomes were prepared 24 h after the final treatment and assayed for CYP1A2, 2B6, 2C8, 2C9, 2C19, and 3A4/5 activity. Under the conditions examined, milnacipran caused no cell toxicity based on light microscopic evaluation. Throughout the treatment period, the cultured hepatocytes were free of detectable autophagic and lipid vesicles, were cuboidal in shape, and contained intact cell membranes and granular cytoplasm with one or two centrally located nuclei.
As shown in Table 3 and Fig. 4, all three preparations of human hepatocytes responded as expected to treatment with prototypical P450 inducers. Treatment with omeprazole produced a marked increase in CYP1A2 (∼37-fold), whereas treatment with phenobarbital or rifampin produced an increase in CYP2B6 (6–10-fold), CYP2C8 (4–5-fold), CYP2C9 (∼2-fold), CYP2C19 (3–6-fold), and CYP3A4 (∼4-fold).
Effects of treating cultured human hepatocytes with DMSO, milnacipran, or prototypical inducers on microsomal P450 activity

Effects of treating cultured human hepatocytes with milnacipran or prototypical inducers on microsomal P450 activity. Three preparations of human hepatocytes were treated once daily for 3 consecutive days with milnacipran or one of three prototypical enzyme inducers. Microsomes were prepared 24 h after the last treatment and assayed for P450 activity as described under Materials and Methods. Values are presented as -fold increase over negative control (microsomes from DMSO-treated hepatoctyes) based on the absolute values shown in Table 3. ∗, significantly different from vehicle control (DMSO) (p < 0.05) when the positive control groups were excluded from the statistical analysis; †, statistical significance found among treatment groups according to Kruskal-Wallis one-way analysis of variance on ranks and Dunnett's method (p < 0.05) when the positive control groups (omeprazole, phenobarbital, and rifampin) were included in the statistical analysis; ††, significantly different from the vehicle control (DMSO) according to Dunnett's method (p < 0.05) when the positive control groups (omeprazole, phenobarbital, and rifampin) were included in the statistical analysis.
Treatment of human hepatocytes with up to 30 μM milnacipran for 3 consecutive days had little or no effect on CYP1A2, CYP2C8, CYP2C9, or CYP2C19 activity (Table 3; Fig. 4). Milnacipran produced a concentration-dependent increase in CYP2B6 activity with the highest concentration tested (30 μM), effecting a statistically significant increase (2.59-fold; p < 0.05) in CYP2B6 activity. At concentrations of 1, 10, and 30 μM, milnacipran was ∼1, 12, and 26% as effective as phenobarbital as a CYP2B6 inducer (Fig. 5 ). In one of the three preparations of hepatocytes treated with the highest concentration of milnacipran (30 μM), which is almost 1 order of magnitude greater than the highest plasma Cmaxss value observed clinically (3.1 μM) (Forest Research Institute, personal communication), the relative effectiveness for CYP2B6 induction exceeded the FDA's cutoff value of 40% (measured value was 51.9%; individual data not shown).
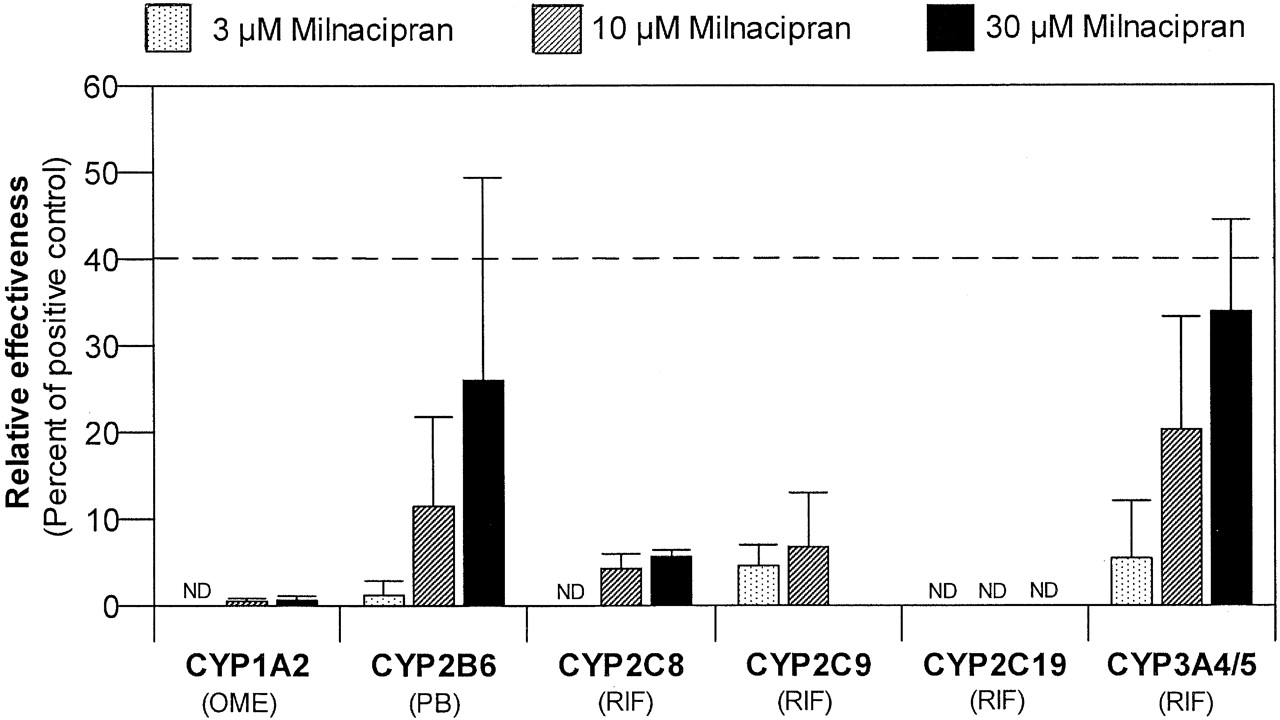
Comparison of the effectiveness of milnacipran as an enzyme inducer in human hepatocytes relative to prototypical inducers. Percent relative effectiveness was calculated as described under Materials and Methods, based on the P450 activities in Table 3. For CYP1A2 and CYP2B6, the positive control was omeprazole and phenobarbital, respectively. For all other P450 enzymes, the positive control was rifampin. ND, not detected; OME, omeprazole; PB, phenobarbital; RIF, rifampin.
Milnacipran produced a concentration-dependent increase in CYP3A4/5 activity (Table 3; Fig. 4). The highest concentration of milnacipran (30 μM) produced a 2.15-fold increase in CYP3A4/5 activity, which was not statistically significant. At concentrations of 1, 10, and 30 μM, milnacipran was ∼6, 20, and 34% as effective as rifampin as a CYP3A4/5 inducer (Fig. 5). In one of the three preparations of hepatocytes treated with the highest concentration of milnacipran (30 μM), which is almost 1 order of magnitude greater than the highest plasma Cmaxss value observed clinically (3.1 μM), the relative effectiveness for CYP3A4 induction exceeded the FDA's cutoff value of 40% (the measured value was 42.4%; individual data not shown).
Discussion
The FDA provides the following guidance to design and interpret in vitro studies to evaluate the victim and perpetrator potential of a new drug: 1) identify the role of CYP1A2, 2B6, 2C8, 2C9, 2C19, 2D6, and 3A4 in the metabolism of the drug and further clarify its victim potential by identifying any other pathways that contribute 25% or more to the drug's clearance; 2) evaluate the potential for direct inhibition of P450 enzymes based on the ratio of [I], the plasma Cmaxss of total (bound and free) drug, and the inhibition constant Ki, with a cutoff value of [I]/Ki = 0.1, below which it is reasonable to assume that a drug will not cause clinically significant P450 inhibition; 3) evaluate the potential for time-dependent inhibition of P450 enzymes and conduct clinical studies to assess the in vivo significance of positive in vitro findings; and 4) evaluate the potential for enzyme induction in three preparations of human hepatocytes and conduct clinical enzyme induction studies when, at pharmacologically relevant concentrations, a drug is 40% or more as effective as a suitable positive control (http://www.fda.gov/downloads/Drugs/GuidanceComplianceRegulatoryInformation/Guidances/ucm072101; Huang et al., 2008).
Previous studies have established that milnacipran has low victim potential with respect to metabolism by cytochrome P450. More than half (50–60%) of the drug is eliminated unchanged in urine, 20% is conjugated to a carbamoyl-glucuronide, and 8% is metabolized by cytochrome P450 (Delini-Stula, 2000; Tsuruta et al., 2000; Puozzo et al., 2005; Forest Research Institute, personal communication). The latter is most likely catalyzed by CYP3A4, which converts milnacipran to one hydroxylated and two N-dealkylated metabolites (Puozzo and Leonard, 1996; Tsuruta et al., 2000). N-Desethyl-milnacipran is the major circulating oxidative metabolite of milnacipran, accounting for approximately 10% of the dose excreted in urine (Puozzo et al., 2005). In contrast, the SNRI duloxetine has high victim potential with respect to metabolism by cytochrome P450. Duloxetine is extensively metabolized by CYP1A2 and CYP2D6, and clinical studies with [14C]duloxetine have shown that the parent drug accounts for only 3% of systemic exposure (plasma AUC) to [14C]duloxetine-derived radioactivity (http://www.accessdata.fda.gov/drugsatfda_docs/nda/2004/021427_s000_Cymbalta.cfm and http://www.accessdata.fda.gov/drugsatfda_docs/label/2009/021427s021s027s028lbl.pdf). Inhibition of CYP1A2 by fluvoxamine results in a 5- to 6-fold increase in duloxetine AUC in CYP2D6 PM subjects, whereas inhibition of CYP2D6 by paroxetine increases plasma AUC by 60% in EMs (Cymbalta package insert, http://www.accessdata.fda.gov/drugsatfda_docs/label/2009/021427s021s027s028lbl.pdf). Cigarette smoking, which induces CYP1A2, decreases the plasma AUC of duloxetine by approximately one-third (http://www.accessdata.fda.gov/drugsatfda_docs/nda/2004/021427_s000_Cymbalta.cfm and http://www.accessdata.fda.gov/drugsatfda_docs/label/2009/021427s021s027s028lbl.pdf). In contrast to the situation with duloxetine and several other antidepressants (Bertilsson et al., 2002; Preskorn et al., 2007), genetic polymorphisms in CYP2D6 and CYP2C19 have no impact on the PK of milnacipran (Puozzo et al., 2005) nor does inhibition of CYP2D6 and CYP3A4 by fluoxetine (DeVane et al., 2004; Puozzo et al., 2006). Enzyme induction by carbamazepine is associated with a small decrease (20%) in milnacipran plasma steady-state concentrations (Puozzo et al., 2002).
The present in vitro study was designed to evaluate the perpetrator potential of milnacipran. At the pharmacologically relevant concentration of 3 μM and even at 10 μM milnacipran, which is 4 to 5 times the mean steady-state plasma Cmaxss of 2.2 μM, milnacipran produced no significant induction of CYP1A2, 2B6, 2C8, 2C9, 2C19, or CYP3A4 in cultured human hepatocytes under conditions in which the positive controls exerted their anticipated inductive effects. At 30 μM (∼14 times Cmaxss), milnacipran was 26% as effective as phenobarbital at inducing CYP2B6 and was 34% as effective as rifampin at inducing CYP3A4. These in vitro results indicate that, at pharmacologically relevant concentrations, milnacipran is not 40% or more as effective as phenobarbital or rifampin at inducing P450 enzymes, which, based on the relevant 2006 FDA Guidance for Industry (http://www.fda.gov/downloads/Drugs/GuidanceComplianceRegulatoryInformation/Guidances/ucm072101) suggests that milnacipran will not produce clinically significant enzyme induction.
The potential for milnacipran to inhibit P450 enzymes in human liver microsomes was compared with that of duloxetine. The only P450 enzyme potentially inhibited by milnacipran was CYP3A4, the enzyme implicated in its N-dealkylation and hydroxylation, which are minor pathways of milnacipran clearance (Tsuruta et al., 2000). Milnacipran inhibited the 1′-hydroxylation of midazolam with an IC50 of approximately 30 μM. The concentration of midazolam was 4 μM, which is approximately equal to its Km; hence, the Ki value would be ∼15 or ∼30 μM depending on whether the inhibition of CYP3A4 by milnacipran was competitive or noncompetitive, respectively (Ogilvie et al., 2008). After a dosage of 100 mg b.i.d., the mean Cmax at steady state is 2.2 μM, and ranges from 1.3 to 3.1 μM (Forest Research Institute, personal communication). Based on a conservative estimate of Ki (∼15 μM) and the mean Cmaxss of 2.2 μM, the value of [I]/Ki for CYP3A4 inhibition by milnacipran is ∼0.15, which slightly exceeds the FDA's cutoff of 0.1. When testosterone was used to measure CYP3A4 activity, the Ki for milnacipran was conservatively estimated to be 51 μM (based on an IC50 of ∼102 μM). Accordingly, [I]/Ki is 0.043 (based on the mean Cmaxss of 2.2 μM), which falls below the FDA's cutoff value of 0.1.
Milnacipran has been reported to have no effect on the urinary excretion of 6β-hydroxycortisol or the PK of carbamazepine, which, despite being an imperfect marker of CYP3A4 activity, provides some evidence that milnacipran does not cause clinically significant inhibition of CYP3A4 (Table 4) (Puozzo et al., 2005). For all other P450 enzymes, estimates of [I]/Ki are less than 0.1, and there was no evidence of metabolism-dependent inhibition. Based on this cutoff, the lack of time-dependent inhibition, and the rank order approach to extrapolating in vitro findings to the in vivo situation (Obach et al., 2005, 2006), milnacipran would not be expected to cause clinically significant inhibition of CYP1A2, 2B6, 2C8, 2C9, 2C19, or 2D6. In clinical drug-drug interaction studies, (summarized in Table 4), milnacipran has been shown to cause no inhibition (or induction) of CYP1A2 (with caffeine as the in vivo probe substrate), CYP2C19 (racemic mephenytoin), and CYP2D6 (sparteine) (Puozzo et al., 2005). Overall, there is good correspondence between the in vitro results and the available in vivo clinical findings.
Summary of clinical drug-drug interactions studies to evaluate the effect of milnacipran on the disposition of coadministered drugs
Compared with milnacipran, duloxetine was a more potent inhibitor of all of the P450 enzymes examined and showed evidence of time-dependent inhibition of CYP1A2, 2B6, 2C19, and 3A4/5 (Figs. 2 and 3). This study did not establish the effects of NADPH or whether the metabolism-dependent inhibition of P450 enzymes by duloxetine was due to the formation of metabolites that are more potent reversible inhibitors or are irreversible inhibitors of CYP1A2, 2B6, 2C19, and 3A4. Based on experiments with recombinant human P450 enzymes, Lobo et al. (2008) reported that the hydroxylation of the naphthyl ring of duloxetine is catalyzed by CYP1A2 (in the 4-, 5-, and 6-positions) and by CYP2D6 (in the 4- and 5-positions). These hydroxylated metabolites (as well as dihydroxylated metabolites and conjugates) are major duloxetine metabolites in human plasma and urine, whereas N-demethylated and O-dealkylated metabolites are minor in vivo metabolites (Lantz et al., 2003). N-Demethylation of duloxetine would be expected to produce a more potent direct-acting P450 inhibitor than the parent drug, whereas dihydroxylation of duloxetine to a catechol metabolite on the naphthyl ring may potentially lead to irreversible inhibition of one or more P450 enzymes. In this regard, it is interesting that CYP1A2 (which showed evidence of time-dependent inhibition) catalyzes the 5- and 6-hydroxylation of duloxetine. Consequently, hydroxylation at both these sites (which appear on the same ring and are adjacent to each other) would lead to catechol formation. In contrast, CYP2D6 (which showed no evidence of time-dependent inhibition) catalyzes the 4- and 5-hydroxylation of duloxetine. Hydroxylation at both these sites would not produce a catechol because these two sites are not adjacent to each other but appear on different rings of the naphthyl moiety (Lantz et al., 2003; Lobo et al., 2008). Duloxetine also contains a thiophene ring. Although metabolites involving thiophene oxidation have not been reported for duloxetine, this particular functional group is associated with several cases of irreversible P450 inhibition, as in the case of tienilic acid, ticlopidine, and clopidogrel (Fontana et al., 2005; Ogilvie et al., 2008; Parkinson and Ogilvie, 2008).
Duloxetine inhibited both of the enzymes implicated in its metabolism, namely CYP1A2 and CYP2D6. Duloxetine inhibited CYP1A2 with an IC50 of 50 μM without any preincubation and an IC50 of 18 μM with a 30-min preincubation. Lobo et al. (2008) also evaluated duloxetine as a direct-acting inhibitor of CYP1A2 and reported that duloxetine causes competitive inhibition of CYP1A2 with a Ki value of 18 μM. When incubated with marker substrate at a concentration equal to the Km, the Ki value for a competitive inhibitor is half its IC50 value; hence, the Ki of 18 μM reported by Lobo et al. (2008) translates to an IC50 value of 36 μM, which is comparable to our value of 50 μM (determined without a preincubation period) and 18 μM (determined with a preincubation period). Lobo et al. (2008) do not specifically report having evaluated duloxetine as a time-dependent inhibitor of CYP1A2. Clinical interaction studies with theophylline, a CYP1A2 substrate, established that duloxetine is a weak inhibitor of CYP1A2 in vivo; it increased the plasma AUC of theophylline by 7% (1–15%) in one study and 20% (13–27%) in another (Table 5). With no preincubation, the enzyme most potently inhibited by duloxetine was CYP2D6 (IC50 = 7 μM). With a preincubation, the enzyme most potently inhibited by duloxetine was CYP2B6 (IC50 = ∼5 μM). Duloxetine produces clinically significant inhibition of CYP2D6 based on its ability to cause up to a 3-fold increase in the plasma AUC of desipramine, a sensitive CYP2D6 in vivo probe drug (Table 5). The enzyme most potently inhibited by duloxetine in vitro was CYP2D6, and the most pronounced clinical drug-drug interaction reported for duloxetine is its interaction with desipramine, a drug whose clearance is largely dependent (80–90%) on metabolism by CYP2D6. However, the inhibition of CYP2D6 observed in vivo would not be predicted from the in vitro inhibition data based on [I]/Ki. The average maximum plasma concentrations of duloxetine at steady state (Cmaxss) is 20.7 ng/ml or ∼0.07 μM (Skinner et al., 2003), and a conservative estimate of Ki for the inhibition of CYP2D6 by duloxetine is 3.5 μM (assuming the inhibition is competitive, such that Ki is half the IC50 value). Accordingly, the [I]/Ki value for the direct inhibition of CYP2D6 by duloxetine (0.02) is well below the FDA's cutoff of 0.1. It is not clear why the extrapolation of the in vitro data to the in vivo situation based on the [I]/Ki value underestimates the clinical inhibition of CYP2D6 by duloxetine. Duloxetine undergoes rapid and extensive first-pass metabolism in the liver and gut, for which reason parent drug accounts for only 3 or 9% of drug-related material in plasma based on the AUC and Cmax, respectively (Lantz et al., 2003). Accordingly, hepatic levels of duloxetine may be considerably greater than those in plasma; hence, the underestimation may be the result of basing the [I]/Ki value on too low a value of [I].
Summary of clinical drug-drug interaction studies to evaluate the effect of duloxetine on the disposition of coadministered drugs
Duloxetine produced metabolism-dependent inhibition of CYP2B6 and CYP2C19 in vitro; however, the effect of duloxetine on the in vivo disposition of probe drugs for these enzymes has not been investigated. Duloxetine did not produce direct or time-dependent inhibition of CYP2C9; however, in a single case report, duloxetine was found to be the likely cause of an increased INR (a measure of prothrombin time) in a patient who had been taking a stable dose of warfarin for 1 year before starting duloxetine (Glueck et al., 2006). Milnacipran did not inhibit CYP2C9 in vitro and did not alter the pharmacokinetics of S-warfarin (Forest Research Institute, personal communication). Furthermore, milnacipran did not affect the pharmacodynamics of warfarin as indicated by the INR (Forest Research Institute, personal communication). At steady state, the plasma Cmax of duloxetine ranges from 15 to 35 ng/ml (approximately 0.05–0.1 μM). Based on a conservative estimate of 3.5 μM for the Ki value for inhibition of CYP2D6 (i.e., half the IC50 value with [S] = Km) and a Cmaxss value of 0.1 μM, the [I]/Ki value is well below the FDA cutoff of 0.1, and yet duloxetine causes clinically significant inhibition of CYP2D6. Duloxetine is metabolized so extensively that parent drug accounts for only 3% of systemic exposure to [14C]duloxetine-derived radioactivity. Although metabolites of duloxetine may account for the greater degree of CYP2D6 inhibition observed in vivo compared with that predicted from in vitro studies, it is interesting that CYP2D6 was not among the enzymes that duloxetine inhibited in a metabolism-dependent manner.
In summary, the results of this in vitro study established that duloxetine inhibits CYP2D6 and other P450 enzymes and has been shown to cause clinically significant inhibition of CYP2D6. In contrast, the only human P450 enzyme inhibited by milnacipran is CYP3A4, which milnacipran inhibited weakly and in a substrate-dependent manner (midazolam, but not testosterone). Milnacipran would not be expected to produce clinically significant inhibition of P450 enzymes, which is consistent with clinical data demonstrating a lack of interaction between milnacipran and drugs metabolized by CYP1A2, 2C9, 2C19, 2D6, or 3A4. In addition, the results of the present study suggest that milnacipran will not produce clinically significant induction of P450 enzymes.
Acknowledgments.
The views expressed herein are those of the publishing authors alone.
Footnotes
-
This study was sponsored by Forest Research Institute, Jersey City, NJ.
-
Article, publication date, and citation information can be found at http://dmd.aspetjournals.org.
- Received May 12, 2009.
- Accepted July 9, 2009.
- Copyright © 2009 by The American Society for Pharmacology and Experimental Therapeutics
References
- Bertilsson et al., 2002.↵
- Bjornsson et al., 2003.↵
- Caccia 1998.↵
- DeVane et al., 2004.↵
- Delini-Stula 2000.↵
- Dubner and Hargreaves 1989.↵
- Fontana et al., 2005.↵
- Grzesiak et al., 2000.↵
- Glueck et al., 2006.↵
- Hua et al., 2004.↵
- Huang et al., 2008.↵
- Lantz et al., 2003.↵
- Lobo et al., 2008.↵
- Madan et al., 2003.↵
- Obach et al., 2006.↵
- Obach et al., 2005.↵
- Ogilvie et al., 2006.↵
- Ogilvie et al., 2008.↵
- Parkinson and Ogilvie 2008.↵
- Patroneva et al., 2008.↵
- Preskorn et al., 2007.↵
- Puozzo et al., 2006.↵
- Puozzo et al., 2005.↵
- Puozzo and Leonard 1996.↵
- Puozzo et al., 2002.↵
- Robertson et al., 2000.↵
- Sawada and Ohtani 2001.↵
- Skinner et al., 2003.↵
- Tsuruta et al., 2000.↵
- Tucker et al., 2001.↵
- Vaishnavi et al., 2004.↵


