


Abstract
Proper characterization of animal models used for efficacy and safety assessment is crucial. The present study focuses on characterizing proteins that are important components of the absorption, distribution, metabolism, and elimination of xenobiotics. Hepatic gene expression of Cyp2b10, Cyp2c29, Cyp3a11, Cyp2e1, Cyp4a10, Nr1i2, Nr1i3, slco1a1, slco1a4, slco1b2, abcb1b, abcc2, and abcg2 was examined using the real-time polymerase chain reaction method in male db/db mice, a commonly used type II diabetes model. We evaluated age and disease effects on gene expression and enzymatic activity in 10- and 25-week-old db/db and 25-week-old C57BLKS/J (strain-matched lean control) mice. Functional analysis was conducted in hepatic microsomes for Cyp2b, Cyp2c, and Cyp3a using cytochrome P450-specific substrates. There were no significant age- or disease-dependent changes in the expression of Cyp3a11 and Cyp3a activity in the db/db mice. The mRNA levels and the activities of Cyp2b10 and Cyp2c29 in the 25-week-old db/db mice decreased significantly compared with those of the 10-week-old db/db mice. There was a significant age-dependent increase in Cyp4a10 expression noted. The most marked expression change in db/db mice versus a control was the ∼400-fold reduction of mRNA expression of slco1a1. Slco1a4 and sloc1b2 showed increased expression compared with that in an age-matched control, whereas abcb1b showed decreased expression. No expression changes were observed for Cyp2e1, Nr1i2, Nr1i3, abcc2, and abcg2. Our data demonstrate that significant expression and activity differences exist between the db/db and the lean control mice, which are probably age- and disease-dependent.
Introduction
Obesity and type II diabetes have become serious health risks in developed countries. In recent years, the marked increase in the incidence of type II diabetes is driving the need for new and improved therapy. Before being tested in humans, new chemical entities are usually evaluated for efficacy and safety in animals that mimic the human condition. The db/db mouse is a routinely used animal model characterized by a metabolic disturbance closely resembling type II diabetes mellitus. The homozygous mutation leads to loss of the leptin receptor in the deficient mice. The homozygous animals are fat, hyperglycemic, and sterile, whereas the heterozygous animals cannot be distinguished from normal animals visually (Castracane and Henson, 2007). The present study focuses on characterizing proteins that are important components of the absorption, distribution, metabolism, and elimination of xenobiotics.
Changes in physiological and pathophysiological conditions including diabetes can affect drug metabolism and disposition. The liver is a major site of metabolism for many endogenous molecules and xenobiotics. Cytochrome P450 (P450) enzymes are well studied hemoproteins that mediate the oxidation and reduction of many endogenous and exogenous molecules. Therefore, expression or functional changes in these hepatic enzymes associated with diabetes could alter drug efficacy and safety. Because CYP2B, CYP2C, and CYP3A are the major enzymes involved in drug metabolism in humans, we investigated gene expression of mouse Cyp2b10, Cyp2c29, and Cyp3a11 using the real-time PCR method. To confirm that gene expression changes had a functional correlation, the enzyme activity was assessed for Cyp2b, Cyp2c, and Cyp3a using P450-specific substrates in microsomes isolated from db/db and control mice. Cyp2e1 and Cyp4a10 were also monitored because it was expected that the disease state would alter the expression of these genes. Hepatobiliary transporters play an important role in drug disposition. The uptake transporters are members of the solute carrier (slco) family and are localized on the sinusoidal domain of the hepatocytes. The efflux transporters are members of the ATP-binding cassette (abc) superfamily and are localized on both sinusoidal and canalicular domains of the hepatocytes. The xenobiotic uptake and/or efflux transporters may facilitate or limit access of molecules to the metabolizing enzymes; therefore, changes in the expression of these transporters can lead to altered metabolism. Nuclear receptor 1i2, also known as pregnane X receptor (PXR), and nuclear receptor 1i3, also known as constitutive androstane receptor (CAR), transcriptionally activate genes encoding several P540s and transporters. A change in regulation of the nuclear receptors can affect their downstream gene expression. The expression of PXR and CAR, as well as that of hepatic transporters slco1a1, slco1a4, slco1b2, abcb1b, abcc2, and abcg2 was measured.
In a recent study, the expression of P450s and transporters, which also mimic the type II diabetic condition, have been characterized in ob/ob mice (Cheng et al., 2008). The activities of P450s in the ob/ob model have been well documented (Barnett et al., 1992; Watson et al., 1999). Yoshinari et al. (2006) demonstrated the expression changes of P450s and nuclear receptors in 10-week-old db/db mice; however, neither the expression of hepatic transporters nor P450 activities were assessed. It is known that the homozygous db mutation produces progressive obesity, insulin resistance, and a hyperglycemia phenotype. At approximately 10 weeks of age, db/db mice exhibit 6 to 10 times the normal plasma insulin level followed by a sharp decline to near normal levels. During this insulin surge, hyperplasia and hypertrophy occur in pancreatic β cells. The drop of insulin level coincides with islet atrophy and rising blood glucose to greater than 400 mg/dl (Castracane and Henson, 2007). Diabetes complications such as retinopathy and nephropathy are an active area of drug research and development. These complications often occur in later disease stages and in older diabetic animals (Koya et al., 2000). Therefore, in addition to studying 10-week-old db/db mice, it is important to examine gene expression in older animals to evaluate effects of aging and disease progression on gene expression. We used a single age-matched lean 25-week-old control group because our primary goals were 1) to compare the gene expression and the enzymatic activity in 25-week-old db/db mice versus the control and 2) to assess age and disease state effects on the expression and the activity by comparing the 10-week-old with the 25-week-old db/db mice. In this study, for the first time, we fully characterized changes in the expression and in some cases the function of a diverse set of genes involved in drug metabolism, transport, and regulation in a commonly used diabetic db/db mouse model.
Materials and Methods
Materials.
Midazolam, 4-OH-midazolam, S-mephenytoin, and 1-OH-mephenytoin were synthesized at Pfizer Global Research and Development (La Jolla, CA). High-performance liquid chromatography-grade pentoxyresorufin, resorufin, buspirone, NADPH, potassium phosphate, magnesium chloride, formic acid, and acetonitrile were purchased from Sigma-Aldrich (St. Louis, MO).
Animals.
Male db/db (a/a + Leprdb/ + Leprdb) mice and male control C57BLKS/J mice were purchased from The Jackson Laboratory (Bar Harbor, ME). Because the db/db mice were derived from the C57BLKS/J strain, wild-type C57BLKS/J mice were chosen as the control. The animals were housed under a constant 12-h dark/light cycle and were given standard chow and water ad libitum. The db/db mice were sacrificed using the isoflurane inhalation method at 10 and 25 weeks of age, and the controls were sacrificed at 25 weeks of age (n = 5 in each group). Blood was collected from the inferior vena cava, and the liver was perfused with ice-cold sterile saline via the portal vein. Whole livers were excised, snap-frozen in liquid nitrogen, and stored at −80°C for future analysis. All animal experiments were approved by the institutional animal care and use committee.
RNA Extraction and cDNA Synthesis.
After homogenizing a section of a liver with an Ultra-Turrax T9 homogenizer (IKA Works, Inc., Wilmington, NC), total RNA was isolated using TRIzol reagent (Invitrogen, Carlsbad, CA) according to the manufacturer's instructions. Purified RNA was treated with DNase (DNA-free kit; Ambion, Huntington, UK) to digest genomic DNA. The quality of RNA was visually inspected by conventional agarose gel electrophoresis, and the concentration was measured with a NanoDrop spectrophotometer (Thermo Fisher Scientific, Waltham, MA). The RNA with excellent integrity was reverse-transcribed into cDNA using a High Capacity cDNA Reverse Transcription Kit (Applied Biosystems, Foster City, CA) according to the manufacturer's protocol.
Real-Time Quantitative PCR and Relative Expression Analysis.
Real-time PCR was performed in a 96-well format using the iCycler iQ system (Bio-Rad Laboratories, Hercules, CA). All probes were purchased from Applied Biosystems. Table 1 lists the genes assayed and each corresponding assay identification number from Applied Biosystems and accession number. Each 20 μl PCR contained cDNA equivalent to 25 ng of total RNA, TaqMan Universal PCR Master Mix, and a TaqMan Gene Expression Assay containing specific primers and probes. The PCR was run at 50°C for 2 min and 95°C for 10 min, followed by 40 cycles of 95°C for 15 s and 60°C for 1 min. The real-time PCR assay for each sample was performed in triplicate. The threshold and baseline settings were used according to the manufacturer's instructions.
Accession number and the Applied Biosystem assay identification number of each gene tested
Gene expression was quantified using the relative standard curve method. The standard curve was generated by mixing the cDNA from different groups of samples and by serially diluting at a 1:4 ratio. A six-point standard curve was made for each gene. The amplification efficiencies were close to 1 for all the genes. Two mouse housekeeping genes, GAPDH and β-actin, were evaluated as potential internal reference genes. GAPDH was excluded because of high variability. Therefore, β-actin was used as the normalization factor for the relative quantification of each gene.
Microsome Preparation.
Mouse liver microsome for each animal (n = 5/group, total 15 microsome preparations) was isolated separately as described previously (Salphati and Benet, 1999). Protein concentrations were determined using the Pierce BCA protein assay kit (Thermo Fisher Scientific) with bovine serum albumin standards. P450 content was determined using the Omura and Sato (1964) method and was measured by a dual-beam spectrophotometer (DW-2000; Olis, Inc., Bogart, GA).
Microsome Incubations.
Michaelis-Menten studies were performed to estimate Vmax and Km by measuring the formation of metabolites. Microsome incubations were performed in triplicate for each mouse liver microsome. To assess the activity of Cyp2b10, Cyp2c29, and Cyp3a11, pentoxyresorufin, S-mephenytoin, and midazolam were used as probe substrates, and the formation of resorufin, 4-OH-mephenytoin, and 4-OH-midazolam, respectively, was monitored. For the incubations with S-mephenytoin and midazolam, each 200 μl reaction contained 0.1 mg/ml microsome, 1 mM NADPH, eight different concentrations of the probe substrate, and 0.1 M potassium phosphate buffer. The dimethyl sulfoxide concentration used to solubilize the substrates was less than 0.1%. The midazolam concentrations tested ranged from 0.6 to 20 μM, whereas the concentration of S-mephenytoin ranged from 3 to 400 μM. After 5 min of preincubation at 37°C, the reaction was initiated by addition of NADPH. After 8 min of incubation, the reaction was stopped by addition of 600 μl of acetonitrile containing the internal standard, buspirone. The samples were centrifuged to precipitate the protein at 3000 rpm for 15 min. The supernatants were stored at −80°C for liquid chromatography-tandem mass spectrometry (LC-MS/MS) analysis. For the incubation of pentoxyresorufin, each 200 μl reaction contained 0.2 mg/ml microsomes, 1 mM NADPH, eight different concentrations (0.4–50 μM) of pentoxyresorufin, and 0.1 M potassium phosphate buffer in a 96-well format. After 5 min of preincubation at 37°C, the reaction was initiated by addition of NADPH and immediately placed in a Tecan (FARCyte, Männedorf, Switzerland) fluorescence microplate reader. The excitation wavelength was set at 544 nm, and the fluorescence was detected at an emission wavelength of 595 nm. Resorufin concentrations were determined by comparing the fluorescence of the samples to the resorufin standards after 10 min of incubation.
LC-MS/MS Methods.
The levels of compounds were quantitatively determined by LC-MS/MS. The LC-MS/MS system consisted of Shimadzu LC-10AD vp pumps (Shimadzu, Kyoto, Japan), a CTC PAL autosampler (Leap Technologies, Carrboro, NC), and a PE Sciex API 4000 mass spectrometer (Applied Biosystems/MDS Sciex, Foster City, CA) equipped with a TurboIonSpray source. An Onyx Monolethic C18, 4.6 × 50-mm, column Phenomenex (Torrance, CA) was used. The analytes were eluted with a mobile phase comprising water with 0.1% formic acid (solvent A) and acetonitrile with 0.1% formic acid (solvent B). Initially, the primary gradient pumps flow rates were 0.2 ml/min (99% A:1% B), and the dilution pump flow rate was 3.0 ml/min (100% A). After the analytes were focused onto the column, the dilution pump was stopped (minimal flow was maintained at 0.01 ml/min flow to prevent back flow), and the primary gradient pumps were ramped to 3.0 ml/min to initiate the gradient: 5 to 20% B from 0.0 to 0.5 min, 20 to 70% B from 0.5 to 1.2 min, 70% B from 1.2 to 1.4 min, and 70 to 5% B from 1.4 to 1.5 min. The mass spectrometer was operated in the positive ionization mode using multiple reaction monitoring at specific precursor ion → product ion transitions: 4-OH-mephenytoin, 235.24 → 150.10; 4-OH- midazolam, 342.00 → 234.40; and internal standard, buspirone, 385.75 → 122.23. The compound concentrations were estimated based on standard curves that were calculated using a weighed linear regression (1/x) of the concentration versus ratio of analyte to internal standard peak areas.
Data Analysis.
Microsomal metabolite formation rates (ν) as a function of substrate concentrations (S) were fitted by nonlinear regression to the Michaelis-Menten equation, ν = (Vmax · S)/(Km + S), using GraphPad Prism software (GraphPad Software Inc., La Jolla, CA) to derive Vmax and Km estimates. Analysis of variance was used to analyze the differences among the three groups followed by Tukey's multiple comparison tests.
Results
Effects of db Mutation on Body Weight, Liver Weight, Blood Glucose Level, and P450 Content.
Body weights, liver weights, and blood glucose levels were monitored to verify the effects of leptin receptor deficiency. The average body weight and glucose levels were comparable with previous literature reports (Barnett et al., 1992; Koya et al., 2000; Yoshinari et al., 2006). As expected, the blood glucose levels were more than 2-fold higher in the 25-week-old db/db mice (774 ± 60 mg/dl, mean ± S.D., p < 0.05) than in the controls (295 ± 39 mg/dl), whereas the blood glucose levels of the 10-week-old db/db mice (733 ± 88 mg/dl) were no different from those of the 25-week-old db/db mice. The body weights of the diabetic mice (10-week-old, 41.2 ± 0.4 g and 25-week-old, 49.2 ± 6.3 g, p < 0.05) were higher than those of the 25-week-old lean control mice (30.7 ± 1.9 g, n = 5). Likewise, compared with the control liver weights (1.11 ± 0.12 g), the liver weights of the 25-week-old db/db mice (2.42 ± 0.18 g, p < 0.05) were markedly higher. The liver weights of the 10-week-old db/db mice (2.14 g ± 0.19) were similar to those of the 25-week-old db/db mice. Liver microsomes were prepared separately for each of the five animals per group. Microsomal protein content in the 25-week-old db/db mice (11.2 ± 0.6 mg/g liver, p < 0.05) was significantly lower than that of the controls (19.6 ± 3.1 mg/g liver) but was not different from that of the 10-week-old db/db mice (10.7 ± 2.7 mg/g liver). The hepatic P450 content of the 25-week-old lean controls (0.381 ± 0.076 nmol/mg microsome) was comparable to that of the 25-week-old db/db mice (0.354 ± 0.113 nmol/mg microsome). Of interest, the P450 content was significantly higher in the 10-week-old db/db mice (0.580 ± 0.118 nmol/mg microsome, p < 0.05) compared with that of the 25-week-old db/db mice. Therefore, the enzymatic functional studies and the calculations were normalized to the P450 content as well as to microsome concentrations.
mRNA Expression of P450s, Nuclear Receptors, and Membrane Transporters in db/db and Control Mice Liver Tissues.
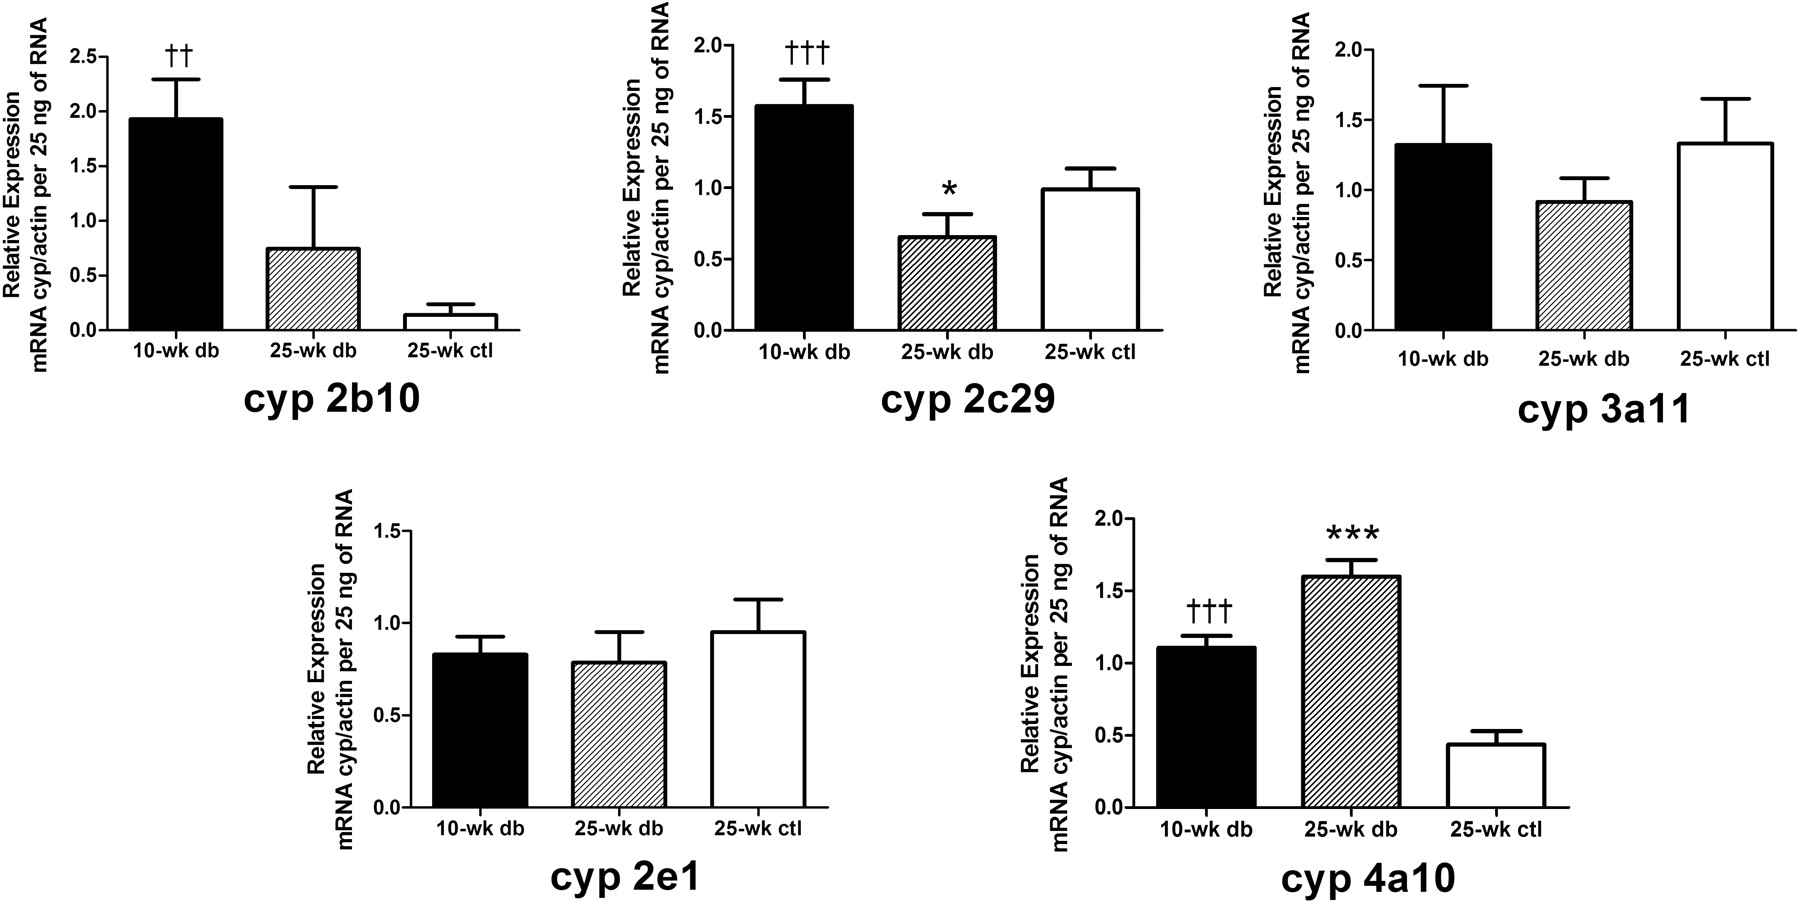
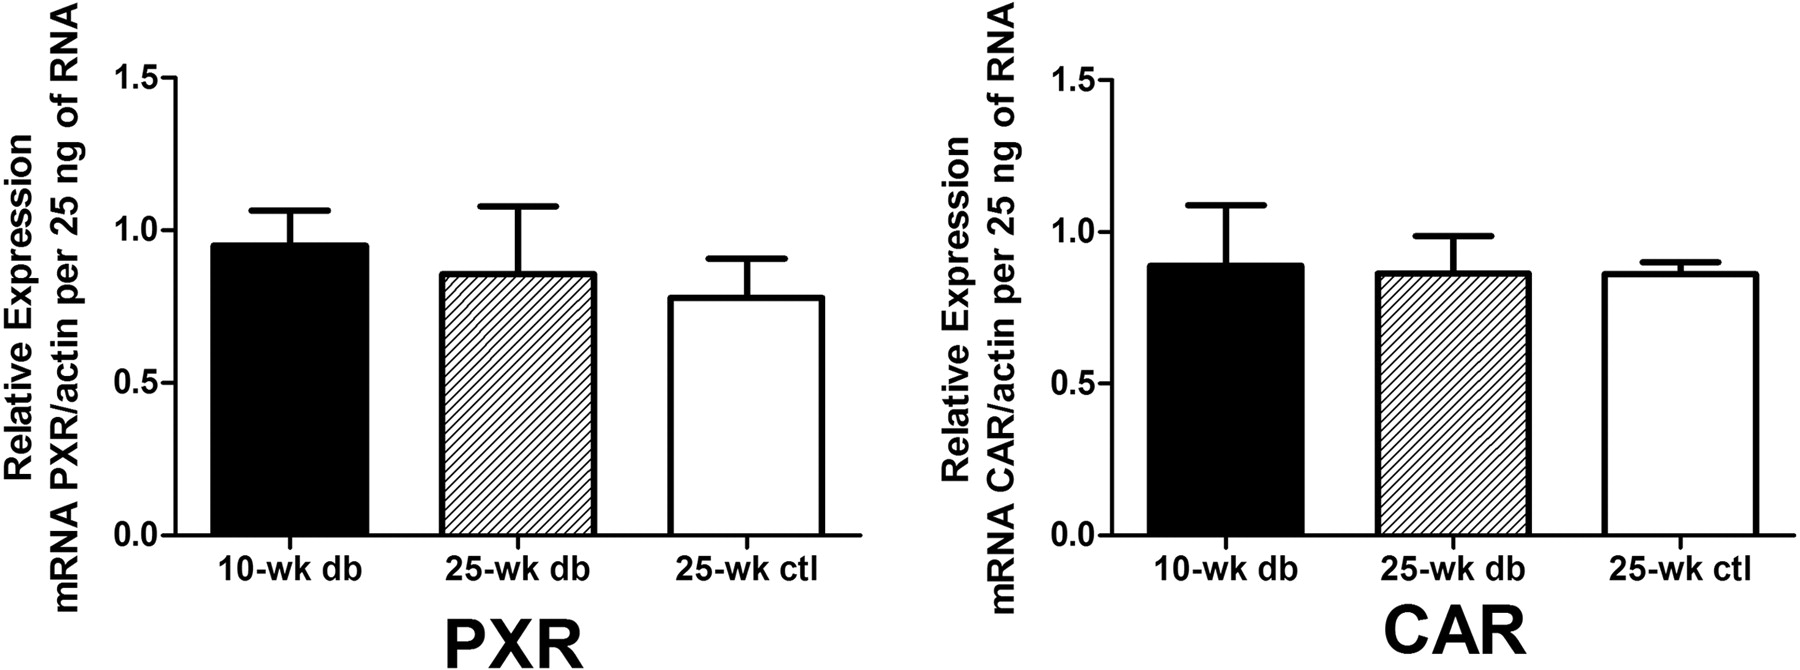
The real-time PCR results for Cyp2b10, Cyp2c29, Cyp2e1, Cyp3a11, and Cyp4a10 are shown in Fig. 1. The expression data were plotted as the ratio of the relative mRNA level of the gene of interest over the relative mRNA level of actin per 25 ng of total RNA. This allowed for a comparison between 10- and 25-week-old db/db mice and the 25-week-old lean control group. For Cyp2b10, the 25-week-old db/db mice (0.744 ± 0.566, p < 0.01) exhibited a substantial decrease in relative expression compared with that of the 10-week-old db/db mice (1.93 ± 0.36). Although there was an approximately 5-fold increase in expression in the 25-week-old db/db mice compared with that in the lean controls (0.139 ± 0.102), no statistical difference was observed. Likewise, the relative mRNA expression of Cyp2c29 in the 25-week-old db/db mice (0.654 ± 0.161) was considerably lower than that of the 10-week-old db/db mice (1.57 ± 0.19, p < 0.001), which was also lower compared with that of the 25-week-old lean controls (0.987 ± 0.146, p < 0.05). There were no significant differences in the expression of Cyp3a11 and Cyp2e1 among the three groups of mice. For Cyp4a10, the increase in the mRNA expression was significant in the 25-week-old db/db mice (1.60 ± 0.11, p < 0.001) relative to that in the controls (0.436 ± 0.093). There was an apparent age-dependent increase in Cyp4a10 expression comparing 10-week-old (1.11 ± 0.08, p < 0.001) and 25-week-old db/db mice. The relative expression of two nuclear receptors was measured (Fig. 2). No significant change in mRNA levels was observed for PXR and CAR in all groups of mice.

Real-time PCR results of five cytochrome P450 enzymes. Relative expression, which is calculated by taking the ratio of mRNA levels of P450 over mRNA levels of actin per 25 ng of total RNA, is shown. Data are depicted as mean ± S.D.; n = 5. *, p < 0.05; ***, p < 0.001, significantly different from that of the 25-week-old controls (ctl). ††, p < 0.01; †††, p < 0.001, significantly different from that of the 25-week-old db/db (db) mice.

Real-time PCR results of two nuclear receptors. Relative expression, which is calculated by taking the ratio of mRNA levels of nuclear receptors over mRNA levels of actin per 25 ng of total RNA, is shown. Data are depicted as mean ± S.D.; n = 5. ctl, control; db, diabetic.
The relative mRNA expression of slco1a1, slco1a4, slco1b2, abcb1, abcc2, and abcg2 was measured in the 25-week-old control lean mice as well as in the 10-week-old and the 25-week-old db/db mice (Fig. 3). Of interest, slco1a1 exhibited a drastic reduction in mRNA expression in the 25-week-old db/db mice (0.00615 ± 0.00618, p < 0.001) relative to the controls (2.75 ± 0.21). The expression level in 10-week-old db/db mice (0.0755 ± 0.0904) was higher, but not significant, compared with that of the 25-week-old db/db mice. The relative mRNA expression of slco1a4 was higher in the 25-week-old db/db mice (1.00 ± 0.05, p < 0.001) than that of the controls (0.527 ± 0.055), but was not significantly different from that of the 10-week-old db/db mice (0.901 ± 0.126). Similar to slco1a4, slco1b2 also showed higher expression in the 25-week-old db/db mice (0.920 ± 0.183, p < 0.05), compared with that in the lean controls (0.689 ± 0.097), but no change was observed compared with that of the 10-week-old db/db mice (0.883 ± 0.116). The mRNA expression of abcb1b in the 25-week-old db/db mice (0.306 ± 0.061, p < 0.001) was significantly reduced compared with that of the controls (0.759 ± 0.062). Abcb1b expression was comparable between the 10-week-old (0.410 ± 0.119) and 25-week-old db/db mice. There were no significant expression changes among the three groups of mice for abcc2 and abcg2.

Real-time PCR results of six membrane transporters. Relative expression, which is calculated by taking the ratio of mRNA levels of transporters over mRNA levels of actin per 25 ng of total RNA, is shown. Data are depicted as mean ± S.D.; n = 5. *, p < 0.05; ***, p < 0.001, significantly different from that of the 25-week-old controls. ctl, control; db, diabetic.
Functional Analysis of Cyp2b, Cyp2c, and Cyp3a in Liver Microsomes.
The activities of Cyp2b, Cyp2c, and Cyp3a were assessed in microsomes using pentoxyresorufin, S-mephenytoin, and midazolam as probe substrates, respectively. Michaelis-Menten studies were performed to estimate Vmax and Km by measuring the formation of metabolites (Table 2). Vmax, Km, and Vmax/Km of resorufin formation from pentoxyresorufin increased in the 25-week-old db/db mice relative to the controls. Vmax in the 10-week-old db/db mice was markedly lower than that of the 25-week-old db/db mice, whereas Vmax/Km (normalized to milligrams of microsome) in the 10-week-old db/db were significantly higher than that of the 25-week-old db/db mice. For Cyp2c29, Vmax and Vmax/Km of 4-OH-mephenytoin formation, normalized to P450 content, were notably higher in the 25-week-old db/db mice compared with those in the controls. When normalized to microsomal protein content, the Vmax/Km in the 10-week-old db/db mice is approximately 2-fold higher than that of the 25-week-old db/db mice. For Cyp3a, there were no significant differences in Vmax, Km, and Vmax/Km of 4-OH-midazolam formation found among the three groups of mice.
Summary of Cyp2b10, Cyp2c29, and Cyp3a11 activity in db/db and control mice liver microsomes
Formation of resorufin, 4-OH-mephenytoin, and 4-OH-midazolam was measured to assess Cyp2b10, Cyp2c29, and Cyp3a11 metabolism, respectively. Data are depicted as the mean ± S.D.; n = 5.
Discussion
In modern drug discovery, it is commonplace to use animal models of the disease process to investigate the utility of potential therapeutic interventions. These can involve models of the disease process produced through selection and breeding for a specific phenotype, genetic modification, and treatment with a drug, toxin, pathogen, or other methods. The models are then validated by demonstrating similarity of the pathology to the human disease and often response to known therapies. An important additional step in the characterization of the animal model is an understanding of the effect of the induced disease on the expression and the function of drug-metabolizing enzymes and transporters. Changes in the expression and function of these critical proteins can alter the absorption, distribution, metabolism, and elimination of the compounds being evaluated for efficacy and lead to dose-exposure relationships that are very different from those of normal animals used to assess nonclinical safety, prompting us to investigate these issues in the db/db mouse model of diabetes by broadly characterizing the expression and function of drug-metabolizing enzymes, transporters, and nuclear receptors.
Gene expression of Cyp2b10, Cyp2c29, Cyp2e1, Cyp3a11, Cyp4a10, PXR, and CAR is summarized in Table 3 and compared with existing data. The expression data of the 10-week-old db/db mice in the present study compared with those of the 25-week-old controls agreed with data reported previously by Yoshinari et al. (2006), which suggests relatively unchanged expression of P450s, nuclear receptors, and transporters in the C57 control mice between 10 and 25 weeks of age. Significant differences were observed for Cyp2b10, Cyp2c29, and PXR in the 25-week-old db/db mice compared with those in the 10-week-old mice, suggesting a potential age- or disease state-related effect. Contrary to the report by Yoshinari et al. (2006), we did not observe increased PXR mRNA levels, which is consistent with no expression changes in a number of genes that are regulated by PXR. The increase in Cyp2b10 and possibly in Cyp2c29 mRNA levels at 10 weeks compared with that at 25 weeks suggests activation of CAR under the db condition without changes in CAR expression. In a recent study, Dong et al. (2009) showed that activation of CAR improves glucose tolerance and insulin sensitivity in ob/ob, CAR(−/−) double knockout mice. It has been demonstrated that insulin is necessary to maintain Cyp2b and Cyp2c29 mRNA levels (Kim and Novak, 2007) and that the insulin level peaks to 6 to 10 times the normal level by 2 to 3 months of age in db/db mice followed by a steep decline. Although there was no change in CAR expression in the 25-week-old mice, Cyp2b10 expression in the 25-week-old mice decreased to a level that is not statistically significant from that of the controls. This drop in mRNA expression coincided with the decline in serum insulin levels as shown previously (Coleman, 1982). These data collectively suggest that the changes in Cyp2b10 expression could be a result of a combination of CAR activation and an age- or disease state-dependent insulin fluctuation. Additional studies are necessary to elucidate the mechanism of Cyp2b10 and Cyp2c29 mRNA expression changes.
Summary of mRNA expression results in the present study and in the literature
The expression of Cyp2e1 has been well studied in humans and in various diabetic animal models; however, data inconsistency exists (Table 3). Evidence suggests that insulin plays a role in reducing the expression of Cyp2e1 in rat hepatocyte culture at concentrations as low as 1 nM (Kim and Novak, 2007). In young db/db mice, the circulating insulin level can be as high as 2.6 nM versus the normal 0.26 nM (Koranyi et al., 1990). However, in the present study, there were no marked changes in the expression of Cyp2e1 among the three groups of mice. It is known that hyperglycemia in rodents (Yamazoe et al., 1989) and human obesity (O'Shea et al., 1994) cause an increase in ketone bodies due to the hyperglycemic state. Although not measured, it is assumed that there are high levels of circulating ketone bodies because db/db mice maintain hyperglycemia for most of their lives. These results suggest that the decreasing effect of insulin on Cyp2e1 expression is probably counteracted by the increasing effect of ketone bodies that could result in no net change in mRNA expression. Our Cyp4a10 results are consistent with literature reports.
Cyp2b10, Cyp2c29, and Cyp3a11 were selected to assess their activities in microsomes because they are the more commonly encountered P450s during early drug discovery (Table 2). Although the overall Cyp3a11 expression and activity were not different among the three groups tested, substantial discrepancies were observed between Cyp2b10 and Cyp2c29 expression profiles and their enzymatic activities. It appears that as the disease progressed, Vmax and Km of the Cyp2b10 at 25 weeks of age increased significantly compared with those in the controls, which resulted in a marked increase in Vmax/Km despite no significant change in mRNA expression. The Vmax/Km of the 10-week-old mice when normalized to P450 content was no different from that of the 25-week-old db/db mice; however, when normalized to milligrams of microsomal protein, the difference became significant. Similar trends were observed for Cyp2c29. Because the P450 content in the 10-week-old mice was twice that in the 25-week-old mice, the overall ability of 10-week-old db/db mice might be higher than that at 25 weeks of age. Therefore, the combined effects of the diabetic state on liver weight, microsomal protein content, and Cyp2b and Cyp2c enzymatic activity could result in a considerable increase in the ability of db/db mice to metabolize Cyp2b and Cyp2c substrates. For Cyp2c29, contrary to a drop in mRNA levels in the 25-week-old db/db mice, an increase in activity was observed compared with that in the controls. These differences can be due to an age-related or disease-related post-transcriptional modification such as a change in the amount or the stability of the enzymes. Further studies including Western blot analysis can help determine the causes of these discrepancies.
It has been well demonstrated that hepatic transporters play an important role in the distribution and elimination of their substrates as well as in drug-drug interactions. However, their expression in db/db mice has not been determined. Slco1a1 is highly expressed in the liver, the kidney, the brain, and the lung and is responsible for the transport of numerous endogenous molecules and xenobiotics (Hagenbuch and Meier, 2003). In db/db mice, the mRNA expression of slco1a1 was drastically reduced (Fig. 3) versus that in the controls. This significant change in slco1a1 expression could alter tissue distribution, metabolism, and excretion of its substrates in db/db mice. The huge reduction of slco1a1 mRNA was also observed in ob/ob mice (Table 3). Slco1a4 and slco1b2 mRNA levels increased in the 25-week-old db/db mice compared with that in the controls. In contrast, decreasing trends were observed in ob/ob mice, illustrating an intrinsic difference between the two diabetic mouse models. P-glycoprotein is another well studied efflux transporter that is heavily involved in drug disposition. In our study, significant decreases in the mRNA levels of abcb1b were noted in the 25-week-old db/db mice compared with those in the controls. The mRNA expression of abcc2 and abcg2 was not statistically different in the db/db animals versus their controls.
In summary, considerable changes in mRNA expression were found for Cyp2c29, Cyp4a10, slco1a1, slco1a4, slco1b2, and abcb1b in db/db mice relative to those in their lean controls. In vivo studies in db/db mice and the controls need to be conducted to further demonstrate the importance of these expression and activity changes. There is a marked species difference between human and mice and between type II diabetic patients and db/db mice. There is a lack of P450, nuclear receptor, and transporter expression information in humans. It is important to characterize gene expression under the diabetic disease state so that drugs can be designed to better target potentially altered expression in patients.
Footnotes
Article, publication date, and citation information can be found at http://dmd.aspetjournals.org.
doi:10.1124/dmd.110.034223.
-
ABBREVIATIONS:
- P450
- cytochrome P450
- PCR
- polymerase chain reaction
- slco
- organic anion-transporting polypeptide
- abc
- ATP-binding cassette
- PXR
- pregnane X receptor
- CAR
- constitutive androstane receptor
- OH
- hydroxy
- GAPDH
- glyceraldehyde-3-phosphate dehydrogenase
- LC-MS/MS
- liquid chromatography-tandem mass spectrometry.
- Received May 3, 2010.
- Accepted August 23, 2010.
- Copyright © 2010 by The American Society for Pharmacology and Experimental Therapeutics


