


Abstract
Artemether (AM) is one of the most effective antimalarial drugs. The elimination half-life of AM is very short, and it shows large interindividual variability in pharmacokinetic parameters. The aim of this study was to identify cytochrome P450 (P450) isozymes responsible for the demethylation of AM and to evaluate functional differences between 26 CYP2B6 allelic variants in vitro. Of 14 recombinant P450s examined in this study, CYP2B6 and CYP3A4 were primarily responsible for production of the desmethyl metabolite dihydroartemisinin. The intrinsic clearance (Vmax/Km) of CYP2B6 was 6-fold higher than that of CYP3A4. AM demethylation activity was correlated with CYP2B6 protein levels (P = 0.004); however, it was not correlated with CYP3A4 protein levels (P = 0.27) in human liver microsomes. Wild-type CYP2B6.1 and 25 CYP2B6 allelic variants (CYP2B6.2-CYP2B6.21 and CYP2B6.23-CYP2B6.27) were heterologously expressed in COS-7 cells. In vitro analysis revealed no enzymatic activity in 5 variants (CYP2B6.8, CYP2B6.12, CYP2B6.18, CYP2B6.21, and CYP2B6.24), lower activity in 7 variants (CYP2B6.10, CYP2B6.11, CYP2B6.14, CYP2B6.15, CYP2B6.16, CYP2B6.20, and CYP2B6.27), and higher activity in 4 variants (CYP2B6.2, CYP2B6.4, CYP2B6.6, and CYP2B6.19), compared with that of wild-type CYP2B6.1. In kinetic analysis, 3 variants (CYP2B6.2, CYP2B6.4, and CYP2B6.6) exhibited significantly higher Vmax, and 3 variants (CYP2B6.14, CYP2B6.20 and CYP2B6.27) exhibited significantly lower Vmax compared with that of CYP2B6.1. This functional analysis of CYP2B6 variants could provide useful information for individualization of antimalarial drug therapy.
Introduction
Malaria is a very serious problem in many countries, and there are more than 200 million cases that result in approximately 1 million deaths worldwide each year (World Health Organization, World Malaria Report 2009, http://www.who.int/malaria/world_malaria_report_2009/en/index.html). The management of malaria has traditionally relied on monotherapy with quinolines such as quinine, mefloquine, and chloroquine. However, the widespread and excessive use of these agents has resulted in drug resistance (Wernsdorfer, 1991; Price and Nosten, 2001; Le Bras and Durand, 2003). In several studies, artemisinins, unique sesquiterpene lactone endoperoxides, have been used in areas with multidrug-resistant Plasmodium falciparum malaria (Woodrow et al., 2005; Gautam et al., 2009; World Health Organization, 2010).
Artemisinin is a natural antimalarial agent derived from the Chinese medicinal plant Artemisia annua (Klayman, 1985). The artemisinin derivative artemether (AM) is the most effective antimalarial drug. AM has a fast onset of action, therapeutic efficacy against multidrug-resistant malaria, and few side effects, although neurotoxicity has been observed in experimental mammals (Hien and White, 1993; Brewer et al., 1994). AM is mainly converted to dihydroartemisinin (DHA) (Fig. 1), a desmethyl metabolite that contributes to the majority of the antimalarial activity. The conversion of AM to DHA is catalyzed by cytochrome P450 (P450) (van Agtmael et al., 1999b,c; Navaratnam et al., 2000). However, the elimination half-life of AM is very short, and it shows large interindividual variability in pharmacokinetic parameters (Na Bangchang et al., 1994; Mordi et al., 1997; van Agtmael et al., 1999a; Lefèvre et al., 2002; Ali et al., 2010; Mwesigwa et al., 2010).
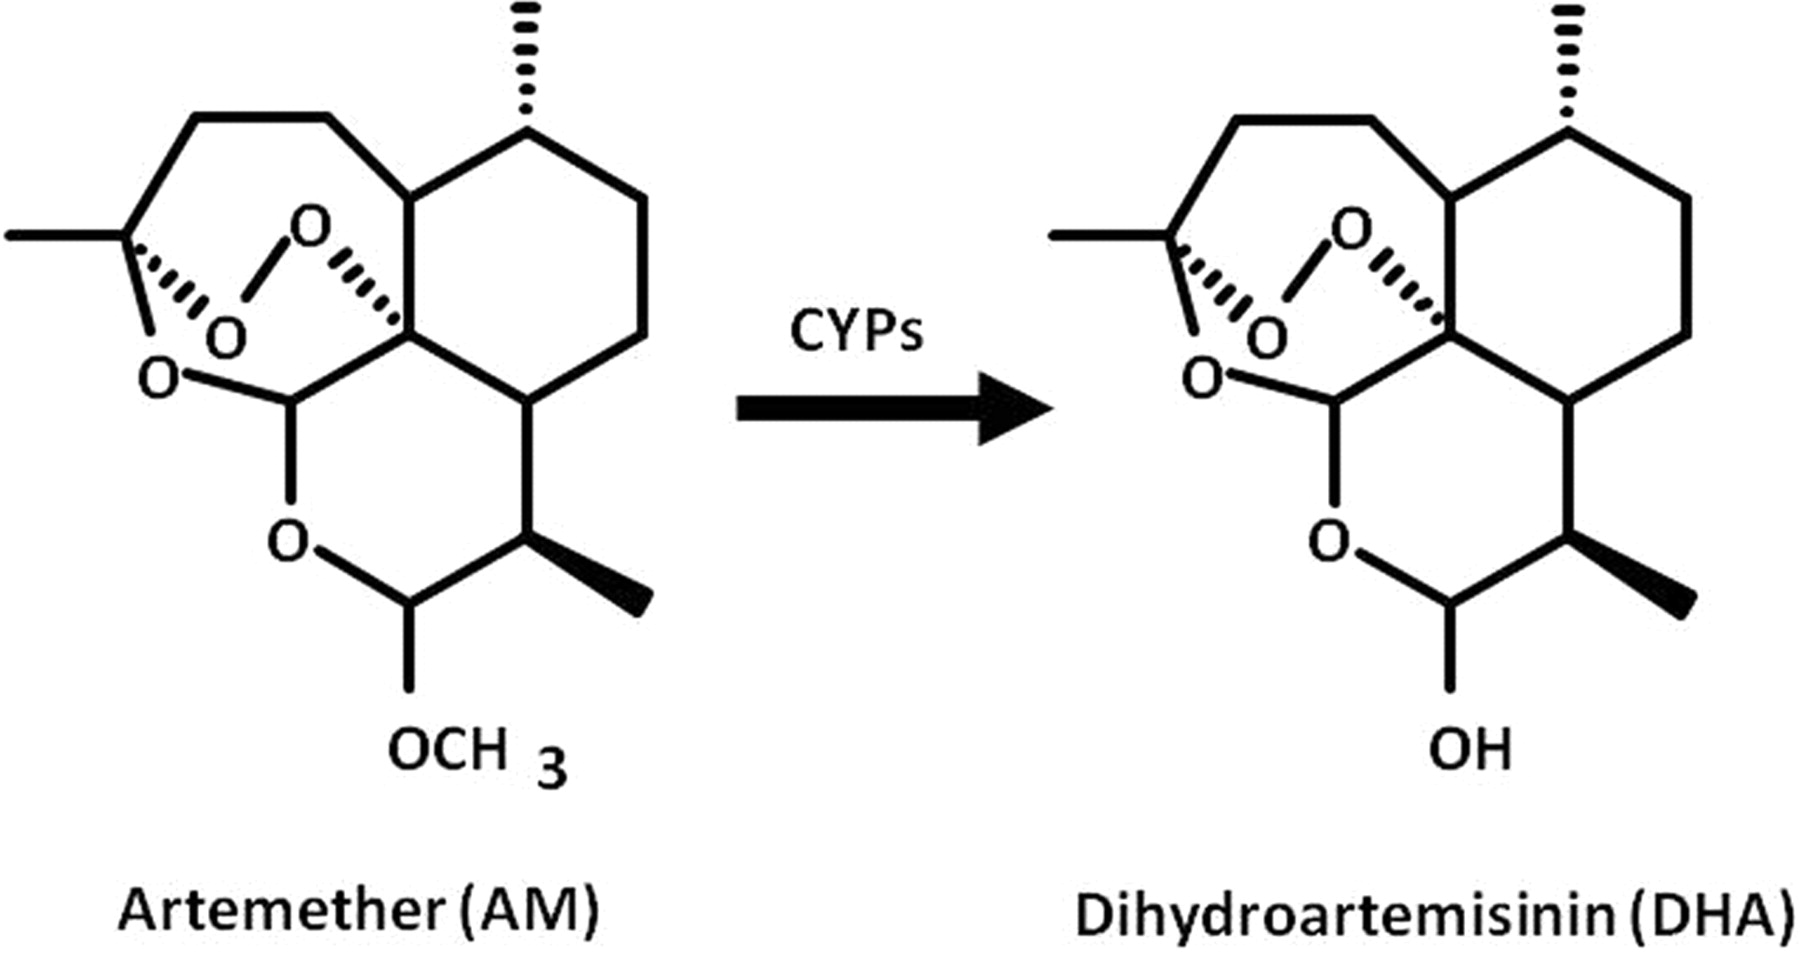
Metabolic pathway of artemether to dihydroartemisinin by P450 enzymes.
The P450 isozymes CYP2B6 and CYP3A4 are thought to catalyze AM demethylation (Navaratnam et al., 2000). In contrast, it has been reported that CYP2D6 and CYP2C19 make no major contribution to this reaction (van Agtmael et al., 1998), and the role of other P450s remains unclear. CYP2B6 plays a major role in the biotransformation of several therapeutically important drugs, including cyclophosphamide, bupropion, selegiline, efavirenz, nevirapine, and methadone (Roy et al., 1999; Hesse et al., 2000; Hidestrand et al., 2001; Salonen et al., 2003). Many genetic polymorphisms in the CYP2B6 gene have been reported, and these are thought to be responsible for interindividual and interethnic differences in responses to CYP2B6 substrate drugs [Zanger et al., 2007; Human Cytochrome P450 (CYP) Allele Nomenclature Committee, 2008; Mo et al., 2009]. In the case of chemotherapy using cyclophosphamide, the increasing enzymatic activity of CYP2B6 variants can be associated with the increased blood concentration of the active metabolite of the drug, resulting in a heightened risk of side effects (Xie et al., 2003, 2006; Nakajima et al., 2007).
Several functional analyses of CYP2B6 variant proteins, using an in vitro expression system, have been reported. Watanabe et al. (2010) characterized the functional relevance of many CYP2B6 variants, including CYP2B6.1 to CYP2B6.28, using 7-ethoxy-4-trifluoromethylcoumarin and selegiline as substrates, and reported that CYP2B6.8, CYP2B6.11, CYP2B6.12, CYP2B6.13, CYP2B6.15, CYP2B6.18, CYP2B6.21, CYP2B6.24, and CYP2B6.28 were inactive with regard to these compounds. These results were consistent with those of a number of in vitro studies using bupropion as a substrate. In contrast, CYP2B6.16, CYP2B6.19, and CYP2B6.27 exhibited activity toward 7-ethoxy-4-trifluoromethylcoumarin and inability to detect selegiline metabolism. Several researchers have reported that these CYP2B6 variants exhibited decreased protein expression/activity when bupropion was used as the CYP2B6 substrate (Lang et al., 2004; Klein et al., 2005; Wang et al., 2006; Rotger et al., 2007). These results suggest that some allelic variants of CYP2B6 are associated with a substrate-dependent decrease in the catalytic properties of the enzyme. To date, there have been no reports of functional characterization of CYP2B6 variants in relation to AM demethylation activity.
In this study, we performed an in vitro analysis of 14 P450s (CYP1A1, CYP1A2, CYP1B1, CYP2A6, CYP2B6, CYP2C8, CYP2C9, CYP2C19, CYP2D6, CYP2E1, CYP2J2, CYP3A4, CYP3A5, and CYP4A11) to identify isoforms responsible for AM demethylation and evaluated functional differences among 26 CYP2B6 allelic variants (Fig. 2).

Structures of CYP2B6 alleles characterized in this study. The nine exons are indicated by numbered boxes. Some promoter and intronic polymorphisms are not shown.
Materials and Methods
Chemicals.
AM, DHA, and artemisinin (ART) were purchased from Tokyo Chemical Industry Corporation (Tokyo, Japan). Recombinant CYP1A1, CYP2A6, CYP2B6, CYP2C8, CYP2D6, CYP2J2, and CYP4A11 Supersomes were purchased from BD Biosciences (Woburn, MA). CYP1A2, CYP2C9, CYP2E1, CYP3A4, and CYP3A5 Baculosomes were purchased from Invitrogen (Carlsbad, CA). NADPH was obtained from Oriental Yeast (Tokyo, Japan). Protease Inhibitor Cocktail Set III was purchased from Merck Chemicals (Darmstadt, Germany). Methanol (CH3OH) and acetonitrile (CH3CN) of LC-mass spectrometry grade were obtained from Kanto Chemical (Tokyo, Japan). Ammonium formate (HCOONH4) and formic acid (HCOOH) of LC-mass spectrometry grade were obtained from Wako Pure Chemical Industries (Tokyo, Japan).
DHA stock solution (5 mM) was prepared in CH3CN/H2O [50:50 (v/v)], and working solutions (1.0, 2.0, 5.0, 10, 25, 50, 100, and 200 μM) were prepared from the stock solution. These solutions were further diluted in 50 mM potassium phosphate buffer, pH 7.4, and the final calibration curves were obtained with 0.1, 0.2, 0.5, 1.0, 2.5, 5.0, 10, and 20 μM solutions. Working solutions (100 μl) were prepared in 1.5-ml plastic tubes, and 100 μl of CH3OH, 5 μl of internal standard (ART at 100 μM), and 100 μl of H2O were added. The resulting mixture was vortexed. After centrifugation at 12,000g for 10 min, 80 μl of the supernatant was transferred to a new plastic tube and passed through a filter (pore size: 0.2 μm; YMC Co., Ltd., Kyoto, Japan). Subsequently, 10 μl of the filtered solution was injected into the liquid chromatography-tandem mass spectrometry (LC-MS/MS) system for analysis. All peaks were integrated automatically by Xcalibur software (Thermo Fisher Scientific, Waltham, MA). Levels of DHA were calculated from the calibration curves by the ratios of their peak areas to that of ART. An eight-point calibration curve was plotted for DHA concentration (0.1, 0.2, 0.5, 1.0, 2.5, 5.0, 10, and 20 μM).
Sample Preparation for Analysis of Specific Activity.
AM demethylation activity was determined by measurement of the formation of DHA, according to the method of Asimus and Ashton (2009), with minor modifications. AM stock solution (50 mM) was prepared in CH3CN/H2O [50:50 (v/v)], and a working solution (500 μM) was prepared by dilution of the stock solution in potassium phosphate buffer, pH 7.4. The incubation mixture contained AM as a substrate (1 and 50 μM), recombinant P450 enzymes (CYP1A1, CYP1A2, CYP1B1, CYP2A6, CYP2B6, CYP2C8, CYP2C9, CYP2C19, CYP2D6, CYP2E1, CYP2J2, CYP3A4, CYP3A5, and CYP4A11; 0.5 pmol) or human liver microsomes (50 μg), 0.5 mM NADPH, 5 mM MgCl2, and 50 mM potassium phosphate buffer to a final volume of 90 μl. After preincubation (3 min at 37°C), the reaction was started by addition of NADPH. Reactions were performed for 30 min and terminated by the addition of 100 μl of methanol. Then, 5 μl of internal standard (ART at 100 μM) and 100 μl of H2O were added. The resulting mixture was vortexed. After centrifugation at 12,000g for 10 min, 80 μl of the supernatant was transferred to a new plastic tube and passed through a filter (pore size: 0.2 μm; YMC). Then, 10 μl of the filtered solution was injected into the LC-MS/MS system for analysis. All peaks were integrated automatically by Xcalibur software. Levels of DHA were calculated from the calibration curves by using the ratios of their peak areas to that of ART. Formation of DHA was in the linear range between 10 and 60 min and 30 and 50 μg of microsomal protein.
Sample Preparation for Analysis of Kinetic Parameters of CYP2B6 and CYP3A4.
AM stock solution (50 mM) was prepared in CH3CN/H2O [50:50 (v/v)], and working solutions (0.25, 0.50, 1.25, 2.5, 5.0, 12.5, and 25 mM) were prepared by dilution of the stock solution. These solutions were diluted with 50 mM potassium phosphate buffer, pH 7.4, and the final calibration curves were obtained with 0.5, 1.0, 2.5, 5.0, 10, 25, 50, and 100 μM. CYP2B6 and CYP3A4 activity was evaluated using the concentration ranges 0.5 to 50 and 2.5 to 100 μM, respectively. Samples were prepared as described above.
Determination of DHA and ART Using Online Column-Switching LC-MS/MS.
Levels of DHA were determined by the LC-MS/MS method described by Huang et al. (2009), with minor modifications. A Nanospace SI-2 LC system, comprising an LC pump, autosampler, column oven maintained at 40°C, and on-line degasser (Shiseido, Tokyo, Japan), was used. The on-line column-switching valve system consisted of an automated switching valve (six-port valve) connected to pump A and pump B. Pump A was connected via the switching valve to the trap column, a CAPCELL PAK C18 SG II (10 × 2 mm i.d., 3-μm particle size) (Shiseido, Tokyo, Japan), and pump B was connected via the switching valve to the analytical column, a Sunfire C18 (150 mm × 2.1 mm i.d., 3.5-μm particle size) (Waters, Milford, MA). The outlet of the analytical column was connected to the mass spectrometer via a divert valve.
Sample loading.
A 10-μl aliquot of sample was injected onto the trap column using pump B with the switching valve in position 1. Impurities on the trap column were eluted to waste using 0.1% HCOOH-H2O/CH3CN [5:95 (v/v)] at a flow rate of 200 μl/min for 4 min. Concurrently, initial flow was maintained by pump A at 200 μl/min with 10 mM HCOONH4-H2O (adjusted to pH 4.1 using HCOOH)-0.1% HCOOH-CH3CN [20:80 (v/v)] via the analytical column.
Sample elution.
At 4 min, the switching valve was switched to position 2 to allow the purified DHA and ART to be eluted from the trap column onto the analytical column and subsequently into the mass spectrometer. Isocratic flow was maintained by pump B at a rate of 200 μl/min for 11 min. Concurrently, the flow from pump A was passed through the trap column and diverted directly to waste. At 11 min, the switching valve was switched back to position 1, and the configuration of the online column switching system reverted back to that in the initial conditions (described for the sample loading above). A divert valve was used to divert the LC effluent to waste during the first 4.5 min and last 0.5 min of the chromatographic run. The total run time was 11 min.
Quantification analyses by MS were performed in the selected reaction monitoring mode because of the high selectivity and sensitivity of selected reaction monitoring data acquisition, in which the transitions of the precursor ion into the product ion were monitored: m/z 302 → 145 and 302 → 267 for DHA and m/z 300 → 151 and 300 → 209 for ART. The optimized parameters for MS are as follows: positive heated electrospray ionization voltage, 3 kV; heated capillary temperature, 300°C; sheath gas pressure, 50 psi; auxiliary gas setting, 20 psi; and heated vaporizer temperature, 300°C. Both the sheath and auxiliary gases were nitrogen. The collision gas was argon at a pressure of 1.5 mTorr. The LC-MS/MS system was controlled by Xcalibur software, and data were also collected with this software. The retention times of DHA and ART were 7.0 and 7.5 min, respectively.
Liver Specimens.
Human liver specimens were obtained from the Human and Animal Bridging Research Organization (HAB) in Chiba, Japan, using frozen human livers (most of the donors were white). Microsomes were prepared from these specimens using differential centrifugation. Research protocols were approved by the ethics committees of the Graduate School of Pharmaceutical Sciences, Tohoku University (Sendai, Japan).
Expression of CYP2B6 Variant Proteins in COS-7 Cells.
CYP2B6 variant proteins were expressed in COS-7 cells as described by Watanabe et al. (2010).
Determination of Protein Expression Levels by Immunoblotting.
Western blotting was performed according to standard procedures, with 10% SDS-polyacrylamide gel electrophoresis, and 30-μg microsomal fractions were loaded into each lane. Recombinant CYP2B6 Supersomes reagent (BD Gentest) was coanalyzed as the standard on each gel and used to quantify the CYP2B6 protein. The CYP2B6 protein was detected using the antihuman CYP2B6 antibody (BD Gentest) and horseradish peroxidase-conjugated goat anti-rabbit IgG (Dako Denmark A/S, Glostrup, Denmark). CYP3A4 Baculosomes reagent (Invitrogen) was coanalyzed as the standard on each gel and used to quantify the CYP3A4 protein. The CYP3A4 protein was detected using the antihuman CYP3A4 antibody (Nosan, Yokohama, Japan) and horseradish peroxidase-conjugated goat anti-rabbit IgG (Dako Denmark A/S). Immunoblots were developed using the SuperSignal West Dura Extended Duration Substrate (Thermo Fisher Scientific). Chemiluminescence was quantified using a lumino-imaging analyzer (LAS-1000; Fujifilm, Tokyo, Japan) and ImageJ software (National Institutes of Health, Bethesda, MD).
Sample Preparation for Analysis of Kinetic Parameters of CYP2B6 Variants.
Microsomal fractions (50 μg) obtained from COS-7 cells were used for evaluation of the activity of CYP2B6 variants. Samples were prepared as described above.
Statistical Analysis.
Apparent Km and Vmax parameters were determined using nonlinear regression analysis. All data are the mean ± S.D. in triplicate. Statistical analyses of enzymatic activities and kinetic parameters were performed by analysis of variance using the Dunnett method. P ≤ 0.05 was considered significant.
Results
AM Demethylation by Recombinant Human P450s.
The activities of AM demethylation were measured in 14 recombinant human P450 enzymes (CYP1A1, CYP1A2, CYP1B1, CYP2A6, CYP2B6, CYP2C8, CYP2C9, CYP2C19, CYP2D6, CYP2E1, CYP2J2, CYP3A4, CYP3A5, and CYP4A11) at 1 and 50 μM substrate concentrations. The lower concentration used was intended to approximate the plasma AM concentrations reported to be clinically relevant (0.3–1 μM) (Ali et al., 2010). At 1 μM AM, AM demethylation activities of recombinant CYP2B6 and CYP3A4 were 6.61 and 2.50 pmol · min−1 · pmol P450−1, respectively. Under the lower substrate conditions used in this study, DHA was not formed by the other P450 isoforms with the exception of CYP2B6 and CYP3A4. At a higher concentration (50 μM), AM was principally metabolized by CYP2B6, followed by CYP3A4. A low rate of demethylation was observed for CYP1A2, CYP2C9, CYP2C19, CYP2D6, CYP2J2, and CYP3A5; CYP1A1, CYP1B1, CYP2A6, CYP2C8, CYP2E1, and CYP4A11 were inactive (Fig. 3).

AM demethylation activity of 14 P450 isozymes. The concentration of AM was 50 μM. Each number corresponds to a P450 subtype. Results are presented as the mean ± S.D. in triplicate. N.D., not detectable (activities were lower than 0.22 pmol · min−1 · pmol P450−1).
Kinetics of AM Demethylation by CYP2B6 and CYP3A4.
The kinetics of AM demethylation were investigated for each of recombinant enzymes CYP2B6 and CYP3A4 by Michaelis-Menten plots (Fig. 4). Apparent Km, Vmax, and Vmax/Km values for CYP2B6 were estimated to be 1.95 μM, 17.9 pmol · min−1 · pmol P450−1, and 9.19 μl · min−1 · pmol P450−1, respectively; those for CYP3A4 were 8.24 μM, 12.3 pmol · min−1 · pmol P450−1, and 1.49 μl · min−1 · pmol P450−1, respectively, demonstrating a higher Km and lower Vmax, which resulted in an approximately one-sixth Vmax/Km value for CYP3A4 relative to that for CYP2B6.

The Michaelis-Menten curves for the demethylation of AM with recombinant CYP2B6 and CYP3A4.
Comparison of AM Demethylation Activities (at 50 μM AM) to Immunoquantified CYP2B6 and CYP3A4 Protein Levels in 13 Human Liver Microsomes.
As shown in Fig. 5, AM demethylation activity in 13 human liver microsomes was correlated with immunoquantified CYP2B6 content (r2 = 0.548, P = 0.004) but not with immunoquantified CYP3A4 content (r2 = 0.109, P = 0.272).

Comparison of AM demethylation activities (at 50 μM AM) to immunoquantified CYP2B6 (A) and CYP3A4 (B) protein levels in 13 human liver microsomes. Correlation coefficients (r2) obtained in these cases are shown.
Enzymatic Properties for AM Demethylation by Wild-Type and 25 Variant CYP2B6s.
The demethylation activities of wild-type and 25 variant microsomal CYP2B6 proteins were determined using AM (50 μM) as a substrate (Fig. 6). For CYP2B6.8, CYP2B6.12, CYP2B6.18, CYP2B6.21, and CYP2B6.24, no AM demethylation activity was detected. The enzymatic activity of CYP2B6.3 could not be calculated because its expression level could not be determined by immunoblotting. CYP2B6.10, CYP2B6.11, CYP2B6.14, CYP2B6.15, CYP2B6.16, CYP2B6.20, and CYP2B6.27 exhibited significantly decreased activities compared with that of wild-type CYP2B6.

AM demethylation activity of CYP2B6 proteins expressed in COS-7 cells. The concentration of AM was 50 μM. Each number corresponds to CYP2B6 variant proteins. Results are presented as the mean ± S.D. in triplicate. *, P < 0.05 compared with CYP2B6.1. N.D., not detectable.
The Michaelis-Menten kinetics for AM demethylation were determined for CYP2B6.1, CYP2B6.2, CYP2B6.4, CYP2B6.5, CYP2B6.6, CYP2B6.7, CYP2B6.9, CYP2B6.10, CYP2B6.13, CYP2B6.14, CYP2B6.17, CYP2B6.19, CYP2B6.20, CYP2B6.23, CYP2B6.25, CYP2B6.26, and CYP2B6.27. The kinetic parameters are summarized in Table 1. The estimated kinetic parameters, apparent Km, Vmax, and Vmax/apparent Km for AM demethylation by CYP2B6.1 were 3.10 μM, 36.0 pmol · min−1 · pmol CYP2B6−1, and 12.4 μl · min−1 · pmol CYP2B6−1, respectively. The Vmax values for CYP2B6.14, CYP2B6.20, and CYP2B6.27 were significantly decreased, whereas those for CYP2B6.2, CYP2B6.4, and CYP2B6.6 were significantly increased, relative to that for the wild-type enzyme.
Kinetic parameters of AM demethylation by CYP2B6 proteins expressed in COS-7 cells
Results represent the mean ± S.D. of triplicate determinations.
Discussion
In this study, we have determined the human P450 enzymes responsible for AM demethylation. Among 14 human P450s, CYP2B6 has the highest intrinsic activity for AM demethylation, followed by CYP3A4. In the kinetic parameter analysis, the affinity of CYP2B6 was 4-fold higher than that of CYP3A4, and the Vmax/apparent Km of CYP2B6 was 6-fold higher than that of CYP3A4. These results suggest that AM demethylation is likely to be mainly catalyzed by CYP2B6 in the liver. The contribution of CYP2B6 to AM demethylation by human liver microsomes was further substantiated by showing a correlation to CYP2B6 protein content (r2 = 0.548). However, van Agtmael et al. (1999b,c) have reported that administration of AM with grapefruit juice, a CYP3A4 inhibitor, increased the blood concentration of AM and DHA but not their elimination half-life. Thus, CYP3A4 in the small intestine might also play an important role in the metabolism of AM.
CYP2B6 is a genetically polymorphic enzyme (Zanger et al., 2007; Arenaz et al., 2010). In vitro functional characterization of polymorphically expressed CYP2B6 variants revealed that CYP2B6.4 and CYP2B6.6 increased AM demethylation activity, whereas CYP2B6.8, CYP2B6.11, CYP2B6.12, CYP2B6.14, CYP2B6.15, CYP2B6.16, CYP2B6.18, CYP2B6.20, CYP2B6.21, CYP2B6.24, and CYP2B6.27 exhibited no activity or decreased activity. These alterations were consistent with those of previous in vitro studies performed using bupropion, 7-ethoxy-4-trifluoromethylcoumarin, and selegiline as CYP2B6 substrates (Lang et al., 2004; Klein et al., 2005; Wang et al., 2006; Rotger et al., 2007; Watanabe et al., 2010). However, CYP2B6.2 exhibited increased AM demethylation activity, and the activity of CYP2B6.13 was similar to that of wild-type CYP2B6.1. There have been several reports that CYP2B6.2 exhibited no functional differences compared with CYP2B6.1 (Jinno et al., 2003; Watanabe et al., 2010) and that CYP2B6.13 had no metabolic activity toward 7-ethoxy-4-trifluoromethylcoumarin and selegiline (Watanabe et al., 2010). These results suggest that these CYP2B6 variants show substrate-dependent changes in the catalytic properties of the enzyme.
Gay et al. (2010) recently determined the crystal structure of CYP2B6, allowing the prediction of precise locations within the three-dimensional structure at which amino acid substitutions occur. They suggested that the K262R substitution on the G/H loop is assembled into a hydrogen-bonding network with His252, Thr255, Asp263, and Asp266 and is involved in protein stability. In this study, the AM demethylation activities of CYP2B6.12 (G99E) and CYP2B6.24 (Q476D) were not detectable. In the CYP2B6 protein structure, the Gly99 and Gln476 residues are located in substrate recognition site 1 and 6, respectively. These amino acid changes may reduce the affinity of CYP2B6 for AM. However, a number of amino acids with altered AM demethylation activity are located far from substrate recognition sites. Indeed, the apparent Km values of AM demethylation were not significantly different among the CYP2B6 variants (Table 1). We hypothesize that the functional effects of these variants are transduced via long-range hydrogen-bonding networks or through subtle differences in the placement of secondary structural elements. In addition, most of the amino acid substitutions that abolished enzymatic activity are conserved among human P450s and are therefore critical for CYP2B6 activity.
This is the first study to functionally analyze CYP2B6 genetic variants with respect to AM demethylation activity. If CYP2B6 has a significant role in the metabolism of AM in vivo as well as in vitro, individuals with poor CYP2B6 metabolism might have higher plasma AM concentrations than those with more active variants of this enzyme. However, because DHA also has an antimalarial effect, it would be difficult to assess the clinical outcome in subjects who polymorphically express CYP2B6 without in vivo data. To more fully understand the mechanistic basis of our findings, it would be of great value to clinically examine the relationship between CYP2B6 genotypes and the plasma concentration of AM and its metabolites.
In conclusion, demethylation of AM was mainly catalyzed by recombinant CYP2B6, although recombinant CYP3A4 also exhibited this metabolic activity. In addition, we performed a comprehensive analysis, using COS-7 cells as a heterologous expression system, to characterize nonsynonymous CYP2B6 variants. Many of the 26 variants expressed in COS-7 cells exhibited significantly altered AM demethylation activity. This study provides insights into the genotype-phenotype associations of CYP2B6 and lays a foundation for future clinical studies on interindividual variation in drug efficacy and toxicity.
Authorship Contributions
Participated in research design: Honda, Hirasawa, and Hiratsuka.
Conducted experiments: Honda, Muroi, and Tamaki.
Contributed new reagents or analytic tools: Saigusa, Suzuki, Tomioka, and Matsubara.
Performed data analysis: Honda, Oda, and Hiratsuka.
Wrote or contributed to the writing of the manuscript: Honda, Saigusa, and Hiratsuka.
Footnotes
This work was supported by the Japan Society for the Promotion of Science [KAKENHI 20590154] and in part by the Smoking Research Foundation.
Article, publication date, and citation information can be found at http://dmd.aspetjournals.org.
doi:10.1124/dmd.111.040352.
-
ABBREVIATIONS:
- AM
- artemether
- DHA
- dihydroartemisinin
- P450
- cytochrome P450
- ART
- artemisinin
- LC
- liquid chromatography
- MS/MS
- tandem mass spectrometry.
- Received May 5, 2011.
- Accepted July 11, 2011.
- Copyright © 2011 by The American Society for Pharmacology and Experimental Therapeutics


