


Abstract
Several reports in the literature present the utility and value of in vitro drug-metabolizing enzyme inhibition data to predict in vivo drug-drug interactions in humans. A retrospective analysis has been conducted for 26 GlaxoSmithKline (GSK) drugs and drug candidates for which in vitro inhibition parameters have been determined, and clinical drug interaction information, from a total of 46 studies, is available. The dataset, for drugs with a diverse range of physiochemical properties, included both reversible and potentially irreversible cytochrome P450 inhibitors for which in vitro inhibition parameters (IC50 or KI/kinact as appropriate) were determined using standardized methodologies. Mechanistic static models that differentiated reversible and metabolism-dependent inhibition, and also considered the contribution of intestinal metabolism for CYP3A4 substrates, were applied to estimate the magnitude of the interactions. Several pharmacokinetic parameters, including total Cmax, unbound Cmax, as well as estimates of hepatic inlet and liver concentration, were used as surrogates for the inhibitor concentration at the enzyme active site. The results suggest that estimated unbound liver concentration or unbound hepatic inlet concentration, with consideration of intestinal contribution, offered the most accurate predictions of drug-drug interactions (occurrence and magnitude) for the drugs in this dataset. When used with epidemiological information on comedication profiles for a given therapeutic area, these analyses offer a quantitative risk assessment strategy to inform the necessity of excluding specific comedications in early clinical studies and the ultimate requirement for clinical drug-drug interaction studies. This strategy has significantly reduced the number of clinical drug interaction studies performed at GSK.
Introduction
Drug-drug interactions (DDIs) are an important consideration in the discovery, development, and clinical use of new pharmaceuticals. There are several historical examples of fatalities and drug withdrawal resulting from DDIs caused by inhibition of metabolic clearance, e.g., mibefradil (Krayenbühl et al., 1999) and terfenadine (Monahan et al., 1990). A large number of these drug interactions have been attributed to the inhibition of cytochrome P450 (P450) enzymes that play a significant role in oxidative drug metabolism. In the P450 superfamily, the CYP3A4 enzyme is responsible for the metabolism of approximately 50% of therapeutic drugs and is most frequently implicated in clinical DDIs (Zhou, 2008). Dosing a CYP3A4 inhibitor (perpetrator) with a drug whose clearance routes are predominantly mediated by CYP3A4 can result in elevated and potentially toxic concentrations of the victim drug.
In response to the clinical risk associated with drug interactions, in vitro methods to assess the inhibition potential of new drugs have been incorporated in the drug discovery and development process. For P450s, this involves the generation of inhibitory constants, i.e., IC50/Ki values for reversible inhibitors or KI and kinact for irreversible inhibitors. In general, the more potent the inhibition in vitro, the greater potential the drug has to perpetrate a drug-drug interaction. If generated in drug discovery, this information can help deselect drugs with a high potential for clinical DDIs. Alternatively, if a P450 inhibitor is progressed to clinical development, then an investigation can be performed in human volunteers to quantify the clinical DDI. The significant advances made in recent years to quantitatively predict the magnitude of drug interactions has lead to a better understanding of the clinical risks resulting from in vitro P450 inhibition. A prospective application of these approaches can be used to enhance decision making and help rationalize investment in unnecessary clinical DDI studies in early drug development.
The evolution of mathematical approaches to predict the magnitude of P450-mediated drug interactions is well documented in the literature (Rowland and Matin, 1973; Mayhew et al., 2000; Wang et al., 2004), and several retrospective analyses have been performed using marketed drugs (Obach et al., 2006, 2007; Einolf, 2007). The available models incorporate the in vitro parameters for P450 inhibition and require an assumption of the perpetrator concentration available to the enzyme ([I]), an elusive value that is clearly not easy to determine for human. Alternative assumptions have been explored to optimize a static value for [I], including Cmax, Cavg, and estimated hepatic inlet concentrations. In addition, researchers have incorporated the plasma protein binding of the perpetrator to improve their predictions (Obach et al., 2006, 2007). These mathematical models also incorporate the fraction of the victim drug metabolized by the inhibited enzyme (fm), which is essential to predict the magnitude of drug interaction for specific comedications. In addition, a term for intestinal extraction (Fg) can be incorporated to account for the additional metabolism by P450 enzymes in the intestine during drug absorption (Galetin et al., 2008). Although physiologically based pharmacokinetic approaches to define dynamic perpetrator and victim concentrations are becoming more widespread, the less complex approaches using static (steady-state) concentrations continue to have value, particularly in the earlier stages of drug development before clinical pharmacokinetic (PK) data are available for model testing and optimization.
One objective of this study was to establish a decision tree to guide the optimal prediction of DDIs and the assessment of clinical risk for future therapeutic agents. This included optimizing the approaches for quantitative prediction using a retrospective analysis of 46 clinical drug interaction studies reported within GlaxoSmithKline (GSK). This clinical dataset included GSK drugs with a diverse range of physicochemical properties that were reversible or potentially irreversible inhibitors of CYP1A2, CYP2C8, CYP2C9, CYP2D6, and CYP3A4, in addition to drugs that were not P450 inhibitors. The potentially irreversible inhibitors were identified by a time- and NADPH-dependent increase in inhibitory potency; however, because the mechanism of inhibition was not determined in this study (i.e., true irreversibility not established), these drugs are referred to hereafter as “metabolism-dependent” inhibitors rather than “mechanism-based” or “irreversible” inhibitors.
Another primary aim was to establish the optimal assumption for [I] within a diverse set of drugs in development for future use in prospective predictions. We have also assessed the impact of understanding the comedication profile within a therapeutic area and investigated how this can be used with quantitative predictions to aid decision making throughout the drug discovery and development process.
Materials and Methods
Clinical Drug Interaction Studies.
The clinical DDI studies selected for retrospective predictive analysis were conducted as part of GSK's drug development program over a period of 12 years.
The criteria for inclusion were as follows: 1) that the studies had AUC data available for the probe substrate in the presence and absence of the GSK test drug (several studies were rejected on the basis of outcome reporting, e.g., metabolite ratio information only); 2) both probe substrate and GSK test drug were administered orally; 3) the standard study design was for repeat dose of GSK drug before administration of probe; and 4) the probe substrates were considered sufficiently selective to assess P450 activity.
The GSK drugs investigated represent a diverse dataset as indicated by their physiochemical properties, summarized in Table 1. The drugs include neutral, basic, acidic, and zwitterionic molecules with varying molecular weight (240–669), cLogP values (0.1–6.8), pKa values (3.2–10.4), and nominal Biopharmaceutics Classification System assignments (BCS; class 1–4, assigned based on available solubility and passive permeability data). The probe substrates used in the clinical studies are shown in Table 2, together with fm and Fg values used in the predictive equations.
Physicochemical properties of GSK drugs used in clinical DDI studies
Clinical probe substrates used in GSK clinical DDI studies, and assumptions of fm and Fg used for DDI predictions
In Vitro P450 Inhibition.
In vitro P450 inhibition data were generated for the 26 GSK drugs using standardized methodologies, thereby eliminating potential variability in parameters, e.g., IC50, due to different incubation conditions. Final human microsomal protein concentrations were low and consistent across the P450 assays to minimize nonspecific binding.
IC50 and Metabolism-Dependent Inhibition Determination.
The ability of GSK drugs to inhibit P450 enzymes (CYP1A2, CYP2C8, CYP2C9, CYP2C19, CYP2D6, and CYP3A4) in a direct and metabolism-dependent manner was investigated in human liver microsomes (HLM) (pool of 16 individuals; XenoTech, LLC, Lenexa, KS) using liquid chromatography/mass spectrometry-based methods. Duplicate incubations were conducted at 37°C in a volume of 250 μl and contained potassium phosphate buffer (50 mM, pH 7.4), an NADPH-regenerating system (cofactor solution consisting of 1.7 mg of NADP+, 7.8 mg of glucose 6-phosphate, and 6 units of glucose-6-phophate dehydrogenase per milliliter), HLM (0.1 mg/ml), inhibitor (or solvent), and probe substrate at approximately the Km. Incubation conditions are summarized in Table 3. To assess direct inhibition, reactions were initiated by addition of cofactor solution. To examine metabolism-dependent inhibition, GSK drugs were preincubated at 37°C with HLM and the cofactor for 20 min before addition of substrate. Incubations with the appropriate substrate continued for 5 or 10 min (Table 3). Known direct and metabolism-dependent inhibitors were included as positive controls. Reactions were terminated by the addition of an equal volume of acetonitrile, centrifuged to remove protein, spiked with an internal standard, and analyzed by liquid chromatography-tandem mass spectrometry on a Sciex API3000 (AB Sciex LLC, Framingham, MA) or equivalent for the appropriate substrate metabolites. Analyte/internal standard peak area ratios and the metabolite concentrations were determined by interpolation from the appropriate standard curve. Rates of metabolite production at each concentration of inhibitor were expressed as a percentage of the mean uninhibited control rate for each assay.
Details of in vitro P450 inhibition assay conditions and positive control inhibitors
The microsomal protein concentration in each assay was standardized at 0.1 mg/ml.
KI/kinact Determination.
For compounds that showed metabolism-dependent inhibition (IC50 change >1.5-fold after 20-min preincubation with NADPH compared with no preincubation), the kinetic parameters for inactivation, kinact − the maximal rate constant of inactivation, and KI − the inhibitor concentration required for half-maximal inactivation, were measured in HLM. Bulk incubations with inhibitor, microsomes (1 mg/ml), and cofactor in 50 mM phosphate buffer (pH 7.4) were performed at 37°C. Inhibitor concentrations were based on the results from metabolism-dependent inhibition experiments and were selected to span a concentration range that was anticipated to bracket measured KI values. Reactions were initiated by addition of cofactor after a 5-min prewarming. After addition of cofactor, duplicate aliquots were removed at various time points and diluted 10-fold in phosphate buffer, fresh cofactor solution, and a probe substrate used for P450 inhibition determination (at approximately 10 × Km). The diluted incubations were continued for 4 to 10 min (depending on probe substrate) at 37°C and then terminated with an equal volume of acetonitrile and analyzed by liquid chromatography-tandem mass spectrometry as described above.
In Vitro Data Analysis.
GraFit (version 5.0.8; Erithacus Software Limited, Horley, Surrey, UK) was used to calculate IC50, KI, and kinact. When appropriate the data were corrected for background activity. Although Ki values were not experimentally measured, P450 inhibition assays were conducted under conditions ([S] = Km) in which, assuming competitive inhibition, the IC50 should be equal to twice the Ki value. Therefore, an estimation of the Ki value as IC50/2 was universally applied (Cheng and Prusoff, 1973), and this represents a conservative approach because under the assay conditions described Ki values for uncompetitive and noncompetitive inhibitors would be equal to the IC50 value. KI and kinact values were calculated from nonlinear least-squared regression analysis of the plot of the inactivation rate constant (from the slope of remaining enzyme activity) at each inhibitor concentration (Polasek and Miners, 2007). Approaches applied to mechanistic static models for quantitative predictions of drug interactions associated with direct and metabolism-dependent inhibition have been covered comprehensively in the literature (Ito et al., 2004; Obach et al., 2006; Einolf, 2007; Venkatakrishnan et al., 2007). This analysis used variations of these mechanistic static models to evaluate both direct and metabolism-dependent inhibitors for which clinical data were available. The inhibitor concentration was defined in 3 ways: 1) clinical Cmax; 2) estimated liver concentrations, which were estimated from rat quantitative whole-body autoradiography (QWBA) data by multiplying the liver/blood concentration (at an early time point to minimize impact of potential metabolites) by the whole-blood Cmax value; and 3) hepatic portal (hepatic inlet) Cmax defined by eq. 1, where ka is the absorption rate constant (0.03/min, an assumed average value (Obach et al., 2006), Fa is the fraction absorbed (assumed to be 1), D is the dose of the inhibitor, Qh is the liver blood flow (1498 ml/min), and gut metabolism of the inhibitor is assumed to be negligible. Furthermore, for each of the defined inhibitor concentrations, total (plasma protein binding was ignored) and the fraction unbound (plasma protein binding was accounted for) were compared.

Predictions of DDI for Reversible Inhibitors.
Quantitative predictions of clinical outcomes for direct inhibitors of CYP1A2, CYP2C8, CYP2C9, CYP2C19, and CYP2D6 used eq. 2, where fmCYP is the fraction of substrate clearance mediated by CYPx (Table 2), Ki is the inhibition constant for CYPx, and [I] is the inhibitor concentration.

Predictions for direct inhibitors of CYP3A4 used eq. 3 and incorporated the contribution of gut metabolism, where FgCYP (Table 2) is the fraction of substrate escaping gut metabolism. The concentration in the gut, [I]gut, was defined by eq. 4, where Qg is the enterocytic blood flow (248 ml/min).


Predictions of DDI for Metabolism-Dependent Inhibitors.
Quantitative predictions for compounds that showed metabolism-dependent inhibition incorporated aspects of P450 inactivation kinetics. For metabolism-dependent inhibitors of CYP2C9 and 2D6 eq. 5 was used, where kdeg is the enzyme degradation rate constant [0.00026/min and 0.000226/min for CYP2C9 and 2D6, respectively (Obach et al., 2007)] and [I] is the concentration of the inactivator.

Predictions for metabolism-dependent inhibitors of CYP3A4 used eq. 6 with a kdeg (hepatic) of 0.000321/min (Obach et al., 2007) and incorporated the contribution of gut metabolism of the P450 substrate (Fg) and the degradation rate constant for CYP3A in the enterocyte [kdeg[gut] = 0.000481/min (Obach et al., 2007)].

Retrospective Analysis.
Key parameters, including clinical and P450 inhibition data, for the GSK drugs used in this analysis are shown in Table 4. To assess the qualitative utility (occurrence) of each assumption of [I] in performing a DDI risk analysis, the observed and predicted DDIs were assigned as “positive” if AUCi/AUC ≥1.2 or otherwise were termed as “negative.” This AUCi/AUC threshold was selected to maximize our ability to make cautious decisions on the necessity for a clinical DDI study and approximates the FDA standards for bioequivalence and “weak” inhibition (FDA Guidance for Industry, 2006; http://www.fda.gov/downloads/Drugs/GuidanceComplianceRegulatoryInformation/Guidances/ucm072101.pdf). For every assumption of [I], each individual DDI prediction was assigned as a true positive (TP), true negative (TN), false positive (FP), or false negative (FN), depending on whether the drug interaction was predicted correctly, followed by determination of the sensitivity and specificity of each assumption of [I]. Sensitivity is a measure of the ability for the prediction approach to successfully identify a positive DDI, and it is defined as TP/(TP+FN). The specificity of a prediction approach is its ability to successfully identify a negative DDI, and it is defined as TN/(TN+FP).
In vitro and in vivo parameters for GSK drugs used in the retrospective analysis of DDI predictions
To assess the quantitative accuracy (magnitude) of each assumption of [I], a prediction error was calculated from the difference between each predicted AUC ratio and the observed AUC ratio. The prediction bias of each assumption was calculated as an average deviation (AD) of the predicted versus observed AUC ratios (eq. 7); the smallest value of AD representing the lowest prediction bias. The precision of each assumption was calculated as the root-mean-square error (RMSE) (eq. 8), the greater precision being shown by the lower RMSE value.


Results
Results from the qualitative analysis of this dataset are shown in Table 5. The assumptions of [I] achieving the optimal balance between sensitivity (correctly identifying positive DDIs) and specificity (correctly identifying negative DDIs) are those with the highest values in both categories. The data show that estimates of [I] based on total concentrations scored highly for sensitivity but at the expense of poor specificity, giving a bias toward classifying drugs as clinical perpetrators even when they are not. Correction for systemic protein binding generally improved the specificity with the highest sensitivity maintained for those estimates also incorporating inhibition of gut metabolism for CYP3A4 inhibitors. Unbound hepatic inlet and unbound liver concentrations, both incorporating gut contribution [[I] = fu.(hep_in + gut) and [I] = fu.(liver + gut), respectively], were the best performing assumptions of [I] in this analysis with 21 of 22 and 20 of 22 positive DDIs correctly identified, respectively, and 23 of 24 negative DDIs correctly identified. It is important to note here that although there were two occasions in which a positive clinical DDI was not predicted by either one or both of these best-performing assumptions, subsequent investigations revealed that GSK-10, casopitant, has a major metabolite, with approximately 80% of parent exposure, which is an even more potent inhibitor of CYP3A4 than parent (Zamuner et al., 2010). Likewise, GSK-20 (bupropion) is also known to produce several inhibitory metabolites that are likely to be responsible for the observed interaction with desipramine (Reese et al., 2008). Structures of casopitant and bupropion are shown in Fig. 1. Because this was a retrospective analysis based on parent in vitro inhibition data, metabolites were not initially included in the calculations. For both drugs, inclusion of P450 inhibition information for the metabolites into the predictive models would change these predictions to true positives.
Qualitative analysis of the accuracy of DDI predictions using various estimates of [I] in vivo

Chemical structures of casopitant and bupropion.
Results from the assessment of quantitative prediction accuracy are shown in Figs. 2 and 3 and summarized in Table 6. As already suggested by the qualitative analysis (above), all options of [I] uncorrected for protein binding showed an obvious trend for overprediction (Fig. 2). In contrast, incorporation of free drug fraction tended toward underprediction, and this was most evident for examples in which the contribution of intestinal CYP3A4 was ignored (Fig. 3). Closer examination of the predictive trends (Table 6) confirms that correction for protein binding caused a bias for underprediction (negative AD) in all cases except where [I] = fu.(liver + gut). The percentage of AUCi/AUC predictions within 2-fold of the observed values was highest (96%) for unbound liver ([I] = fu.liver) and unbound Cmax with gut contribution ([I] = fu.(Cmax + gut). However, some of these “within 2-fold” estimates actually failed the qualitative criteria (positive or negative). The highest percentage of AUCi/AUC predictions within 2-fold of observed values, and where the qualitative prediction accuracy was maintained (91%), were for [I] = fu.(hep_in + gut) and [I] = fu.(liver + gut).

Predicted versus observed AUCi/AUC ratios using various estimates of [I] in vivo uncorrected for protein binding. Open symbols represent reversible inhibitors; closed symbols represent metabolism-dependent inhibitors. Diagonal lines represent unity and 2-fold errors between predicted and observed data; lines crossing the axes at 1.2 represent the threshold for a positive DDI. A, predictions using [I] = blood Cmax ([I] = Cmax). B, predictions using [I] = Cmax with inclusion of gut contribution for CYP3A4 inhibitors ([I] = Cmax + gut). C, predictions using [I] = hepatic inlet (portal vein) concentration ([I] = hep_in). D, predictions using [I] = hepatic inlet with inclusion of gut contribution for CYP3A4 inhibitors ([I] = hep_in + gut). E, predictions using [I] = liver concentration ([I] = liver). F, predictions using [I] = liver concentrations with inclusion of gut contribution for CYP3A4 inhibitors ([I] = liver + gut).
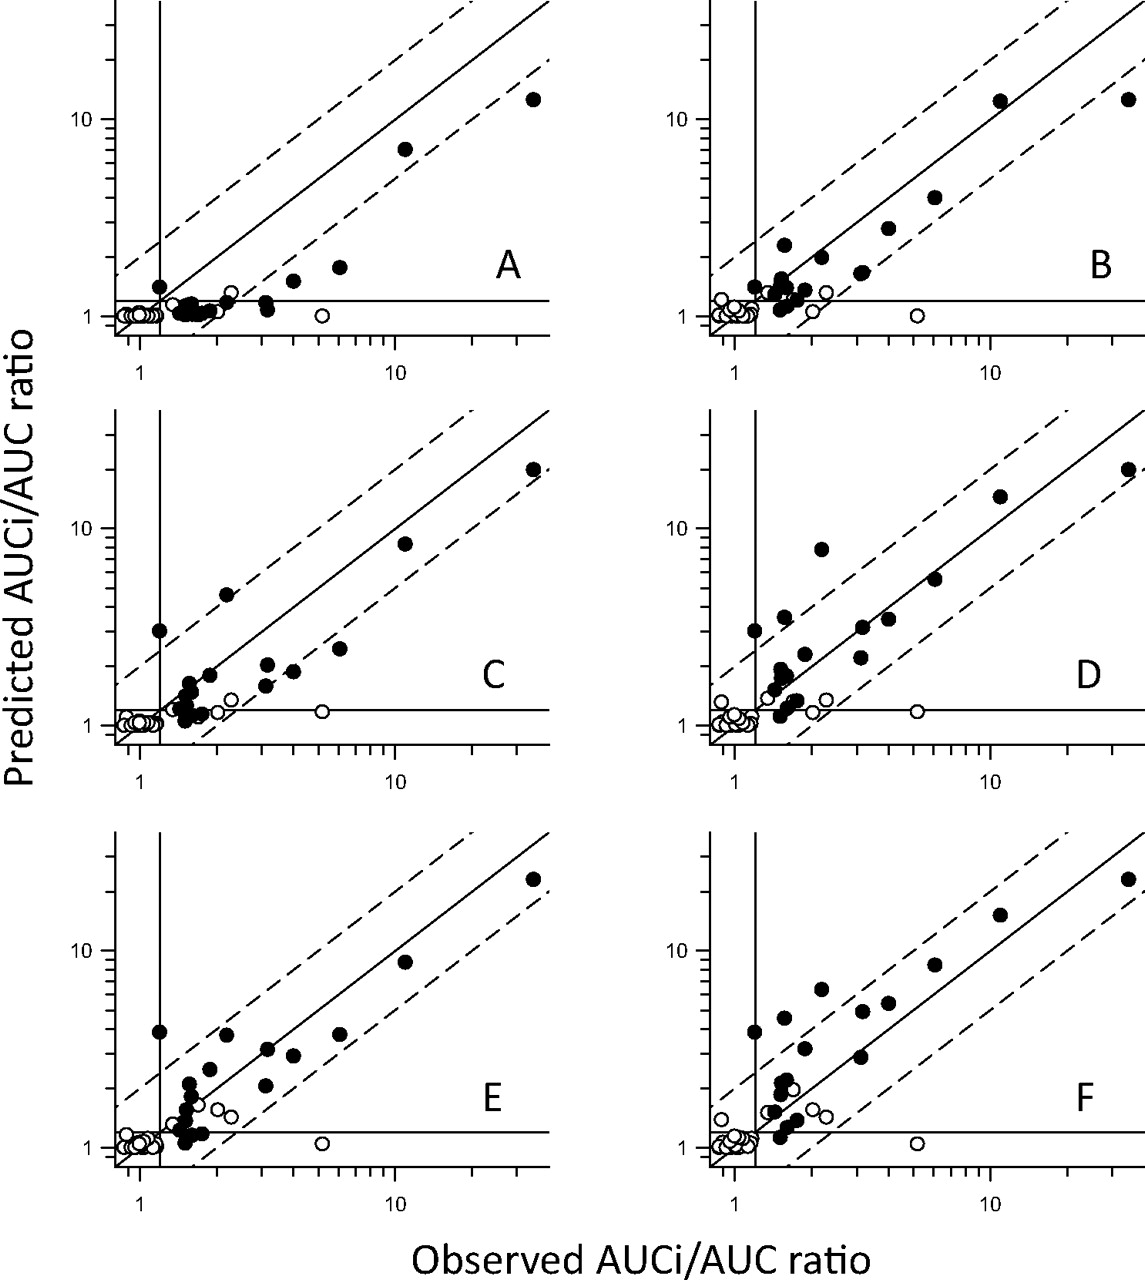
Predicted versus observed AUCi/AUC ratios using various estimates of [I] in vivo corrected for protein binding. Open symbols represent reversible inhibitors; closed symbols represent metabolism-dependent inhibitors. Diagonal lines represent unity and 2-fold errors between predicted and observed data; lines crossing the axes at 1.2 represent the threshold for a positive DDI. A, predictions using [I] = blood Cmax ([I] = Cmax). B, predictions using [I] = Cmax with inclusion of gut contribution for CYP3A4 inhibitors ([I] = Cmax + gut). C, predictions using [I] = hepatic inlet (portal vein) concentration ([I] = hep_in). D, predictions using [I] = hepatic inlet with inclusion of gut contribution for CYP3A4 inhibitors ([I] = hep_in + gut). E, predictions using [I] = liver concentration ([I] = liver). F, predictions using [I] = liver concentrations with inclusion of gut contribution for CYP3A4 inhibitors ([I] = liver + gut).
Statistical analysis comparing predictions of DDI magnitude (AUC ratio), using various estimates of [I] in vivo, with the AUC ratio observed
In summary, based on the qualitative analysis of this dataset, there were initially two potential estimates of [I] in vivo that gave the optimal balance of sensitivity and specificity, unbound liver and unbound hepatic inlet, both with the additional consideration of inhibition of gut metabolism for CYP3A4 [fu.(liver+gut) and fu.(hep_in + gut)]. When quantitative predictions of DDI magnitude were assessed, the same estimates of [I] in vivo were shown to be the best in terms of average deviation, error, and percentage within 2-fold of observed values. Ultimately, given that a degree of overprediction in the magnitude of a DDI is preferable to failure to identify a true clinical perpetrator, the slight trend for underprediction (AD = −0.21) for [I] = fu.(hep_in + gut) compared with a slight overprediction (AD = 0.12) for [I] = fu.(liver + gut) has lead us to select the latter as our default first choice estimate of [I] in vivo (acknowledging that the use of rat QWBA data as an estimate of liver/blood concentrations requires the assumption that hepatic uptake and tissue-binding characteristics are equivalent in rat and human). However, if rat QWBA data are not available, then [I] = fu.(hep_in + gut) may be used as a reasonable alternative.
It should be noted that other factors could also be incorporated into the equations for DDI predictions, e.g., IC50 or KI values may be corrected for nonspecific microsomal binding of the inhibitor (Gertz et al., 2008), or in vitro induction parameters may be included to produce a net-effect prediction (Fahmi et al., 2008). In this analysis, we did not correct the experimentally determined IC50 values for microsomal binding because experimentally generated data were not available (and experimentally determined LogP/D values, a prerequisite for accurate microsomal binding predictions, were also generally unavailable). However, to minimize any impact of nonspecific microsomal binding, we used a consistent, low protein concentration across all of the assays (0.1 mg/ml). The majority of drugs investigated in this analysis were known not to be inducers of P450s, and for the remainder appropriate induction data were not available, therefore induction potential was not accounted for in the equations used to predict DDIs. Including these factors could potentially increase the predictivity of the extrapolation approach currently described.
Discussion
A retrospective analysis of DDI predictions for a series of GSK drugs using mathematical models and various assumptions of [I] in vivo has been performed in comparison with results from clinical DDI studies conducted as part of GSK's development process. All in vitro data were generated in-house using standardized incubation conditions to minimize the impact of the experimental variability that is prevalent when comparing inhibition data from different literature sources.
This analysis has lead to our adoption of unbound liver concentrations (incorporating gut concentrations for CYP3A4 substrates) as our default selection of [I] in vivo for GSK P450 inhibitors. Unbound hepatic inlet (with gut) is a reasonable alternative in the absence of rat QWBA data.
Overall, our findings are in general agreement with published data (Obach et al., 2006, 2007; Einolf, 2007). Various authors have previously concluded that the incorporation of plasma protein binding effects into static models improves the accuracy of DDI predictions (Obach et al., 2006; McGinnity et al., 2008), although at least one report did not find that predictions were improved by this correction (Brown et al., 2006). There is still debate as to which estimate of [I] is the most appropriate and even how accurately DDIs can be predicted; for example, the FDA draft guidance for drug interaction studies (FDA Guidance for Industry, 2006; http://www.fda.gov/downloads/Drugs/GuidanceComplianceRegulatoryInformation/Guidances/ucm072101.pdf) advocates that a clinical DDI study be conducted if the [I]/Ki ratio >0.1, where [I] = total Cmax. It has also been reported that different estimates work better for different classes of inhibitor; for example, the differential use of unbound hepatic inlet Cmax for reversible inhibitors and unbound systemic Cmax for irreversible inhibitors and inducers (Obach, 2009). In this dataset, although we did include some drugs with demonstrated metabolism-dependent inhibition, the actual mechanism of inhibition (e.g., covalent binding, complex formation with heme, or reversibly inhibitory metabolites) had not been investigated, and therefore no such comparative analysis was performed. One interesting observation regarding the metabolism-dependent inhibitors was that all of them produced a positive DDI in the clinical interaction study, and they were responsible for the majority (80%) of the observed AUCi/AUC ratios >2.
For this predictive DDI model, there are several assumptions that have to be made, only one of which is an estimate of [I] in vivo. To identify the most effective surrogate for this parameter, we have optimized the other variables known to influence the predicted AUCi/AUC ratio. The fraction of inhibitor absorbed (systemically and into the enterocyte where applicable) was fixed at 1 for every prediction to represent a worst-case scenario; therefore, in situations in which the inhibitor absorption is not maximal, this value could lead to an overprediction of DDIs estimated using hepatic inlet concentrations for [I] and when incorporating intestinal inhibition. Because the absorption rate-constant is a value rarely determined, we have used a reasonable average value of 0.03 min−1 (Obach et al., 2006), but, again, this value affects predictions made using hepatic inlet concentrations and intestinal inhibition. For metabolism-dependent inhibition, the kdeg value will also influence the magnitude of the DDI prediction. For example, in our predictions we used an hepatic kdeg value for CYP3A4 of 0.000321 min−1 (Obach et al., 2007), although literature values vary quite widely, particularly for CYP3A4 where the reported half-life of the hepatic enzyme ranges from 10 to >100 h (Yang et al., 2008). Finally, there is the selection of substrate parameters, fm and Fg to be considered. For substrates of P450s other than CYP3A4, fm values can be back-calculated from eq. 2 using extensive- and poor-metabolizer PK data, assuming the poor-metabolizer phenotype is completely lacking in the appropriate P450 activity (Venkatakrishnan and Obach, 2005), or from DDI data with potent inhibitors (again, assuming that inhibition is complete and totally selective and estimates of [I] and Ki can be made for the inhibitor). For CYP3A4, fm values are more difficult to establish for several reasons including the lack of polymorphism, the fact that the AUC ratio from an oral DDI study will be due to the combination of fm and Fg, and because some of the potent inhibitors of CYP3A also inhibit other mechanisms. For example, itraconazole is often used as a clinical CYP3A4 inhibitor, but it has also been shown to be an inhibitor of P-glycoprotein (Olkkola et al., 1996; Keogh and Kunta, 2006; Tateishi et al., 2008); therefore, purely CYP3A4-mediated DDIs with itraconazole can only be inferred for drugs that are not also substrates of this transporter. Fg values reported for CYP3A4 substrates can also vary widely and are obtained using a variety of methods, which include the following: comparative PK in anhepatic patients, intravenous versus oral PK, and measuring the effects of grapefruit juice on a CYP3A4 substrate (presumed to inhibit only gut metabolism by CYP3A4). For example, literature values that we found for simvastatin Fg ranged from 0.08 (Lilja et al., 1998) to 0.66 (Obach et al., 2006), so for this analysis we selected a value of 0.29 from a reported grapefruit juice interaction study (Lilja et al., 2004) because this also represented the mean of the other reported values.
This retrospective analysis has shown that accurate qualitative and quantitative predictions of DDIs can be made based on in vitro data. This knowledge, together with a thorough interrogation of the comedication profile for a number of disease indications, has allowed us to refine our prospective risk analysis for potential P450 inhibitors and reduce the number of clinical DDI studies recommended, particularly in early drug development. A simple decision tree has been proposed (Fig. 4) that shows the stepwise points to be addressed to progress an investigational drug (new chemical entity; NCE) through development. This approach primarily supports internal decision making within GSK, and it is recommended that current regulatory guidance and decision trees are also consulted to support drug registration. First, the potential comedications for the target therapeutic area/population should be considered in conjunction with the intended dose, route, and regimen of the NCE. Factors to be considered include the therapeutic index of the victim drug (i.e., the margin between pharmacological efficacy and toxicity) and sensitivity to a single metabolic pathway. If P450 inhibition is expected to have little impact on the clinical development of the NCE, then there is no need to generate in vitro data before proof of concept (PoC). If potential P450-mediated DDIs would impact the progression of the NCE, then in vitro inhibition data are generated to enable the quantitative risk assessment using prospective predictions (based on IC50 or Ki and assumption(s) of [I] in vivo) described herein. If there is potential for a DDI with a magnitude of concern, then there are several options that can be considered. If all appropriate comedications can be excluded or managed during the PoC study, then a clinical DDI study can be delayed until after a positive PoC readout. If comedication exclusion, dose adjustment, or therapeutic monitoring is not possible, e.g., if the medication profile of the target population is poorly described, or if the indication is such that enrollment on the PoC study would be severely affected by such exclusion, then a clinical DDI study could still be considered before PoC. If a DDI study is conducted (and there may be cases in which a labeling recommendation can be made even without such a study), the results can be used as follows: 1) to refine any DDI predictions made for other P450/comedication combinations (because usually the DDI study will be performed with a standard clinical probe for the P450 most sensitive to inhibition by the NCE); and 2) to make informed decisions regarding final drug labeling recommendations.
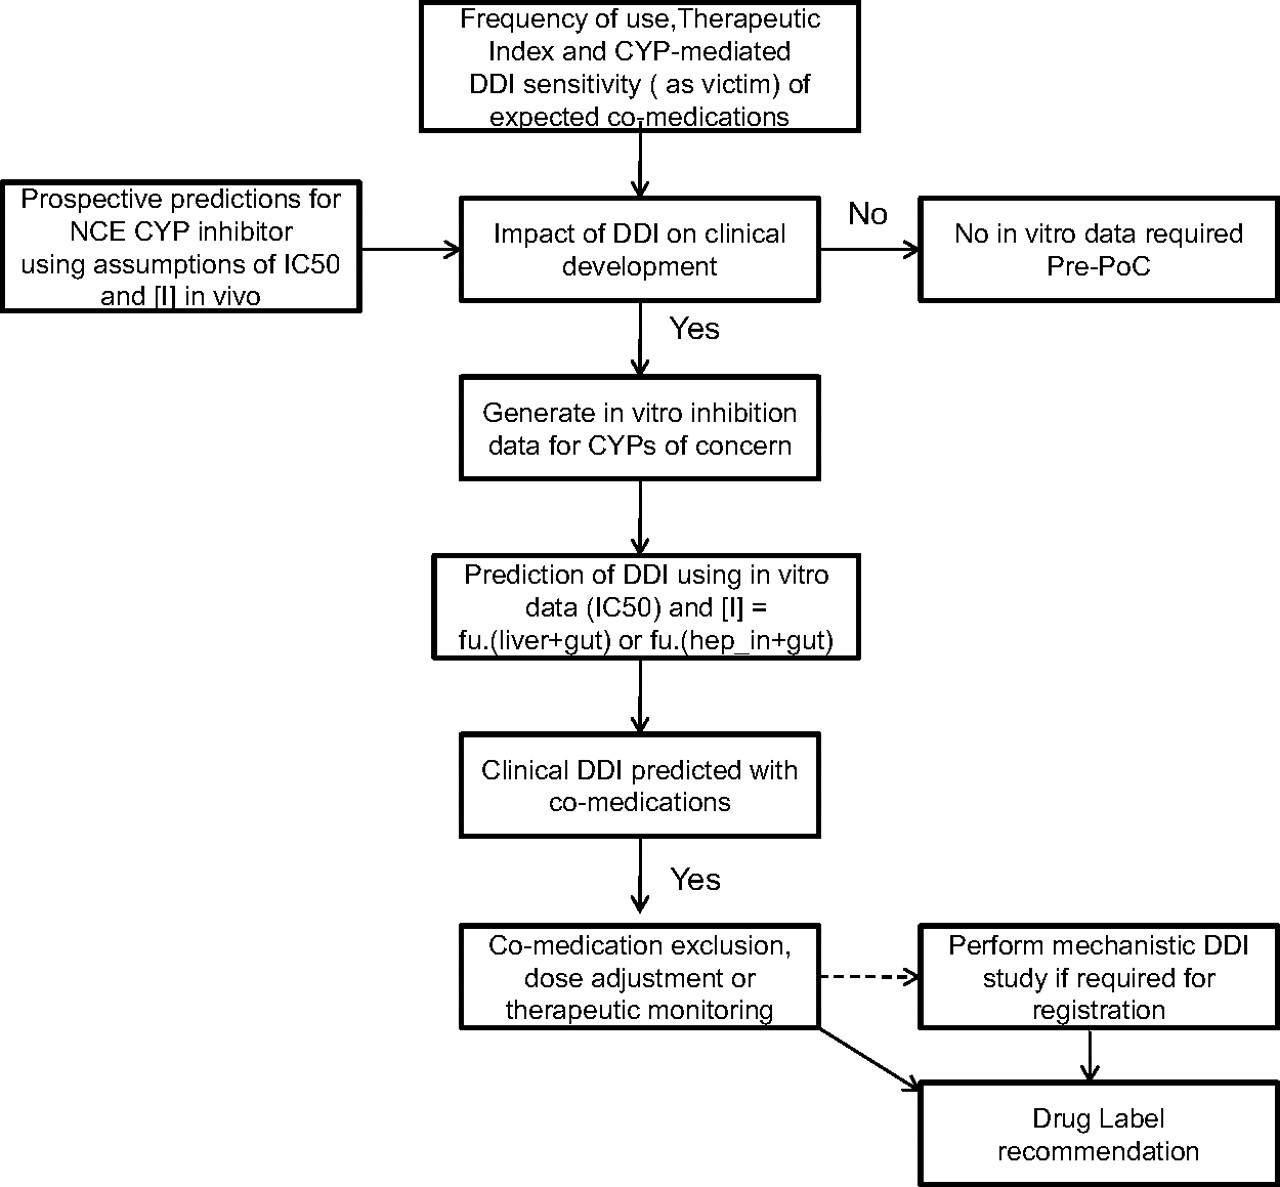
A decision tree for assessment of clinical DDI risk for a P450 (CYP) inhibitor during GSK's drug discovery and development process.
As stated above, this approach requires an in-depth knowledge of potential comedications for the target therapeutic indication and the P450s involved in the metabolism of these comedications. This type of risk analysis can be performed for multiple P450s (and other enzymes/transporters if the drug is sufficiently well characterized), and with this information it is possible to make informed decisions regarding the necessity and feasibility of comedication exclusion or drug monitoring during PoC. However, beyond PoC and for marketing, comedications in the general population would need to be considered. It may also be advantageous to consider dynamic modeling approaches for drugs later in clinical development when pharmacokinetic profiles are available and more complex questions can be addressed, e.g., aiding clinical study design and investigating the modulation of pharmacokinetics by multiple comedications, disease, and other demographic factors.
In conclusion, this retrospective study of a diverse set of drugs has indicated the value of quantitatively predicting the extent of drug interactions from in vitro P450 inhibition data. Although various assumptions are required for this approach, these can be optimized (e.g., using estimated unbound liver or hepatic inlet concentrations for [I] and factoring in inhibition of gut CYP3A4) to provide confidence in prospective predictions. The impact of this approach can be maximized by considering the therapeutic area of the drug in development and the drug interaction concerns of any common comedications. This strategy has significantly reduced the number of clinical drug interactions studies performed at GSK.
Authorship Contributions
Participated in research design: Shardlow, Generaux, MacLauchlin, Pons, Skordos, and Bloomer.
Conducted experiments: Shardlow, Generaux, MacLauchlin, and Pons.
Performed data analysis: Shardlow, Generaux, and Bloomer.
Wrote or contributed to the writing of the manuscript: Shardlow, Generaux, MacLauchlin, Pons, Skordos, and Bloomer.
Acknowledgments
We thank Drs. Andrew Ayrton and Joseph Polli for helpful discussion.
Footnotes
Article, publication date, and citation information can be found at http://dmd.aspetjournals.org.
doi:10.1124/dmd.111.039214.
-
ABBREVIATIONS:
- DDI
- drug-drug interaction
- P450
- cytochrome P450
- fm
- fraction substrate eliminated by a single (P450) pathway
- Fg
- gut availability (fraction of absorbed substrate escaping gut metabolism)
- PK
- pharmacokinetics
- GSK
- GlaxoSmithKline
- BCS
- Biopharmaceutics Classification System
- AUC
- area under the plasma or blood concentration vs time curve
- HLM
- human liver microsomes
- KI
- concentration of inhibitor required to achieve half-maximal inactivation
- Ki
- inhibition constant
- kinact
- maximal rate constant of enzyme inactivation
- QWBA
- quantitative whole-body autoradiography
- ka
- absorption rate constant
- Fa
- fraction of dose absorbed
- D
- dose
- Qh
- liver blood flow
- [I]
- concentration of inhibitor available to enzyme
- Qg
- intestinal blood flow
- kdeg
- rate constant for enzyme degradation
- AUCi/AUC
- ratio of AUC in presence and absence of inhibitor
- TP
- true positive
- TN
- true negative
- FP
- false positive
- FN
- false negative
- AD
- average deviation
- RMSE
- root-mean-square error
- NCE
- new chemical entity
- PoC
- proof of concept.
- Received March 28, 2011.
- Accepted August 10, 2011.
- Copyright © 2011 by The American Society for Pharmacology and Experimental Therapeutics


