


Abstract
Although the dog is frequently used in pharmacological, pharmacokinetic, and drug safety studies, little is known about canine drug transporters. Dog organic anion-transporting polypeptide (Oatp1b4) has recently been cloned (Comp Biochem Physiol C Toxicol Pharmacol 151:393–399, 2010), but the contribution of Oatp1b4 to hepatic uptake has yet to be clarified. This study compares the transport characteristics of dog Oatp1b4 with those of human OATP1B1/1B3 and demonstrates the importance of Oatp1b4 in the uptake of anionic compounds in dog hepatocytes. Oatp1b4 is the predominant Oatp in dog liver with expression levels double and 30 times those of Oatp2b1 and Oatp1a2, respectively. Uptake of a range of typical OATP substrates by Oatp1b4-expressing HEK293 cells was compared with that in fresh dog hepatocytes. All compounds tested were transported by Oatp1b4 and uptake intrinsic clearance (CLint, uptake) in dog hepatocytes in sodium-free buffer was correlated significantly with CLint, uptake in Oatp1b4-expressing cells. Dog in vivo clearance for five substrates was predicted more accurately from CLint, uptake than from metabolic intrinsic clearance (CLint, met), indicating that uptake governs the overall in vivo hepatic clearance of these anionic compounds in dog. The substrate specificities of dog Oatp1b4 appear to be similar to those of human OATP1B1/OATP1B3, whereas the relative uptake clearance of substrates for Oatp1b4 correlate better with OATP1B3 than with the more abundant hepatic analog OATP1B1.
Introduction
The liver is one of the major organs responsible for the clearance of xenobiotics. To cope with the detoxification of a large variety of compounds, a wide range of metabolic enzymes and uptake/efflux transporters are expressed in hepatocytes at specific locations (e.g., basal/apical membranes or within intracellular compartments), and their substrate specificities are known to be generally very broad (Hagenbuch and Gui, 2008). It is becoming increasingly apparent that the interplay between metabolism and transcellular vectorial transport from blood to bile by uptake transporters on the basal side and efflux transporters on the apical side, whose substrate specificities often overlap, plays a significant role in the efficient detoxification of many kinds of xenobiotics (Benet, 2009; Kusuhara and Sugiyama, 2009). Over the last decade or so, the study of transporters has yielded a substantial amount of literature, including many comprehensive reviews (Mizuno et al., 2003; Shitara et al., 2006) and, recently, the International Transporter Consortium (2010) has published a so-called “Food and Drug Administration transporter white paper,” in which they discussed selected important transporters, in vitro evaluation systems, and prediction methods of transporter-mediated drug interactions. In the human liver, organic anion-transporting polypeptides (OATP) 1B1 and 1B3 are responsible for the uptake of various anionic compounds including clinically used drugs (Hagenbuch and Meier, 2004). Recent reports indicate that genetic polymorphisms and drug interactions associated with these transporters affect the pharmacokinetics of several substrate drugs (Shitara et al., 2005; Ieiri et al., 2009).
For poorly permeable compounds, the overall hepatic intrinsic clearance of transporter substrates is often determined by uptake intrinsic clearance (CLint, uptake). A good correlation between the predicted hepatic clearances of OATP substrates, estimated using an in vitro uptake assay with hepatocytes, and observed hepatic clearances has been well characterized (Kusuhara and Sugiyama, 2009; Watanabe et al., 2009, 2010, 2011). Thus, OATP transporters are thought to play crucial roles as determinants of hepatic clearance of transporter substrates. Before the cloning of human OATPs, rodent Oatps had already been cloned and were well characterized (Meier et al., 1997; Hagenbuch and Meier, 2004): in rodents the major hepatic uptake transporters are Oatp1a1 and Oatp1a4 (orthologs of OATP1A2, which is expressed predominantly in human brain) and Oatp1b2, which is thought to be the single ortholog of human OATP1B1 and OATP1B3 (Hagenbuch and Meier, 2004). In contrast, although the dog is a species used frequently in pharmacological, pharmacokinetic, and drug safety studies, surprisingly little is known about canine drug transporters expressed in hepatocytes. Gui and Hagenbuch (2010) recently cloned and characterized dog Oatp1b4 (the single canine ortholog of human OATP1B1/1B3) and demonstrated sodium-independent transport of a range of typical OATP1B1 substrates such as sulfobromophthalein (BSP) and estrone-3-sulfate (E1S) and OATP1B3-specific substrates such as cholecystokinin octapeptide (CCK-8) (Ismair et al., 2001). Several articles have indicated that species differences exist with respect to transporter function and expression (Ninomiya et al., 2005; Yabuuchi et al., 2008; Ye et al., 2010) as has been well documented for cytochrome P450 enzymes (Martignoni et al., 2006). A key element to the drug discovery process is the ability to predict human dose and pharmacokinetic parameters using data derived from preclinical species. To obtain a high level of confidence in such predictions, the ability to predict accurately in vivo pharmacokinetic parameters, particularly clearance, in at least two preclinical species, typically rat and dog, is desirable. Analysis of species differences is key to our understanding of how best to interpret and use data obtained from the dog in extrapolation and prediction of events in humans such as absorption, distribution, metabolism, and elimination, pharmacokinetics, and toxicity. Thus, because OATP1B1 and OATP1B3 are thought to be responsible for the hepatic uptake of various kinds of organic anions, the transport properties of dog Oatp1b4 and human OATP1B1/1B3 were investigated by comparing the transport activities and kinetic parameters of 12 known substrates of human OATP1B1 and OATP1B3. Moreover, to assess the importance of dog Oatp1b4 in the hepatic disposition of a range of organic anions, uptake data obtained in dog hepatocytes were compared with dog in vivo pharmacokinetic data to determine whether in vivo clearance could be predicted accurately as reported previously for rats and humans (Watanabe et al., 2009, 2011). In addition, the uptake of substrate drugs in human embryonic kidney (HEK) 293 cells expressing dog Oatp1b4 was compared with that in freshly isolated dog hepatocytes.
Materials and Methods
Chemicals.
[3H]E1S (57.3 Ci/mmol), [3H]estradiol 17β-glucuronide (E2G) (45.2 Ci/mmol), [3H]dehydroepiandrosterone sulfate (DHEAS) (94.5 Ci/mmol), [3H]glibenclamide (50.2 Ci/mmol), and [3H]taurocholate (4.6 Ci/mmol) were purchased from PerkinElmer Life and Analytical Sciences (Waltham, MA and Cambridge, UK). [3H]CCK-8 (91 Ci/mmol) was purchased from GE Healthcare (Chalfont St. Giles, Buckinghamshire, UK). [3H]BSP (5.5 and 14 Ci/mmol) was synthesized by Hartmann Analytic GmbH (Braunschweig, Germany). [3H]Olmesartan (79 Ci/mmol), [3H]pravastatin (44.6 Ci/mmol), and unlabeled olmesartan and pravastatin were kindly donated by Daiichi-Sankyo Co., Ltd. (Tokyo, Japan). [3H]Pitavastatin (16 Ci/mmol) and unlabeled pitavastatin were kindly donated by Kowa Co., Ltd. (Tokyo, Japan). [3H]Valsartan (80.9 Ci/mmol) and unlabeled valsartan were kindly donated by Novartis Pharma K.K. (Basel, Switzerland). [3H]Rosuvastatin (79 Ci/mmol) and unlabeled rosuvastatin were kindly donated by AstraZeneca (Macclesfield, UK). Unlabeled pitavastatin, pravastatin, valsartan, olmesartan, and glibenclamide were purchased from Sequoia Research Products Ltd. (Oxford, UK). Unlabeled glibenclamide was purchased from Wako Pure Chemicals (Osaka, Japan). E1S, E2G, DHEAS, CCK-8, BSP, and taurocholate were purchased from Sigma-Aldrich (Poole, UK or St. Louis, MO). Unlabeled BSP was purchased from MP Biomedicals (Solon, OH). All other chemicals and reagents used were of the highest grade available and commercially available.
Quantification of mRNA Expression Level of Oatp1a2, Oatp2b1, and Oatp1b4 in Several Tissues in Dogs.
To quantify the mRNA expression of dog Oatp1a2, Oatp2b1, and Oatp1b4 in several tissues of beagle dogs, real-time quantitative PCR was performed using a LightCycler and the appropriate software (version 3.53; Roche Diagnostics, Mannheim, Germany) according to the manufacturer's instructions. The cDNA of various tissues from beagle dogs (Canis lupus familiaris) was purchased from BioChain Institute, Inc. (Hayward, CA). Primers for dog Oatp1a2, Oatp2b1, Oatp1b4, and GAPDH used in this study are as follows: Oatp1a2 forward primer, 5′-GGTTACATACATTTTGCAC-3′; Oatp1a2 reverse primer, 5′-CAAGCCAAGGTAGATGTATC-3′; Oatp2b1 forward primer, 5′-GACCACGACTTGCTCCGAA-3′; Oatp2b1 reverse primer, 5′-CTGTGGGCCAGAGGTGGATA-3′; Oatp1b4 forward primer, 5′-GGGATTTCTTACATTGACGA-3′; Oatp1b4 reverse primer, 5′-CACAGATCCCTGTATAAAGC-3′; GAPDH forward primer, 5′-AAGTCATCCATGACCACTTC-3′; and GAPDH reverse primer, 5′-GAAGCAGGGATGATGTTCTG-3′). PCR was performed using a SYBR Premix Ex Taq (perfect real time) (Takara Bio Inc., Shiga, Japan). The protocol for PCR was as follows: 95°C for 30 s, 40 cycles of 95°C for 5 s, 55°C for 10 s, and 72°C for 15 s. A standard curve was generated by dilutions of the target PCR product, which had been purified by agarose gel electrophoresis and had its concentration measured by PicoGreen dsDNA Quantification Reagent (Invitrogen, Carlsbad, CA). To confirm the amplification specificity, PCR products were subjected to a melting curve analysis and gel electrophoresis. The mRNA expression of dog Oatps was normalized by the mRNA expression of dog GAPDH.
Cloning of Dog Oatp1b4 from Beagle Dog Liver.
The total RNA of beagle dog liver was kindly donated by Associate Professor Kousei Ito (The University of Tokyo Hospital, and University of Tokyo, Tokyo, Japan). The RNA was used for reverse transcription with a reverse transcription (RT)-PCR kit [TaKaRa RNA PCR Kit (AMV) version 3.0; Takara Bio Inc., Kyoto, Japan]. To obtain dog Oatp1b4 cDNA, PCR was performed with the RT reaction mixture [forward primer 5′-CACCATGGCATCAATGCAGAAGCTGATCTCAGAGGAGGACCTGATGGACTCAAATCAACAG-3′ (Myc tag coding sequence underlined) and reverse primer 5′-TTACATATGTGTCTCATTGTC-3′] using Pfx Ultima DNA Polymerase (Invitrogen). Reactions took place for 35 cycles of 94°C for 15 s, 60°C for 30 s, and 68°C for 2 min. The sequence of the PCR product (approximately 2.0 kilobases) was confirmed using DNA sequencer (3130xl Genetic Analyzer; Applied Biosystems, Foster City, CA). The PCR product was cloned using a pENTR/Directional TOPO cloning kit (Invitrogen) and then was transferred to pcDNA-DEST 47 Gateway vector (Invitrogen) by LR Clonase reactions following the manufacturer's instructions.
Preparation of Dog Hepatocytes.
Fresh dog hepatocytes were obtained from two sources. Dog hepatocytes were either purchased from Abcellute (Cardiff, UK) or prepared in-house. Dog hepatocytes purchased from Abcellute were prepared from male beagle dogs of approximately 1 year of age, and the cells were preserved and shipped in SureTran media, allowing extended use over a period of days. The hepatocytes were reactivated from the SureTran media immediately before use according to the supplier's instructions. Dog hepatocytes isolated in-house were also from male beagle dogs of approximately 1 year of age. The isolation procedure was based on the two-step in situ collagenase perfusion method described in more detail in McGinnity et al. (2004). Previous studies have shown that the metabolic and transporter competencies did not differ significantly between the two sources of hepatocytes (data not shown).
Hepatocytes from both sources were resuspended for use in either sodium uptake buffer (12 mM NaCl, 5 mM KCl, 1 mM KH2PO4, 0.8 mM MgSO4, 1.8 mM CaCl2, 11 mM glucose, and 20 mM HEPES) or sodium-free uptake buffer (sodium uptake buffer but containing 12 mM choline chloride in place of 12 mM NaCl). Yield and viability were assessed using the trypan blue exclusion method and only batches with viability >80% were used.
Determination of CLint, uptake in Dog Hepatocytes.
Uptake of E1S, E2G, taurocholate, CCK-8, BSP, rosuvastatin, pitavastatin, pravastatin, valsartan, olmesartan, and glibenclamide was assessed a minimum of three times in independent batches of fresh dog hepatocytes. Uptake of each compound was measured in buffer containing sodium and in sodium-free buffer to determine the extent of sodium-dependent transport. The method was adapted from the centrifugal filtration technique of Petzinger and Fückel (1992). Aliquots of dog hepatocytes (0.5 ml) at 2 million viable cells/ml in both sodium and sodium-free buffer were preincubated at both 4 and 37°C for a minimum of 5 min. Compound stocks were prepared in sodium and sodium-free buffer as follows: pitavastatin, pravastatin, valsartan, olmesartan, glibenclamide, and rosuvastatin were prepared at 2 μM (double the final incubation concentration); E1S, E2G, BSP, and taurocholate were prepared at 2 μM but also contained a trace amount of the corresponding radiolabeled compound; and CCK-8 was prepared at 10 nM (final incubation concentration was 5 nM) using radiolabeled compound only. The final dimethyl sulfoxide concentration in the incubations did not exceed 1%.
Incubations were initiated by addition of 0.5 ml of substrate to the hepatocytes. Aliquots (100 μl) were removed at 10, 20, 30, and 40 s and dispensed into microtubes containing 150 μl of silicone oil (upper layer) and 15 μl of either potassium hydroxide (for radiolabeled compounds) or 4% cesium chloride (for nonradiolabeled compounds). The aliquots were immediately centrifuged at 7000g for 30 s in a Minispin centrifuge (Eppendorf, Cambridge, UK) to separate the cells from the media. Tubes were then immersed in liquid nitrogen and the tip of the microtube (containing the cell pellet) was removed by cutting and was collected. For radiolabeled samples the microtube tip was transferred to a scintillation vial, 5 ml of Ultima Gold scintillation fluid (PerkinElmer Life and Analytical Sciences, Cambridge, UK) was added, and vials were shaken overnight before analysis on a Packard 2200CA Tri-Carb liquid scintillation counter (PerkinElmer Life and Analytical Sciences, Cambridge, UK). For nonradiolabeled samples, the microtube tip was transferred to a plastic tube to which 200 μl of methanol was added, and each sample was mixed on a MixMate (Eppendorf) for 1 h (1650 rpm) to extract compound from the cell pellet. After addition of water (100 μl), samples were mixed and centrifuged, and the supernatant was collected for analysis as described below. Aliquots of the initial substrate stocks were also analyzed to correct for any nonspecific binding. The concentration of analyte in each sample was quantified using appropriate standard curves.
The uptake rate was calculated by subtracting the rate of uptake at 4°C from the rate of uptake at 37°C. CLint, uptake was calculated by dividing through by the measured substrate concentration.
Construction of HEK293 Cells Stably Expressing Dog Oatp1b4 and Cell Culture.
Dog Oatp1b4-expressing HEK293 cells and control cells were constructed by the transfection of expression vector and control vector, respectively, using FuGENE 6 reagent (Roche Diagnostics, Indianapolis, IN) according to the manufacturer's instruction. The transfected HEK293 cells were selected with 800 μg/ml Geneticin (G418 sulfate) (Promega, Madison, WI) for 3 weeks. Dog Oatp1b4-expressing or vector-transfected control HEK293 cells were grown in Dulbecco's modified Eagle's medium low glucose (Invitrogen) supplemented with 10% fetal bovine serum (Sigma-Aldrich) and 1% antibiotic-antimycotic solution (Invitrogen) at 37°C with 5% CO2 and 95% humidity. The culture protocol for human OATP1B1- and OATP1B3-expressing HEK293 cells was identical to that for Oatp1b4-expressing cells.
Transport Study Using Transporter Expression System.
The transport study was performed as reported previously (Hirano et al., 2004). In brief, transporter-expressing HEK293 cells were grown for 3 days in 12-well plates, coated with poly-l-lysine and poly-l-ornithine (Sigma-Aldrich) at a density of 1.5 × 10⁵ cells/well. For the transport study, the cell culture medium was replaced with culture medium supplemented with 5 mM sodium butyrate 1 day before the transport assay, to induce the expression of transporters. Uptake was initiated by the addition of Krebs-Henseleit buffer containing radiolabeled and unlabeled substrates, after the cells had been washed twice and preincubated with Krebs-Henseleit buffer at 37°C for 15 min. The Krebs-Henseleit buffer consisted of 118 mM NaCl, 23.8 mM NaHCO3, 4.8 mM KCl, 1.0 mM KH2PO4, 1.2 mM MgSO4, 12.5 mM HEPES, 5.0 mM glucose, and 1.5 mM CaCl2, adjusted to pH 7.4. Each compound was incubated at 0.1 μM in transporter-expressing HEK293 cells, and vector-transfected control cells and samples were taken at 0.5, 1, 2, and 5 min. Uptake was terminated at the designated times by the addition of ice-cold Krebs-Henseleit buffer after the removal of the incubation buffer. The cells were then washed three times with 1 ml of ice-cold Krebs-Henseleit buffer, solubilized in 500 μl of 0.2 N NaOH, and stored overnight at 4°C. Aliquots (600 μl) were transferred to scintillation vials after the addition of 250 μl of 0.4 N HCl. The radioactivity associated with the cells and the incubation buffer was measured with a liquid scintillation counter (LS6000SE; Beckman Coulter, Fullerton, CA) after the addition of 3 ml of scintillator (Clear-sol I; Nacalai Tesque, Kyoto, Japan) to the scintillation vials. The remaining 50 μl of cell lysate was used to determine the protein concentration by the method of Lowry et al. (1951) with bovine serum albumin as the standard.
Determination of CLint, uptake in Transporter-Expressing HEK Cells.
Uptake of each substrate was assayed a minimum of three times in transporter-expressing HEK cells (human OATP1B1 and OATP1B3 and dog Oatp1b4). Uptake of substrate was expressed as the uptake volume (microliters per milligram of protein), given as the amount of radioactivity associated with the cells (disintegrations per minute per milligram of protein) divided by its concentration in the incubation medium (disintegrations per minute per milliliter). Uptake clearance was obtained by subtracting the initial slope of the time-dependent uptake of compounds (between 0.5 and 2 min) in vector-transfected control cells from that of transporter-expressing cells. In every experiment, E2G was used as a reference compound, and data were normalized to the uptake rate of E2G to control for variations between experiments and because not all compounds were assessed in each experiment.
Saturation Kinetics of Substrate Uptake in Transporter-Expressing Cells.
To obtain the parameters for the saturation kinetics of the substrate uptake in transporter-expressing cells, uptake clearance was obtained at various concentrations of substrate in the medium. Kinetic parameters were calculated using eqs. 1 or 2, where v is the uptake velocity of the substrate (picomoles per minute per milligram of protein), S is the substrate concentration in the medium (micromolar concentration), Km is the Michaelis constant (micromolar concentration), Vmax is the maximum uptake rate (picomoles per minute per milligram of protein), and Pdif is the nonsaturable uptake clearance (microliters per minute per milligram of protein).

 Fitting was performed with a nonlinear least-squares method using the MULTI program (Yamaoka et al., 1981), and the damped Gauss-Newton algorithm was used for curve fitting. The input data were weighted as the reciprocals of the observed values. Selection of the appropriate equation for the fitting of each data was based on the minimum Akaike's information criterion.
Determination of Metabolic Intrinsic Clearance in Dog Hepatocytes.
Metabolic intrinsic clearance (CLint, met) was determined as described by Paine et al. (2008). In brief, pravastatin, pitavastatin, glibenclamide, olmesartan, and valsartan were incubated at 1 μM in 1 ml of dog hepatocytes at 1 × 10⁶ cells/ml for 90 min at 37°C. Aliquots (40 μl) were removed at 5, 15, 30, 45, 60, 75, and 90 min and quenched in 80 μl of ice-cold methanol. Samples were analyzed via liquid chromatography-MS/MS, and the resultant parent peak area was plotted against time, with CLint, met estimated from the elimination rate constant.
Determination of Plasma Protein Binding.
Plasma protein binding was measured using the method described previously in Paine et al. (2008). In brief, glibenclamide, olmesartan, pitavastatin, pravastatin, and valsartan (final concentration 10 μM) were added to pooled male beagle dog plasma (B and K Universal Ltd., Hull, UK) and placed on one side of the dialysis cell; the other side contained only buffer. Compounds were dialyzed through a 50-kDa membrane in a Dianorm rotating unit (Diachema, Langnau, Switzerland) for 18 h at 37°C. Aliquots from both chambers were quenched in methanol and analyzed as described below. The extent of binding was expressed as fraction unbound in plasma (fup) and was calculated by dividing the concentration of compound in the buffer side by the concentration of compound in the plasma side.
Determination of Blood/Plasma Concentration Ratio.
The blood/plasma concentration ratio (Rb) was determined using the method described previously in Paine et al. (2008). In brief, glibenclamide, olmesartan, pitavastatin, pravastatin, and valsartan were spiked into incubations of fresh dog blood and fresh plasma (0.5 ml) and shaken at 37°C in a waterbath. After 15 min, samples were centrifuged at 11,000 rpm for 4 min in a MSE MicroCentaur centrifuge (Thermo Fisher Scientific, Loughborough, UK), and aliquots of plasma from both the blood and plasma incubations were quenched into methanol. Before analysis, samples were centrifuged at 2000g for 20 min, and the supernatant was analyzed via liquid chromatography-MS/MS. The blood/plasma concentration ratio was calculated by dividing the peak area from directly spiked plasma by the peak area from plasma isolated from spiked blood.
Determination of Fraction Unbound in the Incubation.
Fraction unbound in the incubation (fuinc) of glibenclamide, olmesartan, pitavastatin, pravastatin, and valsartan was predicted using eq. 3 (Austin et al., 2005).

In Vivo Studies.
All in vivo work was subject to internal ethics review and conducted in accordance with Home Office requirements under the Animal Scientific Procedures Act of 1986. Healthy male beagles (bred in-house) were housed in pairs in a controlled environment (temperature 18 ± 2°C and humidity 55 ± 10%). They were fed with a SDS D3 (E) Dog Maintenance diet and had access to water ad libitum. They were fully vaccinated and wormed and had daily access to an external play area for exercise and socialization. For bile duct-cannulated dogs: after at least 4 weeks of acclimatization, a chronic bile duct cannulation was performed following the technique described by Kissinger and Garver (1998). Dogs were allowed to recover from surgery for a minimum of 1 month.
Intravenous Pharmacokinetic Studies.
Glibenclamide, olmesartan, and pravastatin were dosed as a cassette to two conscious male beagle dogs at a low dose of 0.3 mg/kg of each compound as a 30-min infusion to the jugular vein in 1:9 hydroxyl propyl β-cyclodextrin-saline. Pitavastatin and valsartan were dosed separately to two bile duct-cannulated dogs at 1 mg/kg as a 30-min infusion to the jugular vein in 1% sodium bicarbonate (pitavastatin) or 1:9 hydroxyl propyl β-cyclodextrin-saline (valsartan). Urine was collected from all dogs, and serial blood samples (approximately 500 μl) were taken and centrifuged to obtain plasma. Plasma and urine were dispensed into 50-μl aliquots and 150 μl of methanol (containing internal standard) was added and mixed. The concentration of analyte in each sample was quantified using appropriate standard curves and quality control samples. Pharmacokinetic parameters [clearance, volume of distribution at steady-state (Vss), and terminal half-life] were estimated from the concentration-time profile by noncompartmental analysis using WinNonlin Enterprise (version 5.2.1; Pharsight, Mountain View, CA). Renal clearance was estimated by measuring the percentage of total dose excreted unchanged in urine and expressing this as a clearance relative to total clearance.
Sample Preparation and Analysis.
In vivo and nonradiolabeled in vitro samples were analyzed via ultraperformance liquid chromatography-MS/MS using an Acuity UPLC system linked to a Platinum Ultima (Waters, Manchester, UK) using electrospray ionization in negative or positive ionization mode with data analysis on MassLynx version 4.1 software (Waters). Cone voltage and collision energy were optimized for each compound. Chromatographic separation was achieved using an Acuity BEH C18 column (50 × 2.1 mm, 1.7 μm) (Waters) using 10 μl of each sample. The mobile phase consisted of an aqueous phase of water with 0.1% (v/v) formic acid and an organic phase of methanol with 0.1% (v/v) formic acid. Samples were quantified using appropriate calibration curves, and quality controls were prepared in the equivalent blank matrix for each analysis.
Prediction of In Vivo Clearance in Dogs from In Vitro Data.
Dog in vivo metabolic clearance (CLdog) was predicted using the well stirred model with a regression applied similar to the methodology described by Riley et al. (2005). The regression provides a scaling factor, which describes the offset between log predicted unbound in vivo CLint (CLint, ub) and log observed in vivo CLint, ub in dog and was developed in-house previously using AstraZeneca compounds and marketed drugs (eq. 4). The data set of the 24 compounds used to form the regression equation was published previously by Grime and Riley (2006).
 where A represents a scaling factor (6.2) incorporating hepatocellularity and grams of liver per kilogram of body weight in dog and also converts the volume term from microliters to milliliters. Predicted CLdog from CLint, met was calculated for glibenclamide, olmesartan, pitavastatin, pravastatin, and valsartan by applying the regression (eq. 4) to CLint, met and then inserting the CLint, ub value into eq. 5, where Q is hepatic blood flow (40 ml · min−1 · kg−1), fup is fraction unbound in dog plasma, fuinc is the unbound fraction in the incubation, and Rb is the blood/plasma concentration ratio.
 To predict CLdog from dog hepatocyte uptake data, CLint, uptake determined using sodium-containing buffer was used to account for any sodium-dependent transport that may occur in vivo. CLdog was predicted by using unbound CLint, uptake in eq. 4 (in place of CLint, met) and inserting the regression corrected CLint, ub into eq. 5 as before but assuming that fuinc was equal to 1 because the uptake media was protein-free and binding was expected to be negligible.
Results
mRNA Expression Levels of Dog Oatp1a2, Oatp2b1, and Oatp1b4 in Various Tissues in Dogs.
The relative mRNA expression levels of dog Oatp1a2, Oatp2b1, and Oatp1b4 were determined by real-time quantitative RT-PCR using cDNA of various tissues from beagle dog as a template (Fig. 1). Levels represent triplicate readings of one batch of cDNA prepared from a single beagle dog donor. Levels of mRNA expression of dog Oatp1a2, Oatp2b1, and Oatp1b4 were detected in a range of tissues, but by far the highest expression was in the liver (Fig. 1, A–C). In comparing the relative expression ratio of dog Oatps in liver when dog Oatp1b4 was set to 1, the relative mRNA expression of dog Oatp2b1 was 0.42, and Oatp1a2 was 0.0276-, 2.4-, and 36-fold lower than Oatp1b4 expression, respectively (Fig. 1D).

Tissue distribution of mRNA expression level of dog Oatp1a2, Oatp2b1, and Oatp1b4. The expression level of dog Oatp1a2 (A), Oatp2b1 (B), and Oatp1b4 (C) was determined by real-time quantitative RT-PCR using cDNA of various tissues from beagle dogs (Canis lupus familiaris). The expression level was normalized by the content of GAPDH measured in the same sample. The relative expression level of dog Oatps in liver (D) was calculated when the expression level of dog Oatp1b4 was set to 1. Each column represents the mean ± S.E. of triplicate readings of tissue from a single beagle dog donor. N.D., not detected.
Saturable Uptake of OATP Substrates in Dog Oatp1b4-Expressing HEK293 Cells.
The uptake of the known OATP1B1 and OATP1B3 substrates (BSP, E2G, DHEAS, taurocholate, glibenclamide, pitavastatin, pravastatin, olmesartan, and valsartan), OATP1B1-specific substrate (E1S), and OATP1B3-specific substrate (CCK-8) in dog Oatp1b4-expressing HEK293 cells was significantly higher compared with that in vector-transfected control cells. The uptake clearance for each compound was calculated on the basis of the slope of the uptake between 0.5 and 2 min because the linear time-dependent uptake of almost all of the compounds we tested was maintained for 2 min (data not shown). BSP had the highest CLint, uptake of 99.5 ± 15.9 μl · min−1 · mg protein−1. The concentration dependence of the uptake of the compounds tested was then investigated in dog Oatp1b4-expressing HEK293 cells (Fig. 2). The CLint, uptake of pravastatin, rosuvastatin, and CCK-8 was too low to accurately estimate the saturation kinetic parameters (pravastatin, 2.37 ± 0.83 μl · min−1 · mg protein−1; rosuvastatin, 4.51 ± 0.73 μl · min−1 · mg protein−1; and CCK-8, 4.09 ± 0.99 μl · min−1 · mg protein−1). The saturable uptake of BSP, E1S, and pitavastatin could be described by one saturable component (Fig. 2, A, C, and G) judged from the shape of Eadie-Hofstee plots. However, one saturable and one nonsaturable component could be accounted for in the dog Oatp1b4-specific uptake of DHEAS, E2G, glibenclamide, olmesartan, taurocholate, and valsartan determined by the subtraction of their uptake rates in control cells from those in dog Oatp1b4-expressing cells (Fig. 2, B, D–F, H, and I). Their kinetic parameters are summarized in Table 1.

Eadie-Hofstee plots for the uptake of BSP (A), DHEAS (B), E1S (C), E2G (D), glibenclamide (E), olmesartan (F), pitavastatin (G), taurocholate (H), and valsartan (I) by dog Oatp1b4-expressing HEK293 cells. The uptake of BSP for 1 min, E1S for 0.5 min, E2G for 1 min, DHEAS for 0.5 min, taurocholate for 1 min, glibenclamide for 1 min, pitavastatin for 1 min, valsartan for 1 min, and olmesartan for 1 min was determined at various concentrations (0.01–100 μM BSP, 0.01–100 μM E1S, 0.01–100 μM E2G, 0.1–300 μM DHEAS, 0.1–1000 μM taurocholate, 0.01–100 μM glibenclamide, 0.01–100 μM pitavastatin, 0.1–300 μM valsartan, and 0.1–300 μM olmesartan). The dog Oatp1b4-mediated transport was calculated by subtracting the uptake in vector-transfected control cells from that in dog Oatp1b4-expressing cells. The dotted lines are fitted curves calculated by the nonlinear least-squares method based on eq. 1 or 2, as described under Materials and Methods. Each point represents the mean ± S.E. (n = 3). Where vertical and/or horizontal bars are not shown, the S.E. values are within the limits of the symbols.
Kinetic parameters for the uptake of various compounds in dog Oatp1b4-expressing HEK293 cells
Time-Dependent Uptake of Organic Anions in Dog Hepatocytes.
Uptake of taurocholate, E1S, E2G, BSP, pitavastatin, pravastatin, rosuvastatin, olmesartan, valsartan, and glibenclamide was assessed at 1 μM in fresh dog hepatocytes with the exception of CCK-8 (10 nM). Each compound was incubated in the presence and absence of sodium to assess the contribution of sodium-dependent transport. The organic anions studied were all taken up by dog hepatocytes to varying degrees as illustrated by uptake at 37°C exceeding that at 4°C by at least 2-fold. The linear time-dependent uptake of all of the compounds tested was maintained for at least 1 min (data not shown). CLint, uptake in dog hepatocytes of these organic anions in both sodium-containing and sodium-free uptake buffer is shown in Fig. 3. BSP and glibenclamide were the best transported substrates with CLint, uptake estimates of 107 ± 41 and 131 ± 88 μl · min−1 · 106 cells−1, respectively, in sodium buffer and 142 ± 22 and 113 ± 66 μl · min−1 · 106 cells−1 in sodium-free buffer, respectively. The poorest substrates were pravastatin and CCK-8 with CLint, uptake values of 4 ± 2 and 8 ± 9 μl · min−1 · 106 cells−1 in sodium buffer and 3 ± 2 and 3 ± 2 μl · min−1 · 106 cells−1 in sodium-free buffer, respectively. Although the data were variable between batches, the rank order of CLint, uptake in each batch varied very little with only minor changes in rank order noted for compounds that had similar CLint, uptake values. Taurocholate CLint, uptake decreased significantly when sodium was removed from the incubation buffer from 73 ± 28 to 6 ± 3 μl · min−1 · 106 cells−1 (Fig. 3).
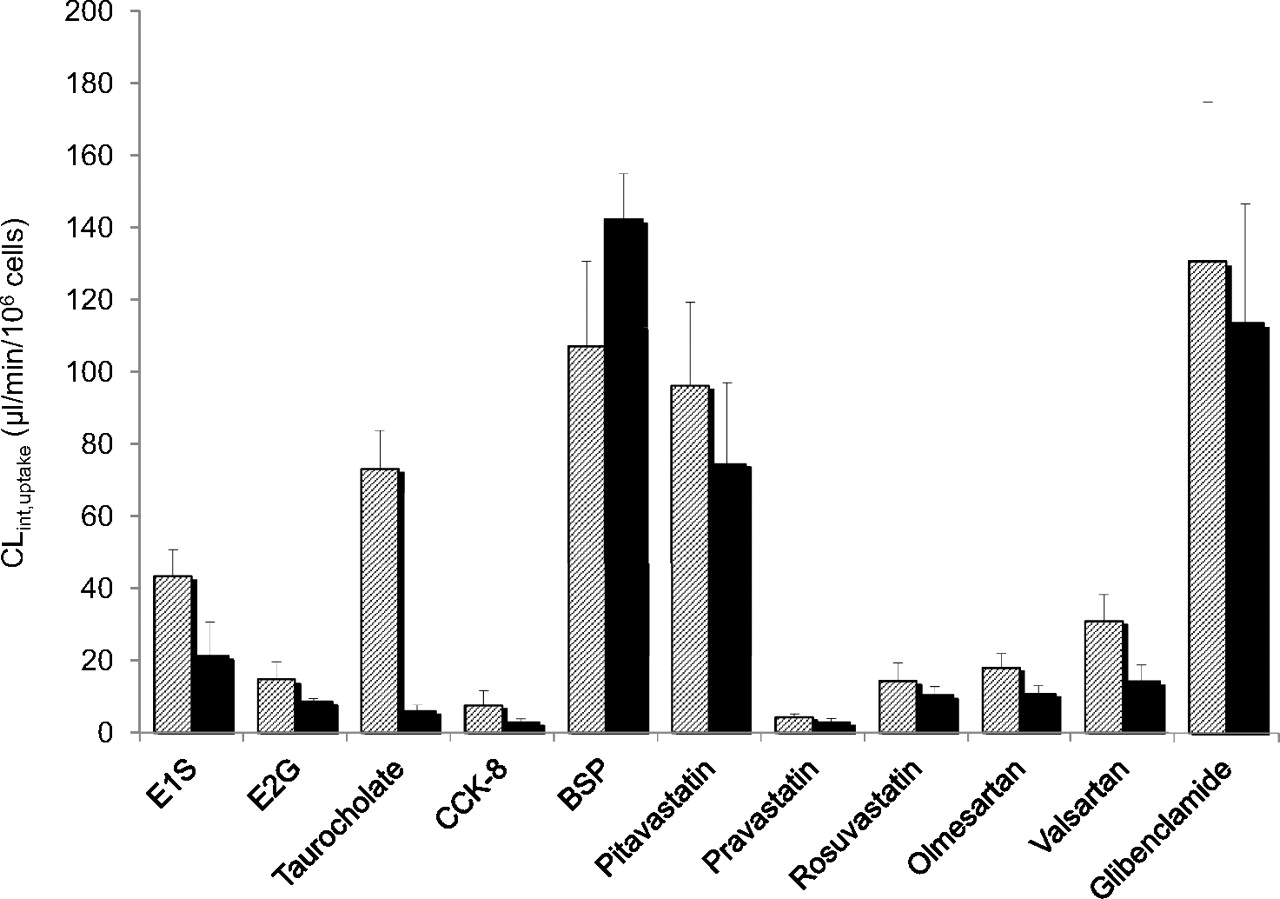
Comparison of CLint, uptake in fresh dog hepatocytes for E1S, E2G, taurocholate, CCK-8, BSP, pitavastatin, pravastatin, rosuvastatin, olmesartan, valsartan, and glibenclamide. Hatched bars represent data generated using sodium-containing uptake buffer; solid bars represent data generated using sodium-depleted uptake buffer. Each bar represents the mean ± S.E. of a minimum of three replicates.
Comparison of CLint, uptake between Oatp1b4-Expressing HEK293 Cells and Dog Hepatocytes.
Dog hepatocyte CLint, uptake, determined in sodium-free buffer to minimize the interference of sodium-dependent transport, was compared with CLint, uptake obtained in dog Oatp1b4-expressing HEK cells for E1S, E2G, taurocholate, CCK-8, BSP, glibenclamide, rosuvastatin, pravastatin, pitavastatin, valsartan, and olmesartan (Fig. 4). A strong correlation was observed between dog hepatocyte CLint, uptake and Oatp1b4-expressing cells CLint, uptake (r2 = 0.7; p < 0.01).
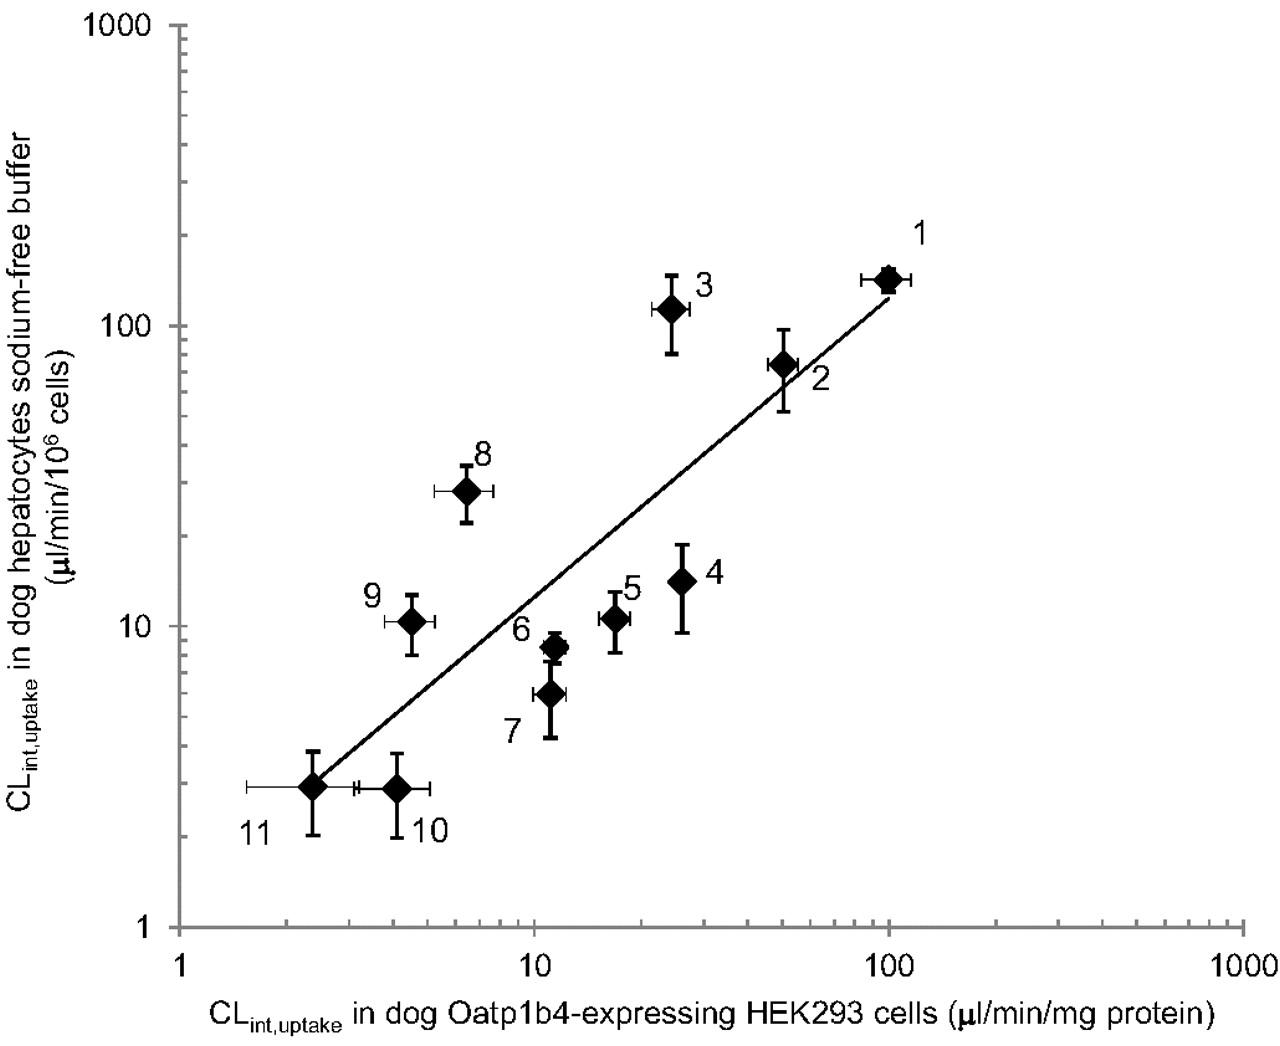
Correlation between CLint, uptake determined in fresh dog hepatocytes using sodium-free uptake buffer and CLint, uptake determined in HEK293 cells expressing dog Oatp1b4 (r2 = 0.7; p < 0.01). 1, BSP; 2, pitavastatin; 3, glibenclamide; 4, valsartan; 5, olmesartan; 6, E2G; 7, taurocholate; 8, E1S; 9, rosuvastatin; 10, CCK-8; and 11, pravastatin. Each point represents the mean ± S.E. of a minimum of three replicates.
Prediction and Determination of In Vivo Nonrenal Clearance in Dogs.
Dog in vivo clearance was determined in-house for glibenclamide, olmesartan, pitavastatin, pravastatin, and valsartan after a single low-dose intravenous infusion over 30 min and was corrected for any renal excretion detected to determine a nonrenal clearance value (Table 2). For the prediction of dog metabolic clearance (CLdog) values for fup, fuinc, Rb, and CLint, met were determined (Table 2). CLdog was predicted using the well stirred model as described under Materials and Methods from dog hepatocyte CLint, met and also from dog hepatocyte CLint, uptake (Table 2).
Observed dog in vivo clearance and prediction of dog in vivo clearance from dog hepatocyte CLint, met and CLint, uptake
Correlation of Relative Uptake Ratios and Km Values of Substrates among Dog Oatp1b4, Human OATP1B1, and OATP1B3.
To examine whether a species difference between the transport properties of dog Oatp1b4, human OATP1B1, and OATP1B3 was observed, relative uptake ratios and Km values of substrates in dog Oatp1b4 obtained from the present study (Fig. 2; Table 1) were compared with those in human OATP1B1 and OATP1B3. To compare the uptake clearance of organic anions in different expression systems directly, the relative uptake ratios of organic anions for dog Oatp1b4, human OATP1B1, and OATP1B3 were defined as the ratio of CLint, uptake of each compound to that of E2G. As the results in Fig. 5 show, the relative uptake ratios in dog Oatp1b4 show good correlation with those in human OATP1B3, but there was no significant correlation with those in human OATP1B1.
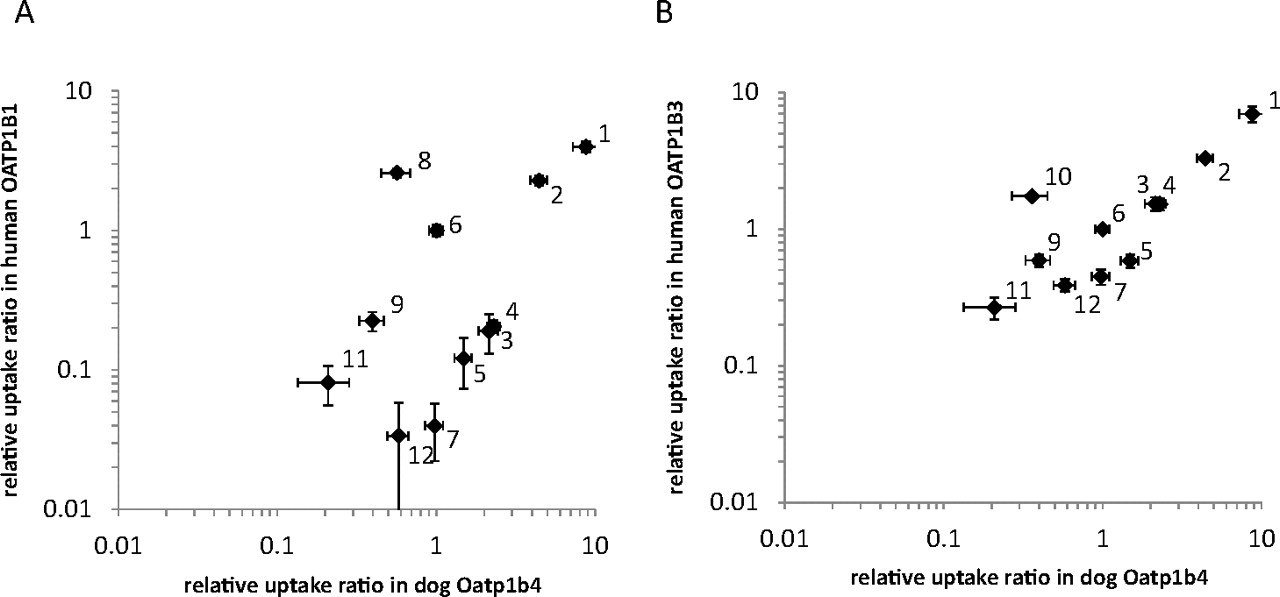
Correlation of relative uptake ratios between dog Oatp1b4 and human OATP1B1 (A) and human OATP1B3 (B). Uptake clearance was obtained by subtracting the initial slope of the time-dependent uptake of compounds in dog Oatp1b4-, human OATP1B1-, and human OATP1B3-expressing cells by that in vector-transfected control cells. The relative uptake ratio was calculated by dividing the uptake clearance of compounds by that of E2G. In every experiment, E2G was used as a reference compound to check the transport activity by dog Oatp1b4-, human OATP1B1-, and human OATP1B3-expressing cells. Each point represents the mean ± S.E. (n = 3). Where vertical and/or horizontal bars are not shown, the S.E. values are within the limits of the symbols. 1, BSP; 2, pitavastatin; 3, glibenclamide; 4, valsartan; 5, olmesartan; 6, E2G; 7, taurocholate; 8, E1S; 9, rosuvastatin; 10, CCK-8; 11, pravastatin; and 12, DHEAS.
As for the affinity of compounds to dog Oatp1b4, human OATP1B1, and OATP1B3, Km values of all organic anions for dog Oatp1b4 were related with those for human OATP1B3 (within 10-fold). However, Km values of E1S and BSP for dog Oatp1b4 were relatively higher than those for human OATP1B1 (Fig. 6).
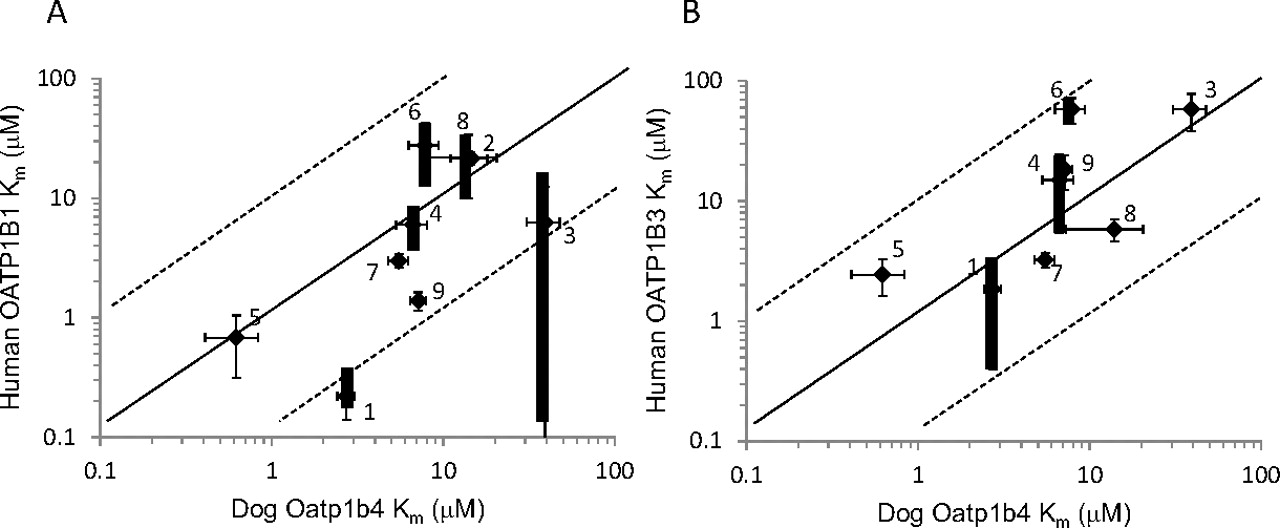
Correlation of Km values between dog Oatp1b4 and human OATP1B1 (A) and human OATP1B3 (B). The solid line represents the line of unity, and the dotted lines represent the lines of 1:10 and 10:1 correlations. The Km value of compounds in dog Oatp1b4 represents the mean ± computer-calculated S.D. The Km value of substrates in human OATP1B1 and OATP1B3 represents the mean ± computer-calculated S.D. or the median ± range of Km values reported previously. The bold error bar represents the range of reported values, and the thin error bar represents the computer calculated S.D. value of the reported value if only one report was found. 1, BSP; 2, DHEAS; 3, E1S; 4, E2G; 5, glibenclamide; 6, olmesartan; 7, pitavastatin; 8, taurocholate; and 9, valsartan.
Discussion
In preclinical development, the pharmacokinetic and safety profile of a drug is studied in vivo, most often using the rat and a second, higher, species such as dog (or less frequently cynomolgus monkey) before progressing to humans. Hepatic drug transporters are now known to affect pharmacokinetics, especially clearance, and drug-drug interactions. An analysis and understanding of species differences in drug transporter expression and function is therefore key to successful drug development. Much has been published on human and rodent transporters and key differences are reasonably well understood. In contrast, there are only limited publications for dog: Rose et al. (2006) showed differences in taurocholate disposition in dog and monkey hepatocytes using glyburide (glibenclamide) and cyclosporine as modulators and Ye et al. (2010) demonstrated differences between rat, dog, pig, and human hepatocyte uptake of a bile salt analog using a range of HIV protease inhibitors as modulators.
Because of the limited literature on dog hepatic transporters, this study characterized the contribution of dog Oatp1b4 to the disposition of organic anions and assessed whether these data can be used to improve in vivo clearance projections. This work focused on Oatp1b4, which is believed to be the single ortholog of human OATP1B1 and OATP1B3 because these are the major transporters involved in the uptake of organic anions in humans. The data presented confirm Oatp1b4 to be the most abundantly expressed ortholog in dog liver; thus, it is reasonable to assume that it is likely to have an impact on absorption, distribution, metabolism and elimination/toxicology processes.
The uptake of a range of organic anions, chosen because they are substrates of OATP1B1 and/or OATP1B3 was studied in fresh dog hepatocytes and Oatp1b4-expressing HEK cells. All substrates assessed were actively taken up into dog hepatocytes: CLint, uptake in fresh dog hepatocytes ranged from 4 to 131 μl · min−1 · 106 cells−1 for pravastatin and glibenclamide, respectively, in sodium-containing buffer. Taurocholate was a good substrate (CLint, uptake of 73 μl · min−1 · 106 cells−1 in sodium-containing buffer), consistent with data reported by Rose et al. (2006). To determine the extent of sodium-dependent transport, CLint, uptake was also measured in sodium-free buffer. There was a trend for CLint, uptake in sodium-free buffer to be lower than CLint, uptake measured in sodium-containing buffer (Fig. 3). This observation is consistent with observations by Gui and Hagenbuch (2010). Taurocholate showed a significant decrease in CLint, uptake in sodium-depleted buffer, which was not unexpected because taurocholate is a well documented substrate of the sodium-dependent transporter sodium taurocholate-cotransporting polypeptide and mainly taken up into hepatocytes in a sodium-dependent manner (Mizuno et al., 2003). The identification of dog sodium taurocholate-cotransporting polypeptide has not yet been reported, but previous studies have also demonstrated sodium-dependent transport in dog hepatocytes (Ye et al., 2010).
Data among dog hepatocyte batches were variable; the coefficient of variation ranged from 38 to 120% for the 11 substrates across four independent batches of dog hepatocytes. The variability may be due to the quality of the dog hepatocyte preparation caused by the isolation procedure but could also reflect endogenous variability within the dog. Little is known about endogenous variability of transporters, even for other species, and it is difficult to separate these two issues and identify the root cause of hepatocyte data variability. Although data varied, the rank order of CLint, uptake for the 11 substrates changed very little among batches.
All substrates studied were actively taken up by Oatp1b4-expressing HEK cells. CLint, uptake ranged from 2.4 to 100 μl · min−1 · mg protein−1 for pravastatin and BSP, respectively. Gui and Hagenbuch (2010) demonstrated that dog Oatp1b4-expressing HEK cells were able to transport E2G, E1S and taurocholate in a sodium-independent manner and that CCK-8 and BSP were substrates, which is consistent with our data. CLint, uptake values of ∼7.7 and ∼9.4 μl · min−1 · mg protein−1 for the uptake of E2G and E1S can be estimated from their data. The E2G and E1S CLint, uptake values were not much different from our data presented here (11 and 6.4 μl · min−1 · mg protein−1). A strong correlation (r2 = 0.7) was observed between dog hepatocyte CLint, uptake and dog Oatp1b4 CLint, uptake, indicating that dog Oatp1b4 is therefore likely to be the major transporter associated with transport of these organic anions in dog liver.
Total in vivo clearance and renal clearance of glibenclamide, olmesartan, pitavastatin, pravastatin, and valsartan was determined in dog (Table 2). Morrison and Singhvi (1996) reported pharmacokinetic parameters for pravastatin clearance of 8.5 ml · min−1 · kg−1, of which renal clearance was 1.5 ml · min−1 · kg−1, which agree well with our observations of total clearance of 12 ml · min−1 · kg−1 with a renal clearance of 3 ml · min−1 · kg−1. In vivo metabolic clearance (CLdog) predicted from CLint, met resulted in a significant underprediction of nonrenal clearance for valsartan, olmesartan, and pitavastatin, but pravastatin and glibenclamide nonrenal clearance were both well predicted (Table 2). To determine whether clearance could be more accurately predicted using in vitro uptake data, CLdog was also predicted from CLint, uptake by incorporating it into the well stirred model as described under Materials and Methods. Prediction of CLdog from CLint, uptake determined in dog hepatocytes was significantly improved for valsartan, olmesartan, and pitavastatin, and predicted clearances were now within 2.5-fold of observed values. The predicted clearance for pravastatin did not change significantly between the two methods and was always within 2-fold of observed values. Pravastatin CLint, met and CLint, uptake in dog hepatocytes were both low (1.2 and 4 μl · min−1 · 106 cells−1) because pravastatin was a poor uptake substrate in dog hepatocytes. Despite the low CLint, uptake, this result does not indicate that transport processes are unimportant in the overall clearance of pravastatin because, combined with its high free fraction, pravastatin is a moderately high-clearance compound. Of interest, glibenclamide clearance was significantly overpredicted from hepatocyte CLint, uptake (8.4 ml · min−1 · kg−1 predicted compared with 1 ml · min−1 · kg−1 observed clearance). Reasons for this result are unclear; potential coeluting phase 2 metabolites in in vivo samples were examined but were not detected. It is possible that challenges with measurement of the very high protein binding (fup = 0.006) may be responsible because small errors in the measurement of plasma protein binding at this level can cause large differences in the predicted clearance. The low observed clearance is surprising because glibenclamide was a very good uptake substrate in both hepatocytes and Oatp1b4-expressing HEK cells; thus, a much higher clearance was expected. It would be of interest to investigate this observation further.
In conclusion, we have shown that dog Oatp1b4 is the major hepatic transporter for the majority of the organic anions evaluated in vivo in these studies. Dog Oatp1b4 appears to exhibit substrate specificity more similar to that of OATP1B3 than the more hepatic abundant OATP1B1, indicating potential interspecies differences for some organic anions. It would be interesting to see whether this initial observation holds for a wider range of substrates and chemotypes. Our initial work demonstrates good clearance prediction for four of five compounds, which is a promising start. In summary, our data highlight the importance of mechanistic studies with major preclinical species, such as the dog, to aid our understanding of species-specific hepatobiliary disposition with reference to pharmacokinetic predictions, drug-drug interactions, and hepatotoxicity and to enhance the translation to man.
Authorship Contributions
Participated in research design: Wilby, Maeda, Webborn, Kitamura, Kusuhara, Riley, and Sugiyama.
Conducted experiments: Wilby, Courtney, Debori, and Kitamura.
Performed data analysis: Wilby, Maeda, Courtney, Debori, Kitamura, and Kusuhara.
Wrote or contributed to the writing of the manuscript: Wilby, Maeda, Debori, Kitamura, Riley, and Sugiyama.
Acknowledgments
We thank colleagues at AstraZeneca Alderley Park for assistance in the preparation of some of the batches of dog hepatocytes used.
Footnotes
Article, publication date, and citation information can be found at http://dmd.aspetjournals.org.
doi:10.1124/dmd.111.041814.
-
ABBREVIATIONS:
- OATP/Oatp
- organic anion-transporting polypeptide
- BSP
- sulfobromophthalein
- E1S
- estrone-3-sulfate
- CCK-8
- cholecystokinin octapeptide
- HEK
- human embryonic kidney
- E2G
- estradiol 17β-glucuronide
- DHEAS
- dehydroepiandrosterone sulfate
- PCR
- polymerase chain reaction
- GAPDH
- glyceraldehyde-3-phosphate dehydrogenase
- MS/MS
- mass spectrometry.
- Received July 15, 2011.
- Accepted September 22, 2011.
- Copyright © 2011 by The American Society for Pharmacology and Experimental Therapeutics


