


Abstract
Results from retrospective studies on the relationship between cytochrome P450 (P450) 2B6 (CYP2B6) genotype and cyclophosphamide (CY) efficacy and toxicity in adult cancer patients have been conflicting. We evaluated this relationship in children, who have faster CY clearance and receive different CY-based regimens than adults. These factors may influence the P450s metabolizing CY to 4-hydroxycyclophosphamide (4HCY), the principal precursor to CY's cytotoxic metabolite. Therefore, we sought to characterize the in vitro and in vivo roles of hepatic CYP2B6 and its main allelic variants in 4HCY formation. CYP2B6 is the major isozyme responsible for 4HCY formation in recombinant P450 Supersomes. In human liver microsomes (HLM), 4HCY formation correlated with known phenotypic markers of CYP2B6 activity, specifically formation of (S)-2-ethyl-1,5-dimethyl-3,3-diphenyl pyrrolidine and hydroxybupropion. However, in HLM, CYP3A4/5 also contributes to 4HCY formation at the CY concentrations similar to plasma concentrations achieved in children (0.1 mM). 4HCY formation was not associated with CYP2B6 genotype at low (0.1 mM) or high (1 mM) CY concentrations potentially because CYP3A4/5 and other isozymes also form 4HCY. To remove this confounder, 4HCY formation was evaluated in recombinant CYP2B6 enzymes, which demonstrated that 4HCY formation was lower for CYP2B6.4 and CYP2B6.5 compared with CYP2B6.1. In vivo, CYP2B6 genotype was not directly related to CY clearance or ratio of 4HCY/CY areas under the curve in 51 children receiving CY-based regimens. Concomitant chemotherapy agents did not influence 4HCY formation in vitro. We conclude that CYP2B6 genotype is not consistently related to 4HCY formation in vitro or in vivo.
Introduction
Cyclophosphamide (CY) is the cornerstone of curative chemotherapy regimens in over half of newly diagnosed pediatric cancer patients. There is a pressing need to improve the efficacy and/or to decrease the toxicity of CY-based combination chemotherapy regimens. The current method of dosing CY based on body surface area or weight leads to considerable interpatient variability in systemic exposure to CY and its metabolites, including 4-hydroxycyclophosphamide (4HCY), the precursor to CY's primary cytotoxic metabolite phosphoramide mustard (de Jonge et al., 2005a; McCune et al., 2009). The precise mechanism of 4HCY intracellular transport has not been evaluated; however, ABCC2 and ABCC4 are involved in the transport of CY and other metabolites (Qiu et al., 2004; Tian et al., 2005). Variability in 4HCY exposure, quantitated as area under the plasma concentration-time curve (AUC), may account for interpatient differences in the efficacy of CY.
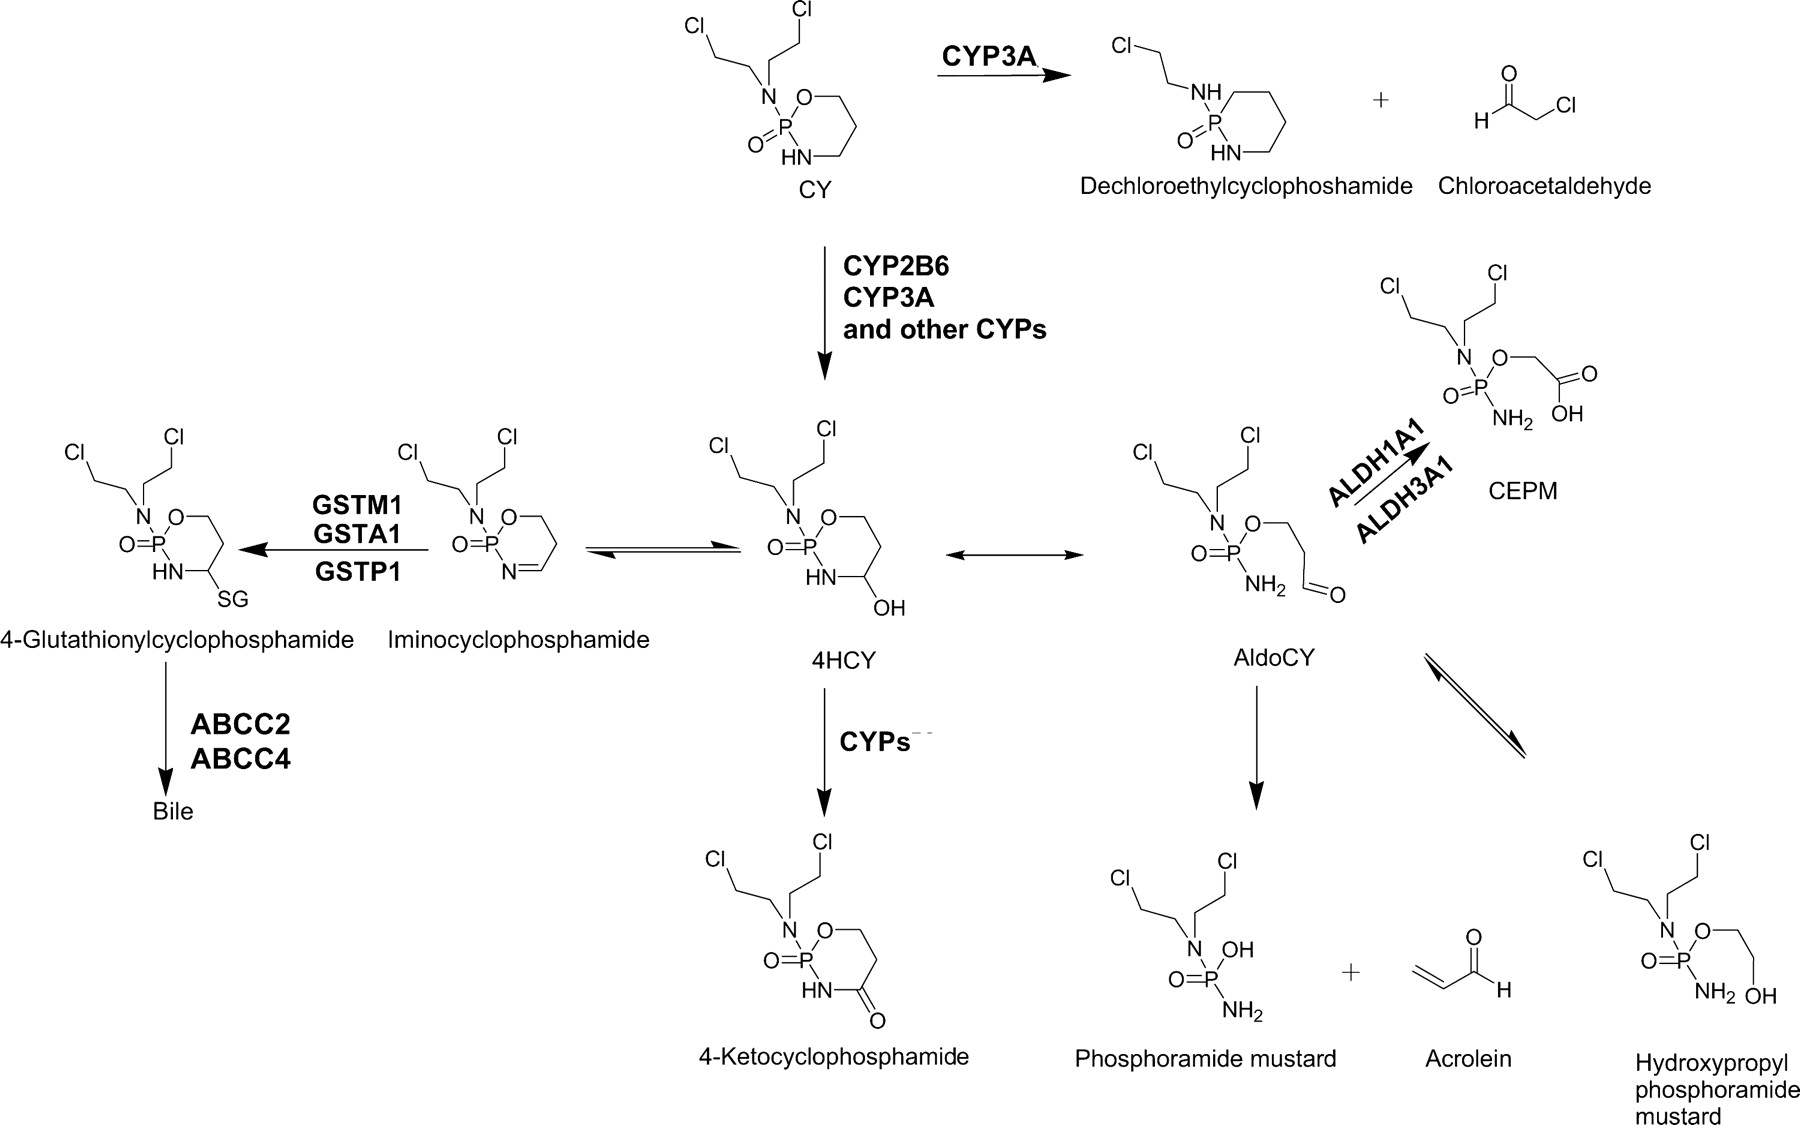
Systemic exposure to 4HCY is determined by its formation by various cytochrome P450 (P450) isozymes, and potentially myeloperoxidase, along with its elimination by aldehyde dehydrogenases, glutathione S-transferases, and ATP-binding cassette transporters (Fig. 1) (de Jonge et al., 2005a). In vitro, CY is metabolized to 4HCY by various P450s, specifically CYP2A6, -2B6, -2C9, -2C18, -2C19, -3A4, and -3A5 (Roy et al., 1999; Xie et al., 2003; de Jonge et al., 2005a). 4HCY is transported into the cell, where it exists in equilibrium with its tautomer, aldophosphamide. Aldophosphamide rapidly undergoes β-elimination to acrolein and phosphoramide mustard, which in turn alkylates DNA via the formation of a reactive diazidironium species. Traditionally, plasma concentrations of 4HCY have been difficult to quantify because it is unstable in biological fluids with a plasma half-life of only several minutes at 37°C (de Jonge et al., 2005a). Despite the development of methods to stabilize 4HCY in plasma, there is a paucity of information regarding the pharmacokinetics and pharmacodynamics of CY and its metabolites in patient populations, most likely because such studies are quite resource intensive (Ekhart et al., 2008; McCune et al., 2009). Identifying pharmacogenetic relationships between the allelic variants of enzymes or transporters involved in the formation and elimination of 4HCY could be less resource intensive than pharmacokinetic studies.

Schematic of CY metabolism.
Results from retrospective studies on the relationship between cytochrome P450 2B6 (CYP2B6) genotype and CY efficacy and toxicity have conflicted; these studies have been conducted in adults receiving CY-based combination chemotherapy regimens, as reviewed by Pinto et al. (2009). However, there is evidence to suggest that genotype-phenotype relationships for CY are dependent on age and CY dose. CY clearance is faster in children than adults (as reviewed by McCune et al., 2009), but the impact of age upon 4HCY formation has yet to be reported in vivo. In addition, the contribution of P450s involved in 4HCY formation varies with CY concentration (Chang et al., 1993; Ren et al., 1997; Roy et al., 1999).
CYP2B6, which represents 1 to 5% of the total hepatic P450 content, is one of the predominant P450s that generate 4HCY from CY. CYP2B6 and CYP3A4/5 are the predominant P450s involved in 4HCY formation in human liver microsomes (HLM) at higher CY concentrations (i.e., 0.25–5 mM) (Chang et al., 1993; Ren et al., 1997; Huang et al., 2000). At lower CY concentrations (i.e., 0.1 mM), CYP2C9 seems to be the major P450 responsible for 4HCY formation in studies using specific chemical inhibitors in HLM (Ren et al., 1997).
In white persons, the most common CYP2B6 variants and their frequencies are K262R (CYP2B6*4, 33%), Q172H/K262 (CYP2B6*6, 28%), and R487C (CYP2B6*4, 14%) (Lang et al., 2001). In vitro studies report that CYP2B6 genotype affects 4HCY formation: HLM carrying the CYP2B6*6 haplotype were found to have increased 4HCY formation and intrinsic clearance at higher CY concentrations (0.25 or 1 mM) (Xie et al., 2003; Helsby et al., 2010). We sought to characterize the role of CYP2B6 in 4HCY formation at the lower CY concentration of 0.1 mM, the measured peak concentration in children receiving a conventional dose of CY (400 mg/m2 per day) (McCune et al., 2009). Furthermore, we sought to fully elucidate the in vitro effect of CYP2B6 variants using two different systems: recombinant CYP2B6 proteins and HLM with known CYP2B6 genotype and content. We also determined whether 4HCY formation is affected in vitro by other chemotherapy agents often administered to children as part of CY-based regimens. Furthermore, this study is the first to evaluate the role of CYP2B6 polymorphisms with the pharmacokinetic phenotype in vivo in children receiving CY.
Materials and Methods
Materials.
4-Hydroperoxycyclophosphamide was purchased from ERCS (Hillsborough, NC). Hydroxybupropion-d6 and 4-hydroperoxycyclophosphamide-d4 were purchased from Toronto Research Chemicals Inc. (North York, ON, Canada). l-α-Dilauryl-sn-glycero-3-phosphocholine was from Avanti Polar Lipids (Alabaster, AL). Emulgen 911 was a gift from KAO Chemicals (Tokyo, Japan), isopropyl-β-d-1-thiogalactopyranoside was from Gold Biotechnologies (St. Louis, MO), and the pGRO7 plasmid was from Takara Bio Inc. (Otsu, Shiga, Japan, through Thermo Fisher Scientific, Waltham, MA). The PCR-Blunt II–TOPO vector was from Invitrogen (Carlsbad, CA). Hydroxybupropion and cytochrome cDNA-expressed CYP2B6 (lot numbers 62543 and 31487), CYP2C9*1 (lot number 97546), CYP2C19 (lot number 95248), CYP2E1 (lot number 01498), CYP3A4 (lot number 96395), CYP3A5 (lot number 04156), CYP2C8 (lot number 95849), and CYP2J2 (lot number 03350) containing human P450 reductase plus cytochrome b5 (Supersomes) were obtained from BD Gentest (Woburn, MA). Pooled HLM (lot number 0.0810433) were obtained from XenoTech, LLC (Lenexa, KS). (+)-N-3-benzylnirvanol (NBN) was a generous gift from Dr. Allan Rettie (University of Washington). Troleandomycin (TAO) was purchased from Enzo Life Sciences, Inc. (Farmingdale, NY). All other reagents were obtained from Sigma-Aldrich (St. Louis, MO) and used without further purification.
Cloning and Expression of CYP2B6 and Variants.
To increase solubility and decrease membrane binding, the CYP2B6 gene was modified similar to previously reported methods (Scott et al., 2001). The first 19 amino acids of the N terminus were removed, and residues 20 to 29 were replaced with the MAKKTSSGK sequence and constructed into the pCWori vector. A 6-histidine tag was inserted at the C terminus to aid in purification. No internal mutations were used to stabilize the protein. Human cDNA CYP2B6 (Origene, Rockville, MD) was used as a template along with designed primers (Table 1) to form the truncated version of CYP2B6. The pCW2B6 plasmid was used as a template to create pCW2B6*4, pCW2B6*6, and pCW2B6*5. The plasmids were created using a specific set of primers and a QuickChange Mutagenesis kit (Stratagene, La Jolla, CA) to mutate the base pairs (bp) of interest as shown in Table 1. The entire gene of CYP2B6*1 and variants was sequenced to ensure that only the desired mutations, and no extraneous mutations, were introduced by PCR. DNA sequencing was performed at the Sequencing Facility in the Department of Biochemistry, University of Washington. The pCW2B6 or variant plasmids were cotransformed with the Gro7 plasmid into Escherichia coli C41 cells under expression conditions similar to those described previously (Mitsuda and Iwasaki, 2006). Accurate mass analysis of CYP2B6.1 and variants was performed on a Micromass high-definition mass spectrometer system (Waters, Milford, MA) equipped with a Quadruple/Triwave/Orthogonal Acceleration Time of Flight tandem hybrid mass spectrometer using a previously published procedure (Cheesman et al., 2003). For wild type and variants, the m/z experimentally obtained was within 4 Da of calculated mass.
List of primers used in cloning of truncated CYP2B6 and variants
Purification of CYP2B6 and Variants.
Protein purification was performed following literature procedure (Cheesman et al., 2003) with the following changes. After the high-speed centrifugation, the protein supernatant was loaded onto a Ni2+ NTA superflow column (QIAGEN, Valencia, CA) and after elution was dialyzed against buffer I (three times) (100 mM KPi, pH 7.4, 20% glycerol, and 50 mM KCl) and stored at −80°C at concentrations between 3 and 10 μM. CO-difference spectra (Omura and Sato, 1964) and sodium dodecyl sulfate polyacrylamide gel electrophoresis were used to determine concentration and protein purity. A pyridine hemochromogen assay was performed and compared with CO-difference spectra to determine percentage of heme incorporation in wild type and variants.
Human Liver Microsomes.
HLM samples (n = 64) were obtained from the University of Washington School of Pharmacy Human Tissue Bank. HLM were prepared as described previously (Lin et al., 2002). Five of the 64 HLM were obtained from donors ≤10 years of age, but only one HLM was available for analysis of 4HCY formation. CYP2B6 and CYP3A4/5 protein content in HLM (n = 64) and genotype (n = 59) had been completed prior to this investigation; the library is representative of the most common allelic variants of CYP2B6 found within the white population (Totah et al., 2008). Because of the high protein concentration necessary to characterize 4HCY formation, Michaelis-Menten and inhibition experiments were conducted in pooled HLM, which were abundantly available.
Stability of 4HCY in Incubations.
4HCY was formed by the reduction of 4-hydroperoxycyclophosphamide in 50 mM KPi, pH 7.4. A stock solution of 4HCY (100 μM) was made by adding 4-hydroperoxycyclophosphamide and an equal amount of sodium thiosulfate allowed to react for 10 min at room temperature. After 10 min, a 20-μl aliquot of the 4HCY stock solution was placed into a shaking water bath at 37°C containing buffer and CYP2B6 Supersomes (5 pmol). NADPH was added after a 5-min preincubation. The final concentration of 4HCY within the incubation was 10 μM. An equal volume of methanol to quench was added to the incubation mixture at 0, 5, 20, and 30 min, and the 4HCY was stabilized as described below. To ensure that there was no loss of 4HCY during this 5-min preincubation, a shorter experiment was performed in 50 mM KPi, pH 7.4, at 37°C using the method of 4HCY formation described above. After 5 min, 96.4 ± 3.5% remained compared with the 0-min control. Approximately 90% of the original 4HCY remained after a 30-min incubation at 37°C.
Inhibition of 4HCY Formation by Specific Chemical Inhibitors and Chemotherapeutics.
Inhibition experiments were performed in quadruplicate. The final reaction volume for all inhibition experiments was 200 μl. Specific inhibitors of CYP2B6 (1 μM clopidogrel in HLM, 10 μM in CYP2B6 Supersomes), CYP2C8 (1 μM montelukast), CYP2C9 (10 μM sulfaphenazole), CYP2C19 (5 μM NBN), and CYP3A4/5 (100 μM TAO and 1 μM ketoconazole) were used to determine the contribution of each P450 to 4HCY formation in pooled HLM (Ren et al., 1997; Totah et al., 2008; Lee et al., 2010). For CYP2C8, CYP2C9, and CYP2C19, inhibition experiments were conducted using competitive conditions as presented below for the concomitant chemotherapeutic inhibition. In time-dependent inhibition experiments, clopidogrel and TAO were preincubated with pooled HLM (0.08 mg) at 37°C for 15 min with 1 mM NADPH before initiating the reaction with 0.1 mM CY. Inhibition experiments with all four inhibitors were performed similar to reactions with TAO and clopidogrel alone and in combination. All reactions were quenched after a 10-min incubation with 200 μl of methanol. The 10-min incubation time was used to prevent extensive metabolism of montelukast (Walsky et al., 2005).
To determine whether concomitant medications competitively inhibited CY metabolism in HLM, chemotherapeutics were used at their maximum plasma concentration (Cmax): actinomycin, cytarabine, doxorubicin, fludarabine, 6-mercaptopurine, topotecan, and vincristine. Fludarabine was included because of its increasing concomitant use with CY in children undergoing a hematopoietic cell transplant; the remaining chemotherapeutics were included because they were administered to children in the pharmacokinetic study (see below). Clopidogrel, used as a competitive inhibitor of CYP2B6, served as a positive control (Talakad et al., 2009).
Inhibition experiments were performed with pooled HLM (0.08 mg) or CYP2B6 Supersomes (5 pmol) in 50 mM KPi buffer (pH 7.4, 200 μl). CY was added to the tubes at a concentration of 0.1 mM, and the reaction mixture was equilibrated at 37°C for 5 min. NADPH (1 mM) was used to initiate the reaction, which was quenched with 200 μl of methanol after 30 min (HLM) or 10 min (Supersomes). The concentration of organic was ≤0.2% for samples dissolved in acetonitrile and was ≤0.1% for DMSO. Samples were then prepared and quantitated using the method described below.
4HCY concentrations were determined using the method of de Jonge et al. (2005b) with slight modifications. 4HCY was analyzed as the semicarbazone derivative, which was formed by adding 2 M semicarbazide (40 μl) and 4 M HCl (20 μl) to the quenched reaction tube. After 10 min, 4 M NaOH (20 μl) and 4-hydroxycylcophosphamide-d4 were added, and tubes were centrifuged at 20,800g for 5 min. For analysis of all samples, 5 μl of supernatant was injected onto a Zorbax SB-C18 Extend column (50 × 2.1 mm, 3.5 μm) (Agilent Technologies, Santa Clara, CA) and analyzed using high-performance liquid chromatography (Agilent 1100 Series LC) and electrospray ionization mass spectrometry (Agilent G1946A MSD) in the positive mode. The fragmentor and capillary voltage were optimized to 100 and 2000 V, respectively; the drying gas flow rate was 12 l/min with a temperature of 350°C, and the nebulizer pressure was 35 psi. The mobile phase consisted of 1 mM ammonium acetate (A), pH 6.3, and acetonitrile (B) with a flow rate of 0.4 ml/min. The initial percentage of 12% B was held for 2 min, increased to 25% B over 1 min, decreased back to 12% over 1 min, and held constant for 2 min. The lower limits of quantitation and detection for 4HCY were 7.5 and 2.5 ng/ml, respectively. The interday variability for low (15 ng/ml) and high (1000 ng/ml) quality controls was 13.0 and 5.8%, respectively; the intraday variability was 6.3 and 3.3% for low- and high-quality control samples, respectively. 4HCY and the internal standard, d4-4HCY, were detected as their respective sodium adducts: [Na+C8H18Cl2N5O3P] m/z 356 and [Na+C8H14D437Cl2N5O3P] m/z 362.
Michaelis-Menten constants (Km and Vmax) for CY were determined with recombinant enzymes under conditions that were linear with respect to time (5–60 min) and protein concentration (1–200 pmol/ml). Reconstituted enzyme systems were prepared by mixing CYP2B6 or variants (10 pmol), rat P450 reductase (20 pmol), cytochrome b5 (10 pmol), and 40 μg l-α-dilauryl-sn-glycero-3-phosphocholine micelles on ice for 20 min. Reconstituted enzyme was diluted to the final volume of 200 μl with 50 mM KPi, pH 7.4, followed by the addition of CY (0.1–20 mM). The final concentration of methanol in the reaction mixtures was 0.5%, a concentration known to have minimal effects on CYP2B6 activity (Vuppugalla et al., 2007). After equilibration in a shaking water bath at 37°C for 5 min, NADPH (1 mM) was used to initiate the 10-min incubation, which was quenched as described above.
Phenotypic Markers of CYP3A4/5 and CYP2B6 Activity in HLM.
CYP3A4/5 catalyzed formation of 1-hydroxymidazolam in the HLM bank was determined in a previous study (Lin et al., 2002). The formation of (S)-2-ethyl-1,5-dimethyl-3,3-diphenyl pyrrolidine (S-EDDP) from S-methadone and the hydroxylation of bupropion were both evaluated as phenotypic markers of CYP2B6 activity in HLM. Formation of S-EDDP from S-methadone in HLM with a known CYP2B6 genotype and protein content has been reported previously (Totah et al., 2008). Incubations measuring hydroxybupropion were conducted in 100 mM KPi, pH 7.4, at 37°C after 5 min of preincubation with HLM (0.02 mg) and bupropion (75 μM). Reactions were initiated with a reduced NADPH regenerating system that contained 10 mM glucose 6-phosphate, 1 mM β-NADP, 1 U/ml glucose 6-phosphate dehydrogenase, and 5 mM MgCl2. Experiments were performed in duplicate unless stated otherwise. After 30 min, reactions were quenched with an equivalent volume of acetonitrile containing hydroxybuproprion-d6 as the internal standard. Linear relationships were determined between 4HCY and formation of 1-hydroxymidazolam, hydroxybupropion, or S-EDDP to identify the role of CYP3A4/5 and CYP2B6 in catalysis at 0.1 mM CY.
4HCY Formation in Expressed Enzymes and HLM.
Incubations were carried out with 0.1 or 1 mM CY in pooled HLM. Incubations were performed in disposable 2-ml microcentrifuge tubes containing 50 mM KPi, pH 7.4, and either 0.08 mg of human liver microsomal protein or 5 pmol of Supersomes in a final volume of 200 μl. Samples were placed in a shaking water bath at 37°C and preincubated with CY for 5 min; the reaction was then initiated with 1 mM NADPH (10% of the volume). Reactions were incubated for either 30 min (HLM) or 10 min (Supersomes) and terminated with an equal volume of ice-cold methanol.
Prior incubations were conducted to ensure that all experiments were performed under linear conditions for both time and protein content. In pooled HLM incubated with 0.02 to 20 mM CY, the Michaelis-Menten parameters for CY were a Km = 2.38 mM and Vmax = 1.77 nmol · min−1 · mg−1 (Supplemental Fig. 1).
Patient Population.
Fifty-one children receiving their first cycle of a CY-based combination chemotherapy regimen were enrolled into the pharmacokinetic study. The median age was 5.5 years (range, 1.1–17.5); there were 30 male and 21 female participants. Children enrolled in this study were diagnosed with acute lymphoblastic leukemia (n = 31), Ewing sarcoma (n = 12), lymphoma (n = 2), neuroblastoma (n = 2), rhabdomyosarcoma (n = 2), or other malignancies (n = 2). The majority of children received CY for a single day as part of the following regimens: 17 children received consolidation (1000 mg/m2 CY for 1 day, 75 mg/m2 cytarabine for 4 days, and 60 mg/m2 6-mercaptopurine for 14 days), 16 children received delayed intensification (1000 mg/m2 CY for 1 day, 75 mg/m2 cytarabine for 4 days, and 60 mg/m2 thioguanine for 14 days), 15 children received VDC (1200 mg/m2 CY for 1 day, 1.5 mg/m2 vincristine for 1 day, and 37.5 mg/m2 per day doxorubicin for 2 days), and one child received VAC (1200 mg/m2 CY, 1.5 mg/m2 vincristine, and 0.045 mg/kg actinomycin; all were administered for 1 day). The abbreviations VAC and VDC are both based on the first letter of each antineoplastic in their regimen. The two children with neuroblastoma received fractionated CY at a dose of 400 mg/m2 per day in conjunction with topotecan (1.2 mg/m2 per day) for 5 days. All participants received similar antiemetics, antibiotics, and antifungals per institutional standard practice guidelines. Two children received fluconazole concomitant with CY. The Seattle Children's Hospital Institutional Review Board approved the study, and all participants' parents gave informed consent before participation. In addition to written informed consent from their parents or guardians, children aged 14 to 17 years gave written assent.
Pharmacokinetic Analysis of CY and Metabolites.
Pharmacokinetic samples were drawn immediately before CY administration, after completion of the 30-min infusion, and at 2.5, 4.5, 6.5, 22.5, and 24 h after the start of the first CY dose. The sample processing and analysis procedures have been published previously (McCune et al., 2009). In brief, blood was drawn into tubes containing either phenylhydrazine, for analysis of 4HCY, or ethylenediaminetetraacetic acid, for analysis of CY and carboxyethylphosphoramide mustard. The tubes were inverted three to four times, stored at 4°C for a maximum of 1 h, and centrifuged. Plasma was removed and stored at −70°C within 1 h of sample collection. All samples were shipped on dry ice to our laboratory within 3 months of collection. Plasma concentrations were determined for CY and its metabolites using a previously reported methodology; 4HCY concentrations were quantitated separately (McCune et al., 2009). A noncompartmental model was used to calculate the AUC from time 0 to infinity after the first CY dose using WinNonlin version 2.0 (Pharsight, Mountain View, CA).
Genotyping of CYP2B6.
Genomic DNA was isolated from a 10-ml blood sample using Gentra Purgene DNA Purification kits (Gentra Systems, Inc., Minneapolis, MN). All methods were validated using a panel of 96 Utah Centre d'Étude du Polymorphisme Humain (Paris, France) DNA samples; genotype and allele frequencies were consistent with reported results. The quality and quantity of DNA in each sample were determined using the absorbance ratio of 260 nm/280 nm.
Genotyping was performed for CYP2B6*4 allele (K262R, rs2279343) using the primers and protocol described in a previous report (Jacob et al., 2004). In brief, PCRs were performed with 50 ng of genomic DNA, 1.5 mM MgCl2, 100 μM nucleotides, 100 μM of primers, and 1 U of Amplitaq Gold DNA polymerase (Applied Biosystems, Foster City, CA) in a total volume of 20 μl. The conditions in a PE 9700 Thermocycler were as follows: one cycle for 5 min at 94°C, five cycles of 94°C for 30 s, 60°C for 45 s, 72°C for 1 min, and a final extension of 72°C for 10 min. The resulting 1474-bp product was digested with Sty1 (New England Biolabs, Beverly, MA), and the fragments generated were analyzed by gel electrophoresis and ethidium bromide staining. Fragments of either 56/340/1078 or 56/171/340/907 bp were produced, indicating the presence of the variant (G allele, 262R) or wild-type (A allele, K262) allele, respectively. Patient samples were genotyped for the CYP2B6*5 allele (R487C, rs3211371, assay ID C 30634242_40) and CYP2B6*6 SNP (Q172H, rs37445274, assay ID C 7817765_60) using TaqMan SNP Genotyping Assays (Applied Biosystems). The reaction mixture for both assays consisted of 4 ng of genomic DNA, 20× drug metabolism genotyping assay mix, and 2× Universal PCR Master Mix in a total volume of 5 μl. Real-time PCR was done on the 7900HT system using standard Taqman cycling conditions. Allelic discrimination analysis was carried out using the Sequence Detection System (version 2.3; Applied Biosystems). Patients that carried the variant allele for both K262R (rs2279343) and Q172H (rs37445274) were designated as CYP2B6*6, consistent with the definition of this allele (http://www.cypalleles.ki.se/cyp2b6.htm). Patients carrying the wild-type allele for each of the three SNPs assayed (K262R rs2279343; R487C rs3211371; Q172H rs37445274) were designated as CYP2B6*1.
Data Analysis.
Statistical analysis of kinetic data was performed using GraphPad Prism version 5.2 (GraphPad Software Inc., San Diego, CA). 4HCY formation versus CY concentration data were analyzed by a Michaelis-Menten model using nonlinear regression analysis for the determination of Km and Vmax. The intrinsic clearance was calculated using Vmax/Km. The total normalized rate of 4HCY formation at 0.1 mM CY is determined as reported previously (Rodrigues, 1999). The 4HCY formation determined in Supersomes was multiplied by the average content (in picomoles per milligram) for each specific P450 to determine the normalized rate of 4HCY formation. The P450 hepatic average content used was either determined from the literature (CYP2C9, 88.5 pmol/mg; and CYP2C19, 17.8 pmol/mg) or from the average content in our HLM bank (CYP2B6, 20.7 pmol/mg; CYP2C8, 31.2 pmol/mg; CYP3A4, 80.1 pmol/mg; CYP3A5, 27.5, pmol/mg) (Lasker et al., 1998; Lin et al., 2002; Totah et al., 2008; Naraharisetti et al., 2010). The percentage of total normalized rate of 4HCY formation was determined by dividing the normalized rate for each P450 by the sum of all rates and multiplying by 100%.
Linear regression was used to determine the correlations between CYP2B6 protein content and age, hydroxybupropion and 1-hydroxymidazolam formation, 4HCY and 1-hydroxymidazolam formation, 4HCY and hydroxybupropion formation, and 4HCY and S-EDDP formation. In all cases, a Spearman rank-order correlation coefficient was used to determine the significance of the association between these variables. A nonparametric Mann-Whitney U test was used to determine a significant association between CYP2B6 protein content and age. A one-way analysis of variance using a Kruskal-Wallis test was performed to determine statistically significant differences between CYP2B6 genotype groups. For all data analyses, a p value less than 0.05 was regarded as statistically significant.
Results
4HCY Formation in Supersomes and Normalized Reaction Rate Calculation.
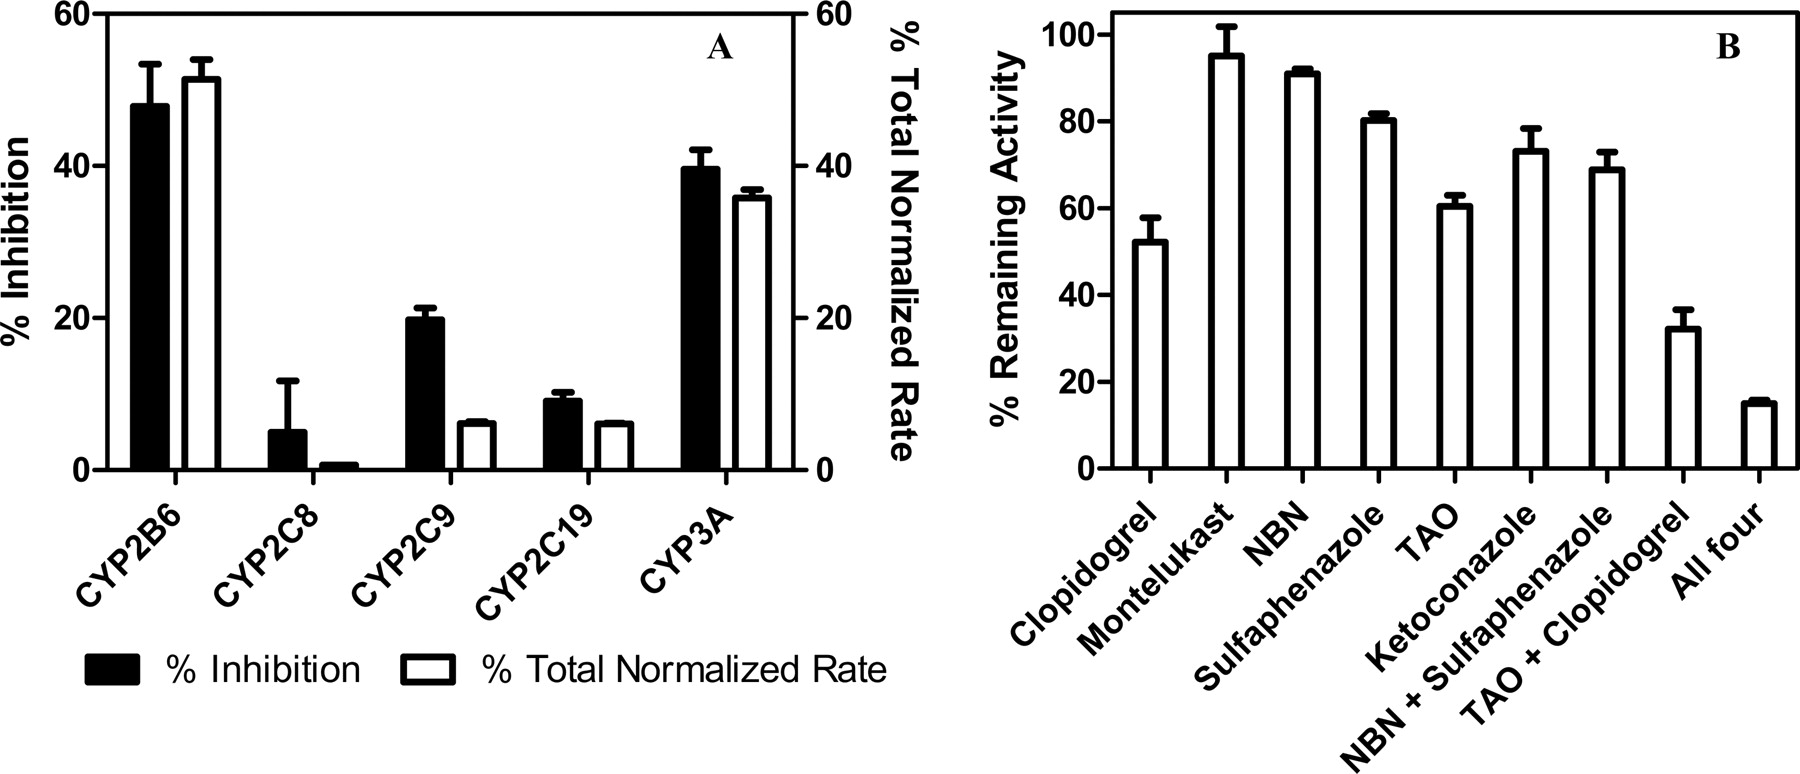
A panel of cDNA-expressed P450 isozymes (Supersomes) with coexpressed human reductase and cytochrome b5 was screened to determine the contribution of each enzyme to the formation of 4HCY. At 0.1 mM CY, CYP2B6 had the greatest contribution to 4HCY formation. In Supersomes, the formation of 4HCY by CYP2B6 was 7-fold higher (13.3 ± 0.7 pmol 4HCY · min−1 · pmol P450−1) than the other main contributors: CYP3A4 (2.02 ± 0.07 pmol 4HCY · min−1 · pmol P450−1), CYP2C19 (1.83 ± 0.04 pmol 4HCY · min−1 · pmol P450−1), CYP3A5 (1.10 ± 0.02 pmol 4HCY · min−1 · pmol P450−1), CYP2C9 (0.370 ± 0.015 pmol 4HCY · min−1 · pmol P450−1), and CYP2C8 (0.115 ± 0.004 pmol 4HCY · min−1 · pmol P450−1). CYP2E1 and CYP2J2 had negligible 4HCY formation (0.057 ± 0.004 pmol and 0.052 ± 0.005 4HCY · min−1 · pmol P450−1). For a more accurate assessment of the contribution of each isozyme to 4HCY formation, rates obtained in Supersomes were normalized to average hepatic content (Rodrigues, 1999) (Fig. 2A, open bars). The average total normalized rates and S.D.s for CYP3A4 and CYP3A5 were combined after the initial calculation. CYP2B6 remained a major contributor to 4HCY formation (51.4 ± 2.6%) followed by CYP3A4/5 (35.8 ± 1.1%). Both CYP2C9 and CYP2C19 showed equal contribution (6.11 ± 0.25 and 6.07 ± 0.13%, respectively), whereas CYP2C8 (0.67 ± 0.03%) had a negligible contribution.

Inhibition of cyclophosphamide 4-hydroxylation by specific chemical inhibitors and the total normalized rate assessed in pooled human liver microsomes. The rate of 4HCY formation was determined in Supersomes (5 pmol) after a 10-min incubation with 0.1 mM CY. A, the percentage of total normalized rate (as determined in Materials and Methods) is plotted and compared with the percentage of inhibition obtained from specific chemical inhibition. As described under Materials and Methods, 4HCY formation in pooled HLM (0.08 mg) was measured after 10-min incubation. The concentration of specific chemical inhibitors were clopidogrel (1 μM), montelukast (1 μM), NBN (5 μM), sulfaphenazole (10 μM), TAO (100 μM), and ketoconazole (1 μM). The term “All four” is used to abbreviate the addition of clopidogrel, NBN, sulfaphenazole, and TAO. B, data are displayed as percentage reduction in control (no inhibitor) activity. Each data point is mean ± S.D. of four replicates.
Inhibition of 4HCY Formation by Specific Chemical Inhibitors.
Chemical inhibitor experiments were conducted to further elucidate CYP2B6, CYP3A4/5, CYP2C9, and CYP2C19 on 4HCY formation rate at a low CY (0.1 mM) concentration. These experiments were conducted in Supersomes and HLM (Fig. 2B). Clopidogrel, a CYP2B6 inhibitor, had the largest effect on 4HCY formation (52.2 ± 5.6% remaining activity). The two CYP3A4/5 inhibitors, ketoconazole and TAO, had a similar effect on 4HCY formation (73.1 ± 5.2 and 60.4 ± 2.6% remaining activity, respectively). However, CYP2C inhibitors had a less dramatic effect ranging from 80.2 ± 1.5% remaining activity for sulfaphenazole to 95.0 ± 6.8% remaining activity for montelukast. After incubation with both TAO and clopidogrel, 4HCY formation was only 32.2 ± 4.4% of the control.
For validation of the percentage of remaining activity experiments in the pooled HLM, the total normalized rates were compared with the inhibition of 4HCY formation with specific chemical inhibitors in Supersomes. The percentage of total normalized rate and the percentage of inhibition were similar for each isozyme (Fig. 2A), with the exception that sulfaphenazole, the CYP2C9-specific inhibitor, had a greater percentage of inhibition (19.8 ± 1.5%; Fig. 2A, filled bars) than that predicted by the percentage of total normalized rate. Thus, CYP2C9 may have a greater impact on 4HCY formation than suggested by the percentage of remaining activity in Fig. 2B.
4HCY Formation in Matched HLM Samples.
To further elucidate the effect of CYP2B6 on the rate of 4HCY formation in HLM, a panel of 10 paired HLM samples with a predetermined CYP2B6 genotype was assessed. CYP3A4/5 protein content was matched in each pair, whereas CYP2B6 protein content varied (6.84–80.6 pmol/mg) within each pair, and the formation of 4HCY at 0.1 mM CY was determined. Within the five pairs, the HLM with lower CYP2B6 content showed lower 4HCY formation (Table 2) at similar CYP3A4/5 content. However, 4HCY formation was higher in those HLM with high CYP3A4/5, which suggests CYP3A4/5 is a critically important enzyme involved in 4HCY formation.
CY 4-hydroxylation in HLM matched for CYP3A content
Association of 4HCY Formation with Phenotypic Markers of CYP2B6 and CYP3A4/5 in HLM.
The involvement of CYP3A4/5 and CYP2B6 in 4HCY formation was assessed using a correlation analysis in the HLM bank and specific phenotypic markers for both isozymes. The associations between 4HCY formation and 1-hydroxymidazolam formation, a marker of CYP3A4/5 activity, and the formation of S-EDDP and hydroxybupropion, two established phenotypic markers of CYP2B6 activity, were evaluated (Hesse et al., 2004; Huang et al., 2004; Totah et al., 2008). Metabolite formation was determined in HLM at 8 μM midazolam, the reported substrate Km for CYP2B6 (75 μM bupropion), or at a therapeutic concentration (1 μM S-methadone or 0.1 mM CY) (Lin et al., 2002; Hesse et al., 2004; Totah et al., 2008; McCune et al., 2009). Formation of hydroxybupropion and 1-hydroxymidazolam was correlated (Fig. 3A), in agreement with previous data that CYP2B6 and CYP3A4 protein content in HLM was significantly associated (Totah et al., 2008). There was a significant correlation between 4HCY formation and all phenotypic markers. Significant associations between 1-hydroxymidazolam and hydroxybupropion formation (Fig. 3A; r = 0.58, p < 0.0001, n = 47), 4HCY and 1-hydroxymidazolam formation (Fig. 3B; r = 0.69, p < 0.0001, n = 37), 4HCY and hydroxybupropion formation (Fig. 3C; r = 0.96, p < 0.0001, n = 31), and 4HCY and S-EDDP formation (Fig. 3D; r = 0.68, p < 0.01, n = 13) were found.

Association of cyclophosphamide 4-hydroxylation with phenotypic markers of CYP2B6 and CYP3A4 activity in human liver microsomes. Correlation of the hydroxybupropion formation with 1-hydroxymidazolam formation (A; r = 0.58, p < 0.0001, n = 47). B–D, correlation of 4HCY formation with 1-hydroxymidazolam formation (B; r = 0.69, p < 0.0001, n = 37), hydroxybupropion formation (C; r = 0.96, p < 0.0001, n = 31), or S-EDDP formation (D; r = 0.68, p < 0.01, n = 13). The substrate concentrations used were 0.1 mM CY, 8 μM midazolam, 75 μM bupropion, and 1 μM S-methadone. Each data point is the mean of duplicate samples.
Effects of CYP2B6 Genotype on 4HCY Formation.
The effect of CYP2B6 genotype on CY metabolism was investigated by measuring 4HCY formation in a sample set of HLM using two concentrations that reflected the CY plasma Cmax in children (0.1 mM) or were similar to the reported Km of CY with CYP2B6 (1 mM) (Huang et al., 2000; Xie et al., 2003). A Kruskal-Wallis test showed no significant association between 4HCY formation and CYP2B6 genotype at CY concentrations of 0.1 mM (Fig. 4A; p = 0.43, n = 39) and 1 mM (Fig. 4B; p = 0.42, n = 39). Supplemental Fig. 2 shows that age, gender, and CYP2B6 genotype had no effect on CYP2B6 protein content in these HLM.

Variation of cyclophosphamide 4-hydroxylation by CYP2B6 genotype at low (0.1 mM; A) and high (1 mM; B) CY concentrations in human liver microsomes. A, 4HCY formation using 0.1 mM CY (p = 0.43). B, 4HCY formation using 1 mM CY (p = 0.42). Each data point is the mean of duplicate samples with the horizontal line representing the median value for each CYP2B6 genotype. Each reaction mixture contained 0.08 mg of HLM and was incubated for 30 min at 37°C. Incubations performed with HLM. HLM from donors <18 years of age (n = 2) are denoted by open triangles.
Unfortunately, there was a small number of CYP2B6*1/*4 (n = 3), *1/*5 (n = 2), *1/*7 (n = 4), and *6/*6 (n = 1) genotypes within the HLM bank, which made it difficult to draw strong conclusions about the influence of CYP2B6 genotype on 4HCY formation. Compared with wild type, average 4HCY formation was reduced by 50% in the CYP2B6*1/*4 (n = 3) population in experiments with 0.1 and 1 mM CY (Fig. 4).
4HCY Formation in Recombinant CYP2B6 and Most Common Variants.
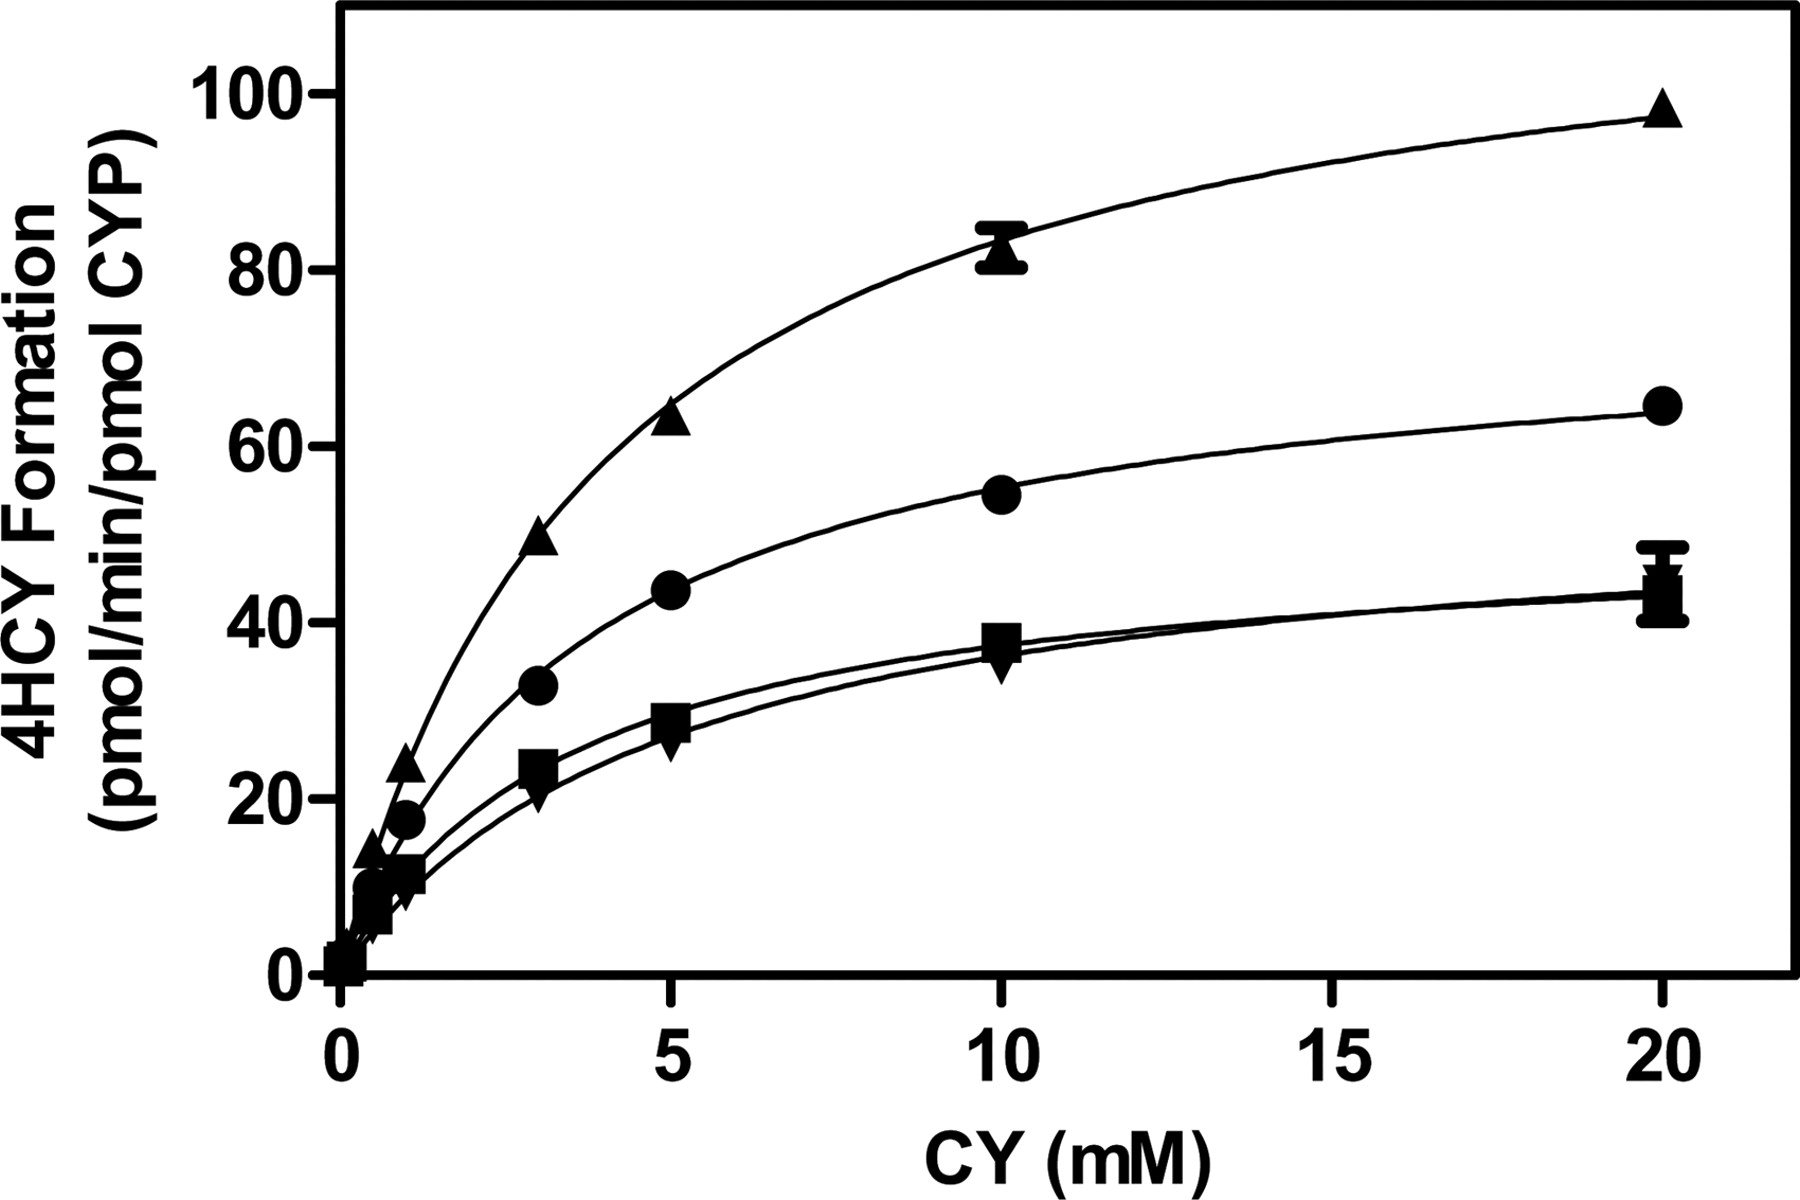
The metabolism of CY was fully characterized in CYP2B6.1 (wild type) and most common variants using recombinant engineered proteins expressed and purified using an E. coli expression system (Fig. 5). The recombinant proteins contained only modifications to the N- and C-terminal regions to increase their solubility, hydrophilicity, and aid in purification. No further mutations were introduced within the coding region, and this was confirmed by full sequencing of the plasmid prior to expression. The intrinsic clearance for all recombinant enzymes was determined using Vmax/Km. A Kruskal-Wallis test showed no significant difference (p = 0.39) in intrinsic clearance between CYP2B6*1 and variants. Intrinsic CY clearance for CYP2B6.6 was ∼30% higher than CYP2B6.1 (Table 3; Fig. 5), but both CYP2B6.4 and CYP2B6.5 displayed a reduction in intrinsic CY clearance compared with wild type. In fact, CYP2B6.5 intrinsic clearance was reduced by 50% and CYP2B6.4 by 30%. Supplemental Table 1 shows the intrinsic clearance of hydroxybupropion in E. coli-expressed CYP2B6 recombinant enzymes and CYP2B6 Supersomes.

Kinetic parameters of CY 4-hydroxylation in purified CYP2B6 enzymes. CY (0.1–20 mM) was incubated with reconstituted systems (10 pmol) containing CYP2B6.1 (●), CYP2B6.4 (■), CYP2B6.5 (▾), or CYP2B6.6 (▴) for 10 min at 37°C. Data points are mean ± S.D. of four replicates.
Kinetic parameters of 4HCY formation determined in reconstituted enzyme systems
Effect of Coadministered Chemotherapeutics on 4HCY Formation in Pooled HLM and CYP2B6 Supersomes.
The effect of commonly coadministered chemotherapeutics on CYP2B6-mediated 4HCY formation was examined. No coadministered chemotherapeutic reduced 4HCY formation in pooled HLM or CYP2B6 Supersomes. In comparison, clopidogrel reduced 4HCY formation to 22.9 ± 2.5% of control activity in pooled HLM and 1.35 ± 0.95% of control activity in CYP2B6 Supersomes (Supplemental Fig. 3).
Effect of CYP2B6 Genotype on the Pharmacokinetics of CY in Pediatric Patients Receiving Various Chemotherapeutic Regimens.
Children (n = 51, 30 males) aged 1.1 to 17.5 years receiving CY-based chemotherapy (see Materials and Methods) were genotyped for CYP2B6*1, CYP2B6*4, CYP2B6*5, and CYP2B6*6 (Fig. 6). The ethnicity of this population was 39 white persons, two African Americans, three Hispanics, two Asians, and five persons of unknown race. All CYP2B6-observed genotypes were in Hardy-Weinberg equilibrium and were consistent with what has been previously reported in white populations (Lang et al., 2001). CYP2B6 genotypes in this population were as follows: CYP2B6*1/*1 (n = 22), CYP2B6*1/*6 allele (n = 19), CYP2B6*6/*6 (n = 1), CYP2B6*1/*5 (n = 8), and CYP2B6*4/*6 (n = 1).

CY clearance (A) and ratio of 4HCY/CY AUCs (B) by CYP2B6 genotype in children receiving a conventional dose of CY. A, CY clearance (l · h−1 · m2−1) for each CYP2B6 genotype (p = 0.57). B, ratio of 4HCY/CY AUC for each CYP2B6 genotype (p = 0.37). Pharmacokinetic samples were drawn immediately before CY administration, upon completion of the 30-min infusion, and at 2.5, 4.5, 6.5, 22.5, and 24 h after the start of the first CY dose. Children that received fluconazole concomitant with CY are denoted by open triangles. All others are denoted by filled circles. Genomic DNA was extracted from blood and genotyped for the most common CYP2B6 variants as described under Materials and Methods. Horizontal lines represent the median value for each group; the Kruskal-Wallis test was used to determine significance.
CY clearance was determined as described previously (McCune et al., 2009). The median (range) of the maximum plasma concentration was 126 μM (111–141 μM) for the two children receiving 400 mg/m2 CY and 318 μM (187–387μM) for the remaining children receiving >1000 mg/m2 CY. Median CY clearance was 2.20 l · h−1 · m2−1 (1.39–4.30 l · h−1 · m2−1), and the median ratio of 4HCY/CY AUCs was 0.044 (0.017–0.137). Correlations were determined between CYP2B6 genotype and CY clearance (Fig. 6A) or the ratio of 4HCY/CY AUCs (Fig. 6B). A Kruskal-Wallis test was applied to determine whether differences between groups were significant: no statistically significant association was observed between CYP2B6 genotype and CY clearance (p = 0.57) or the ratio of 4HCY/CY AUCs (p = 0.37).
Discussion
This study sought to thoroughly investigate the roles of CYP2B6 and CYP2B6 genetic variation in two systems: the in vitro 4-hydroxylation of CY and CY pharmacokinetics in pediatric patients. Our key findings were that CYP2B6 and CYP3A4/5 are involved in 4HCY formation in vitro at a low CY concentration of 0.1 mM, which is pharmacologically relevant to children, that 4HCY formation is not affected by chemotherapy agents often coadministered to children, and that CYP2B6 genotype is not clearly associated with 4HCY formation in either HLM or children receiving CY.
CYP2B6 is the predominant P450 involved in 4HCY formation at low CY concentrations of 0.1 mM based on in vitro experiments with Supersomes and after normalizing rates with respect to relative abundance of each P450 (Fig. 2A), which contrasts with data suggesting that CYP2C9 may predominate at these low concentrations (Ren et al., 1997). At the time, Ren et al. (1997) evaluated the role of P450 in 4HCY formation in HLM; a specific inhibitor of CYP2B6 was not available, and therefore the contribution of CYP2B6 could not be adequately determined. Notably, the relationship of plasma concentrations to hepatic concentrations is not known so it is assumed that the lower CY plasma concentrations observed in children translates to lower CY hepatic concentrations. In addition, our data also revealed greater 4HCY formation by CYP3A5, most likely due to inclusion of coexpressed cytochrome b5 in recent batches of Supersomes that show an increase in their catalytic activity with other substrates. We evaluated the relative contributions, using specific chemical inhibitors, of CYP3A4/5 and CYP2B6 to 4HCY formation, because CYP3A4/5 catalyzes 4HCY formation more slowly but has greater hepatic expression compared with CYP2B6. In pooled HLM, a pool of 50 livers of mixed gender, both CYP3A4/5 and CYP2B6 contributed to 4HCY formation at 0.1 mM CY. A linear relationship between 4HCY formation and phenotypic markers of CYP3A4/5, and CYP2B6 activity, was also established (Fig. 3). Our results strongly indicate that CYP3A4/5 and CYP2B6 are involved in 4HCY formation at low CY concentrations.
Both nongenetic and genetic factors associated with CYP2B6 protein content in HLM (Supplemental Fig. 2) were performed by determining the relationship between CYP2B6 protein content and genotype, age, or gender. HLM from female donors had higher CYP2B6 content than those of male donors, but genotype and age were not significantly associated with CYP2B6 content. These results indicate our HLM bank provides a reliable model for the effect of CYP2B6 genotype on 4HCY formation. However, one limitation of our work was that our HLM bank was predominantly obtained from adult donors.
To more comprehensively evaluate the effects of CYP2B6 allelic variants, purified enzyme systems were used. Previous reports of the CY Km in CYP2B6 Supersomes ranged between 1.36 and 1.89 mM (Huang et al., 2000; Xie et al., 2003), which is lower than the Km (3.6 mM) obtained within our reconstituted enzyme system. The Vmax (75.4 pmol · min−1 · pmol−1) obtained for 4HCY formation in our reconstituted system was lower than previous studies (Xie et al., 2003). Kumar et al. (2006) reported that differences between the kinetic parameters in Supersomes and reconstituted enzyme systems could be due to variation in the cytochrome b5 and reductase concentrations in Supersomes. Michaelis-Menten parameters for CY were also evaluated in pooled HLM. Km (2.38 mM) and Vmax (1.77 nmol · min−1 · mg−1) values obtained were within the range of literature values (Griskevicius et al., 2003; Helsby et al., 2010). However, the absence of a genotype-phenotype relationship for CYP2B6 would be consistent with CYP2B6 contributing to metabolite formation but not quantitatively the most important determinant of metabolite formation. It is also interesting that the Eadie-Hofstee plot indicated single enzyme kinetics, which suggests that even though multiple P450s are involved in 4HCY formation, they possess similar Michaelis-Menten parameters.
There have been previous reports suggesting that carriers of the CYP2B6*6 allele have increased 4HCY formation in vitro (Xie et al., 2003). Within the HLM bank, there was no significant difference in the rate of 4HCY formation between CYP2B6*1/*1 and *1/*6, but further analysis with purified CYP2B6.6 yielded a modest increase in the intrinsic clearance (Vmax/Km) of CY (∼ 30%) compared with CYP2B6.1. In the purified enzyme systems, there was an observed reduction in the catalytic ability of the CYP2B6.4 variant. Although this trend was confirmed in the HLM bank, it did not reach statistical significance, potentially due to the limited number (n = 3) of CYP2B6*1/*4 donors; alternatively, the other P450s involved in 4HCY formation may have obscured a CYP2B6 genotype-4HCY formation phenotype relationship. The latter theory is supported by 51.3% inhibition of 4HCY formation in HLM by clopidogrel, a known CYP2B6 inhibitor. It is also possible that the effect of the CYP2B6*4 variant on metabolism is substrate dependent (Rotger et al., 2007).
We are the first to evaluate the relationship between CYP2B6 genotype and the CY pharmacokinetic phenotype in children. However, our study is limited by the relatively small sample size (n = 51), the varying CY doses, and the heterogeneity of combination chemotherapy regimens. Pharmacokinetic studies of larger pediatric populations receiving a homogenous CY dose and regimen are desirable. The studies in adults that evaluate the CYP2B6 genotype-CY pharmacokinetic phenotype relationship have been contradictory and inconclusive (Helsby and Tingle, 2011). The clearance of CY and the ratio of 4HCY/CY AUCs differed based on CYP2B6 genotype in 103 Japanese patients receiving a conventional dose of CY (500–750 mg/m2). In particular, CY clearance was greater in the three patients with CYP2B6*6/*6 genotype; however, one of the three patients had an appreciably higher clearance and may have skewed this analysis. Whereas the ratio of 4HCY/CY AUCs did not differ based on genotype, this ratio was lower in carriers of the single nucleotide polymorphisms of the CYP2B6 gene, g.-2320T>C (rs7254579), g.-750T>C (rs4802101), g.15582C>T (rs4803419), or g.18492T>C (rs2279345) (Nakajima et al., 2007). In 29 white adults receiving CY (1000 mg/m2) with corticosteroids, the ratio of 4HCY/CY AUCs was 1.5-fold higher in the eight CYP2B6 516T (CYP2B6*1/*9) (mean ± S.D. of ratio, 0.027 ± 0.020) carriers than in 21 CYP2B6 516 G/G homozygotes (CYP2B6*1/*1), (mean ± S.D. of ratio, 0.017 ± 0.014) (Xie et al., 2006). A relationship was not observed between CYP2B6 genotype and CY or 4HCY pharmacokinetics in 124 white persons receiving CY (1500 mg/m2 per day for 4 days) with carboplatin and thiotepa (Ekhart et al., 2008). However, thiotepa is a known inhibitor of CYP2B6 and thus would be expected to alter the pharmacokinetic phenotype (McCune et al., 2005). CY clearance was not associated with CYP2B6 genotype (i.e., *2, *3, *4, *5, *6) in 60 adults receiving one of a variety of different CY combination chemotherapy regimens (mean ± S.D. of CY dose, 1008 ± 806 mg/m2). Unfortunately, 4HCY plasma concentrations were not available from that study (Timm et al., 2005). Therefore, the current literature regarding the relationship of CYP2B6 genotype with CY or 4HCY pharmacokinetic phenotype has been contradictory in adults. More comprehensive genotype studies are desirable to evaluate for multifactorial reduced functional alleles (e.g., CYP2B6, 2C19, and 3A5 genetic polymorphisms).
Although there is no data correlating CYP2B6 genotype and CY pharmacokinetics in pediatric populations, there are studies in HIV-infected pediatric patients addressing the effects of polymorphisms on the CYP2B6 substrates efavirenz and nevirapine (Rotger et al., 2007; Saitoh et al., 2007). Homozygous and heterozygous CYP2B6*6 carriers exhibit a marked decrease in the clearance of these drugs in vivo. We did not observe an association with CYP2B6 and CY clearance or the ratio of 4HCY/CY AUCs (Fig. 6). Furthermore, CYP2B6*6 genotype did not explain the large interindividual variability observed in the ratio of 4HCY/CY AUCs. Within the 19 CYP2B6*6 heterozygotes, the ratio of 4HCY/CY AUCs still showed a 10-fold variation (Fig. 6B). This may be due to the many other P450s involved in CY hydroxylation and might nullify any phenotypic effects from the CYP2B6*6 genotype, which is consistent with our in vitro data. Because children often receive different chemotherapy regimens than adults, we demonstrated in vitro that coadministered chemotherapeutics do not competitively inhibit CYP2B6, nor do they affect 4HCY formation (Supplemental Fig. 3). Thus, the lack of a CYP2B6 genotype-pharmacokinetic phenotype association is unlikely to be caused by concomitant chemotherapy agents.
In conclusion, CYP3A4/5 and the highly polymorphic CYP2B6 are major contributors to 4HCY formation at the low (0.1 mM) CY concentrations that are pharmacologically relevant to children receiving a conventional dose of CY. Although 4HCY formation is altered by common CYP2B6 variants in the in vitro model of purified enzymes, there was no significant relationship between CYP2B6 genotype and CY or 4HCY pharmacokinetics among children receiving a conventional dose of CY. Thus, we hypothesize this lack of a genotype-pharmacokinetic phenotype relationship is due to the other P450 isozymes involved in CY 4-hydroxylation. Additional work is ongoing to identify factors, genetic and nongenetic, associated with CY pharmacokinetics that may improve the efficacy of CY-based combination regimens in pediatric patients.
Authorship Contributions
Participated in research design: Raccor, Claessens, Dinh, Park, Hawkins, McCune, and Totah.
Conducted experiments: Raccor, Claessens, Dinh, Park, Hawkins, Thomas, and Makar.
Contributed new reagents or analytic tools: Raccor, Claessens, Dinh, Thomas, Makar, and Totah.
Performed data analysis: Raccor, McCune, and Totah.
Wrote or contributed to the writing of the manuscript: Raccor, Claessens, Dinh, Park, Hawkins, Thomas, Makar, McCune, and Totah.
Acknowledgments
The participation of the children and their families in these studies is greatly appreciated. We acknowledge Linda Risler for analytical expertise, Celeste Oglesby and Lauren DePue for coordination of the clinical study, and Meagan Bemer for editorial expertise.
Footnotes
This work was supported by the National Institutes of Health National Heart, Lung, and Blood Institute [Grant R01-HL91744S1]; the National Institutes of Health National Institute of General Medical Sciences [Grant P01-GM032165]; the National Institutes of Health National Center for Research Resources [Grant M01-RR00037]; the Elmer M. Plein Endowed Research Fund; Alex's Lemonade Stand; the Children's Foundation; and the Fraternal Order of Eagles–Auburn Auxiliary. B.S.R. was supported by the Elmer M. and Joy B. Plein Fellowship for Excellence in Pharmacy Education, School of Pharmacy (Seattle, Washington).
Article, publication date, and citation information can be found at http://dmd.aspetjournals.org.
↵
 The online version of this article (available at http://dmd.aspetjournals.org) contains supplemental material.
-
ABBREVIATIONS:
- CY
- cyclophosphamide
- P450
- cytochrome P450
- AUC
- area under the curve
- 4HCY
- 4-hydroxycyclophosphamide
- SNP
- single nucleotide polymorphism
- S-EDDP
- (S)-2-ethyl-1,5-dimethyl-3,3-diphenyl pyrrolidine
- HLM
- human liver microsomes
- PCR
- polymerase chain reaction
- TAO
- troleandomycin
- NBN
- (+)-N-3-benzylnirvanol
- bp
- base pair.

- Received March 8, 2011.
- Accepted October 3, 2011.
- Copyright © 2012 by The American Society for Pharmacology and Experimental Therapeutics


