


Use of Drug Depletion and Metabolite Formation Methods in Hepatic Microsomes and Isolated Hepatocytes
Abstract
The pharmacokinetics of ethoxycoumarin have been characterized using steady-state plasma concentrations achieved after administration of this compound, at a series of infusion rates, into the hepatic portal vein of rats. The clearance of ethoxycoumarin could be described by a one-site Michaelis-Menten kinetic model withVmax and unboundKM values of 495 nmol/min/standard rat weight (SRW) and 3.6 μM, respectively, and an intrinsic clearance (CLint,Vmax/KM ratio) of 137 ml/min/SRW (where SRW is 250 g). Urinary excretion experiments, using both ethoxycoumarin and hydroxycoumarin, demonstrated that 7-hydroxycoumarin, the metabolite frequently measured in in vitro studies, accounted for 26% of the metabolism of ethoxycoumarin. In vitro studies with hepatic microsomes and isolated hepatocytes were undertaken to characterize the kinetics of both hydroxycoumarin formation and ethoxycoumarin depletion and to compare the utility of these methods for predicting in vivoclearance. In both in vitro systems, hydroxycoumarin formation displayed biphasic kinetics, with a high-affinity/low-capacity component (withVmax, KM , and CL1 terms) and a low-affinity/high-capacity component (with aCL2 term) that was not saturated over the substrate concentration range studied (0.5–100 μM). The use of scaling factors to relate in vitro and in vivodata showed that, although microsomal and hepatocyteVmax values were comparable (26 and 17 nmol/min/SRW, respectively), both were substantially lower than thein vivo value. However, scaling of the in vitro CLint values, by taking into account the fraction of ethoxycoumarin metabolized to hydroxycoumarin, yieldedin vivo predictions of 127 and 122 ml/min/SRW (representing 93 and 89% of the observed CLint value) for microsomes and hepatocytes, respectively. The depletion of ethoxycoumarin (1–1.5 μM) with time in both microsomes and hepatocytes displayed a monoexponential decline and predicted in vivo CLint values of 53 and 117 ml/min/SRW (representing 39 and 85% of the observed value), respectively. Therefore, both in vitro systems can accurately predict ethoxycoumarin CLintvalues using hydroxycoumarin formation rates, providing the importance of this pathway in total clearance is taken into account. Moreover, these results demonstrate that, even when the complete metabolic fate of the compound under investigation is unknown, isolated hepatocytes can be successfully used to predict in vivo CLint values by measurement of substrate depletion with time.
Ethoxycoumarin is a commonly used probe substrate for CYP1 activity in vitro, and it has been recommended as a marker of metabolic competence for a number of in vitro systems, including microsomes (Skett et al., 1995), isolated hepatocytes (Blaauboer et al., 1994), precision-cut liver slices (Bachet al., 1996), and various heterologous expression systems (Waxman et al., 1991). Its initial popularity was based on the fluorescent properties of the metabolite 7-hydroxycoumarin (formed by an O-deethylation reaction), which allowed the development of a simple, sensitive, and accurate assay procedure (Greenlee and Poland, 1978). This reaction is catalyzed by a variety of members of the CYP superfamily of enzymes present in both human (Waxmanet al., 1991) and rat (Ryan and Levin, 1990) liver. In human liver, CYP2E1 and CYP1A2 are believed to be the forms responsible for the high-affinity/low-capacity and low-affinity/high-capacity sites, respectively, for ethoxycoumarin O-deethylation (Yamazakiet al., 1996); the range of activity between individual livers is relatively small, on the order of 3-fold (Beaune et al., 1986; Stevens et al., 1993). In untreated rats, the situation is less clear, because the two forms showing the highest activity, CYP1A1 and CYP2B1, represent minor amounts of total CYP (Ryan and Levin, 1990).
Although the kinetics of ethoxycoumarin have been well characterized in several in vitro systems (Boobis et al., 1986;Rogiers et al., 1986; Fry et al., 1992; Baylisset al., 1994; Worboys et al., 1995), there have been no investigations undertaken to describe the pharmacokineticsin vivo. Moreover, it is unclear how important theO-deethylation pathway is in the overall metabolic fate of this substrate. Recent studies with rat liver slices indicated that there are a number of other primary metabolites of ethoxycoumarin (Ballet al., 1996). Therefore, because the use of ethoxycoumarinin vitro is likely to continue, there is a need to establish the relationship between the in vitro data generated and the pharmacokinetics in vivo. This can be best achieved by assessing the ability of in vitro systems to quantitatively predict in vivo pharmacokinetic behavior.
The majority of in vitro predictions of in vivoclearance have used metabolite appearance data; the kinetics of metabolite formation are characterized in hepatic microsomes and/or isolated hepatocytes, and CLint is calculated from theVmax/KM ratio and subsequently scaled to in vivo units (Houston, 1994;Iwatsubo et al., 1996). This method has proven to be extremely useful for a wide range of compounds, from low-clearance compounds such as caffeine and tolbutamide (Hayes et al., 1995; Ashforth et al., 1995) to higher-clearance compounds such as diazepam and ondansetron (Zomorodi et al., 1995;Worboys et al., 1996). The main disadvantage of this approach is that it requires knowledge about the importance of the particular metabolic pathway under study in the overall metabolic clearance of the compound. For many drugs, particularly new candidate drugs under development within the pharmaceutical industry, such knowledge is not available and thus the use of this establishedin vitro/in vivo prediction method is limited. Therefore, we have examined an alternative prediction method that is based on monitoring the depletion of parent compound in the incubation medium with time and thus requires no a priori knowledge of the metabolic fate of the drug.
The aims of the present study were therefore twofold. The first goal was to establish the pharmacokinetics of ethoxycoumarin in vivo in rats and to define the importance of 7-hydroxycoumarin formation in the metabolic fate of this compound. The second aim was to compare the use of drug depletion and metabolite appearance methods and assess the accuracy of these in vivo predictions for ethoxycoumarin clearance in rats, using two commonly used in vitro systems, namely hepatic microsomes and freshly isolated hepatocytes.
Materials and Methods
Animals.
Male Sprague-Dawley rats (230–260 g) were obtained from the Biological Sciences Unit, University of Manchester, and housed (two or three/cage) on a bedding of sawdust. They were fed with CRM rat diet (IMS, Congleton, UK), allowed water ad libitum, and housed at a room temperature of 20–21°C, in a humidity of 45–55%, and with a 12-hr dark/light lighting cycle.
Chemicals.
All of the chemicals used in this study were purchased from either Sigma (Poole, UK) (including 7-ethoxycoumarin, 7-methoxycoumarin, and 7-hydroxycoumarin) or BDH (Lutterworth, UK).
In Vivo Pharmacokinetic Studies.
Rats (N = 30) were cannulated in the carotid artery (Harns and Ojeda, 1974) and hepatic portal vein (Akrawi and Wedlund, 1987) and allowed 24 hr to recover. Animals received a bolus dose of ethoxycoumarin (1–20 μmol/kg in polyethylene glycol 400/propylene glycol, 9:1) into the hepatic portal vein, followed immediately by an infusion of ethoxycoumarin via the same route, at a rate of either 8, 12, 24, 40, or 80 μmol/hr/kg (0.15 ml/hr, using the same vehicle, for 3 hr). This dosing regimen was well tolerated by the animals. The loading dose and infusion rates were calculated to yield a range of theoretical steady-state plasma concentrations, based on the volume of distribution (520 ml/kg) and the clearance (40 ml/min/kg) determined in preliminary iv bolus studies (Hayes et al., 1995). Blood samples (200 μl) were taken from the carotid artery over the infusion period (N = 6, 30-min intervals), and plasma was obtained.
In Vivo Urinary Recovery Studies.
To determine the amount of ethoxycoumarin converted to 7-hydroxycoumarin, rats (N = 3) were treated with ethoxycoumarin (3, 30, or 30 μmol/kg, ip) and housed in metabolism cages for urine collection over 48 hr. To establish the importance of the urinary excretion route and the extent of further metabolism of this metabolite, additional rats (N = 3) were treated with 7-hydroxycoumarin (3, 30, or 130 μmol/SRW) and housed in metabolism cages for urine collection for 48 hr. A balanced crossover design was used in both cases, allowing 48 hr between studies.
Hydroxycoumarin Formation in Microsomes and Hepatocytes.
Hepatic microsomes were prepared and hepatocytes were isolated as described previously (Hayes et al., 1995). Hepatic microsomes (0.5 mg protein/ml, N = 4) were preincubated (2 min) with ethoxycoumarin (final concentration, 0.5–100 μM; added as 5 μl in DMF) at 37°C in a shaking water bath. The time and protein concentration used were both within the linear region for reaction conditions. The reaction was started by the addition of NADPH (10 μl of a 20 mM solution in water), and the final incubation volume was 1 ml (in 0.07 M phosphate buffer, pH 7.4). Incubations were terminated (4 min) by the addition of 10 μl of concentrated hydrochloric acid. All incubations were carried out in duplicate.
Freshly isolated hepatocytes (N = 4) were preincubated in Williams Medium E, in a shaking water bath, at 37°C. Ethoxycoumarin (0.5–100 μM, added as 5 μl in DMF) was incubated in conical flasks (25 ml) containing 2.5 ml of Williams medium E, and reactions were initiated by the addition of 0.5 ml of hepatocyte suspension, to yield a final cell density of 0.25 × 10⁶ cells/ml. The time and cell density used were both within the linear region for reaction conditions. Reactions were terminated after 10 min by snap-freezing in liquid nitrogen. All incubations were carried out in duplicate.
Ethoxycoumarin Depletion in Microsomes and Hepatocytes.
Microsomes (N = 4) were preincubated (2 min) with 1.5 μM ethoxycoumarin (added in 5 μl of DMF) in a shaking water bath at 37°C, and reactions were started by the addition of an NADPH-regenerating system (0.74 mg of NADP, 1.94 mg of isocitric acid, 0.5 units of isocitrate dehydrogenase, and 10 μmol of magnesium sulfate in 50 mM Trizma buffer). Incubations were terminated at 2-min time intervals over 20 min, by addition of chloroform. All incubations were carried out in duplicate.
Freshly isolated hepatocytes and ethoxycoumarin (1 μM) were preincubated separately as described above, and reactions were started by the addition of 0.5 ml of hepatocytes, to yield a cell density of 0.25 × 10⁶ cells/ml. Reactions were terminated at 20-min time intervals over 100 min, by immersion in liquid nitrogen.
Assay for Hydroxycoumarin.
Microsomal and hydrolyzed hepatocyte incubates (1000 units/ml glucuronidase, type H1 from Helix pomatia, containing sulfatase activity, in 60 mM sodium acetate, pH 4.5, for 2 hr at 37°C) were centrifuged (2500 rpm, for 10 min), and 1-ml aliquots were added to 2 ml of 0.2 M glycine buffer (pH 10). The fluorescence of the samples was then measured (Perkin-Elmer LS-5 fluorimeter) by using excitation and emission wavelengths of 375 and 452 nm, respectively. A standard was also assayed with blank microsomes or hepatocytes, and the samples were quantified as described by Lake (1987). It has been demonstrated that the 3-hydroxy metabolite of ethoxycoumarin has no fluorescent properties under alkaline conditions (Jung et al., 1985). Aliquots of urine were hydrolyzed and hydroxycoumarin was quantified as described above, with an additional chloroform extraction step (5 ml, with mixing for 10 min) and back-extraction into the alkaline buffer (Greenlee and Poland, 1978). The limit of detection was 0.01 μM, with linearity extending to at least 100 μM; reproducibility was 0.5–2.3% in the range of 0.3–50 μM.
Assay for Ethoxycoumarin.
Samples of plasma and incubates were extracted with chloroform (5 ml, with mixing for 10 min), with the addition of internal standard (7-methoxycoumarin, 10 μl of a 2.5 mM solution in DMF). The organic layer was evaporated to dryness at 40°C under oxygen-free nitrogen and reconstituted in mobile phase (50 μl), and 25 μl were injected into an HPLC system consisting of an SAS Hypersil column with a mobile phase of 0.2 M acetic acid/acetonitrile (55:45, v/v), at a flow rate of 1 ml/min. The eluent was monitored at a UV wavelength of 325 nm; the retention times of 7-ethoxycoumarin and 7-methoxycoumarin were 7.5 and 11 min, respectively. Standard curves for ethoxycoumarin in blank plasma/incubation medium were used to quantify the samples. The limit of detection was 0.3 μM, linearity in the assay extended to at least 200 μM, and reproducibility was 3–5.1% in the range of 1–100 μM.
Determinations of Plasma Protein Binding of Ethoxycoumarin and Blood/Plasma Concentration Ratios.
Ethoxycoumarin (in DMF) was evaporated to dryness under nitrogen before the addition of either plasma or fresh blood. The samples were then treated as described in detail earlier (Zomorodi et al., 1995). For both determinations, aliquots were extracted for HPLC analysis as described above. The concentration range of ethoxycoumarin studied was 1–400 μM, and each concentration was assessed in triplicate.
Data Analysis.
Kinetic analysis of the metabolite appearance data and in vivo data was undertaken using a least-squares nonlinear regression program (Siphar; Simed, Créteil, France). The in vivo data were best described by a one-site Michaelis-Menten model (eq. 1),
Eq. 2 was used to estimate fm
,
Both the hepatocyte and microsomal metabolite appearance data were best described by a two-site Michaelis-Menten model (eq. 3),
The in vitro data (Vmax and clearance terms) were scaled to in vivo units using either the microsomal scaling factor (660 mg microsomal protein/SRW) or hepatocellularity (1.2 × 10⁹ cells/SRW), as appropriate (Carlile et al., 1997). In vivovalues for KM and henceCLint were obtained from hepatic portal infusion studies to simulate oral administration (thus eliminating hepatic blood flow as a rate-limiting step in hepatic clearance), without concern for incomplete absorption from the intestinal tract. Implicit in this approach is the assumption that the venous equilibration model adequately describes hepatic events (Wilkinson, 1987). The in vivo and scaled in vitro data are expressed per SRW (250 g).
Results
In Vivo Pharmacokinetic Studies.
A constant-rate infusion of ethoxycoumarin into the hepatic portal vein, together with a bolus dose, produced steady-state plasma concentrations within 30 min, which were maintained for the 3-hr experiment duration. Maximal fluctuations in plasma concentrations (N = 6/animal) were <11% for individual animals. The average steady-state concentrations for each group of rats, receiving one of the five different infusion rates, are shown in fig.1. The data for these 30 animals show a curvilinear relationship between the steady-state concentration achieved and the infusion rate used, which can be best described by simple one-site Michaelis-Menten kinetic model. TheVmax, KM , andCLint values obtained for these data by nonlinear regression analysis are shown in table1.

Relationship between ethoxycoumarin steady-state plasma concentrations and the infusion rate.
Data on total drug concentrations (mean ± SD) for five groups of rats (N = 30) are shown. Solid line, nonlinear regression line, with Vmax of 495 nmol/min/SRW and KM of 16.5 μM.
In vivo disposition parameters for ethoxycoumarin
Ethoxycoumarin is bound to plasma proteins, with an unbound fraction of 0.22 ± 0.1, and has a blood/plasma concentration ratio of 0.98 ± 0.12. Both of these values are concentration independent over a concentration range of 1–400 μM. Therefore, theCLint and KM values for unbound blood concentrations of ethoxycoumarin are 137 ml/min/SRW and 3.6 μM, respectively. Using the venous equilibration model (Pang and Rowland, 1977), the hepatic clearance and the extraction ratio can be calculated (using 20 ml/min/SRW as a measure of hepatic blood flow) as 12 ml/min/SRW and 0.6, respectively. Thus, ethoxycoumarin can be classified as an intermediate-extraction drug, and its hepatic availability, defined as (1 − extraction ratio), is 0.4. As a consequence of the appreciable first-pass effect for ethoxycoumarin, the use of systemic iv administration would significantly underestimate clearance.
In Vivo Urinary Recovery Studies.
Administration of ethoxycoumarin resulted in the renal excretion of <1% of the dose in the unchanged form. Table2 presents the recovery of hydroxycoumarin, after deconjugation, in urine after administration of either ethoxycoumarin or hydroxycoumarin. After administration of ethoxycoumarin, only relatively minor amounts (approximately 17%) were present at each dose level. Studies after administration of hydroxycoumarin itself demonstrated that 65% of the initial dose could be recovered in the urine as hydroxycoumarin after hydrolysis, indicating the importance of further metabolism and/or nonrenal excretion of this metabolite. Therefore, the truefm for ethoxycoumarin metabolism to hydroxycoumarin (using eq. 4) is 0.26 and the formation clearance for this route is 36 ml/min/SRW.
Urinary recovery of hydroxycoumarin (after 48 hr) from rats administered either ethoxycoumarin or hydroxycoumarin ip
Hydroxycoumarin Formation in Microsomes and Hepatocytes.
Hydroxycoumarin formation in both microsomes and hepatocytes under initial rate conditions demonstrated biphasic kinetics, characterized by a high-affinity/low-capacity component (described byVmax, KM , and hence CL1) and a low-affinity/high-capacity component that was not saturated within the concentration range used (described by CL2). Fig.2 presents kinetic profiles for hydroxycoumarin formation from typical microsomal and hepatocyte preparations, and the kinetic parameters obtained from these studies are presented in table 3. TheKM values were virtually identical in the two in vitro systems; moreover, because of this low value the corresponding CL1 parameter accounted for approximately 96% of the microsomal clearance and 92% of the hepatocyte clearance. Thus, the importance of the high-affinity component in ethoxycoumarin O-dealkylation is comparable in these systems.
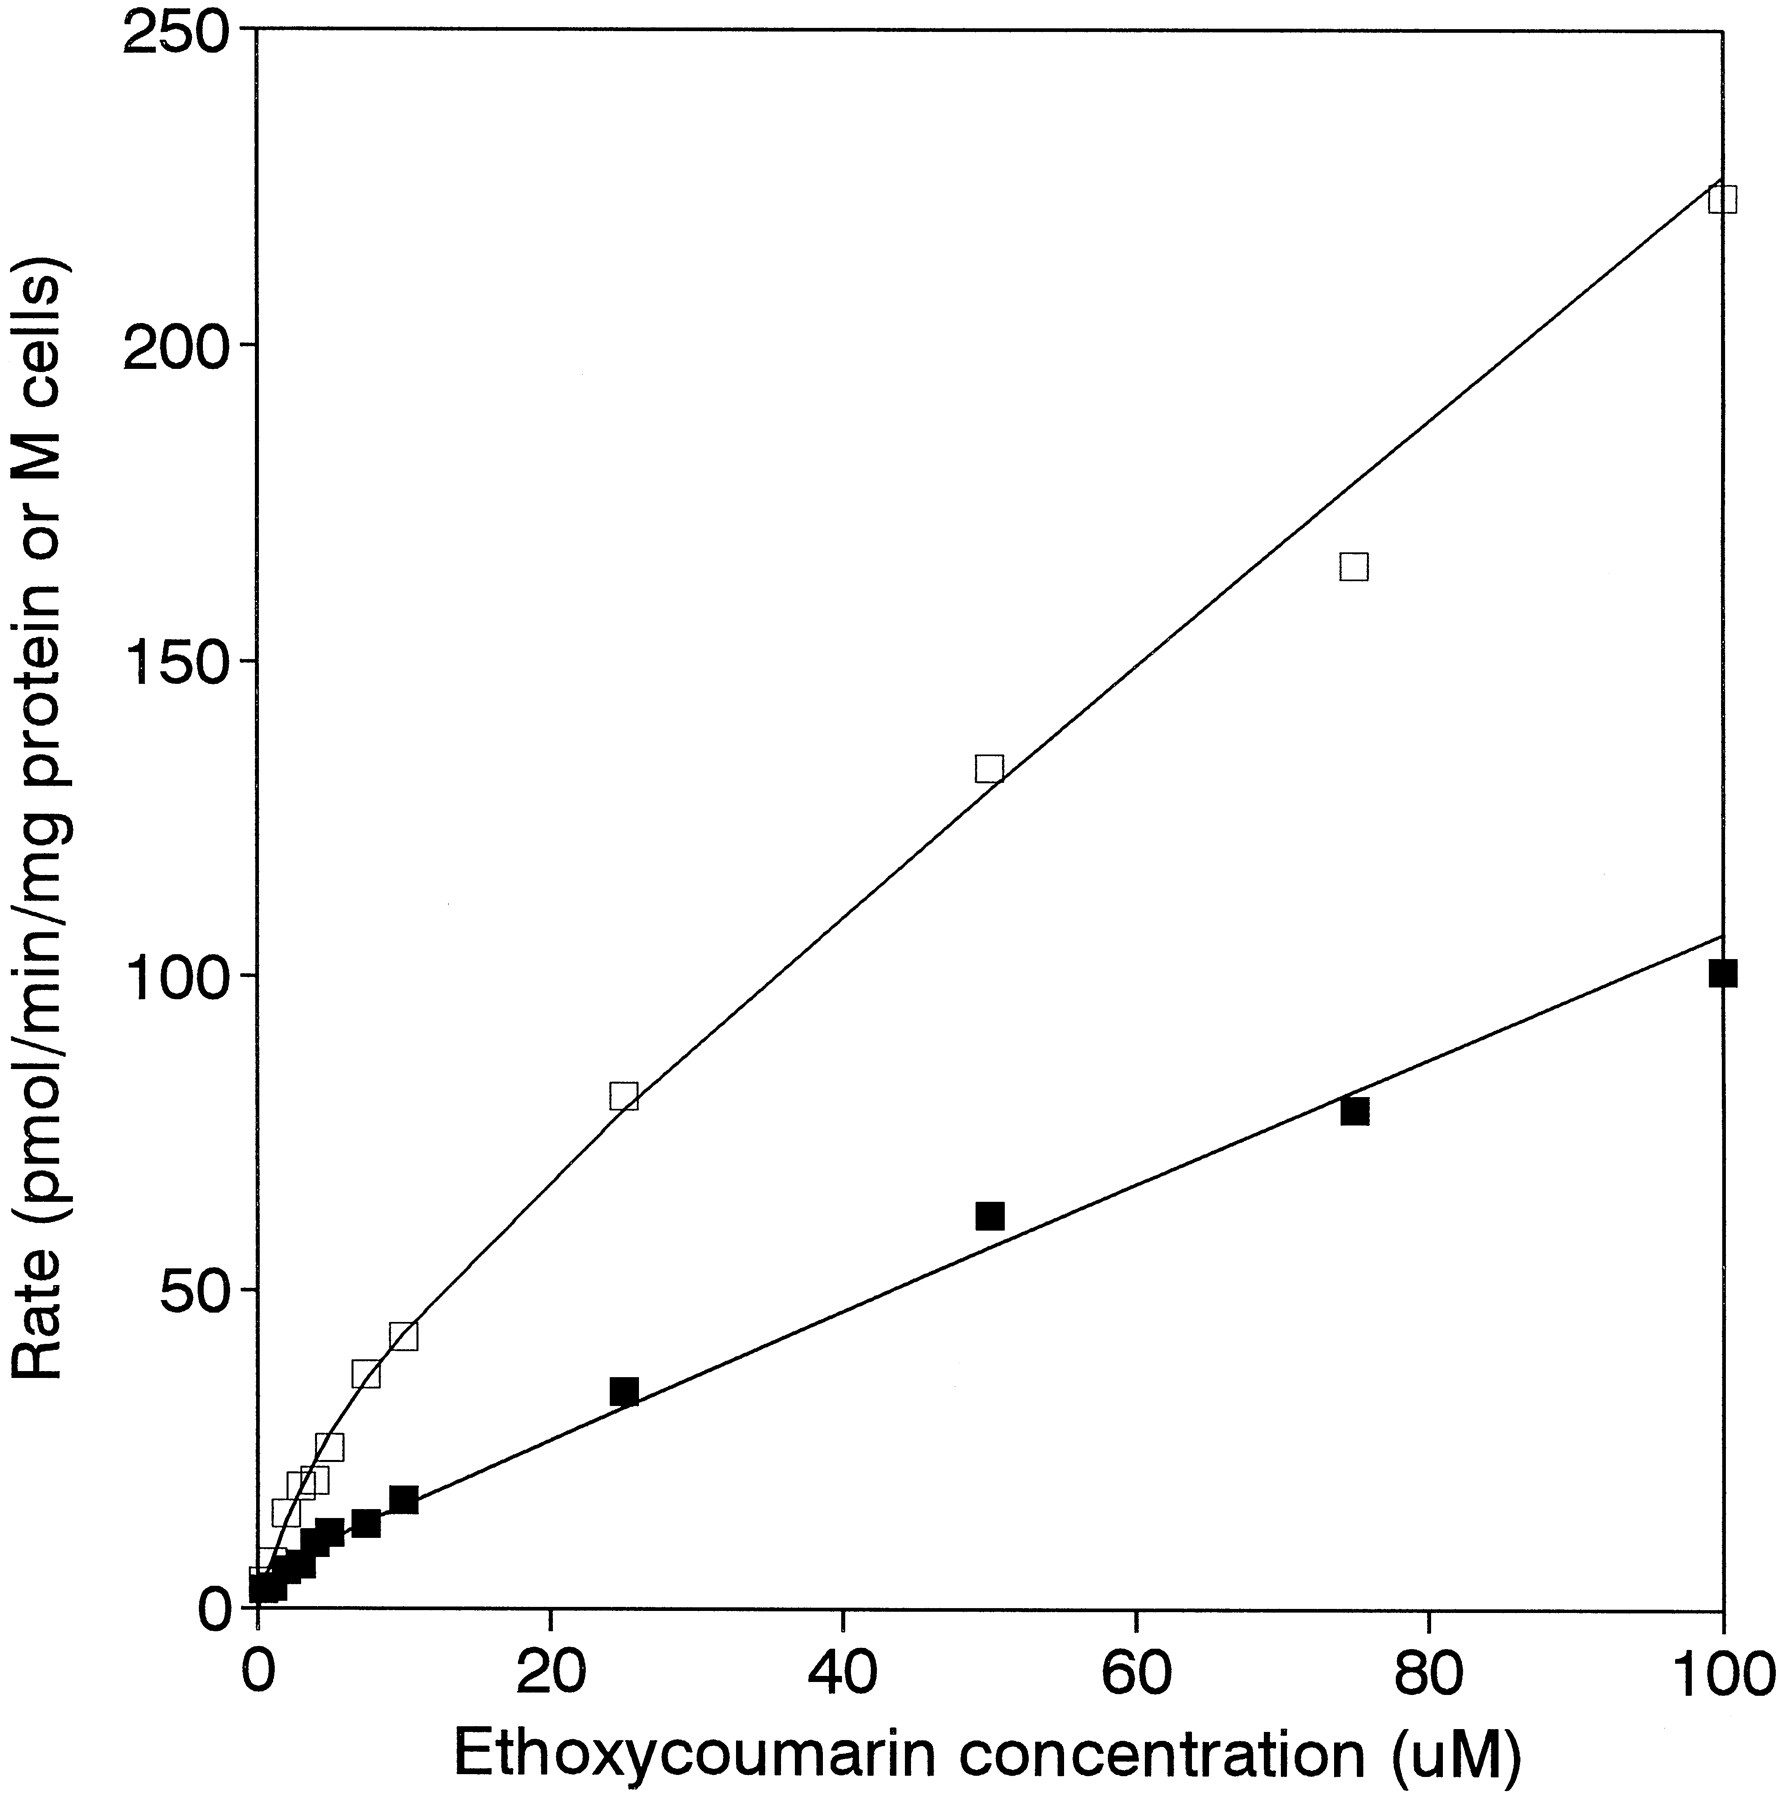
Relationships between the rate ofO-deethylation of ethoxycoumarin and substrate concentrations in typical microsomal (□) and hepatocyte (▪) preparations.
For this particular microsomal preparation,Vmax was 39 pmol/min/mg protein,KM was 1 μM, andCL2 was 1.9 μl/min/mg protein; for this particular hepatocyte preparation, Vmax was 7 pmol/min/106 cells, KM was 1.5 μM, and CL2 was 1 μl/min/106 cells.
Michaelis-Menten parameters obtained for hydroxycoumarin formation in hepatic microsomes and isolated hepatocytes
Ethoxycoumarin Depletion in Microsomes and Hepatocytes.
In both microsomes and hepatocytes, the decline in ethoxycoumarin concentrations over the time course of incubation was monoexponential, as shown in fig. 3 for typical microsomal and hepatocyte preparations. In both cases, incubations were carried out over a time period greater than one half-life. The half-lives differed substantially between the systems (table4), mainly as a result of the different incubation volumes used (1 ml and 3 ml for microsomes and hepatocytes, respectively). When CLint was estimated from the AUC values, similar values were obtained for these unscaled parameters (table 4).

Time courses for the depletion of ethoxycoumarin (EC) in typical microsomal (A) and hepatocyte (B) preparations.
CLint values in these particular preparations were 57 μl/min/mg protein and 99 μl/min/106 cells, respectively.
Kinetics of ethoxycoumarin depletion in microsomes and hepatocytes
The first time point in these studies corresponds to the time used to calculate the initial rates of hydroxycoumarin formation in the studies presented above. In the former samples, hydroxycoumarin formation was determined in addition to ethoxycoumarin depletion. There was no significant difference (p < 0.01 byt test) between these formation rates and those determined in the initial rate study at the same substrate concentration.
Predictions of In Vivo Kinetics from In Vitro Data.
The Vmax andCLint values from the in vitrostudies were scaled to in vivo units using either the microsomal protein recovery index or hepatocellularity (table5). For the hydroxycoumarin formation data, a correction for the fm for this pathway was made. Comparison with the corresponding in vivodata indicates different levels of success for both the incubation method and the in vitro system used. The predictedCLint values from both hepatocyte studies were excellent, i.e. 85 and 89% of the actualCLint value for ethoxycoumarin depletion data and hydroxycoumarin formation data, respectively. The metabolite appearance data measured in microsomes also accurately predicted thein vivo value (93%), whereas the ethoxycoumarin depletion data substantially underpredicted the CLintvalue (39%).
CLint and Vmax values for ethoxycoumarin determined in vivo and from scaled microsomal and hepatocyte data
Discussion
The pharmacokinetics of ethoxycoumarin have been defined in vivo in rats, with particular emphasis placed on characterizing the importance of the O-deethylation pathway. 7-Hydroxycoumarin, which is formed via this metabolic route, is the species monitored by most workers using this substrate as anin vitro probe substrate (Yamazaki et al., 1996;Beaune et al., 1986; Stevens et al., 1993; Boobiset al., 1986; Rogiers et al., 1986; Fry et al., 1992; Bayliss et al., 1994; Worboys et al., 1995). The urinary excretion data demonstrate that this pathway is of relatively minor importance in vivo, with only 26% of an administered dose of ethoxycoumarin being converted to this metabolite. Recent work by Ball et al. (1996) with rat liver slices indicated that there are several metabolites of ethoxycoumarin in addition to hydroxycoumarin. Indeed, Jung et al. (1985)identified 3-hydroxy,7-ethoxycoumarin as a primary metabolite of ethoxycoumarin in vitro, and previous work (Cohen, 1979) with coumarin in rats showed this closely related chemical to be hydroxylated in several positions but primarily at position 3 of the lactone ring. Therefore, there are several other metabolites likely to be quantitatively of equal, or more, importance, compared with 7-hydroxycoumarin.
By using different infusion rates with matching loading doses, a range of steady-state concentrations of ethoxycoumarin were obtained, which enabled the pharmacokinetics of this compound to be characterized. Ethoxycoumarin clearance in vivo could be adequately described by a classic Michaelis-Menten model withVmax, KM , andCLint values. The combination of a high unbound blood CLint value of 137 ml/min/SRW and an unbound blood fraction of 0.22 results in hepatic extraction for ethoxycoumarin that is classified as intermediate (extraction ratio, 0.6). The KM is quite low (3.6 μM, based on unbound blood concentrations), and the enzymes involved in ethoxycoumarin metabolism have a relatively high capacity (Vmax, 495 nmol/min/SRW). However, these are pooled parameters (Wagner, 1985) that describe the combined effects of at least two parallel pathways. The CLint andVmax terms are the sums of the individual parallel pathways, and the KM term is an average value for these pathways, weighted for their relative importance (Sedman and Wagner, 1974).
Two types of in vitro studies have been undertaken with both hepatic microsomes and freshly isolated hepatocytes. In both systems, hydroxycoumarin formation rates demonstrated biphasic kinetics, which can be characterized by a high-affinity/low-capacity component (withVmax, KM , andCL1 terms) and a low-affinity/high-capacity component that was not saturated (with aCL2 term), in agreement with several previous studies (Boobis et al., 1986; Rogiers et al., 1986; Fry et al., 1992; Bayliss et al., 1994). The microsomal and hepatocyte KM values (0.9 and 0.8 μM, respectively) were comparable, as were the contributions of CL1 to the overall clearance (96% and 92% in microsomes and hepatocytes, respectively). The observation that these KM values are approximately 5-fold lower than the in vivo value based on the unbound blood concentration (3.6 μM) is not surprising, in view of the pooled nature of the in vivo parameter. It indicates that the KM values for the other pathway(s) are higher than the KM value for hydroxycoumarin formation.
Scaling factors for microsomal protein recovery (660 mg/SRW) and hepatocellularity (1.2 × 10⁹ cells/SRW), which relate the microsomal and hepatocyte data to the in vivo conditions (Houston, 1994), were applied to bothVmax and CLint. The scaled Vmax values from microsomes and hepatocytes (table 5) are comparable to each other but substantially underpredict the in vivo value (by 20-fold). This result is probably a consequence of the fm for the hydroxycoumarin pathway, which accounts for only approximately one fourth of the metabolism, and the lack of equivalence in vivo of the two-site model for hydroxycoumarin formation (theVmax term refers to the high-affinity/low-capacity site in vitro). Correction of thein vitro CLint values for thefm for the hydroxycoumarin pathway yields values that are comparable to the in vivo CLint data for both microsomes and hepatocytes (predictions of 93 and 89%, respectively, of the in vivo parameter). A similar approach was used previously for caffeine predictions (Hayes et al., 1995), but in that case the fm value was considerably higher.
The clearance values for ethoxycoumarin in vivo disposition (table 1) and hydroxycoumarin formation in vitro (table 3) formed part of a compilation used to assess the utility of in vitro systems for predicting in vivo metabolic clearances (Houston, 1994). Ethoxycoumarin was one of the few drugs whose clearance was not well predicted with either hepatocytes or microsomes. Now that the importance of the 7-hydroxylation pathway is better understood, the explanation for this previously reported underprediction is obvious. The case of ethoxycoumarin highlights the importance of establishing valid fm values for incorporation into the scaling of in vitro data to obtain in vivo parameters. A number of other confounding issues were identified in previous studies, including product inhibition, futile (non-metabolism-related) binding, extrahepatic metabolism, and use of inappropriate scaling factors (Houston, 1994;Ashforth et al., 1995; Carlile et al., 1997).
The in vitro ethoxycoumarin depletion-time studies provide data that are amenable to scaling in the same fashion as the hydroxycoumarin formation data, allowing some interesting comparisons to be made. Although both the microsomal and hepatocyteCLint values from the metabolite appearance studies accurately predict CLint in vivo, this is not the case for the alternative approach. Hepatocyte depletion data also accurately predict the actualCLint value, indicating that hepatocytes can be successfully used for prediction studies whether the metabolic fate of the compound of interest is known or not. In contrast, however, the corresponding microsomal data substantially underpredict thein vivo CLint. The exact reasons for this are unknown, but some speculations can be made. In the microsomal study, although the initial EC concentration (1.5 μM) is slightly higher than the corresponding concentration in the hepatocyte study (1 μM) and the microsomal KM for hydroxycoumarin formation, it is substantially lower than the unboundin vivo KM for ethoxycoumarin (3.6 μM); therefore, this concentration difference is unlikely to play a major role. Previous comparisons between microsomes and hepatocytes have indicated that the former system is prone to product inhibition in some cases, namely with phenytoin (Ashforth et al., 1995) and diazepam (Zomorodi et al., 1995). The present studies indicate that such a phenomenon is of little importance when hydroxycoumarin formation is monitored, although it is possible that one of the quantitatively more important metabolites formed from ethoxycoumarin may cause some inhibition of its own metabolism in microsomes. However, because these other metabolites of ethoxycoumarin have not been identified and their relative importance is unknown, it is not possible to test this speculation further.
In conclusion, the present study characterizes for the first time the pharmacokinetics of ethoxycoumarin in rats. Hydroxycoumarin formation accounts for a relatively small fraction of ethoxycoumarin metabolism. Although this finding is of interest and is crucial for the extrapolation of in vitro kinetic data on hydroxycoumarin, it is of minor concern to investigators using ethoxycoumarin as a marker of the metabolic competence of their particular in vitro systems. The present studies also demonstrate the value ofin vitro drug depletion data for in vivoprediction studies. The studies with hepatocytes provide unequivocal evidence that clearance can be predicted successfully from data describing either metabolite appearance or drug depletion. The latter approach has obvious advantages when the metabolic fate of the drug under investigation is not known.
Footnotes
-
Send reprint requests to: Dr. J. B. Houston, School of Pharmacy and Pharmaceutical Sciences, University of Manchester, Oxford Road, Manchester, M13 9PL, UK.
-
D.J.C., A.J.S., E.I.L.A., and D.W. were recipients of Biotechnology and Biological Sciences Research Council studentships.
- Abbreviations used are::
- CYP
- cytochrome P450
- CLint
- intrinsic clearance
- CLH
- hepatic clearance
- DMF
- dimethylformamide
- SRW
- standard rat weight
- fm
- fraction of ethoxycoumarin metabolized to hydroxycoumarin
- Received May 29, 1997.
- Accepted October 9, 1997.
- The American Society for Pharmacology and Experimental Therapeutics


