


Abstract
We studied the effects of short- and long-term ingestion of grapefruit juice (GJ) on nifedipine (NFP) pharmacokinetics in rats. Thirty minutes after intraduodenal (id) administration of 2.0 ml of GJ or saline, NFP was i.v. or id administered at a dose of 3 mg/kg b.wt. No significant differences were observed in pharmacokinetic values between the two groups after i.v. administrations of NFP. By contrast, after id administration, the mean AUC value in the GJ group was approximately 1.62 times that in the control group, and the mean apparent clearance (CL) decreased by approximately 40%. In addition, 2.0 ml of GJ was orally administered twice a day (9:00 AM and 7:00 PM) for 10 consecutive days; on the 11th day the pharmacokinetics of NFP were examined again. Irrespective of route of administration (i.v. or id), NFP CL from plasma in these GJ-treated rats was considerably faster than that in the rats treated with GJ for a short (30-min) period. In microsomes prepared from the intestinal mucosa of animals receiving long-term administration of GJ, NFP oxidation activity (0.21 ± 0.02 nmol/mg/min) and P-450 content (0.045 ± 0.009 nmol/mg) were significantly lower than those in untreated rats (0.32 ± 0.05 nmol/mg/min and 0.060 ± 0.007 nmol/mg). In hepatic microsomes from the same rats, however, NFP oxidation activity (1.43 ± 0.17 nmol/mg/min) and P-450 content (0.66 ± 0.07 nmol/mg) were distinctly greater than those in untreated rats (1.00 ± 0.06 nmol/mg/min and 0.51 ± 0.04 nmol/mg). In conclusion, short-term id exposure to GJ resulted in increased NFP bioavailability, whereas long-term administration of GJ resulted in reduced bioavailability and increased CL.
Grapefruit juice (GJ)1has been reported recently as showing pharmacokinetic interaction with many drugs after they are taken together (Bailey et al., 1998). Dihydropyridine calcium antagonists, including nifedipine (NFP), nisoldipine, nitrendipine (NTP), and felodipine, constitute a representative group of such drugs (Fuhr, 1998). It is known that when these drugs are taken along with GJ their blood concentrations increase significantly, which can cause serious adverse reactions such as hypotension.
As such, the GJ interaction mechanism has recently drawn much attention. Many of the drugs interacting with GJ serve as substrates for the phase I metabolic enzyme cytochrome P-450 CYP3A and the drug elimination transport protein P-glycoprotein. This interaction occurs only when GJ is taken orally and is not caused by i.v. administration (Rashid et al., 1995). It is suggested, therefore, that GJ-drug interaction may be caused due to inhibition of both the CYP3A subfamily (Bailey et al., 1998) and P-glycoprotein-mediated drug transport (Takanaga et al., 1998; Edwards et al., 1999) in the intestinal mucosa.
However, almost all relevant studies have been based on simultaneous administration of GJ and drugs or GJ administration within several hours after drug administration. Only a few reports (Lown et al., 1997;Brunner et al., 1998; Lundahl et al., 1998) investigating the effect of long-term ingestion of GJ on drug pharmacokinetics are available. Against this background, we studied the effect of GJ after its ingestion for 10 consecutive days (b.i.d.) on NFP pharmacokinetics in rats.
Materials and Methods
Chemicals.
Nifedipine (NFP) and NFP oxide (NFPO) were kindly donated by Kanebo Pharmaceuticals Ltd. (Osaka, Japan). NFP was always handled under subdued light. NTP [internal standard (IS)] was obtained from Yoshitomi Pharmaceutical Industries, Ltd. (Osaka, Japan). Methanol (MeOH), acetonitrile (MeCN), and phosphoric acid of HPLC grade were used (Wako Pure Chemical Industries. Ltd., Osaka, Japan). Hydrosulfite was purchased from Kanto Chemicals Co., Inc. (Tokyo, Japan). All other chemicals were of reagent grade (Wako). Water was used after double distillation in a glass still. GJ (plain) was purchased from Kanda Foods Laboratory Co. Ltd. (Tokyo, Japan).
Animals and Drug Administration.
Male Wistar-ST rats (Sankyo Labo Service Co., Ltd., Tokyo, Japan) weighing 280 to 300 g were used throughout the study. The rats were housed in stainless steel cages with five animals per cage in a temperature-controlled (24–26°C) room with a 12-h light/dark cycle. The rats were allowed free access to standard rat chow (Sankyo) and water for 1 week before the experiments. The rats were fasted overnight before the experiments. Each animal was anesthetized with 20% (w/v) urethane (1 g/kg b.wt., i.p.). The femoral vein was cannulated with PE-10 tubing (Clay Adams, Parsippany, NJ) for saline infusion and drug administration. The femoral artery was cannulated with PE-50 tubing (Clay Adams) to collect blood samples over time, with heparin-lock established, using 100 U/ml heparin in saline. Urine samples were collected via a PE-50 tubing bladder cannula into 5-ml glass tubes for 4 consecutive h. To avoid enterohepatic circulation, bile drainage was performed for each rat. An abdominal incision was made, and the common bile duct was cannulated with PE-10 tubing (Clay Adams) to collect bile samples and then closed with surgical clips. During the experiment, body temperature was kept at 38 ± 0.5°C to prevent the hypothermic alteration of bile flow. An NFP solution for injection was prepared by dissolving 50 mg of NFP in a mixture of polyethylene glycol 400 (5 ml), ethanol (5 ml), and saline (10 ml).
Single administration of GJ.
Two milliliters of GJ or saline was injected into the duodenum. After 30 min, NFP was administered at a dose of 3 mg/kg b.wt. via the femoral vein (i.v. administration) or intraduodenally (id administration). Blood samples (each approximately 0.2 ml) were collected via the femoral artery at 0, 5, 10, 15, 20, 30, and 45 min and 1.0, 1.5, 2.0, 3.0, and 4.0 h after i.v. or id administration. The samples were immediately centrifuged at 16,000g and 4°C for 15 min, and plasma was separated. Bile was collected into 2-ml plastic tubes for 30 consecutive min. Each rat also was given saline via the femoral cannula in a volume equivalent to the volume of blood or bile collected (each approximately 0.2–0.5 ml). The plasma samples collected were stored at −80°C until analysis.
GJ administration for 10 consecutive days.
Two milliliters of GJ was administered orally twice a day (9:00 AM and 7:00 PM) for 10 consecutive days. On the 11th day, the same experiments described in Single Administration of GJ before 30 min were performed.
HPLC Conditions.
The HPLC system that was used consisted of a PU-980 pump (JASCO Corp., Ltd., Tokyo, Japan) equipped with a UV/VIS detector (JASCO), a SIL-9A auto-injector (Shimadzu Corporation, Kyoto, Japan), and a C-R4A Chromatopac integrator (Shimadzu). NFP and its primary metabolite (NFPO) were quantified at wavelengths of 260 and 280 nm, respectively. Plasma samples were analyzed for NFP using a reversed phase analytical Capcell Pak UG-ODS column [4.6 mm (inside diameter) × 25 cm; particle size 5 μm (Shiseido Co., Ltd., Tokyo, Japan)] equipped with a guard column packed with Capcell Pak SG-ODS [4.6 mm (inside diameter) × 1 cm; particle size 5 μm (Shiseido)]. A mobile phase consisting of 0.085% phosphoric acid/MeCN (55:45, v/v) was pumped through the column at a speed of 1.0 ml/min. Another mobile phase consisting of 0.085% phosphoric acid/MeOH/MeCN (55:30:20, v/v) was used for in vitro analysis of NFPO in microsomes. Each test was performed in duplicate at room temperature (23°C).
Pretreatment of Biological Samples for HPLC.
To 20 μl of plasma in a 2-ml plastic tube, 180 μl of IS solution (1 μg/ml NTP in MeCN) was added. After vigorous shaking, the sample was centrifuged at 16,000g and 4°C for 10 min; 25 μl of the supernatant was injected directly into the HPLC system.
Analytical Methods.
From NFP/IS peak area ratios versus various NFP concentrations in drug-free plasma samples supplemented with an aliquot of standard NFP, calibration curves (0.63–20 μg/ml) were drawn by linear least-square regression analysis. In vitro NFPO concentrations were obtained from the calibration curve (0.5–10 μM) for various NFPO concentrations in the reaction mixture.
Pharmacokinetic Analysis.
The plasma concentration-time data (0–4 h) from each subject was analyzed by a model-independent method using the MULTI computer program (Yamaoka and Nakagawa, 1983). The area under the concentration-time curve (AUC) was calculated from the values obtained (0–4 h) using the trapezoidal rule. Mean retention time (MRT) was calculated by moment analysis (Yamaoka et al., 1978). The steady-state volume of distribution (Vdss) was calculated by multiplying the dose by MRT/AUC. Apparent plasma clearance (CL/F and CLtot) was calculated by dividing the dose by AUC, where F is bioavailability. The half-life (t1/2) was obtained by dividing natural logarithm of 2 by Kel, the apparent elimination rate constant, as obtained from the elimination phase gradient.
Preparation of Intestinal and Hepatic Microsomes.
Microsomes from rat intestinal epithelia were prepared by the method ofBonkovsky et al. (1985). Briefly, a 30-cm portion (from pars pylorica ventriculi) of rat small intestine was rinsed with solution A, pH 7.3, containing 1.5 mM KCl, 96 mM NaCl, 27 mM sodium citrate, 8 mM KH2PO4, 5.6 mM Na2HPO4, and 23.0 mM phenylmethylsulfonyl fluoride (PMSF) and incubated for 15 min at 37°C in solution A. The contents of the intestine were replaced with ice-cooled solution B containing 136.9 mM NaCl, 2.68 mM KCl, 1.47 mM KH2PO4, 8.1 mM Na2HPO4, 1.5 mM EDTA, 0.5 mM dithiothreitol, and 23.0 mM PMSF, and the intestine was placed on a glass plate on ice and tapped gently several times. The harvesting procedures for intestinal epithelia in solution B were repeated three times. The separated cells were washed with solution C, pH 7.0, containing 5.0 mM histidine, 0.25 M sucrose, 0.5 mM EDTA, and 23.0 mM PMSF and centrifuged at 800g for 10 min. The cells were homogenized in 5 ml of solution C and centrifuged at 15,000gfor 10 min. After calcium chloride was added to a final concentration of 10 mM, the supernatant was kept standing on ice for 15 min. Intestinal microsomes were separated by centrifugation at 2000g for 10 min.
Hepatic microsomal preparations were obtained by a modification of the method of Litterst et al. (1975). Specifically, minced liver tissue was homogenized in 10 mM Tris-HCl buffer (pH 7.4) containing 0.25 M sucrose at 25% (w/v) concentration. The homogenate was centrifuged at 700g for 10 min and then at 10,000g for 10 min. After calcium chloride was added to a final concentration of 10 mM, the supernatant was kept standing on ice for 15 min. Hepatic microsomes were obtained by centrifugation at 2000g for 10 min.
Both microsomal pellets were resuspended in 100 mM Tris-HCl (pH 7.4) containing 20% (w/v) glycerol and 10 mM EDTA and stored at −80°C until use. Protein concentration was measured by the method of Lowry et al. (1951).
Microsomal Experiments.
Sixty milliliters of a reaction mixture of 100 mM sodium phosphate buffer (pH 7.4) containing NFP (200 μM), NADPH (1 mM), and microsomes (0.05 mg) was incubated for 10 min at 37°C. After incubation, MeCN (100 μl) and a saturated aqueous ammonium sulfate solution (60 μl) were each added to the reaction mixture. The sample was shaken vigorously for 20 s and centrifuged at 16,000g at 4°C for 5 min, and the organic layer (25 μl) was injected into the HPLC system. The NFPO produced from NFP by this enzymatic incubation was analyzed by HPLC.
Assay of Cytochrome P-450.
An intestinal (1 mg/ml) or hepatic (2 mg/ml) microsomal suspension in 0.1 M potassium phosphate buffer (pH 7.4) containing 20% glycerol was bubbled with CO for approximately 20 s; a few grains of hydrosulfite were then added to the cuvette and to a cuvette containing the same microsomal suspension that was not exposed to CO. Differential spectra were taken using the Hitachi 228A spectrophotometer (Hitachi Ltd., Tokyo, Japan); the cytochrome P-450 concentration in the microsomal fraction was calculated using an extinction coefficient of 91/cm/mM for A450 minus A490.
Data Analysis.
All data are expressed as mean ± S.D. Unpaired Student'st test and one-way ANOVA followed by least-significant difference analysis were used to test for significant differences in mean values. The significance level was set at P < .05.
Results
Pharmacokinetics.
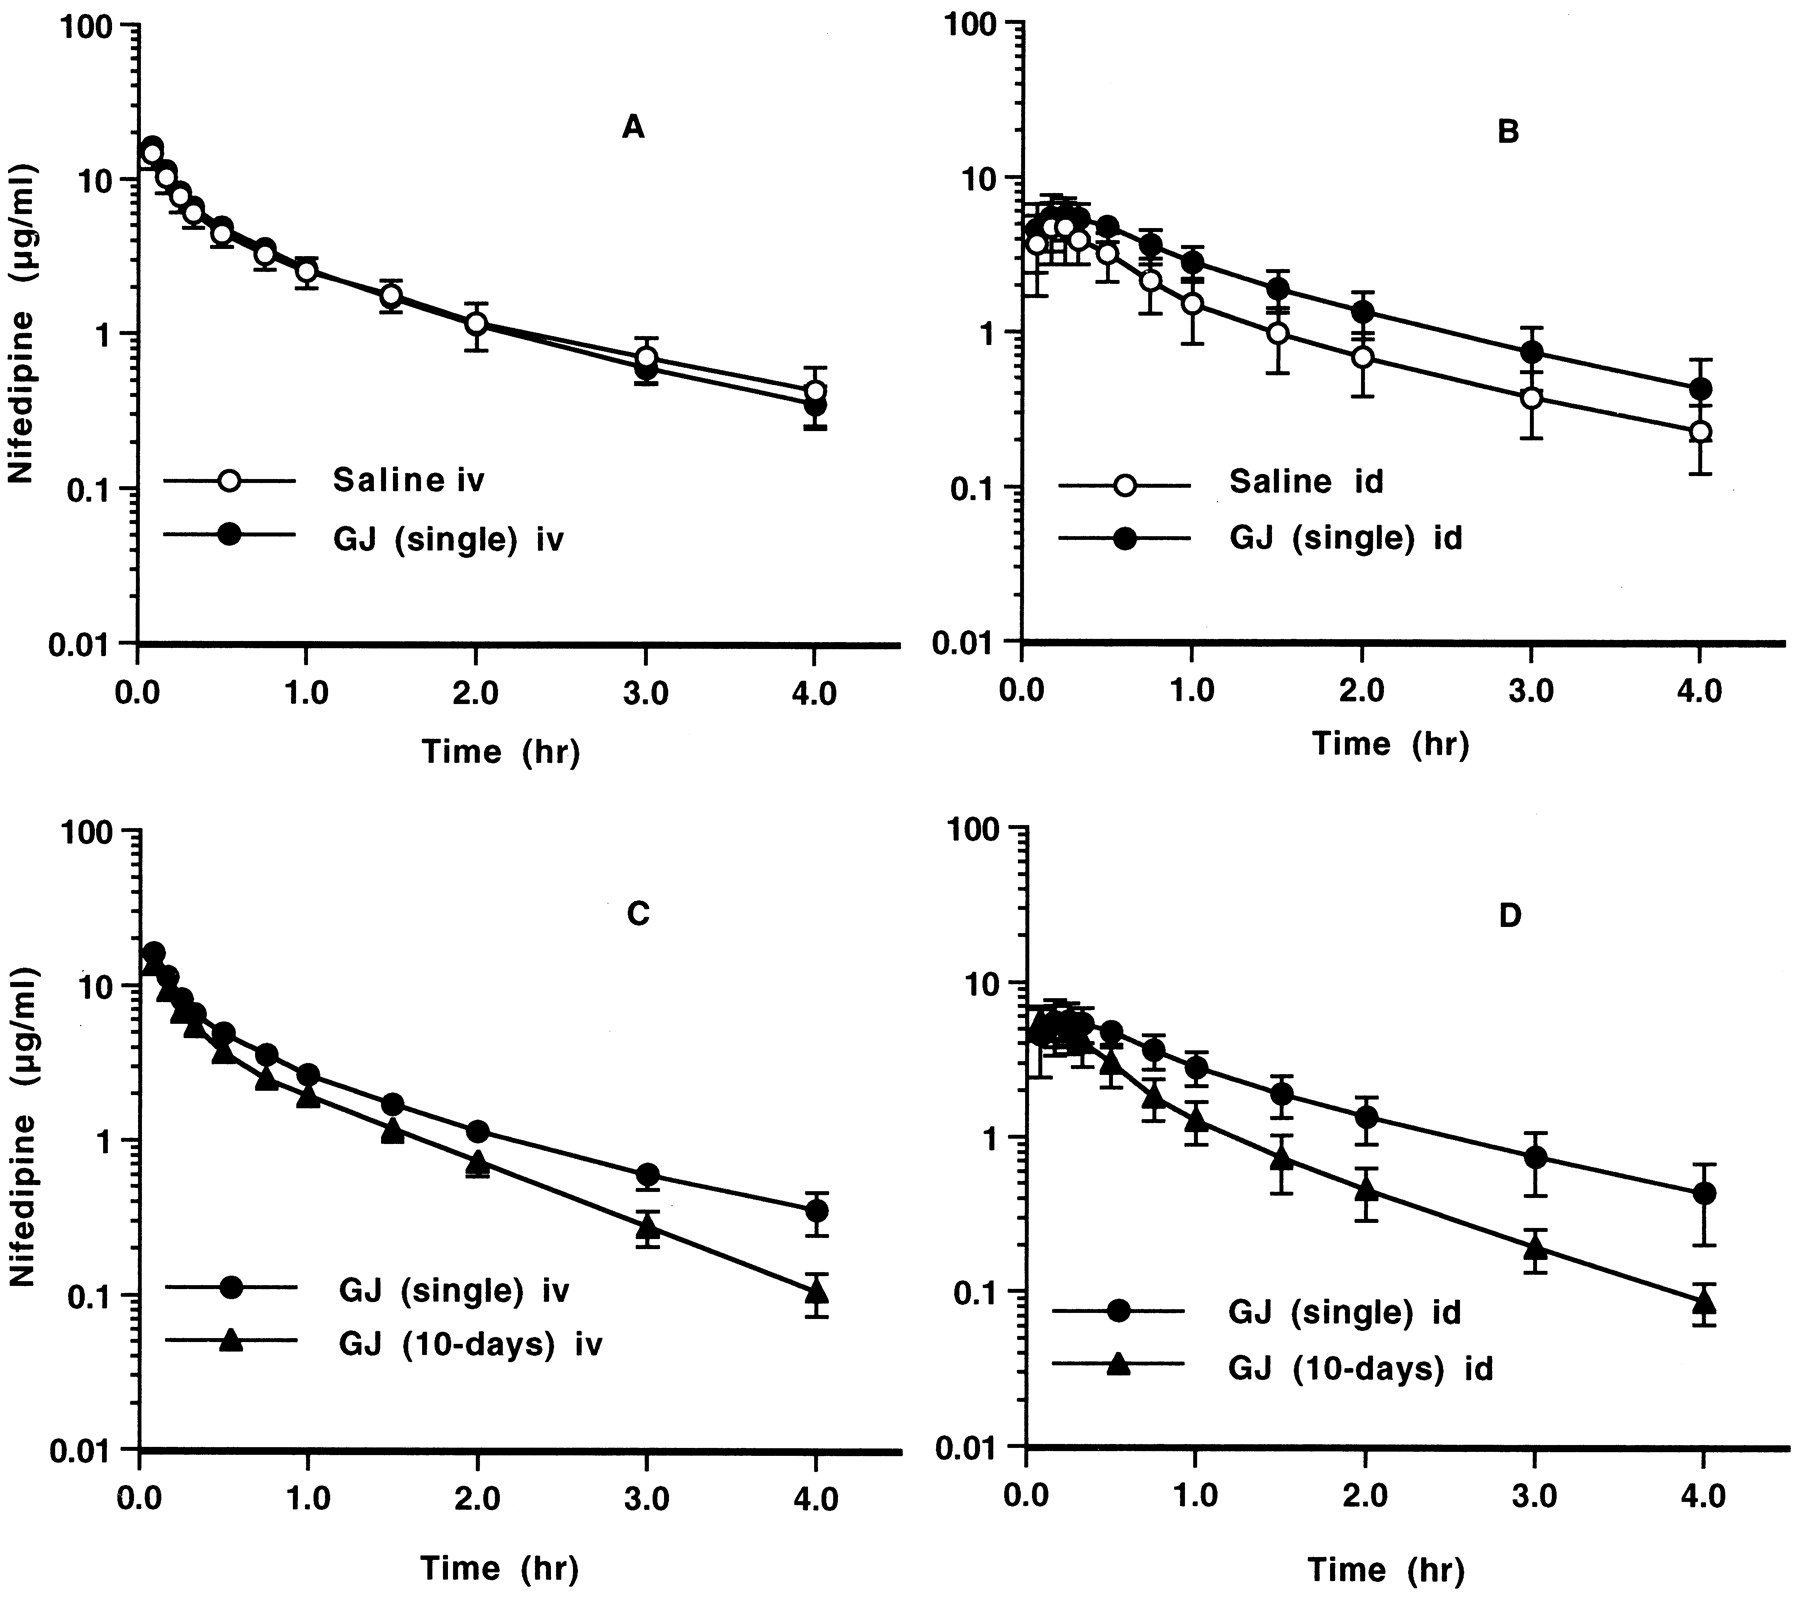
NFP plasma concentration-time curve profiles after single and long-term administrations of GJ to rats are shown in Figs. 1–4.
Effect of single administration of GJ.
No significant difference was observed between both pharmacokinetic values after i.v. administration of NFP (Fig. 1A, Table1). In id administration, the mean AUC value of the rats receiving GJ was approximately 1.62 times that of the rats receiving saline, and the mean CL/F value was approximately 0.61 times greater (Fig. 1B, Table 1).

Plasma concentration-time curves for NFP after a single i.v. (A) or id (B) administration of NFP 30 min after a single dose of GJ (2 ml) or saline (2 ml) administration into the duodenum, and after a single i.v. (C) or id (D) administration of NFP 30 min after a single dose of GJ (2 ml) into the duodenum or after successive 10-day (p.o.) dosing of GJ.
Dose of NFP: 3 mg/kg. Each point and vertical bar represent the mean and S.D. (n = 5). Symbols: NFP (●) administered 30 min after a single dose of GJ, NFP (○) administered after saline, and NFP (▴) administered after successive 10-day (p.o.) dosing of GJ.
Pharmacokinetic parameters of NFP after id and i.v. administrations in rats preadministered with saline or GJ
Effect of GJ administered for 10 consecutive days.
Irrespective of administration route (i.v., Fig. 1C; id, Fig. 1D), NFP disappeared from plasma more rapidly in the rats receiving long-term administration of GJ. In i.v. administration, the mean AUC, MRT, CLtot, Kel, andt1/2 values of the rats receiving long-term were approximately 0.74, 0.85, 1.44, 1.51, and 0.64 times those of the rats receiving GJ 30 min previously, respectively. In id administration (Fig. 1D), the mean AUC, MRT, CL/F, and Kelvalues of the rats receiving long-term administration of GJ were approximately 0.58, 0.65, 1.91, and 1.38 times those of the rats receiving GJ 30 min previously, respectively (Table 1).
NFP-Oxidation Activity and Total Cytochrome P-450 Concentration in the Intestinal and Hepatic Microsomes of Rats Receiving GJ for 10 Consecutive Days.
Intestinal microsomes
Activity for oxidation from NFP to NFPO and P-450 concentration in the intestinal microsomes of untreated rats were 0.32 ± 0.05 nmol/mg/min and 0.060 ± 0.007 nmol/mg, respectively (Fig.2), whereas those in the intestinal microsomes of the rats receiving long-term administration of GJ were 0.21 ± 0.02 nmol/mg/min and 0.045 ± 0.009 nmol/mg, respectively (Fig. 2).

Effect of long-term GJ ingestion on NFP oxidation activity (represented by NFPO) and the content of P-450 (P-450) in the microsomes from rat liver and small intestine.
Each point and vertical bar represent the mean and S.D. (n = 5).
Hepatic microsomes.
NFP oxidation activity and P-450 concentration in the hepatic microsomes of untreated rats were 1.00 ± 0.06 nmol/mg/min and 0.51 ± 0.04 nmol/mg, respectively (Fig. 2), whereas those in the hepatic microsomes of the rats receiving long-term administration of GJ were 1.43 ± 0.17 nmol/mg/min and 0.66 ± 0.07 nmol/mg, respectively.
Discussion
There are a large number of reports suggesting drug-food interaction (Yamreudeewong et al., 1995). In many cases, the subjects of such studies are pharmacokinetic and/or pharmacodynamic interactions caused by concurrent ingestion of drugs and foods. It is well known that when a certain drug is taken with GJ its plasma drug concentration elevates significantly, resulting in enhanced pharmacological action of the drug (Bailey et al., 1998). We studied the effects of GJ on the pharmacokinetics of NFP after short- and long-term administration of GJ.
In i.v. administration of NFP to rats receiving GJ or saline 30 min previously, GJ administration did not affect the plasma NFP concentration-time profile (Fig. 1A). In id administration, however, the plasma concentration-time profile of NFP differed significantly between the two cases (Fig. 1A). GJ increased the plasma NFP concentration. The AUC of id administered NFP was approximately 1.6 times that of the control group. Grundy et al. (1998) reported on the effects of GJ and orange juice on NFP bioavailability in the rat. Our results of single administration of GJ agreed well with their results for GJ. Bailey et al. (1991) reported for the first time that the bioavailability of oral NFP (10 mg) taken with GJ was 1.35 times of that taken with water in humans. This finding was later confirmed byRashid et al. (1995). They also reported that GJ ingestion had no effect on the plasma NFP concentration after NFP i.v. administration. Our results agreed generally with these results in humans. Because this study well reflects NFP-GJ interaction in humans, our experimental system using rats is expected to be useful in examining drug-GJ interaction.
Interestingly, in long-term administration of GJ, NFP CL from plasma increased in comparison with that observed in the group receiving GJ 30 min previously (Figs. 3 and 4). Rapid NFP CL from plasma was also observed in id administration (Fig. 1D).
Lown et al. (1997) evaluated the effect of repeated GJ administration on CYP3A4 expression. They administered a 10-mg felodipine tablet to 10 healthy volunteers together with GJ after t.i.d. administration of GJ for 6 days. The results showed that GJ did not alter liver CYP3A4 activity, colic CYP3A5 level, or small intestinal concentrations of P-glycoprotein, villin, CYP1A1, and CYP2D6 but reduced the CYP3A4 concentration in small intestinal mucosa by 62% without a corresponding change in CYP3A4 mRNA level. The AUC of the subjects receiving repeated GJ administration was approximately 1.4 times greater than that of the subjects receiving single administration of GJ. Recently, Lundahl et al. (1998) reported on the effect of long-term administration of GJ on felodipine pharmacokinetics. They compared the plasma felodipine concentrations after ingestion of a 10-mg felodipine extended release tablet and GJ between single intake and 14-day daily intake of GJ. They reported no significant difference in plasma felodipine concentration between the two meal treatments. These two human studies of GJ-felodipine interaction yielded different results. Brunner and coworkers (Brunner et al., 1998) reported that the AUC after oral administration of cyclosporine increases as the number of t.i.d. ingestions of GJ increases. These previous results from human studies did not agree with our results obtained using rats. Although the cause remains unclear, this discrepancy may be due to the use of different drugs and animal species. Felodipine and cyclosporine are known to be likely to undergo first-pass effect during passage through the intestine and liver and to show great variation among patients (Blychert et al., 1991; Kahan et al., 1996). The bioavailability of felodipine and cyclosporine are approximately 10 to 23% (Edgar et al., 1987) and 11 to 30% (Gupta and Benet, 1989), respectively, and that of NFP is approximately 56 to 70% (Raemsch and Sommer, 1983). The proportion of first-pass metabolism during intestinal passage is higher for felodipine and cyclosporine than for NFP. This suggests that the plasma concentration of cyclosporine and felodipine may depend largely on their metabolism in the small intestine, whereas that of NFP may be more dependent on its metabolism in the liver after passage through the small intestine rather than in the small intestine. Therefore, it is assumed that the plasma NFP concentration after long-term administration of GJ is more sensitive to change in hepatic metabolism.
The mutually reverse results of long-term GJ administration on the CL of oral felodipine and cyclosporine may be explained by selective contribution of P-glycoprotein to cyclosporine first-pass (Lown et al., 1997), which is not observed for felodipine. The short- and long-term effects of GJ on small intestinal P-glycoprotein activity are not well known (Soldner et al., 1999), which may complicate the mechanistic interpretation of the in vivo blood concentration-time profiles for drugs serving as substrates for both metabolism and efflux transporter.
Bearing in mind that the rapid NFP CL by long-term administration of GJ is due to the induction of the NFP-metabolizing enzymes, we examined the induction of the NFP-metabolizing enzymes in the liver and small intestine. NFP oxidation activity in the gastrointestinal microsomes was significantly lower in rats receiving GJ for 10 consecutive days than that in untreated rats (Fig. 2). P-450 content in the gastrointestinal microsomes also decreased significantly. Previously, Schmiedlin-Ren et al. (1997) showed that in humans GJ reduced not only gastrointestinal P-450 activity but also P-450 content in the gastrointestinal microsomes. Our results agree well with their results in that GJ components inhibit the enzymes and reduce P-450 content in the intestinal epithelia.
Unexpectedly, in the hepatic microsomes prepared from the same rats, the NFP oxidation activity and P-450 content were approximately 1.43 and 1.30 times greater than those in the microsomes of untreated rats, respectively (Fig. 2). These findings strongly suggest the induction of rat hepatic P-450 by repeated administration of GJ.
Recently, some furanocoumarin derivatives showing strong inhibitory action on P-450 activity (e.g., bergamottin, 6′,7′-dihydroxybergamottin) were isolated from GJ (Fukuda et al., 1997;Schmiedlin-Ren et al., 1997; He et al., 1998). It is likely that these GJ components, which directly inhibit the enzyme activity of P-450 in small intestinal epithelia, increased NFP bioavailability after id administration of GJ.
The furanocoumarin derivative 8-methoxypsoralene has been reported to induce various metabolic enzymes in the liver (Mandula et al., 1978;Bickers and Pathak, 1984; Letteron et al., 1986; Gwang, 1996; Diawara et al., 1999). Based on the fact that 8-methoxypsoralen is structurally very similar to bergamottin derivatives, it is likely that the hepatic metabolic enzymes are induced by such derivatives or other molecules contained in GJ during its long-term ingestion. This report, for the first time, suggests the possibility of induction of the hepatic drug metabolic enzyme P-450 by long-term repeated ingestion of GJ. It is known, however, that there are interspecific differences in enzyme induction between rats and humans. For example, rifampicin causes enzyme induction in humans but not in rats. Further investigations in humans are therefore necessary to apply our rat findings to humans.
In conclusion, no significant difference was observed between both pharmacokinetic values after i.v. administrations of NFP to the rats administered GJ and saline 30 min previously, respectively. However, the NFP bioavailability in rats receiving id administration of GJ 30 min previously was approximately 1.6 times that of control rats. However, irrespective of administration route (i.v. or id), rapid NFP CL from plasma was observed in the rats receiving long-term administration of GJ. In these rats, although the oxidation activity and P-450 content in the intestinal mucosa decreased, those in the liver increased significantly. We demonstrated for the first time that repeated administration of GJ increased the metabolic enzyme P-450 level in the liver.
Acknowledgments
We thank Sanae Goto and Yuki Iwazaki at Meiji Pharmaceutical University for skillful technical assistance.
Footnotes
-
Send reprint requests to: Dr. Kiminori Mohri, Clinical Pharmaceutics Laboratory, Department of Pharmaceutics, Meiji Pharmaceutical University, 2-522-1 Noshio, Kiyose-shi, Tokyo 204-8588, Japan. E-mail: k-mohri{at}my-pharm.ac.jp
- Abbreviations used are::
- GJ
- grapefruit juice
- NFP
- nifedipine
- NFPO
- NFP oxide
- NTP
- nitrendipine
- IS
- internal standard
- AUC
- area under the concentration-time curve
- MRT
- mean resident time
- PMSF
- phenylmethylsulfonyl fluoride
- id
- intraduodenal(ly)
- CL
- clearance
- Received July 19, 1999.
- Accepted January 4, 2000.
- The American Society for Pharmacology and Experimental Therapeutics


