


Abstract
The possible beneficial effects of tea consumption have attracted a great deal of attention. Many of the biological effects have been attributed to tea catechins, but the metabolic fate of these compounds is not clear. In the present study, a major metabolite observed in human blood and urine samples after green tea administration was identified as a O-methylated derivative of (−)-epigallocatechin (EGC) by comparison with products from chemical and enzymatic O-methylation of EGC. The structure of this metabolite was elucidated as 4′-O-methyl-(−)-epigallocatechin (4′-O-MeEGC) by 1H and 13C NMR and heteronuclear multiple bond connectivity experiment. The human plasma level of 4′-O-MeEGC reached its peak value within the first 2 h following tea ingestion. Its maximum concentration was 4 to 6 times higher than that of EGC. The half-lives of EGC and 4′-O-MeEGC in the blood were 1.02 ± 0.07 and 4.39 ± 1.14 h, respectively. The amount of 4′-O-MeEGC excreted in urine was about 3 times higher than that of EGC, and 88% of 4′-O-MeEGC was excreted in urine within 8 h. The present structural information and concentration-time profile of this metabolite provide the basis for understanding the biotransformation of EGC and for future elucidation of its biological activities.
Consumption of tea (Camellia sinensis) has been postulated to protect against cancer and cardiovascular diseases. These potential health effects have been attributed to the antioxidative and other activities of tea catechins. The inhibitory activities of catechins against tumorigenesis have been demonstrated in many animal models (Yang et al., 2000; Mukhtar and Ahmad, 1999), but the relationship between tea consumption and human cancer is inconclusive (Blot et al., 1996; Katiyar and Mukhtar, 1996;Buschman, 1998). The lack of understanding of the bioavailability and pharmacokinetic properties of tea catechins is a major obstacle in understanding the possible health effects of tea.
There are four major catechins in tea: (−)-epigallocatechin (EGC1), (−)-epicatechin (EC), (−)-epigallocatechin-3-gallate (EGCG), and (−)-epicatechin-3-gallate (ECG). There is evidence thatO-methylation is one of the major biotransformation pathways for catechin metabolism in mammals. Formations of 3′-O-methyl-(+)-catechin, 3′-O-methyl-(−)-epicatechin, and 4′-O-methyl-(−)-epicatechin have been reported (Hackett et al., 1982; Mariusz et al., 1998;Okushio et al., 1999a). Recently, O-methylated EGCG derivatives have been identified as biliary metabolites in rats after oral administration of EGCG (Kida et al., 2000). Most of these compounds exist in the glucuronide and sulfate conjugated forms. Several studies have confirmed that tea catechins could beO-methylated by catechol-O-methyltransferase (COMT) in vitro (Okushio et al., 1999b; Zhu et al., 2000). However, little attention has been given to the metabolic fate of catechins in humans. In our previous studies, we have established chromatographic methods for the analysis of catechins in human blood and urine (Lee et al., 1995, 2000). The levels of tea catechins following ingestion of tea or tea catechins by humans and rodents have been studied in our laboratory (Chen et al., 1997; Yang et al., 1998, 1999; Kim et al., 2000). Recently we observed a possible catechin metabolite, designated as M7, which has a retention time of 25.5 min detectable at 200 mV and higher potentials in our HPLC coulochem electrode array system (HPLC-CEAS). By comparing it with mono-O-methylated EGC (MeEGC) prepared from enzymatic and chemical O-methylation of EGC, this peak was identified as 4′-O-methyl-(−)-epigallocatechin (4′-O-MeEGC). This metabolite can be found in human urine and blood samples. The present study was conducted to identify the chemical structure and to characterize the concentration-time profile of this metabolite in humans after tea ingestion.
Experimental Procedures
Materials.
The green tea solids preparation was obtained from Thomas J. Lipton Inc. (Englewood Cliffs, NJ). One gram of green tea solids contained about 88 mg of EGCG, 82 mg of EGC, 32 mg of EC, and 33 mg of ECG. EGC, EC, EGCG, ECG, S-adenosyl-l-methionine (SAM), β-d-glucuronidase (EC 3.2.1.31), sulfatase (EC 3.1.6.1), and COMT (EC 2.1.16) were purchased from Sigma Chemical Co. (St. Louis, MO).
Human Sample Collection and Preparation.
The study had the participation of four healthy adult volunteers 30 to 50 years of age, weighing 66 to 78 kg, who did not smoke or drink alcoholic beverages. This study was approved by the Institutional Review Board of Rutgers University (Protocol 92-034). The subjects did not ingest tea or tea-related beverages for at least 2 days prior to the experiment and during the urine sample collection period. They were given a single oral dose of green tea solids (20 mg/kg of body weight) in 200 ml of warm water in the morning. Blood samples (3 ml each) were collected in heparin-containing tubes at 0, 0.25, 0.5, 1, 2, 3, 5, 8, 12, and 24 h. Urine samples were collected before the dose and for the time periods 0 to 3, 3 to 8, and 8 to 24 h after the dose. Blood and urine samples were processed and stored as described previously (Lee et al., 2000). The methods developed by Lee et al. (2000) were used for the preparation of blood and urine samples. In brief, the samples were digested with β-d-glucuronidase and sulfatase, extracted with ethyl acetate, and dried under reduced pressure. The dried sample was dissolved in 10% acetonitrile aqueous solution and injected onto the HPLC.
HPLC Analysis of Human Samples.
The HPLC-CEAS system consisted of an ESA model 465 refrigerated autosampler, an ESA model 580 two-pump solvent delivery system, an ESA 5500 coulochem electrode array system, and a Supelcosil C18 reversed phase column (150 × 4.6-mm i.d.; pore size, 5 μm; Supelco Inc., Bellefonte, PA). The autosampler and column temperatures were maintained at 6 and 35°C, respectively. The column was eluted at a flow rate of 1 ml/min with buffer A (30 mM NaH2PO4 buffer containing 1.75% acetonitrile and 0.12% tetrahydrofuran, pH 3.35) and buffer B (15 mM NaH2PO4 buffer containing 58.5% acetonitrile and 12.5% tetrahydrofuran, pH 3.45). From 0 to 7 min, the concentration of buffer B was 4%, with buffer A composing the remaining 96%. Then the linear gradient was changed by increasing buffer B to 17% at 25 min, 28% at 31 min, 33% at 37 min, and 98% at 38 min. It was maintained at 98% from 38 to 43 min and finally changed back to 4% at 44 min for the analysis of the next sample. The eluent was monitored by the CEAS with potential settings at 200, 300, 400, 500, 600, 700, 800, and 900 mV, and eight chromatograms were obtained simultaneously. The method of quantification of 4′-O-MeEGC in human blood and urine samples was described previously (Lee et al., 2000). Chemically synthesized 4′-O-MeEGC was added into control plasma and urine; the samples were incubated, extracted, and analyzed. The overall recoveries of 4′-O-MeEGC in human plasma and urine were about 85 and 90%, respectively. The detection limit of 4′-O-MeEGC was 5 to 10 ng/ml under the described experimental condition. The regression analysis of the peak height versus concentration showed linearity over a range of 1 to 10,000 ng/ml of plasma or urine with correlation coefficient values (r) of >0.995.
Synthesis and Isolation of MeEGC.
The conditions for enzymatic O-methylation of EGC were similar to those described by Zhu et al. (2000). The reaction mixture consisted of 30 μM EGC, 250 units of COMT, 60 μM SAM, 1.2 mM magnesium chloride, and 1.0 mM dithiothreitol in a final volume of 1 ml of 10 mM Tris-HCl buffer, pH 7.4. The mixture was incubated for 1 h at 37°C and then extracted with 750 μl of ethyl acetate three times. The organic phase was transferred into another tube, centrifuged, and dried under reduced pressure. For chemical synthesis of MeEGC, EGC (125 mg) was mixed with 0.5 ml of methyl iodide and 250 mg of K2CO3 in 10 ml of acetone. The mixture was irradiated in an ultrasonic bath for 2.5 h at room temperature (Donovan et al., 1999). The mixture was filtered and the solvent was removed under reduced pressure. The products were redissolved in 10% acetonitrile aqueous solution and separated by HPLC, using aqueous mobile phase consisting of 8.5% acetonitrile, 1.5% tetrahydrofuran, and 0.1% trifluoroacetic acid at a flow rate of 1.5 ml/min and monitored at 280 nm. The purified compounds were kept at −80°C for further use.
LC/MS Analysis of MeEGC.
LC/MS analysis was carried out with a Waters 2690LC separation module coupled with a photodiode-array UV detector and a tandem Finnigan MAT LCQ mass detector (San Jose, CA) incorporated with an electrospray ionization (ESI) interface. A Supelcosil LC18column (150 × 2.1-mm i.d.; particle size, 5 μm) was used for separation at 30°C with a flow rate of 0.2 ml/min. The column elution started with 90% solvent A (10% aqueous methanol) and 10% solvent B (70% aqueous methanol). The linear gradient was changed to 31% B rapidly at 3 min, and 33% B at 17 min. It was changed to 100% B at 22 min to clean the column and then changed back to 10% B at 36 min for the next run. The LC elute was introduced into the ESI interface after UV scanning from 200 to 400 nm. The conditions of mass detection have been described by Li et al. (2000). Full scan MS, tandem mass spectrometry (MS/MS), and selected ion monitoring techniques were used to identify the chemically and enzymatically synthesized MeEGC and the corresponding urinary metabolite.
Results and Discussion
In our previous studies, the electric potential setting of the HPLC-CEAS system was from −90 to 150 mV, which was suitable for the analysis of catechins (Lee et al., 1995). We also detected some new peaks in human urine and blood samples when the potentials were set at 200 mV and higher voltages. One peak with a retention time (tR ) of 25.5 min was referred to as M7. This peak existed in human urine and plasma after green tea ingestion, but not in the samples collected before tea ingestion or in the green tea preparation (Fig. 1). This observation suggests that M7 is a metabolite of tea constituents.
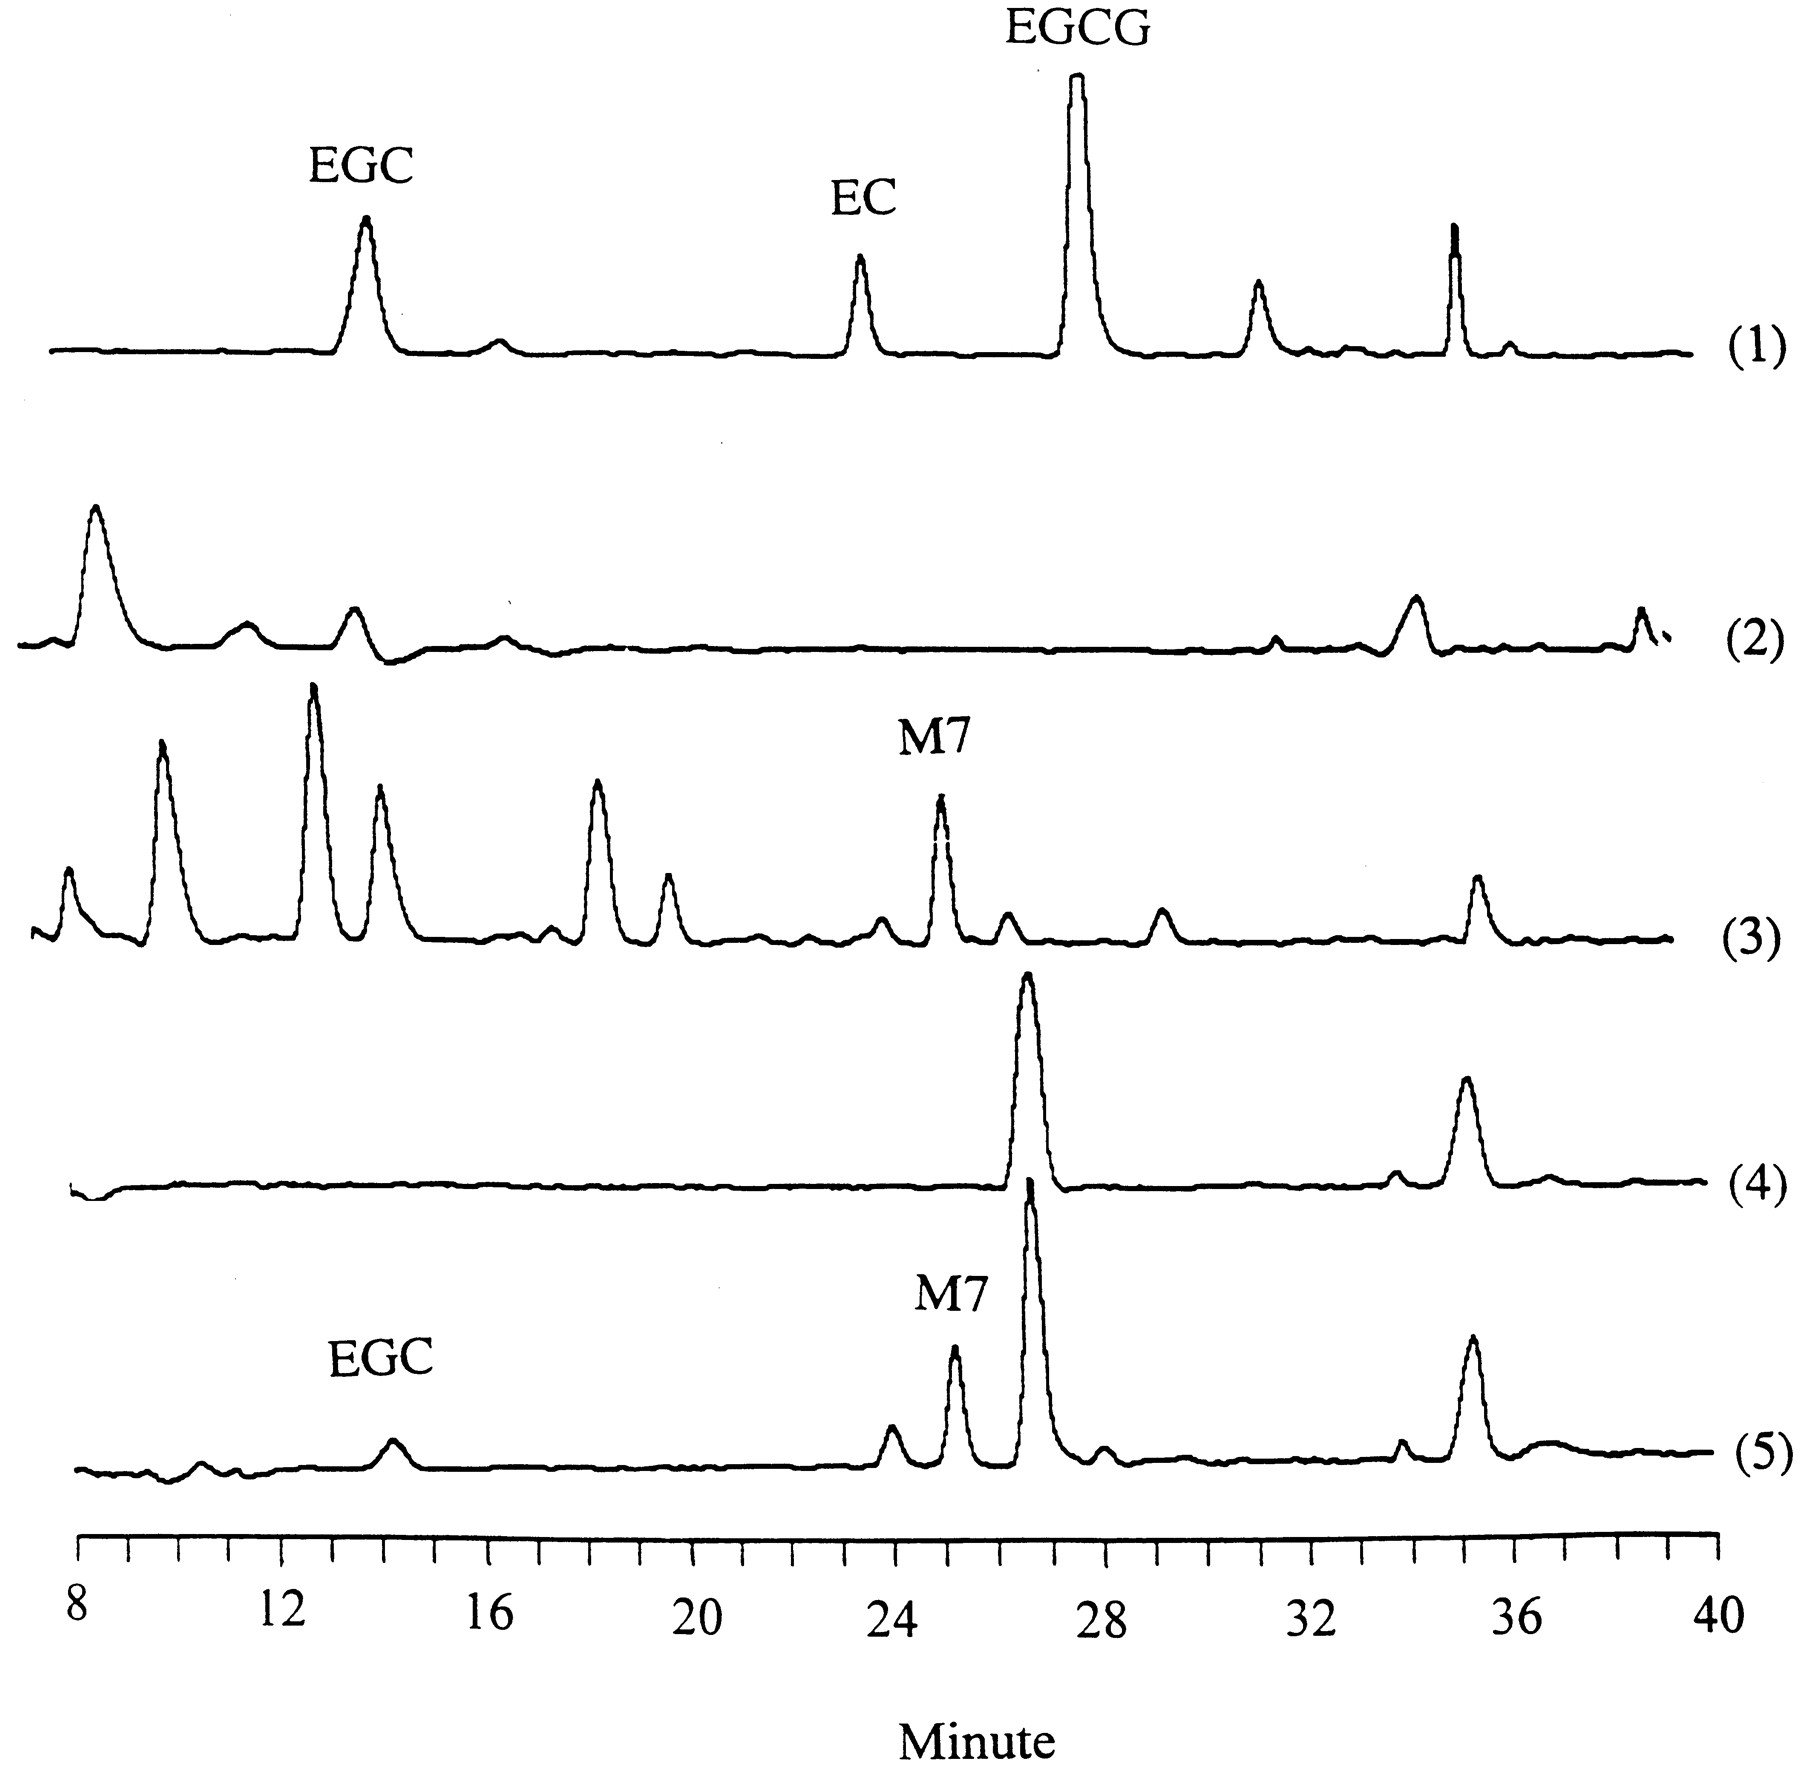
HPLC-CEAS detection of EGC and M7 in human urine and blood samples.
The human samples were treated with β-d-glucuronidase and sulfatase, extracted, and injected onto the HPLC as described underExperimental Procedures. The chromatograms were obtained at 400 mV. 1, green tea extract; 2, human urine sample collected before green tea ingestion; 3, human urine sample collected after green tea ingestion; 4, human plasma sample collected before green tea ingestion; 5, human plasma sample collected after green tea ingestion.
As reported by Okushio et al. (1999b) and Zhu et al. (2000), catechins are good substrates for animal and human COMT. We incubated EGC with COMT from porcine liver and SAM to prepare MeEGC. We also conducted chemical O-methylation by mixing EGC with methyl iodide and K2CO2 in acetone solution. The yield of major MeEGC in chemical O-methylation and enzymatic O-methylation was about 30 and 60% according to HPLC analysis. The purity of isolated MeEGC from chemical synthesis was more than 95% based on HPLC rechromatography and NMR analysis. The products were redissolved in 10% acetonitrile and analyzed by HPLC-CEAS system with potential setting at 400 mV. As shown in Fig.2, the major MeEGC of both the chemical and enzymatic O-methylation had the same retention time as M7 (25.5 min) in human urine sample.

HPLC-CEAS detection of EGC and M7 in human urine and products of enzymatic and chemical O-methylation of EGC.
The human urine sample and synthesized samples were prepared and analyzed by HPLC as described under Experimental Procedures. The chromatograms were obtained at 400 mV. 1, human urine samples after green tea ingestion; 2, products of EGC enzymaticO-methylation; 3, products of EGC chemicalO-methylation.
LC/ESI-MS analysis was performed for further identification of the MeEGC produced by enzymatic and chemical O-methylation and M7 released by β-d-glucuronidase/sulfatase digestion of human urine samples. The samples were injected onto the LC/ESI-MS system and monitored with selected ion monitoring and MS/MS modes. We chose m/z 319, the [M − H]− ion of MeEGC (mol. wt., 320), to monitor the mass spectrum of these samples. As shown in Fig.3, all three samples have a major peak with a retention time about 16 min under the elution conditions of LC/ESI-MS. This peak matched the peak that had a 25.5-min retention time in HPLC-CEAS system. Full scan MS/MS can selectively provide the fragmentation information of compounds that have deprotonated molecular ion m/z 319. The fragment ionm/z 304 ([M − H − 15]−) suggests the existence of a methyl group in these compounds; the m/z 301 peak (m/z 319 − H2O) corresponded to [M − H − 18]−;m/z 137 is the characteristic fragment ion of catechins formed via retro Diels-Alder mechanism, which is also shown in the MS/MS spectra of these samples (Miketova et al., 1998). The same fragmentation patterns of these three compounds suggest that M7 has the same chemical structure as MeEGC.
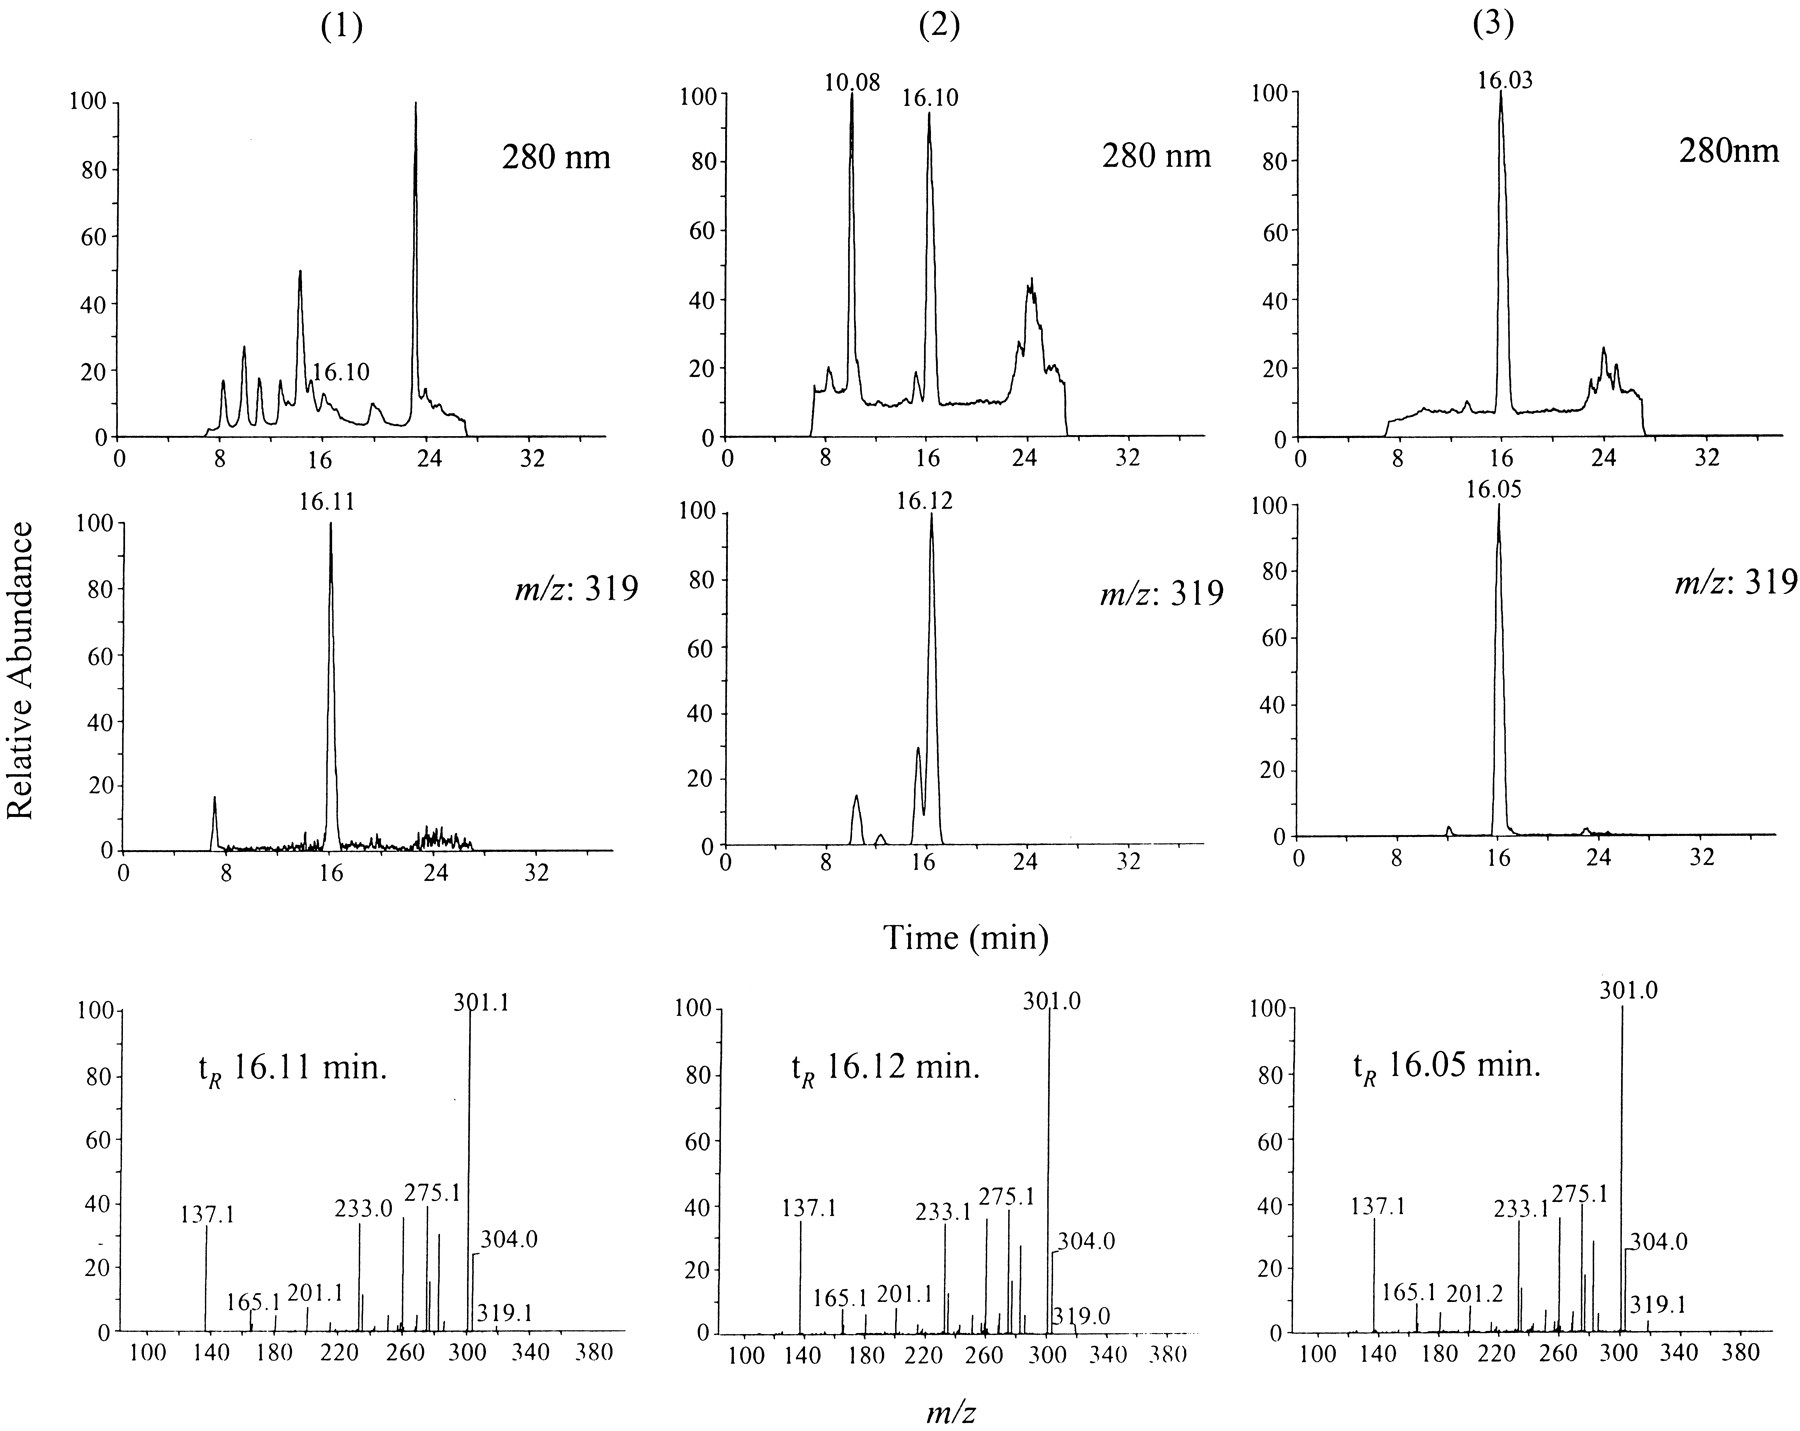
HPLC/photodiode-array-UV/ESI-MS analysis of MeEGC from human urine and from enzymatic and chemical synthesis.
The urine sample and the products of enzymatic and chemicalO-methylation of EGC were prepared as described underExperimental Procedures. All samples were redissolved in methanol and injected onto LC/MS. 1, human urinary samples after green tea ingestion; 2, product of EGC enzymaticO-methylation; 3, product of EGC chemicalO-methylation.
EGC contains six hydroxyl groups, which are all potential positions for alkylation. Mass spectral data, especially MS/MS spectra, have been successfully used to deduce the site of alkylation or esterification in the structures of catechins. Miketova et al. (2000) suggested that the formation of fragment ion m/z 125 required the presence of a free phenol in the 4′ position of the B-ring; if the 4′ position is alkylated, this ion could not be observed in the mass spectrum. In our MS/MS analysis of EGC and MeEGC, the presence ofm/z 125 ion in the mass spectrum of EGC corresponds to the free hydroxyl group at 4′ position, and the absence of the same ion in the MS/MS spectrum of MeEGC suggestsO-methylation at 4′ position.
NMR experiments were carried out to further identify the structure of MeEGC. The assignments of 1H NMR and13C NMR data of EGC (Davis et al., 1996) and chemically synthesized MeEGC are shown in Table1. These data of MeEGC are identical with 4′-O-methyl-(−)-epigallocatechin (4′-O-MeEGC) identified by Okushio et al. (1999b). In addition, a cross-peak between C-4′ and the methyl protons was observed in the heteronuclear multiple bond connectivity experiment. The only cross-peak associated with C-3′ is between C-3′ and H-2′. This further confirmed that the methoxyl group is connected to C-4′, but not C-3′. Thus, the structure was elucidated as 4′-O-MeEGC. Since M7 has the same HPLC retention time and mass fragment pattern as MeEGC, the structure of M7 was proposed as 4′-O-MeEGC.
1H NMR and 13C NMR Spectral Data1-a for 4′-O-MeEGC and EGC
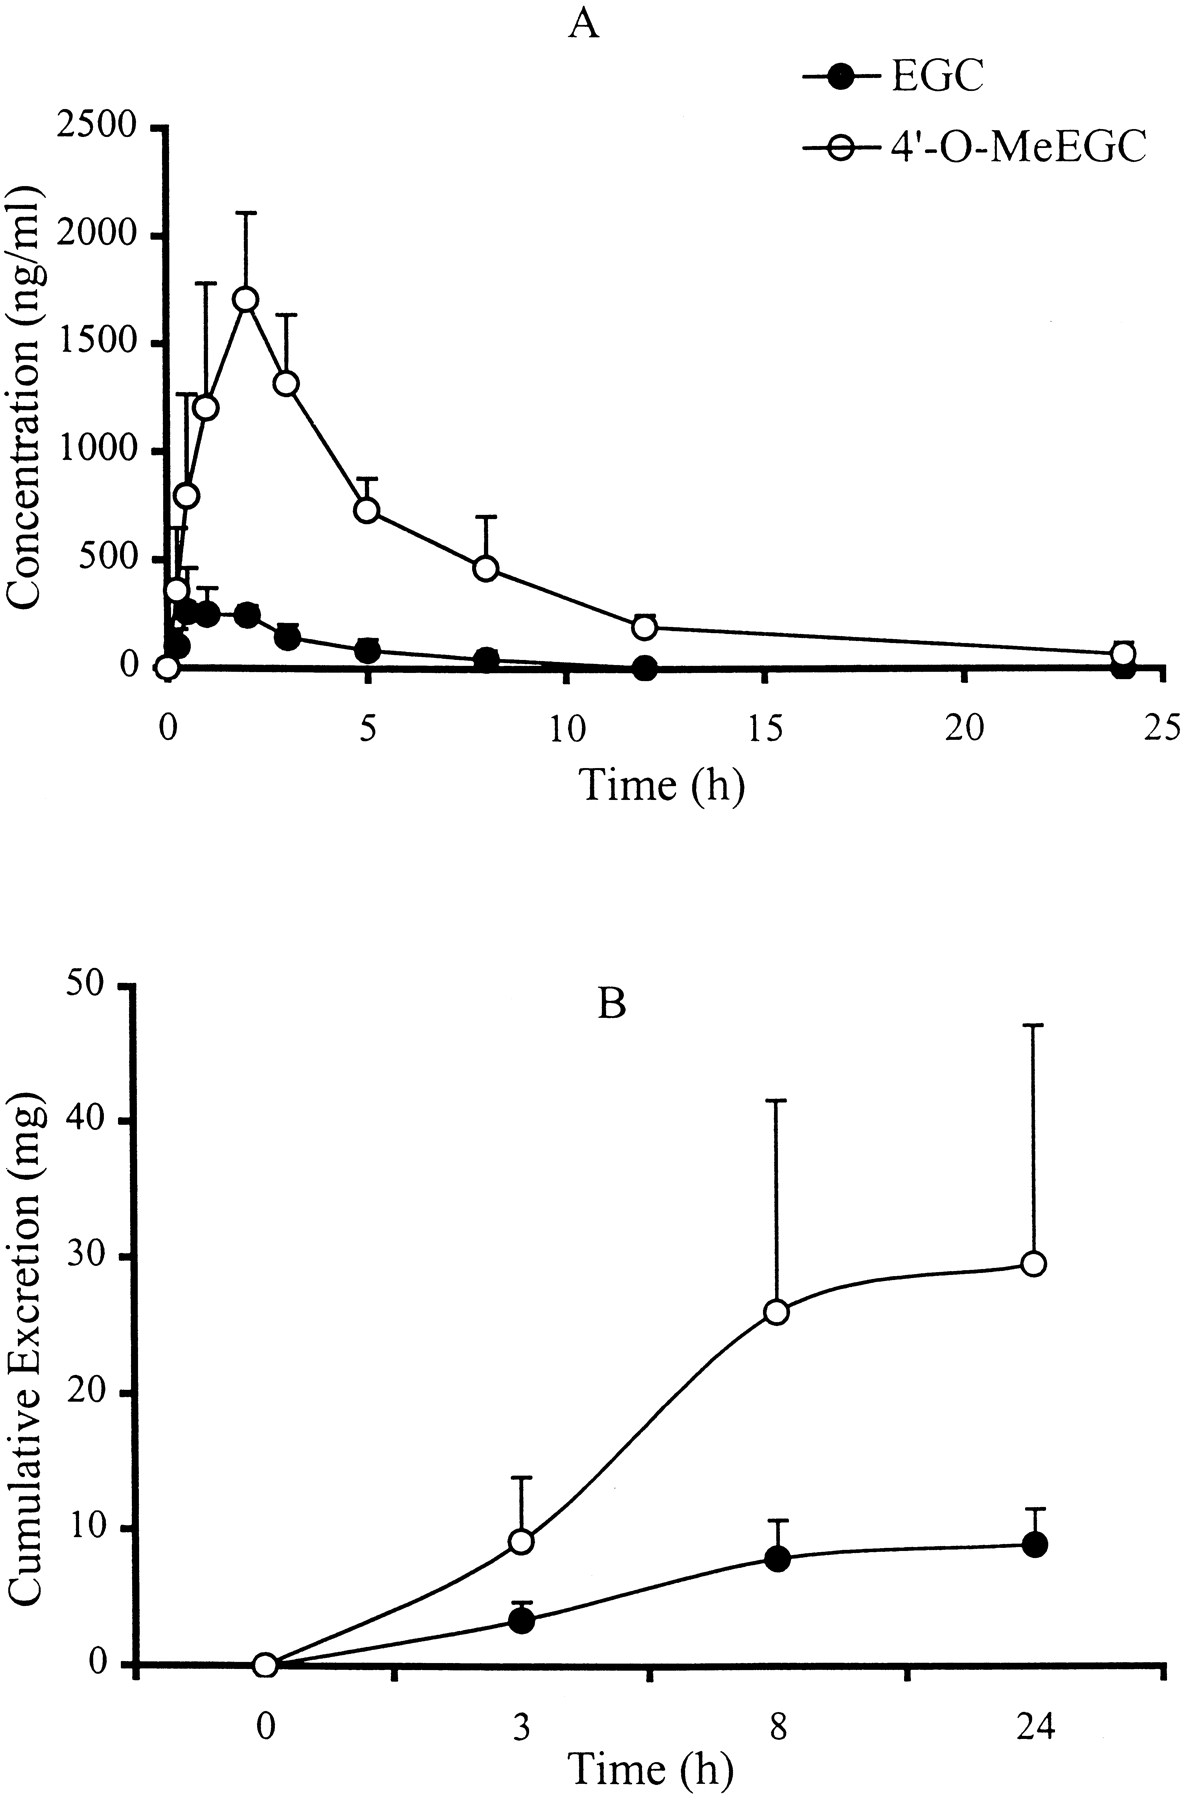
To investigate the O-methylation in vivo, 4′-O-MeEGC and its parent compound EGC in human plasma and urine sample were analyzed as a function of time. The plasma concentration profiles of EGC and 4′-O-MeEGC after green tea ingestion (20 mg/kg of body weight) are illustrated in Fig.4A. Catechins were not detectable in the plasma samples collected from those four human subjects at 0 h. Both EGC and 4′-O-MeEGC were detected in the 0.25-h plasma samples, which implied that the absorbed EGC was rapidlyO-methylated. The plasma levels of EGC and 4′-O-MeEGC reached peak values between 0.5 and 2 h. The peak concentrations of EGC in the plasma samples ranged from 260 to 360 ng/ml, whereas 4′-O-MeEGC had peak concentrations that ranged from 1225 to 2205 ng/ml, 4- to 6-fold higher than those of EGC. The half-lives of EGC and 4′-O-MeEGC in the blood were calculated using PK Functions For Excel (Allergen, Irvine, CA), which were 1.02 ± 0.07 and 4.39 ± 1.14 h, respectively. The total cumulative amounts of EGC and 4′-O-MeEGC excreted in urine during a 24-h period are shown in Fig. 4B. Most (88%) of the EGC and 4′-O-MeEGC was excreted within 8 h after green tea ingestion; the amount of 4′-O-MeEGC excreted was about 3 times higher than that of EGC during this period. The amount of EGC and 4′-O-MeEGC recovered in urine accounted for 14 to 52% of the EGC ingested by human subjects.

Plasma and urine level versus time profile of EGC and 4′-O-MeEGC following ingestion of green tea (20 mg/kg of body weight) by human subjects.
The blood and urine samples were collected and analyzed as described under Experimental Procedures. Each data point and error bar represents the mean ± S.D. for four human subjects. A, plasma concentration; B, cumulative excretion.
Previous studies have investigated the metabolic fate of (+)-catechin and EC in animals or human subjects (Wermeille et al., 1983). Harada et al. (1999) further confirmed that the major metabolite in biological fluids of the rat after EC administration was 3′-O-methyl-(−)-epicatechin-5-O-β-glucuronide. All these results indicate that 3′-O-methyl conversion is the major methylation pathway for (+)-catechin and EC. When we analyzed the products from enzymatic and chemical O-methylation of EGC, we also found a minor component with retention time at 18 min, which had the same molecular weight as m/z320. This suggests the existence of another mono-methylated EGC derivative, which could be 3′-O-methyl-(−)-epigallocatechin. However, we did not find a significant amount of this compound in human urinary or blood samples, suggesting that the major methylation site for EGC is at 4′-oxygen. Our results are consistent with that of Okushio et al. (1999b), who reported that EGC can be O-methylated by rat liver homogenate, and the major product was 4′-O-MeEGC.
As reported previously, most O-methylated catechin derivatives were found to exist in the glucuronide or sulfate conjugated forms (Hackett et al., 1982; Mariusz et al., 1998; Okushio et al., 1999a). Similar results were also observed in our experiments. Without treating the urine samples with β-d-glucuronidase/sulfatase, no or a low level of 4′-O-MeEGC was detected. This result is consistent with the result from LC/MS/MS analysis of human urine samples conducted in our lab (to be reported elsewhere).
In our study, 4′-O-MeEGC was found to be one of the major metabolites of tea catechins in humans. Since EGC can be metabolized into ring fission products by intestinal microorganisms, some of the 4′-O-MeEGC could have a similar metabolic fate. The 4′-O-MeEGC may still have antioxidative activity analogous to the activities reported for O-methylated EC (Harada et al., 1999). O-Methylated catechins could also have stronger biological activities than their parent compounds; for example,O-methylated EGCG had a stronger activity against the degranulation of basophilic KU812 cells that had been stimulated with calcium ionophore A23187 (Tachibana et al., 2000). The possible biological effects of 4′-O-MeEGC require further investigation.
Footnotes
-
Send reprint requests to: Dr. Chung S. Yang, Laboratory for Cancer Research, College of Pharmacy, Rutgers, The State University of New Jersey, 164 Frelinghuysen Rd., Piscataway, NJ 08854-8020. E-mail: csyang{at}rci.rutgers.edu
-
The study was supported by the National Institutes of Health Grant CA 56673.
- Abbreviations used are::
- EGC
- (−)-epigallocatechin
- EGCG
- (−)-epigallocatechin-3-gallate
- EC
- (−)-epicatechin
- ECG
- (−)-epicatechin-3-gallate
- HPLC
- high-performance liquid chromatography
- CEAS
- coulochem electrode array system
- LC/MS
- liquid chromatography/mass spectrometry
- MS/MS
- tandem mass spectrometry
- ESI
- electrospray ionization
- COMT
- catechol-O-methyltransferase
- SAM
- S-adenosyl-l-methionine
- MeEGC
- mono-O-methylated EGC
- tR
- retention time
- Received August 27, 2000.
- Accepted February 22, 2001.
- The American Society for Pharmacology and Experimental Therapeutics


