


Abstract
Metabolism and excretion of erlotinib, an orally active inhibitor of epidermal growth factor receptor tyrosine kinase, were studied in healthy male volunteers after a single oral dose of [14C]erlotinib hydrochloride (100-mg free base equivalent, ∼91 μCi/subject). The mass balance was achieved with ∼91% of the administered dose recovered in urine and feces. The majority of the total administered radioactivity was excreted in feces (83 ± 6.8%), and only a low percentage of the dose was recovered in urine (8.1 ± 2.8%). Only less than 2% of what was recovered in humans was unchanged erlotinib, which demonstrates that erlotinib is eliminated predominantly by metabolism. In plasma, unchanged erlotinib represented the major circulating component, with the pharmacologically active metabolite M14 accounting for ∼5% of the total circulating radioactivity. Three major biotransformation pathways of erlotinib are O-demethylation of the side chains followed by oxidation to a carboxylic acid, M11 (29.4% of dose); oxidation of the acetylene moiety to a carboxylic acid, M6 (21.0%); and hydroxylation of the aromatic ring to M16 (9.6%). In addition, O-demethylation of M6 to M2, O-demethylation of the side chains to M13 and M14, and conjugation of the oxidative metabolites with glucuronic acid (M3, M8, and M18) and sulfuric acid (M9) play a minor role in the metabolism of erlotinib. The identified metabolites accounted for >90% of the total radioactivity recovered in urine and feces. The metabolites observed in humans were similar to those found in the toxicity species, rats and dogs.
Erlotinib hydrochloride, 6,7-bis(2-methoxyethoxy)-N-(3-ethynylphenyl) quinazolin-4-amine [CP-358774, OSI-774, Tarceva, (OSI Pharmaceuticals, Inc.); Fig. 1] is an orally active small molecule epidermal growth factor receptor (HER1/EGFR) inhibitor approved in the United States and Switzerland for the treatment of refractory locally advanced or metastatic non-small cell lung cancer (Dowell et al., 2005). It is the first drug in class to demonstrate an increase in survival in phase III trials targeting various indications. In contrast to the conventional cytotoxic therapies, which present palliative roles at best (Beretta et al., 2001; Kindler and Shulman, 2001; Kim et al., 2002), the clinical trials demonstrate that erlotinib provides a survival benefit without significant morbidity as a single agent in advanced refractory non-small cell lung cancer and in combination with chemotherapy (gemcitabine) in first-line treatment of advanced pancreatic adenocarcinomas (Lingen et al., 2000; Moore et al., 2005). Although also palliative, erlotinib avoids the normal tissue toxicity inherent to cytotoxic agents, e.g., hematologic suppression, emesis, and mucocutaneous ulceration, but does display presumed target effects, such as rash and diarrhea. Preliminary efficacy of erlotinib has also been demonstrated in phase II trials in patients with head and neck, and ovarian cancers as a single agen, as well as phase Ib trials investigating erlotinib in combination with various kinds of chemotherapy and/or radiation in patients with advanced cancers (Hidalgo et al., 2001; Hidalgo and Bloedow, 2003; Malik et al., 2003; Mendelsohn and Baselga, 2003; Soulieres et al., 2004).
Erlotinib acts through reversible inhibition of the EGFR tyrosine kinase with high selectivity and potency (Moyer et al., 1997; Herbst et al., 2005). The EGFR is highly expressed in a wide spectrum of tumors such as head and neck, breast, brain, lung, cervical, bladder, gastrointestinal, renal, and other epithelial malignancies, and is a rational strategic target for anticancer therapy (Grandis and Tweardy, 1993; Rusch et al., 1993; Wikstrand and Bigner, 1998; Petty et al., 2004; Kumar Pal and Pegram, 2005). The experimental evidence indicates that the EGFR overexpression plays a significant role in tumor growth and progression, including the promotion of proliferation, angiogenesis, invasion, and metastasis (Yarden and Sliwkowski, 2001). At nanomolar concentrations, erlotinib inhibits EGFR-dependent proliferation of tumor cells in vitro and blocks cell cycle progression in the G1 phase (Moyer et al., 1997; Herbst et al., 2005).
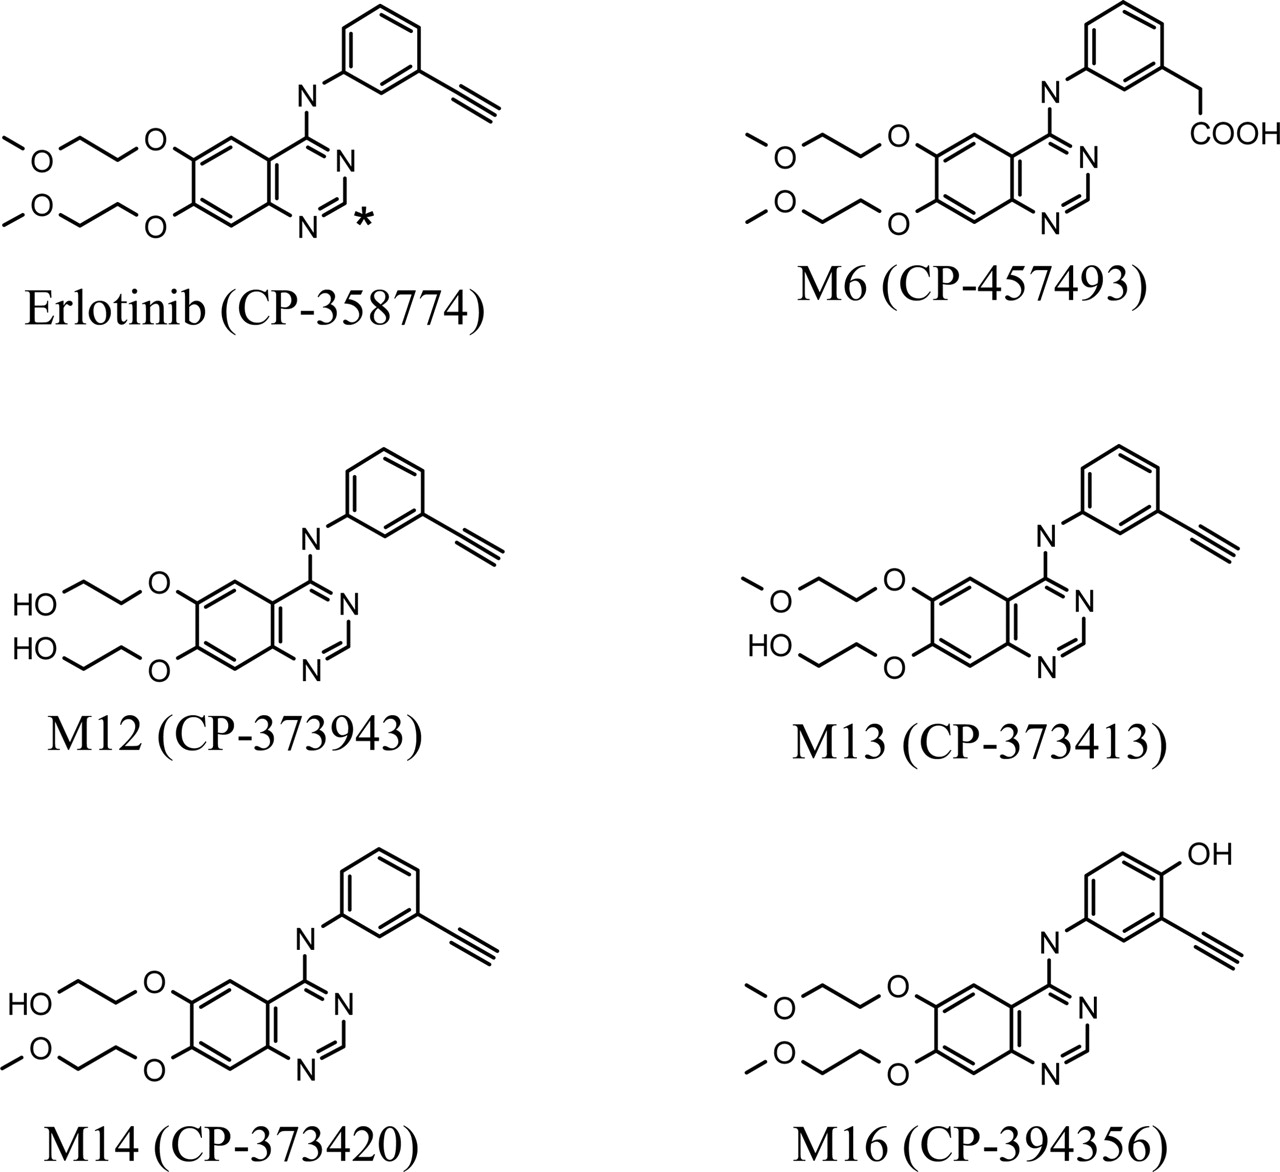
Chemical structures of [14C]erlotinib (* indicates the position of 14C-radiolabel) and five synthetic metabolites.
Erlotinib is extensively metabolized predominantly by CYP3A4 and, to a lesser extent, by CYP1A2, and the extrahepatic isoform CYP1A1 with metabolites excreted by the biliary system (data not shown). A number of metabolites of erlotinib were identified in rats and dogs, with O-demethylation, oxidation of the acetylene moiety, and aromatic hydroxylation as the major biotransformation pathways (Johnson and Prakash, 1997, 1998). To our knowledge, the metabolism and excretion of erlotinib in humans has not been characterized. The primary objective of the present study was to characterize the metabolism and excretion and to perform metabolite identification in humans after a 100-mg single oral dose of [14C]erlotinib. Qualitative and quantitative metabolite profiles of erlotinib in humans were achieved using HPLC coupled in-line with a radiochemical detector and a mass spectrometer (LC-RAM-mass spectrometry). The structures of metabolites, where possible, were supported by comparisons of their retention times on HPLC, and mass spectrometry spectra with those of synthetic standards.
Materials and Methods
Chemicals and Reference Compounds. Erlotinib hydrochloride (CP-358774-01 or OSI-774), [14C]erlotinib hydrochloride (specific activity 0.91 μCi/mg free base equivalent; radiochemical purity >99.6%), was synthesized by the Radiochemistry group at Pfizer Global Research and Development (Groton, CT). The chemical structure of erlotinib and the position of the radiolabel are illustrated in Fig. 1. The metabolite synthetic standards, 2-[4-(3-ethynylphenylamino)-6-(2-methoxyethoxy)quinazolin-7-yloxy]ethanol (CP-373413), 2-[4-(3-ethynylphenylamino)-7-(2-hydroxyethoxy)quinazolin-6-yloxy]-ethanol (CP-373943), 2-(7-(2-methoxyethoxy)-4-(3-ethynylphenylamino)quinazolin-6-yloxy)ethanol (CP-473420), {3-[6,7-bis(2-methoxyethoxy)-quinazolin-4-ylamino]phenyl}acetic acid (CP-457493), and 6,7-bis(2-methoxyethoxy)-N-(3-ethynyl-4-hydroxyl phenyl) quinazolin-4-amine (CP-394356) were synthesized by the Medicinal Chemistry group at Pfizer Global Research and Development. All other commercially available reagents and solvents were of either analytical or HPLC grade.
Human Studies. The study protocol, amendment, and the informed consent document were approved by an independent institutional review board. All subjects (healthy male volunteers) understood the procedures and agreed to participate in the study by giving written informed consent (Declaration of Helsinki).
Four healthy male subjects participated in the study. Subjects were confined to a Clinical Research Unit under continuous observation approximately 12 h before dose through at least 240 h postdose. After an overnight fast, the subjects were given a single oral dose of erlotinib (100-mg free base equivalent of [14C]erlotinib hydrochloride, ∼91 μCi/subject) as a suspension (total aqueous volume administered, 240 ml). After administration, the subjects continued to abstain from food for an additional 4 h.
Blood sufficient to yield 4 ml of plasma was collected in heparinized tubes from each subject predose and at 0.5, 1, 2, 3, 4, 6, 8, 12, 18, 24, 36, 48, 72, 96, 120, 144, 168, 192, 216, and 240 h postdose. For metabolite identification, blood sufficient to yield 5 ml of plasma was collected at 2, 6, and 12 h postdose. Within 1 h after collection, the blood samples were centrifuged in a refrigerated centrifuge. Plasma was separated from whole blood, transferred into labeled plastic tubes, and immediately frozen. In addition, 4 ml of whole blood was collected at predose and at 2 and 12 h postdose for determination of total radioactivity.
Urine samples were collected at predose and at 0 to 12, 12 to 24, 24 to 48, 48 to 72, 72 to 96, 96 to 120, 120 to 144, 144 to 168, 168 to 192, 192 to 216, and 216 to 240 h postdose. Feces were collected as passed from time of dosing until at least 240 h postdose. All samples were stored at –20°C before analysis except blood samples, which were stored in a refrigerator.
Determination of Radioactivity. Radioactivity in blood, plasma, urine, and feces was measured using a Packard 2500 liquid scintillation counter (PerkinElmer Life and Analytical Sciences, Boston, MA). The total radioactivity in plasma and blood was expressed as nanogram-equivalents (ng-Eq)/ml erlotinib. For plasma and urine samples, aliquots (100–500 μl, in triplicate) were mixed directly with 5 ml of Ecolite (+) scintillation cocktail, followed by liquid scintillation counting. For fecal samples, samples were homogenized with water (50% w/w, feces/water). Aliquots of fecal homogenates (30–200 mg) were air-dried before combustion using a Packard model A307 sampler oxidizer. Radioactivity in the combustion products was determined by trapping the liberated 14CO2 in Packard Carbo-Sorb followed by liquid scintillation counting using Ecolite (+) as a scintillation cocktail. For blood samples, aliquots (480–670 mg) were combusted and measured in a manner similar to that of the feces homogenates.
Sample Preparation for Metabolite Profiling and Structure Elucidation.Plasma. The plasma sample (4 ml) collected at 2 h postdose from each subject was precipitated by the addition of 2 volumes of acetonitrile while vortexing vigorously. After centrifugation, the supernatant was removed. The pellet was reextracted with 2 ml of acetonitrile, and the two supernatants were combined. The volumes of supernatants were adjusted to 12 ml by the addition of extra acetonitrile, and aliquots (200 μl, in duplicate) were counted by the liquid scintillation counter. The remaining supernatants were concentrated to dryness in a TurboVap LV evaporator (Zymark Corporation, Hopkinton, MA). The residues were reconstituted in 300 μl of 50:50 (v/v) methanol/water, centrifuged to remove insoluble matrices, and 100-μl aliquots were injected onto the HPLC column for analysis.
Urine. Urine samples collected at 0 to 12 and 12 to 24 h postdose were pooled for each subject on a percent weight basis. Each pooled urine sample (100 ml) was lyophilized overnight. The residues were reconstituted in 4 ml of 10:90 (v/v) acetonitrile/water and aliquots (100 μl) were injected onto the HPLC column for analysis.
Feces. Fecal homogenates containing the highest levels of excreted radioactivity were pooled on a percentage weight basis, and the pooled samples (∼5 g) were suspended in 40 ml of acetonitrile. Suspensions were stirred overnight on a magnetic stirrer and centrifuged. Supernatants were separated and the residues were reextracted with 8 ml of acetonitrile. The two supernatants were combined and 50-μl aliquots were counted using the liquid scintillation counter. The rest of the supernatants were evaporated to dryness in the evaporator and the residues were reconstituted in 300 μl of 10:90 (v/v) acetonitrile/water. Aliquots (100 μl) of concentrated fecal extracts were injected onto the HPLC column for analysis.
Metabolite Profiling and Identification. Metabolite profiling and identification were conducted on an HPLC system consisted of an HP-1050 solvent delivery system (Hewlett Packard, Loveland, CO), an HP-1050 membrane degasser, an HP-1050 autoinjector, a Thermo Separations 3200 UV detector coupled in-line with an IN/US radioactive monitor (β-RAM; IN/US Systems, Tampa, FL), and a Finnigan TSQ 7000 LC-MS/MS (Thermo Electron, Waltham, MA). Separation was performed using a Beckman Ultrasphere C-18 column (250 × 4.6 mm, 5 μ) at a flow rate of 1.0 ml/min. A mobile phase gradient of 10 mM ammonium acetate (A) and acetonitrile (B) was programmed as follows: initiated with 90% A, changed to 50% A over 30 min, followed by a short gradient to 30% A from 30 to 35 min, held at 30% A from 35 to 37 min, and returned to initial gradient of 90% A from 37 min to 40 min. Then the system was allowed to equilibrate for 15 min before the next injection. Note that all gradient changes were linear.
After flowing through the column, the effluent was split and approximately 50 μl/min was introduced into the mass spectrometer with pneumatically assisted electrospray. The interface was operated at 4500 V and the mass spectrometer was operated in the positive ion mode. Collision-induced dissociation (CID) studies were performed to identify metabolites using argon gas at a collision energy of 30 to 40 eV and at a pressure of 2 mTorr. The remaining effluent was directed into the flow cell (cell volume 600 μl) of the β-RAM. The β-RAM was operated in the homogeneous liquid scintillation counting mode with the addition of 3 ml/min Tru-Count scintillation cocktail.
Quantitative assessment of metabolites in urine and feces was carried out by measuring radioactivity in the individual HPLC-separated peaks using a β-RAM. The β-RAM provided an integrated printout in counts per minute, the percentage of the radiolabeled material, as well as the peak representation. The radiochromatograms of metabolites in plasma were generated by collecting fractions at 0.5-min intervals. After being mixed with scintillation cocktail, the collected fractions were counted in a Wallac 1409 liquid scintillation counter. Where possible, the retention times of the radioactive peaks were compared with those of synthetic standards and/or metabolites obtained from the rat urine.
Quantification of Erlotinib in Plasma. Plasma concentrations of erlotinib and its pharmacologically active metabolite, M14 (OSI-420, CP-373420), were determined by a validated HPLC-UV assay (Zhang et al., 2005). Erlotinib was isolated from plasma by methyl t-butyl ether liquid-liquid extraction. This method was validated for the analysis of erlotinib and M14 in 200-μl heparinized human plasma samples over a concentration range of 10 to 1000 ng/ml with acceptable accuracy and precision.
Pharmacokinetic Analysis. Plasma concentration-time data were analyzed by a noncompartmental pharmacokinetic method using WinNonlin-Pro Version 1.5 (Pharsight, Mountain View, CA). The maximum plasma concentration (Cmax) and the time at which Cmax was achieved (tmax) were estimated directly from the concentration data. The area under the plasma concentration-time curve (AUClast) from time 0 to the last time (tlast) with a quantifiable concentration (Clast) was estimated using linear trapezoidal approximation. AUC extrapolated to infinity (AUC∞) was estimated by adding AUClast and the ratio of Clast/λ, where λ is the plasma terminal elimination rate constant estimated by linear regression analysis of the terminal slope of log plasma concentration-time curve. Apparent terminal elimination half-life (t1/2) was calculated as 0.693/λ.
Distribution to Red Blood Cells. Predose blood samples were used for the measurement of hematocrit values (Ht). The radioactivity concentrations in whole blood (Cb) and in plasma (Cp) were determined and the distribution to the red blood cells was calculated using the following equation: Distribution to red blood cells (%) = [1 – Cp(1 – Ht/100)/Cb] × 100.
Results
Mass Balance. The mean cumulative recovery of radioactivity (0–264 h) in urine and feces is graphically depicted in Fig. 2. Approximately 91% of the administered dose was recovered after a 100-mg single oral dose of [14C]erlotinib. The radioactivity was recovered predominantly in feces with a mean cumulative amount of 83 ± 6.8%. Minor radioactivity was recovered in urine with a mean cumulative amount of 8 ± 2.8%. Of the entire radioactivity recovered in urine, roughly 74% was excreted in the first 24 h postdose. Because fecal samples were collected after natural defecation, fecal elimination of radioactivity was delayed, compared with that in urine (Fig. 2). The majority of radioactivity in feces appeared during the time period of 24 to 120 h postdose.

Mean cumulative urinary and fecal excretion of radioactivity after a 100-mg single oral dose of [14C]erlotinib to healthy male volunteers (n = 4).
Pharmacokinetics. The mean plasma concentration-time profiles and pharmacokinetic parameters of total radioactivity, unchanged erlotinib, and its active metabolite M14 in healthy male volunteers after a single oral dose of [14C]erlotinib are shown in Fig. 3 and Table 1, respectively. The results indicated that the absorption of erlotinib was rapid after oral administration, and the circulating radioactivity was mainly attributable to unchanged drug (erlotinib). The peak plasma concentrations for erlotinib, M14, and total radioactivity were observed within 1.4 h postdose. The total plasma radioactivity concentrations were only slightly higher than those of the parent drug, with mean Cmax values of 1.40 and 1.39 μg/ml, for total radioactivity and erlotinib, respectively (Table 1). The mean Cmax for M14 (0.07 μg /ml) was only 5% of the value for parent drug. The mean terminal elimination half-lives (t1/2) were similar between erlotinib (8.1 ± 3.5 h) and M14 (7.7 ± 4.3 h), suggesting that clearance of M14 was limited by its rate of formation. Based on AUC0-∞ values, approximately 5% of the circulating radioactivity was attributable to its active metabolite, M14. In addition, mean blood-to-plasma ratios of radioactivity were calculated at specified time points ranging from 1.0 to 1.3, indicating that the radioactivity distributed to both red blood cells and plasma, with little preference for red blood cells.
Pharmacokinetic parameters (mean ± S.D.) of erlotinib, active metabolite M14, and total radioactivity after a single100-mg oral dose of [14C]erlotinib to male volunteers (n = 4)
Metabolite Profiling.Table 2 presents the mean percentages of circulating metabolites of erlotinib in humans 2 h after a single 100-mg oral dose of [14C]erlotinib. A representative HPLC radiochromatogram of circulating metabolites is shown in Fig. 4A. Plasma metabolic profiles showed that the unchanged erlotinib represented the predominant radiochemical component (∼83% of circulating radioactivity). Besides erlotinib, a total of four metabolites were detected in plasma, including M6, M11, M14, and M16 with abundances at ∼2%, ∼4%, ∼5%, and ∼1%, respectively, of circulating radioactivity.
Mean percentages of circulating metabolites of erlotinib in humans 2 h after a single 100-mg oral dose of [14C]erlotinib (n = 4)
Table 3 presents the mean percentages of urinary and fecal metabolites of erlotinib in humans in relationship to the administered dose after a single 100-mg oral dose of [14C]erlotinib. Representative HPLC radiochromatograms for metabolites in urine and feces are shown in Fig. 4, B and C, respectively. Given the fact that less than 2% of the administered dose was excreted as unchanged drug in urine and feces, erlotinib was extensively metabolized in humans. In addition to a minor amount of unchanged drug, a total of 11 metabolites in urine and 10 metabolites in feces were radiochemically quantifiable (Table 3). In urine, M11 represented the major metabolite (∼2% of the dose) and all other urinary metabolites were minor (each <1% of the dose). Unchanged erlotinib in urine was low, ∼0.3% of dose. Fecal metabolite profiling was performed for selected samples with highest radioactivity. In feces, 10 metabolites were radiochemically quantifiable, and three are major metabolites: M11, M6, and M16 (27.2%, 20.6%, and 9.6% of dose, respectively). All other fecal metabolites were minor (each <5% of the dose). The amount of unchanged erlotinib in feces was very low (∼1% of the dose). In summary, the urinary and fecal metabolites totally accounted for >90% of the total radioactivity recovered.
Mean percentages of urinary, fecal, and total metabolites of erlotinib in humans after a single 100-mg oral dose of [14C]erlotinib (n = 4)
Urine and feces samples were pooled for metabolite profiling. Each 100-ml urine pool was generated from the individual samples collected at 0 to 12 and 12 to 24 h postdose for each subject. Fecal homogenates containing the highest levels of excreted radioactivity were pooled. The ion chromatographic peak areas for fecal samples were corrected based on the weight of fecal homogenate for each subject.
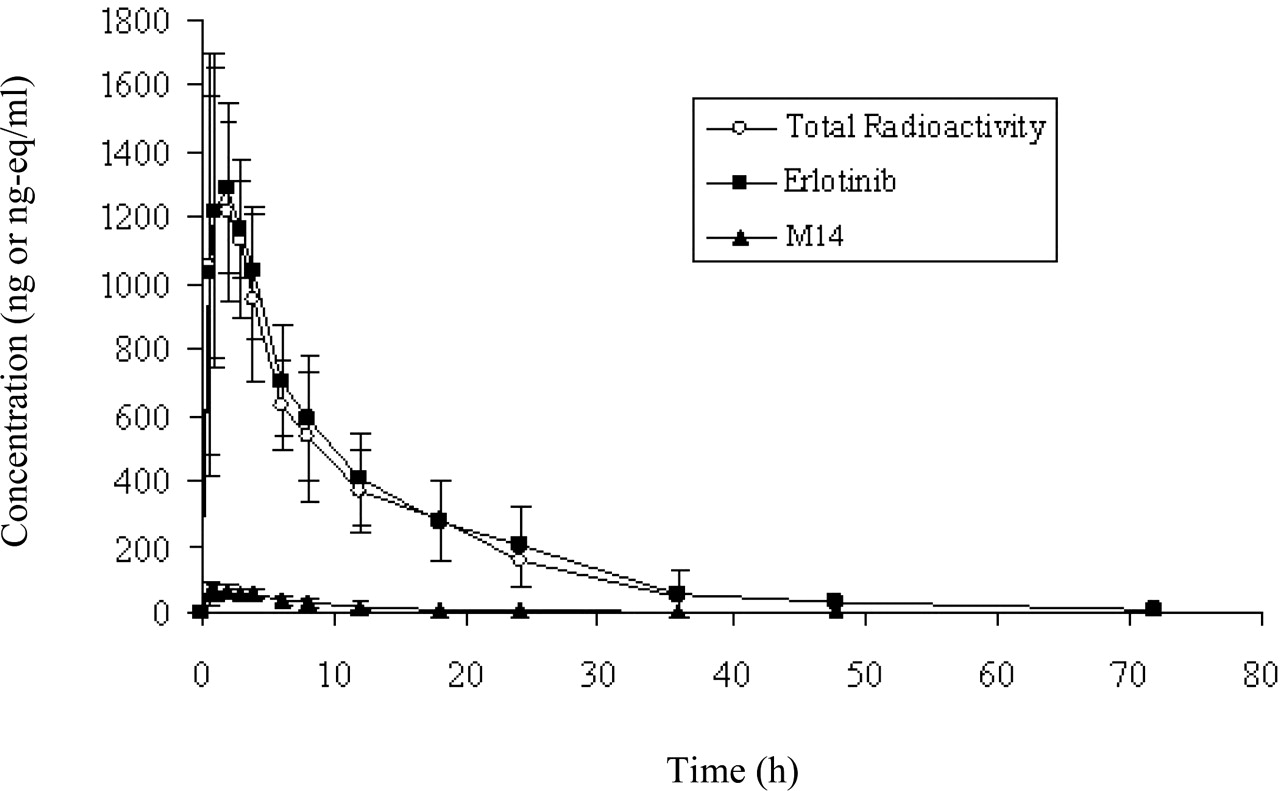
Mean plasma concentration-time profiles of erlotinib, the active metabolite M14, and total radioactivity in healthy male volunteers after a 100-mg single oral dose of [14C]erlotinib (n = 4).
Metabolite Identification. Erlotinib underwent extensive oxidative and conjugative metabolic reactions in humans. Fourteen metabolites were identified in the present study, including nine oxidative metabolites (i.e., M2, M6, M7, M11-M14, M16, and M17), four glucuronides (i.e., M3, M8, M10, and M18), and one sulfate (i.e., M9) (Table 4; Fig. 5). There were five synthetic metabolite standards available, which greatly facilitated the identification of the oxidative metabolites of erlotinib. The metabolite standards included CP-457493, CP-373943, CP-373413, CP-373420, and CP-394356. Based on the similarities of the metabolite standards to the in vivo erlotinib metabolites with respect to the chromatographic retention times and CID product ion spectra, it was confirmed that CP-457493, CP-373943, CP-373413, CP-373420, and CP-394-356 represent M6, M12, M13, M14, and M16, respectively (Table 4).
Identification of erlotinib metabolites in humans using the LC-MS/MS method

Representative radiochromatograms of erlotinib metabolites in plasma (A), urine (B), and feces (C) after a single 100-mg oral dose of [14C]erlotinib to humans. Note that M6, M12, M13, M14, and M16 were identified by retention times and CID product ion spectra that were similar to those of their synthetic standards, whereas the other metabolite structures were tentatively assigned as described under Results.
Erlotinib had a protonated molecular ion at m/z 394, with CID product ions at m/z 336, 304, 278, and 250 (Table 4). The ion at m/z 336 was due to the loss of a methoxyethyl group from the parent, and the ion at m/z 304 resulted from the neutral loss of methanol from the fragment ion m/z 336. The ion at m/z 278 suggested the loss of both methoxyethyl groups from the parent, and the ion at m/z 250 was the result of the neutral loss of CO from the fragment ion m/z 278.
Metabolite M2 had a protonated molecular ion at m/z 414, which is 20 amu higher than the parent drug, indicating that M2 might be formed via a multistep pathway involving monooxygenation, hydrolysis, and demethylation. The CID product ion spectrum of M2 gave product ions at m/z 370, 356, 338, 324, 312, and 266 (Table 4). The ions at m/z 370 and 356 indicated the losses of the hydroxyethyl and methoxyethyl side chains, respectively. The ion at m/z 312 was due to the loss of both side chains. In addition, the ion at m/z 312, 34 amu higher than the corresponding ion at m/z 278 of the parent drug (Table 4), suggested that the monooxygenation and hydrolysis had occurred on the ethynylphenyl moiety. The ion at m/z 266, a 46-amu loss from the base ion at m/z 312, indicated the presence of a carboxylic acid group. Based on these data, M2 was tentatively identified as the demethyl-carboxy-erlotinib (Fig. 5). Metabolite M11 showed a protonated molecular ion at m/z 394, which was the same mass-to-charge ratio as erlotinib. M11 formed CID product ions at m/z 336, 318, 304, 290, and 276 (Table 4). The ion m/z 336 was due to the loss of either a methoxyethyl group or an acetic acid group from M11. The ion at m/z 304 indicated the neutral loss of methanol from the ion at m/z 336, and the ion m/z 318 suggested the loss of water from the ion m/z 336. The ion at m/z 290 was the result of the characteristic neutral loss of formic acid from the ion m/z 336, suggesting the presence of a carboxylic acid group at one of the side chains. The ion at m/z 276 was due to the neutral loss of CO from the ion m/z 304. Therefore, a tentative structure of M11 was proposed as a carboxylic acid of erlotinib (Fig. 5). Likewise, the chemical structures of other oxidative metabolites, such as M7 and M17, were proposed (Fig. 5).
Metabolite M3 had a protonated molecular ion at m/z 586, 192 amu higher than the parent drug, indicating that M3 might be formed via monooxygenation followed by glucuronidation. The CID product ion spectrum of M3 showed product ions at m/z 410, 352, 320, 294, and 266 (Table 4). The fragment ions at m/z 352, 320, 294, and 266 of M3 were all 16 amu higher than the corresponding ions at m/z 336, 304, 278, and 250, respectively, of the parent drug (Table 4), indicating that the monooxygenation had occurred on the phenyl ring moiety. The ion at m/z 410, a loss of 176 mass units from the protonated molecular ion, further suggested that M3 was a glucuronide. The ions at m/z 352 and 294 resulted from successive losses of the two methoxyethyl groups. Based on these data, M3 was proposed as the glucuronide of M16 (Fig. 5). Similarly, the chemical structures of other conjugate metabolites, such as M8, M9, M10, and M16, were tentatively assigned (Fig. 5).
Discussion
The primary objective of this study was to characterize the metabolism and excretion, and to identify metabolites of erlotinib in humans after a 100-mg single oral dose of [14C]erlotinib. Mass balance was achieved, with mean total recovery of radioactivity at ∼91%. The majority of the radioactivity was excreted in feces and accounted for ∼83% of the total administered radioactivity, whereas the radioactivity excreted in urine accounted for only ∼8% of the dose. Of the total radioactivity excreted in the urine and feces, unchanged erlotinib represented <2% of dose. These results, along with the bioavailability of erlotinib (∼60%) in humans (data not shown), suggest that erlotinib is extensively metabolized by both intestinal and hepatic metabolism, and the metabolites after hepatic metabolism were predominantly excreted via the biliary system. Similar to our results, after an oral administration of [14C]gefitinib, another EGFR inhibitor with a structure closely related to erlotinib, to humans (Mckillop et al., 2004), excretion of radioactivity occurred predominantly via the bile into feces, with <7% of the dose being eliminated in urine. The results were confirmed by the study using bile duct-cannulated rats, suggesting that little gefitinib was eliminated unchanged in bile and that the compound was cleared largely by metabolism after gefitinib administration (Mckillop et al., 2004).
After oral administration, unchanged erlotinib represented the major circulating component. Only minor differences were observed between the plasma concentrations of total radioactivity and the unchanged erlotinib. The pharmacologically active metabolite M14 accounted for ∼5% of the total circulating radioactivity and, as such, would not be expected to play a major role in determining the clinical activity of the compound.
Definitive in vitro studies have shown that erlotinib was only slowly oxidized by liver microsomes and human hepatocytes (unpublished data). The metabolism of erlotinib is mediated predominantly by CYP3A4 and CYP3A5 in liver and intestine, and, to a lesser extent, by CYP1A2 and CYP2C8, as well as extrahepatically by the pulmonary cytochrome CYP1A1, and by CYP1B1 expressed in tumor tissue (data not shown). Because CYP3A4 is the major enzyme responsible for the metabolism of erlotinib in humans, caution should be taken when erlotinib is coadministered with other drugs that are substrates or inducers/inhibitors of CYP3A4.
In this human mass balance study, 14 oxidative and conjugate metabolites were identified using the electrospray LC-MS/MS method (Table 4; Fig. 5), which is clearly a technique of choice for the high-throughput and rapid structural characterization of metabolites from biological fluids (Prakash et al., 1998; Johnson et al., 2003). Five metabolites that had authentic metabolite standards available (i.e., M6, CP-457493; M12, CP-373943; M13, CP-373413; M14, CP-373420; and M16, CP-394356) were identified by their similarities in chromatographic retention times and mass spectra. The chemical structures of other erlotinib metabolites in humans were tentatively proposed based on complementary mass spectral data only. The use of electrospray, a soft ionization technique, has allowed the identification of polar phase I and phase II metabolites (Prakash et al., 1998; Johnson et al., 2003).
A proposed scheme for the biotransformation pathways of erlotinib in humans is shown in Fig. 5. One of the major routes of metabolism involved O-demethylation of the side chains, followed by oxidation to the carboxylic acid metabolite M11 (∼29% of the dose). The other major pathways were due to the oxidation of the acetylene moiety to the carboxylic acid metabolite M6 (∼21% of the dose), the hydroxylation of the aromatic ring to M16 (∼10% of the dose), the O-demethylation of M6 to M2 (∼5% of the dose), and O-demethylation of the side chains to M13 and M14 (∼5% of the dose in total). Conjugation of the oxidative metabolites with glucuronic acid (M3, M8, and M18) and sulfuric acid (M9) played a minor role in the metabolism of erlotinib. The identified metabolites accounted for >90% of the total radioactivity recovered in urine and feces. The metabolites observed in humans were also detected in the toxicity species, rats and dogs (Johnson and Prakash, 1997, 1998).

Proposed metabolic scheme for biotransformation of [14C]erlotinib in humans.
Overall, the majority of the total administered erlotinib radioactivity was excreted in the feces (83%), with minor amounts eliminated in the urine (8%). Erlotinib was extensively metabolized, and only <2% of the administered dose was excreted as unchanged drug in urine and feces. Based on the structures of the metabolites, three primary routes of metabolism were identified: O-demethylation of the side chains followed by oxidation to the carboxylic acid, oxidation of the acetylene moiety followed by hydrolysis to the aryl carboxylic acid, and aromatic hydroxylation of the phenyl-acetylene moiety. The hydroxylated metabolites were found to undergo conjugation with glucuronic acid or sulfuric acid. The identified metabolites accounted for >90% of the total radioactivity recovered in urine and feces.
Acknowledgments
We thank Drs. Keith McCarthy and Mikel Moyer for the synthesis of radiolabeled CP-358774 and synthetic standards; Beth Obach, Holly Ashton, and Madhur Vaidya for technical assistance; and Drs. Terry Smolarek and Larry Tremaine for helpful discussions. The Clinical Pharmacology group, including Drs. Keith Wilner and Jeff Miceli, and Dr. Charles F. Ryan at PPD Pharmaco (Austin, TX) are acknowledged for conducting the clinical aspect of the study.
Footnotes
-
This work was presented in part at the 47th American Society of Mass Spectrometry and Allied Topics, Dallas, Texas, June 13–17, 1999.
-
Article, publication date, and citation information can be found at http://dmd.aspetjournals.org.
-
doi:10.1124/dmd.105.007765.
-
ABBREVIATIONS: EGFR, epidermal growth factor receptor; HPLC, high performance liquid chromatography; LC, liquid chromatography; CP358774 (CP358774-01; OSI-774), erlotinib hydrochloride, 6,7-bis(2-methoxyethoxy)-N-(3-ethynylphenyl) quinazolin-4-amine; CP-373413, 2-[4-(3-ethynylphenylamino)-6-(2-methoxyethoxy)quinazolin-7-yloxy]ethanol; CP-373943, 2-[4-(3-ethynylphenylamino)-7-(2-hydroxyethoxy)quinazolin-6-yloxy]-ethanol; CP-457493, {3-[6,7-bis(2-methoxy-ethoxy)-quinazolin-4-ylamino]phenyl}acetic acid; CP-394356, 6,7-bis(2-methoxyethoxy)-N-(3-ethynyl-4-hydroxyl phenyl) quinazolin-4-amine; CP-473420 (OSI-420), 2-(7-(2-methoxyethoxy)-4(3-ethynylphenylamino)quinazolin-6-yloxy)ethanol; CID, collision-induced dissociation; AUC, area under the plasma concentration-time curve; amu, atomic mass unit(s); RAM, radioactivity monitor; MS/MS, tandem mass spectrometry.
- Received October 10, 2005.
- Accepted December 19, 2005.
- The American Society for Pharmacology and Experimental Therapeutics


