


Abstract
Silibinin is the main biologically active flavonolignan extracted from the seeds and fruits of milk thistle and has potential efficacy in the treatment of liver disease. The aim of the present study was to examine the hepatobiliary excretion of silibinin and its effect on dimethylnitrosamine (DMN)-induced liver cirrhosis. The experiments were divided into five groups: 10, 30, and 50 mg/kg silibinin alone, 30 mg/kg silibinin coadministered with cyclosporin A (CsA), and 50 mg/kg silibinin with liver cirrhosis induced by DMN. The data indicated that silibinin had dose-related pharmacokinetics in the dose ranges of 10 to 50 mg/kg. All of the unconjugated or total (unconjugated + conjugated) silibinin concentrations in the bile were significantly higher than those in plasma at the sampling time points at each dose, suggesting active hepatobiliary excretion. When coadministered with CsA, the area under the concentration versus time curve (AUC) in bile was significantly decreased. This result suggested that the active silibinin efflux might be partially inhibited by P-glycoprotein. In the DMN-induced liver cirrhotic rats, the AUC of plasma unconjugated silibinin was reduced by 53%; however, total silibinin was increased by 182%. These results together suggest that the phase II conjugative reaction of silibinin was blocked by treatment with DNM.
Silymarin is the biological extract of milk thistle (Silybum marianum L.), and silibinin is the major active constituent of silymarin, which is widely used in traditional European medicine (Morazzoni and Bombardelli, 1996). Silymarin has been evaluated clinically in the treatment of hepatitis and liver damage caused by alcohol (Wellington and Jarvis, 2001) or by antituberculosis drugs (Tasduq et al., 2005). Silibinin (Fig. 1) is a very strong antioxidant compound capable of scavenging both free radicals and reactive oxygen species. A recent report in rodents suggested that silibinin may be useful in the chemoprevention of malignancies in the skin, bladder, liver, cervix, and colon (Gazák et al., 2007).
P-gp acts as a biological barrier by extruding xenobiotics out of cells. The modulator of P-gp has been reported to be the cause of drug-drug interactions when potent P-gp enhancers/inhibitors and P-gp substrates are administered together (Lin, 2003). P-gp-mediated transport in the liver has been shown to be responsible for the excretion of xenobiotics via the canalicular membrane of hepatocytes into bile, and this physiological function may be a control mechanism to accelerate the processes of hepatobiliary excretion (Schinkel, 1997). Silymarin inhibits P-gp-mediated efflux in Caco-2 cells; this effect was concentration-dependent, and increased daunomycin accumulation in P-gp-positive cells but not in P-gp-negative cells has been reported (Gazák et al., 2007).
Silibinin is eliminated predominantly by glucuronic acid conjugation with extensive biliary excretion in the conjugated form and its primary therapeutic application is treatment of liver disorders (Wellington and Jarvis, 2001). Chronic liver disease, in particular liver cirrhosis, can modulate many factors, determining the behavior of drugs in the body (Delcò et al., 2005). Although the pharmacokinetics of silibinin in patients treated with CsA and in patients with liver cirrhosis and healthy volunteers has already been investigated (Barzaghi et al., 1990; Orlando et al., 1990), no information on the hepatobiliary excretion of silibinin in the presence of cirrhosis is available.
DMN is a potent hepatotoxin, carcinogen, and mutagen. DMN-induced liver injury in rats seems to be a good animal model for early liver cirrhosis (George et al., 2001). A model of cirrhosis induced by chronic, discontinuous treatment with a low dose of DMN in the rat has been reported to reproduce a number of characteristics of this liver disease (Jézéquel et al., 1987).
It is important to clarify the possible mechanisms of biliary excretion for the pharmacokinetic study of silibinin. Until now, the mechanism responsible for the biliary excretion of silibinin has not been fully characterized, and no information is available on the hepatobiliary excretion of silibinin in the presence of cirrhosis. Hence, our hypothesis is that silibinin is actively transported across the sinusoidal membrane into hepatocytes and secreted into biliary canaliculi via P-gp modulation, and biliary excretion appears to be affected by the status of liver cirrhosis. In this study we characterize the pharmacokinetics of silibinin and its interaction with CsA in rats with cirrhosis. In addition, the pharmacokinetic mechanism of hepatobiliary excretion of silibinin was investigated. Our results demonstrate that silibinin was excreted into the bile via P-gp for hepatobiliary excretion.
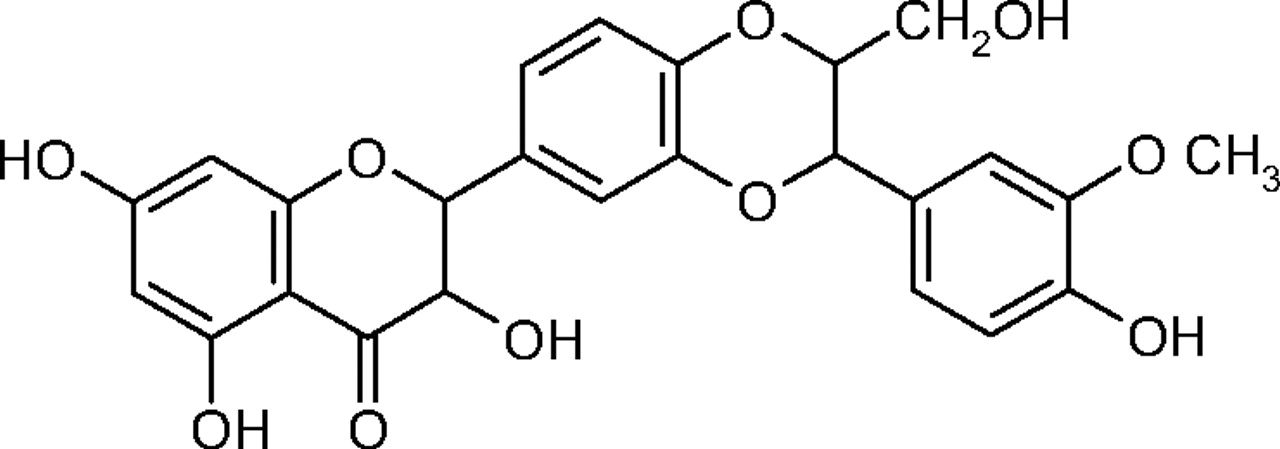
Chemical structure of silibinin.
Materials and Methods
Chemicals and Reagents. Silibinin (molecular mass 482.44 Da), naringenin (internal standard), dimethylnitrosamine, and β-glucuronidase (type H-1 from Helix pomatia, 338,000 units/g) were purchased from Sigma-Aldrich (St. Louis, MO). Liquid chromatographic grade solvents and reagents were obtained from E. Merck (Darmstadt, Germany). Triply deionized water from Millipore Corporation (Bedford, MA) was used for all preparations. Sodium acetate buffer solution (pH 5) was prepared using sodium acetate (9.45 g) and glacial acetic acid (1.725 ml) in 500 ml of deionized water according to a previous report (Taylor et al., 2005). The β-glucuronidase enzyme solution (3000 units/ml) was freshly prepared using sodium acetate buffer (pH 5).
Experimental Animals. All experimental protocols involving animals were reviewed and approved by the institutional animal experimentation committee of National Yang-Ming University. Male specific-pathogen Sprague-Dawley rats weighing 280 to 320 g were from the Laboratory Animal Center of the National Yang-Ming University. The animals had access to food (Laboratory Rodent Diet 5001; PMI Feeds Inc., Richmond, IN) and water until 18 h before being used in experiments, and after that only food was removed.
The rats were initially anesthetized with pentobarbital (50 mg/kg i.p.), and remained anesthetized throughout the experimental period. During the experiments, the body temperature of each rat was maintained at 37°C with a heating pad. The right atrium (through a catheter (cannula) implanted into the right external jugular vein) was used for blood samples, and a catheter (PE-10) was inserted into the proximal portion of the bile duct toward the liver for bile juice collection (Wu and Tsai, 2007). Phenobarbital stimulates varied pathways of metabolism by liver microsomes. With daily administration of phenobarbital to rats, the maximal increase of enzyme activity (3- to 10-fold) is not reached for at least 3 days (Conney, 1967). In this study, animals were anesthetized by pentobarbital, and samples were obtained within 5 h, which may not affect the metabolism of silibinin.
Induction of Liver Cirrhosis by DMN. DMN (dissolved in 0.9% NaCl-injectable solution to produce 0.01 mg/ml) at a dose of 0.01 mg/kg was repeatedly injected i.p. on 3 consecutive days per week for 4 weeks (Jézéquel et al., 1987). For control rats, the same volume of 0.9% NaCl-injectable solution was injected. During the pretreatment, rats had free access to food and water. Five days after the last DMN injection (or 0.9% NaCl-injectable solution), the experiment was performed. Liver cirrhosis induced by DMN was evident on the basis of histological examination of the liver.
Liquid Chromatography. The HPLC system consisted of a chromatographic pump (PM-80; BAS Bioanalytical Systems, West Lafayette, IN), equipped with a 20-μl sample loop and a UV detector (Soma S-3702; Soma, Tokyo, Japan). Separation was achieved by a LiChrosorb RP-18 column (250 × 4 mm i.d.; particle size 5 μm; E. Merck) protected by a guard column (Purospher STAR RP-18e, 5 μm) at room temperature (24 ± 1°C). The mobile phases consisted of acetonitrile-10 mM monosodium phosphate (pH 5.45 adjusted with orthophosphoric acid) (50:50, v/v), and the flow rate was maintained at 1 ml/min. The detection wavelength was set at 288 nm. Output data from the detector were integrated using an EZChrom chromatographic data system (Scientific Software, San Roman, CA).
Method Validation. Calibration curves were established by using blank plasma spiked with different amounts of silibinin. The peak area ratios of silibinin to the internal standard versus analyte concentrations were used to calculate linear regression. The concentration-response relationship from the present method indicated linearity over a concentration range of 0.5 to 100 μg/ml with the coefficient of estimation (r2) >0.995. The intra-assay and interassay variabilities were determined by quantitating six replicates at concentrations of 0.5, 1, 5, 10, 50, and 100 μg/ml using the HPLC method described above on the same day and 6 consecutive days, respectively. The accuracy (percent bias) was calculated from the mean value of observed concentration (Cobs) and the nominal concentration (Cnom) as follows: accuracy (percent bias) = [(Cobs - Cnom)/Cnom] × 100. The relative standard deviation (R.S.D.) was calculated from the observed concentrations as follows: precision (percent R.S.D.) = (S.D./Cobs) × 100.
Drug Administration. Animals were divided into five groups. After a 2-h postsurgical stabilization period following the implantation of the catheter (cannula), silibinin was administered via the femoral vein at doses of 10, 30, or 50 mg/kg in the silibinin alone groups. Injectable silibinin dissolved in ethanol and polyethylene glycol 200 (1:1, v/v) solution was administered i.v. through the femoral vein with an injection volume of 1 ml/kg. In the CsA-treated group, CsA (20 mg/kg) was injected via a femoral vein 10 min before silibinin (30 mg/kg i.v.) administration. For the cirrhotic rat group, silibinin (50 mg/kg) was injected via a femoral vein after DMN treatment.
Blood, Bile Sampling, and Sample Preparation. An aliquot of 100 μlof blood was withdrawn from the jugular vein into a heparin-rinsed vial with a fraction collector at 1, 5, 10, 15, 30, 45, 60, and 90 min and 2, 3, 4, and 5 h after silibinin administration. At each sampling time, 30 μl of bile juice was collected for 2 min with a fraction collector at 1, 5, 10, 15, 30, 45, 60, and 90 min and 2, 3, 4, and 5 h after silibinin administration, and then the tube for bile cannulation was inserted back to the tube connecting to the common bile duct.
Each blood sample was centrifuged at 2000g (PC-100 microcentrifuge; Bertec Enterprise, Taipei, Taiwan) for 10 min to separate the plasma. An aliquot of each plasma sample (25 μl) was vortex-mixed with 50 μl of internal standard solution (10 μg/ml naringenin dissolved in acetonitrile) to precipitate the plasma proteins. This solution was then centrifuged at 2000g for 30 min and a 20-μl aliquot of the supernatant was directly injected into the HPLC system for analysis.
The bile sample (15 μl) was vortex-mixed with 30 μl of internal standard solution and centrifuged at 2000g for 30 min. An aliquot of 20 μlofthe supernatant was injected directly into the HPLC system for analysis.
For the determination of total silibinin (unconjugated + conjugated), 15 μl of plasma or bile sample was incubated (37°C, 1 h) with 45 μlof β-glucuronidase enzyme solution at 3000 units/ml. After incubation, the solution (30 μl) was vortex-mixed with 60 μl of internal standard solution. The protein precipitation was achieved by the internal standard solution and separated by centrifugation at 2000g for 30 min. An aliquot of 20 μl of supernatant was injected directly into the HPLC system for analysis. Calibration curves were established using blank plasma or bile spiked with different amounts of silibinin standard solution before each experiment.
Pharmacokinetics Application. Pharmacokinetic calculations were performed on each individual set of data using the pharmacokinetic software WinNonlin Standard Edition (version 1.1; Pharsight, Mountain View, CA) and the noncompartmental method. The AUC was calculated according to the linear trapezoidal method.
Statistics. The results are presented as means ± S.E.M. Statistical analysis was performed with SPSS (version 10.0; SPSS Inc. Chicago, IL). Comparisons of pharmacokinetic data between unconjugated silibinin and total silibinin at doses of 10 and 30 mg/kg alone and 30 mg/kg coadministered with CsA and 50 mg/kg alone and 50 mg/kg in the rat group with cirrhosis were performed by Student's t test, and the significant difference was set at p < 0.05.

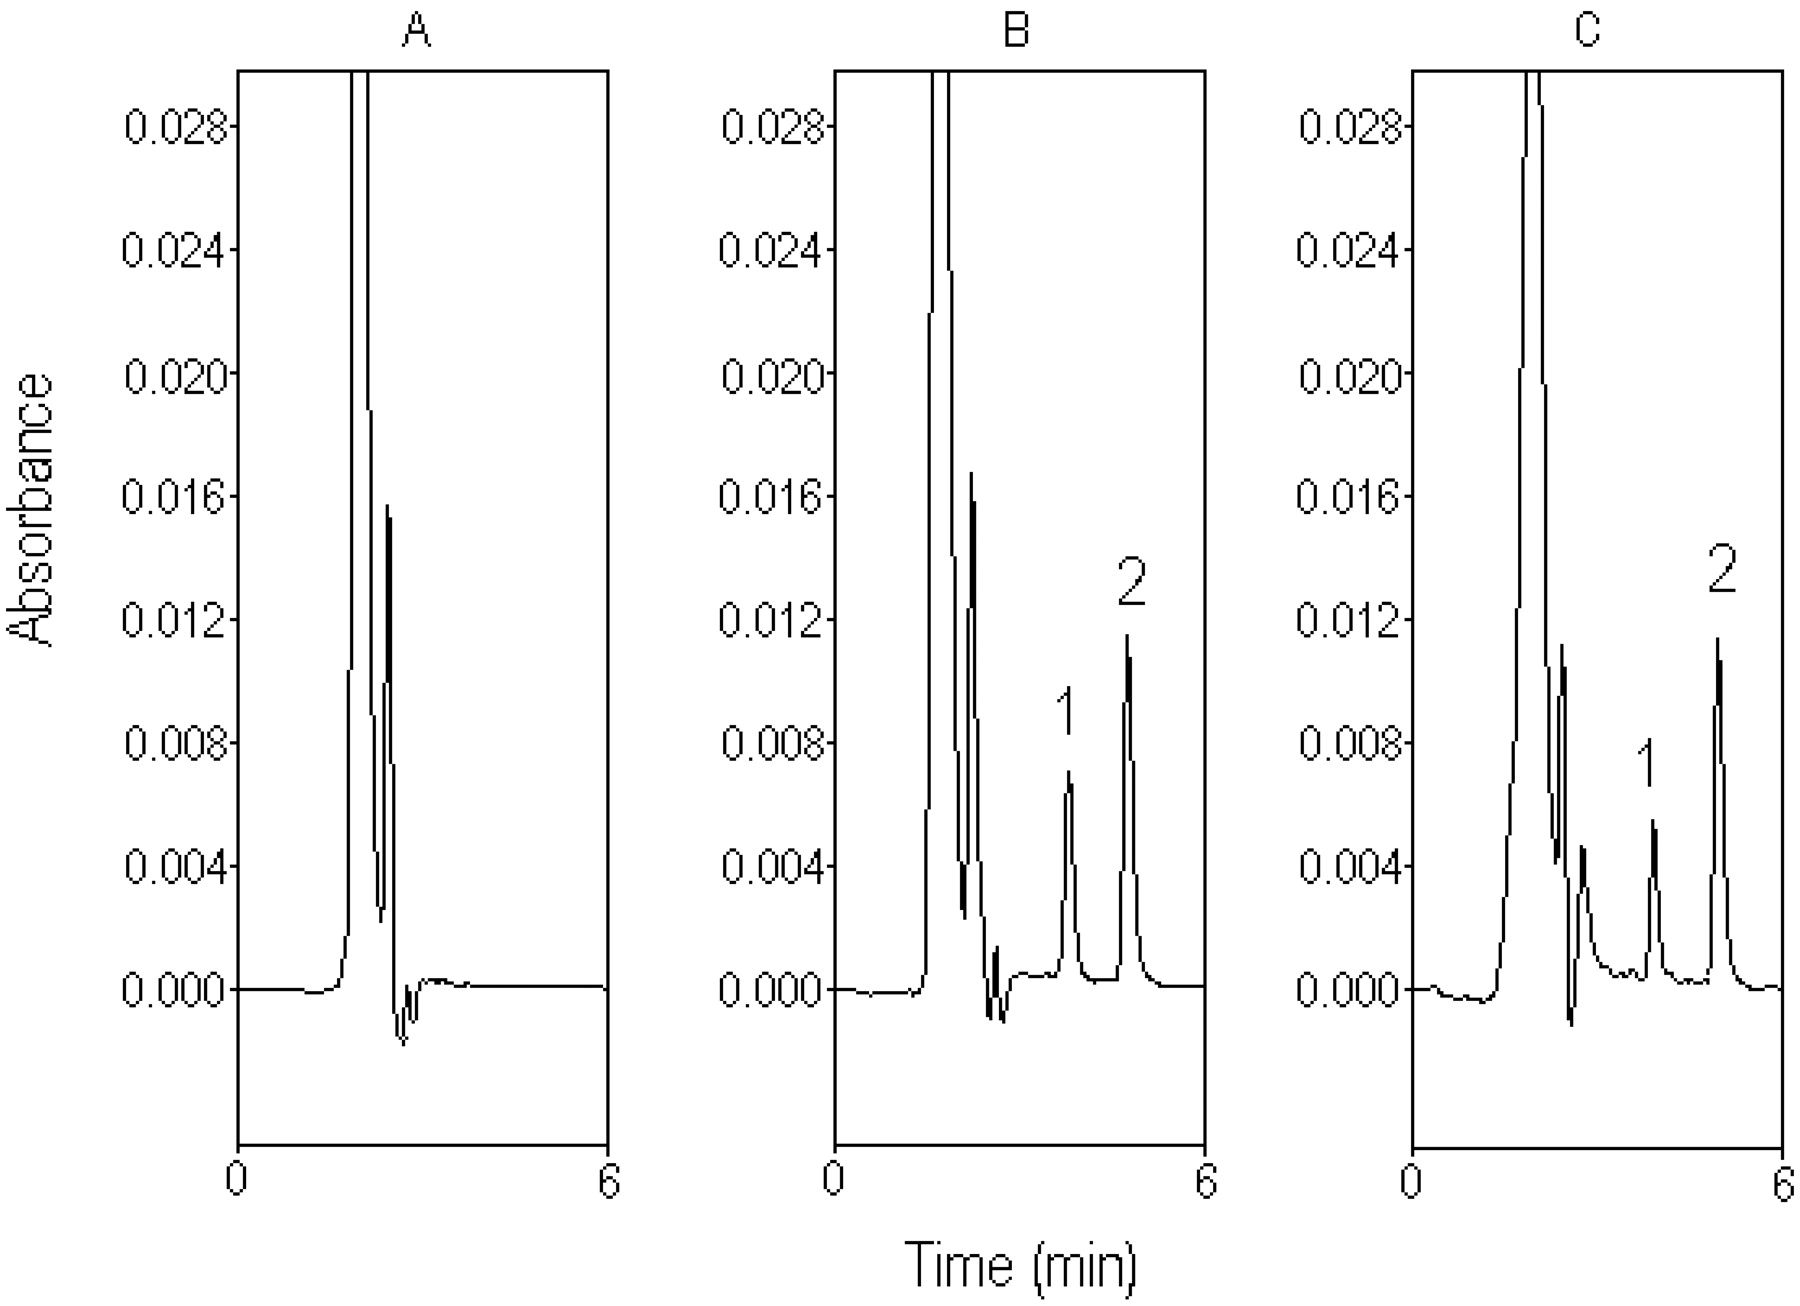
Typical chromatograph for rat plasma. A, blank plasma sample before drug administration. B, standard silibinin (10 μg/ml) spiked in blank plasma. C, plasma sample containing silibinin (7.91 μg/ml), collected from the rat plasma 15 min after silibinin administration (30 mg/kg i.v.). 1, silibinin. 2, naringenin (internal standard).

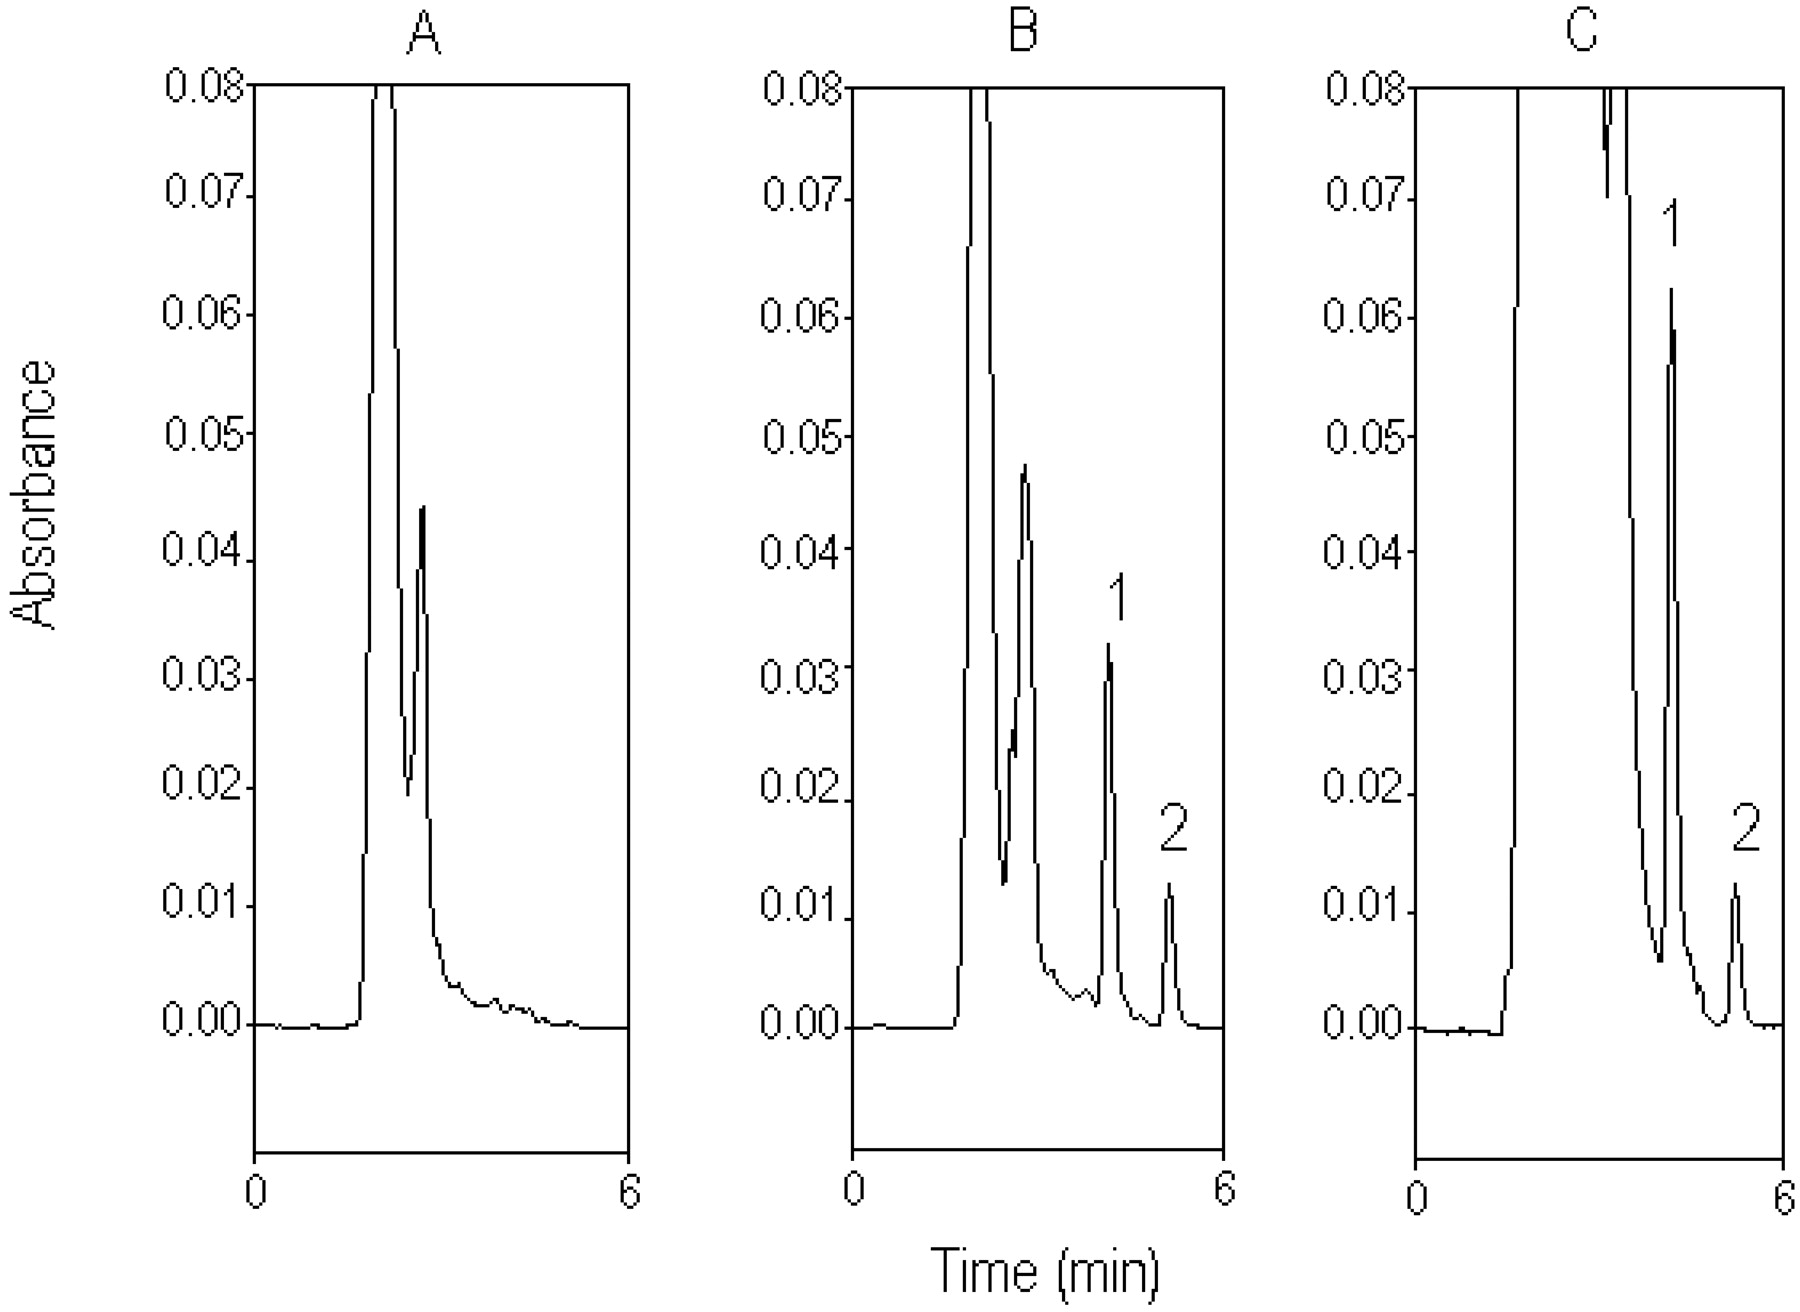
Typical chromatograph for rat bile. A, blank bile sample before drug administration. B, standard silibinin (50 μg/ml) spiked in blank bile. C, bile sample containing silibinin (97.25 μg/ml), collected from the rat bile 10 min after silibinin administration (30 mg/kg i.v.). 1, silibinin; 2, naringenin (internal standard).
Results
Chromatography in Plasma and Bile. Typical chromatograms of silibinin in rat plasma and bile are shown in Figs. 2 and 3, respectively. Separation of silibinin from endogenous substances in the plasma and bile was achieved in an optimal mobile phase containing acetonitrile-10 mM monosodium phosphate (pH 5.45 adjusted with orthophosphoric acid) (50:50, v/v), at a flow rate of 1 ml/min.
Figure 2A shows the chromatogram of a blank plasma sample before drug administration, and Fig. 2B shows a calibration sample of silibinin (10 μg/ml). None of the observed peaks interfered with the analyte within the retention times of the analytes. Figure 2C shows the chromatogram of a plasma sample containing silibinin (7.91 μg/ml) collected from rat plasma at 15 min after silibinin administration (30 mg/kg i.v.).
Figure 3A shows the chromatogram of a blank bile sample obtained from the bile duct before the drug administration. Figure 3B shows a calibration sample of standard silibinin (50 μg/ml). Figure 3C shows the chromatogram of bile sample containing silibinin (97.25 μg/ml) collected from the rat bile 10 min after silibinin administration (30 mg/kg i.v.). The unretained matrix components on the chromatogram in Fig. 3C slightly affect the first bile sample, which may be the cause of the unidentified endogenous silibinin or metabolites of silibinin after drug administration. Because the unretained matrix was gradually reduced in the later samples, the potential error of the chromatogram shoulder for the biliary excretion of silibinin may be <1%.
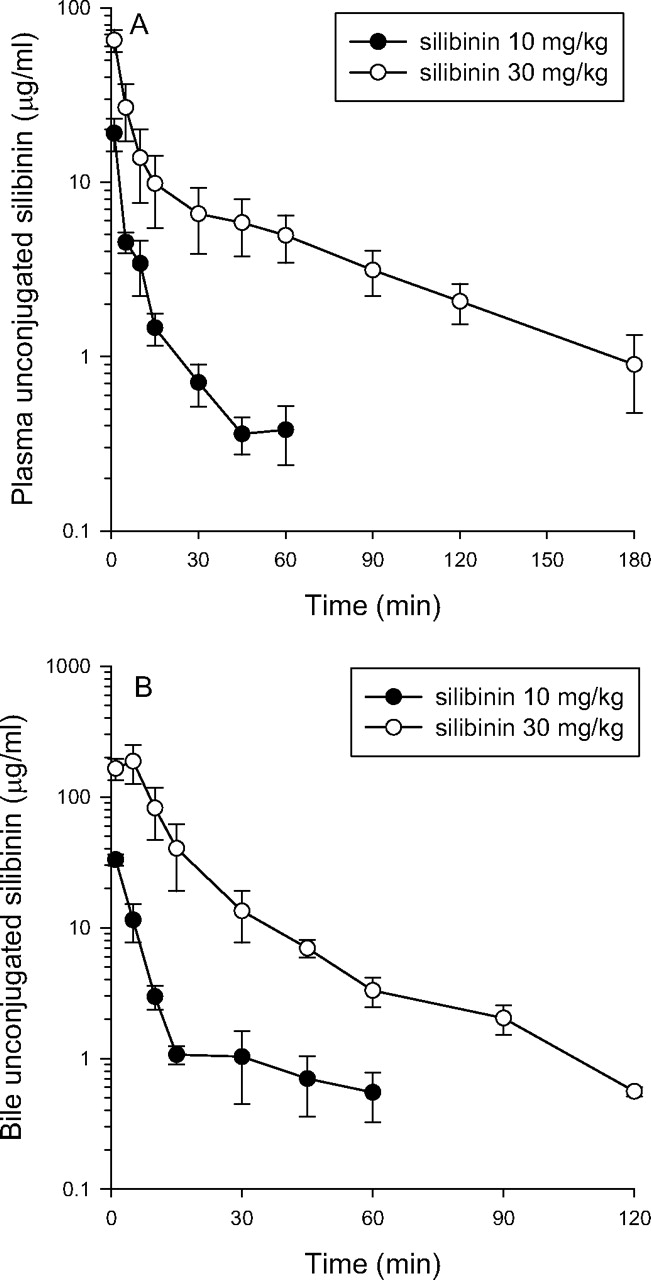
Concentration-time profiles for unconjugated silibinin in plasma (A) and bile (B) after silibinin administration (10 and 30 mg/kg i.v.). Each group of data is presented as the mean ± S.E.M. from six individual experiments.
Method Validation. The calibration curve of silibinin was obtained before HPLC analysis of plasma and bile over a concentration range of 0.5 to 100 μg/ml. The limit of detection and the limit of quantitation of silibinin in rat plasma and bile were determined to be 0.1 μg/ml at a signal-to-noise ratio of 3 and 0.5 μg/ml, respectively. The limit of quantitation was defined as the lowest concentration of silibinin in plasma and bile samples that could be quantified with acceptable criteria (interassay coefficient of variation and accuracy within ±15%). Our analytical data were within the criteria of 15%.

Concentration-time profiles for total silibinin in plasma (A) and bile (B) after silibinin administration (10 and 30 mg/kg i.v.). Each group of data is presented as the mean ± S.E.M. from six individual experiments.
Pharmacokinetics of Silibinin in Plasma and Bile. Figures 4 and 5 show unconjugated silibinin and total silibinin in plasma and bile for the 10 and 30 mg/kg silibinin groups, respectively. The pharmacokinetic data for unconjugated silibinin and total silibinin are presented in Tables 1, 2, 3. After silibinin administration at 10, 30, and 50 mg/kg, the plasma unconjugated silibinin level declined rapidly in the rat plasma up to 60 to 180 min. The plasma AUCs of unconjugated and total silibinin did not increase proportionally for the doses of 10, 30, and 50 mg/kg. Silibinin seems to show dose-related pharmacokinetics in this dose range, which may be due to the saturation of the metabolic or excretion pathway.
Pharmacokinetic data of silibinin in plasma and bile of rats after a dose of 10 mg/kg
Pharmacokinetic data of 30 mg/kg silibinin alone (control group) and with CsA (silibinin + CsA group) in rat plasma and bile Data are expressed as means ± S.E.M. (n = 6).
Pharmacokinetic data of 50 mg/kg silibinin alone (control group) and with DMN (liver cirrhosis group) in rat plasma and bile Data are expressed as means ± S.E.M. (n = 6).
The pharmacokinetic data for the silibinin-alone group reflect the fact that disposition of unconjugated silibinin in rat bile exhibited a peak concentration at 5 min after silibinin administration. The hepatobiliary excretions of unconjugated silibinin, which were defined as blood to bile excretion (k value) calculated by the AUC ratio (k = AUCbile/AUCblood), were 1.3, 2.3, and 4.9 at doses of 10, 30, and 50 mg/kg, respectively (Tables 1, 2, 3) (de Lange et al., 1997).
After silibinin administration at doses of 10 or 30 mg/kg, the total plasma silibinin level decreased slowly and could be detected in rat plasma for up to 300 min (Fig. 5). The pharmacokinetic data for the silibinin-alone group reflect the fact that disposition of total silibinin in rat bile exhibited a peak concentration at 10 min after silibinin administration. The hepatobiliary excretions of silibinin in total and unconjugated forms were 41 ± 7.3 and 1.3 ± 0.3, 31 ± 5.4 and 2.3 ± 0.6, and 45 ± 4.4 and 4.9 ± 1.4, respectively, for doses of 10, 30, and 50 mg/kg (Tables 1, 2, 3). These data indicate that most of silibinin went through hepatobiliary excretion and enterohepatic recirculation in the conjugated form.

Concentration-time profiles for unconjugated silibinin in plasma (A) and bile (B) after silibinin i.v. administration at a dose of 30 mg/kg alone and 30 mg/kg coadministered with CsA. Each group of data is presented as the mean ± S.E.M. from six individual experiments.
Interaction of Silibinin and CsA in Plasma and Bile. Figures 6 and 7 show unconjugated silibinin and total silibinin in plasma and bile for 30 mg/kg silibinin alone and 30 mg/kg silibinin coadministered with CsA, respectively. The pharmacokinetic data for unconjugated silibinin and total silibinin are presented in Table 2.
A comparison with the 30 mg/kg silibinin alone group shows that after CsA exposure before i.v. administration of 30 mg/kg silibinin, the unconjugated silibinin concentration and AUC in the plasma were markedly decreased. The AUC of total silibinin in the plasma of the 30 mg/kg silibinin coadministered with CsA group was significantly increased compared with the 30 mg/kg silibinin alone group. CsA was administered parenterally before silibinin to allow it to diffuse into the various biological fluid compartments before silibinin administration. Biliary excretion of total silibinin, expressed as AUCbile/AUCblood, was significantly decreased from 31 ± 5.4 to 9.7 ± 1.3 (Table 2). The results indicated that the biliary excretion of silibinin was associated with P-gp.

Concentration-time profiles for total silibinin in plasma (A) and bile (B) after silibinin i.v. administration at a dose of 30 mg/kg alone and 30 mg/kg coadministered with CsA. Each group of data is presented as the mean ± S.E.M. from six individual experiments.
After CsA exposure but before silibinin administration, CsA caused significant changes in unconjugated silibinin pharmacokinetics, a decrease in the maximum concentration (Cmax = 92 versus 38 μg/ml) and AUC (1.5 versus 0.2 min · mg/ml), but values for the total silibinin increased (p < 0.05) (Table 2). After CsA exposure, the AUC of unconjugated silibinin in bile was not significantly different (p > 0.05) from that of the 30 mg/kg silibinin alone group.
The blood to bile excretion of unconjugated silibinin was increased (p < 0.05) from 2.3 ± 0.6 to 29 ± 7.9 upon treatment with CsA. However, this phenomenon of hepatobiliary excretion was dramatically decreased (p < 0.05) from 31 ± 5.4 to 9.7 ± 1.3 for total silibinin.
Pharmacokinetics of Silibinin in Rats with Liver Cirrhosis Induced by DMN. The mean plasma and bile concentration-time profiles of silibinin after i.v. administration of 50 mg/kg in the cirrhosis group are show in Figs. 8 and 9, respectively. The pharmacokinetic parameters are presented in Table 3.
In the cirrhosis group given 50 mg/kg silibinin, the unconjugated silibinin AUC in plasma was significantly reduced (46% decreased). The elimination half-life of unconjugated silibinin in bile was significantly increased, but the bile AUC and Cmax were not significantly different from those for the group not treated with DMN. The total silibinin plasma AUC was significantly enhanced (83%), and the elimination half-life was significantly increased (104%) in the DMN-treated group.
The elimination half-life for total silibinin in bile was significantly increased, and the bile Cmax was significantly decreased when silibinin was given to the liver cirrhosis group. The blood to bile excretion of total silibinin in the 50 mg/kg silibinin cirrhosis group was significantly decreased (approximately 52%) from that for the group not treated with DMN (Table 3).
Discussion
The majority of the silibinin present in plasma was found to be in either the glucuronide or sulfate conjugate form (Weyhenmeyer et al., 1992). A recent study indicates that silibinin undergoes multiple conjugative reactions, and silibinin monoglucuronide, silibinin diglucuronide, silibinin monosulfate, and silibinin diglucuronide sulfate were identified in human plasma (Hoh et al., 2006). Our data demonstrate that the conjugated form of silibinin accounts for 92 to 95% of total silibinin at the dose ranges of 10, 30, and 50 mg/kg. The pharmacological implication of conjugated silibinin is unclear. Although conjugated metabolites are usually devoid of pharmacological activity, morphine 6-glucuronide is an exception to this rule (Portenoy et al., 1992).
All of the unconjugated or total silibinin concentrations in bile were significantly higher than those at the sample time point in plasma at each dose. For doses of 10, 30, and 50 mg/kg, the total silibinin Cmax values in bile were approximately 100 times higher than those found in plasma; this observation agrees well with a previous report (Fraschini et al., 2002). The high total hepatobiliary excretion (AUCbile/AUCblood) could be partially (68.7%) reduced from 31 ± 5.4 to 9.7 ± 1.3 after treatment with CsA (Table 2) suggesting that an active transport mechanism of hepatobiliary excretion might be regulated by P-gp.
After CsA exposure before silibinin administration, unconjugated plasma Cmax and AUC were decreased, but the total silibinin levels were increased. The pharmacokinetic interaction between silibinin and CsA may be caused by the competition for protein binding. Of the 90 to 99.8% of circulation CsA bound to plasma protein, 85 to 90% is carried on lipoprotein (Dunn et al., 2001). The endogenous lipoprotein may play a role in the transport of silibinin from the liver to the extrahepatic tissues (Svagera et al., 2003). Displacement of protein binding may be significant when CsA and silibinin are coadministered, resulting in higher free silibinin concentrations, and free silibinin can be cleared faster or distributed to various tissues.

Concentration-time profiles for unconjugated silibinin in plasma (A) and bile (B) after silibinin administration (50 mg/kg i.v.) to the control group and the group DMN-induced cirrhosis. Each group of data is presented as the mean ± S.E.M. from six individual experiments.
CsA plays the role of an inhibitor of P-gp transporter and has been reported to decrease the hepatobiliary excretion of substrates from the liver into bile (Chu et al., 1999). Generally, the hydrophilic glucuronide metabolites are beneficial to diffuse hepatocyte passively into either bile or sinusoidal blood after intrahepatic formation. Carrier- or transporter-mediated processes are associated to transport conjugated metabolites across either the canalicular or basolateral membrane (Zamek-Gliszczynski et al., 2006). Multidrug resistance protein 2 is responsible for the biliary excretion of a variety of endogenous and exogenous organic anions, including many glucuronide conjugates, some glutathione conjugates, and a few sulfate conjugates (Oude Elferink et al., 1995). In this study, a dose of CsA (20 mg/kg) for the hepatobiliary excretion of total silibinin in rats was sufficient to inhibit the pharmacokinetic interaction at the 30 mg/kg dose of silibinin. This result indicates that P-gp might act as a certain affinity component in the total silibinin excretion into bile.

Concentration-time profiles for total silibinin in plasma (A) and bile (B) after silibinin administration (50 mg/kg i.v.) to the control group and the group with DMN-induced cirrhosis. Each group of data is presented as the mean ± S.E.M. from six individual experiments.
CsA and its metabolites are mainly eliminated via bile (Christians et al., 1991), and an apparent rise with CsA in β-glucuronidase activity was seen in the renal tissue in rats (Mohamadin et al., 2005) and human serum (Falkenbach et al., 1993). The Cmax of unconjugated silibinin in bile was decreased from 242 ± 55 to 37 ± 9.1 μg/ml, which reduced the bile elimination of unconjugated silibinin. β-Glucuronidase is present in all mammalian tissues and is especially abundant in the liver to process enzymatic deconjugation (Fishman and Anlyan, 1947; Zamek-Gliszczynski et al., 2006). Silibinin may cause drug-drug interactions via inhibition of β-glucuronidase activity in the liver and intestinal bacteria (Kim et al., 1994). Ho et al. (1979) demonstrated high β-glucuronidase activity in the bile of rats with an indwelling bile duct fistula.
The unconjugated silibinin AUCbile/AUCblood ratio for the liver cirrhosis group was increased 73% compared with that for the control group (Table 3). Many drugs induce a significant release of more unconjugated fraction with chronic liver disease; such drugs may be metabolized more rapidly in patients with cirrhosis (Delcò et al., 2005). However, Pacifici et al. (1990) demonstrated that liver disease reduces the activities of sulfotransferase, acetyltransferase, glutathionetransferase, and thiomethyltransferase. The plasma AUC of unconjugated silibinin was significantly reduced in the presence of liver cirrhosis, which might be due to a decrease in the enzyme activity. An extrahepatic contribution to drug metabolism is often disregarded. Kidney, jejunum, and adrenal gland are most enriched in uridine diphosphate-glucuronosyltransferase activity. The kidney may contribute to glucuronidation of bilirubin in bile duct-ligated rats (Chowdhury et al., 1985).
The total silibinin AUCbile/AUCblood ratio was reduced 52% from 45 ± 4.4 for the control group to 21.6 ± 6.7 for the group with liver cirrhosis (Table 3). The extrahepatic biliary obstruction may be associated with reduced clearance of conjugated silibinin, probably because of impaired excretion of the conjugate in bile (Schandalik and Perucca, 1994). In chronic cholestatic liver diseases, the biliary excretion of cholephilic organic anions is impaired. Multidrug resistance protein 2 expression decreases with progressive cholestasis in primary biliary cirrhosis (Kullak-Ublick et al., 2002). Yumoto et al. (2003) demonstrated the suppression of in vivo P-gp function in the liver, kidney, brain, and intestine. This study demonstrated that P-gp inhibitors significantly decreased total silibinin AUC in the bile.
In conclusion, we have demonstrated the effect of CsA and liver cirrhosis on the pharmacokinetics of silibinin in rats. The high biliary levels of silibinin indicate that it may undergo active hepatobiliary excretion, and the bile elimination of silibinin was partially blocked by coadministration with CsA. The total plasma silibinin AUC for the group of cirrhotic rats was significantly greater than that for the control group. These results suggest that phase II conjugation and hepatobiliary excretion play a crucial role in the elimination of silibinin.
Footnotes
-
Funding for this study was provided in part by research Grants: NSC96-2113-M-010-003-MY3 and NSC96-2628-B-010-006-MY3 from the National Science Council; TCH 95004-62-170 from Taipei City Hospital; and V96E2-009 from Taipei Veterans General Hospital, Taiwan.
-
Article, publication date, and citation information can be found at http://dmd.aspetjournals.org.
-
doi:10.1124/dmd.107.017004.
-
ABBREVIATIONS: P-gp, P-glycoprotein; CsA, cyclosporin A; DMN, dimethylnitrosamine; HPLC, high-performance liquid chromatography; AUC, area under the concentration versus time curve.
- Received June 1, 2007.
- Accepted November 27, 2007.
- The American Society for Pharmacology and Experimental Therapeutics


