


Abstract
From previous fits of drug transport kinetics across confluent Madin-Darby canine kidney II cell line overexpressing human multidrug resistance 1 cell monolayers, we found that a drug's binding constant to P-glycoprotein (P-gp) was significantly smaller than its IC50 when that drug was used as an inhibitor against another P-gp substrate. We tested several IC50 candidate functions, including the standard function, the Kalvass-Pollack function, and the efflux ratio, to determine whether any of them yielded an IC50 = KI, as would be expected for water-soluble enzymes. For the confluent cell monolayer, the IC50/KI ratio is greater than 1 for all candidate functions tested. From the mass action kinetic model, we have derived a simple approximate equation that shows how the IC50/KI ratio depends on the elementary rate constants from our mass action model. Thus, the IC50 will differ between cell lines and tissues, for the same probe substrate and inhibitor, if there are different membrane concentrations of P-gp, or the probe substrate's elementary rate constants, partition coefficient, binding constant to P-gp, passive permeability, and ability to access the other transporters (if any) in the two cell lines. The mass action model and the approximate equation for the IC50/KI ratio derived here can be used to estimate the elementary rate constants needed to extrapolate in vitro drug-drug interactions for compounds to the in vivo environment.
The importance of membrane transporters in the metabolism and disposition of drugs is clear (Chang and Benet, 2005; Collett et al., 2005; Endres et al., 2006; Shitara et al., 2006; Bartholomé et al., 2007; Balimane et al., 2008; Glavinas et al., 2008; Kurnik et al., 2008; Nies et al., 2008). Assessing drug-drug interaction risk is an important aspect of drug development, which is often quantified by the concentration of inhibitor required to reduce probe substrate transport by 50%, reported as the IC50 (Gao et al., 2001; Zong and Pollack, 2003; Rautio et al., 2006). The basic function of the IC50 experiment is to rank order compounds with respect to inhibition of the probe substrate transport and then to use this list along with other relevant clinical information to predict in vivo activity. The IC50 is usually assumed to be a fairly good estimate of the true thermodynamic dissociation constant of the inhibitor, KI, to the transporter.
For a one-site enzyme that competitively binds both drug and inhibitor directly from the aqueous phase, the ratio of IC50/KI = 1 + KC[L], where [L] is the probe substrate concentration and KC is the probe substrate binding constant (Cheng and Prusoff, 1973). This equation should work for membrane transporters that bind their substrate directly from the extracellular phase, e.g., glucose permeases (Hah et al., 2002).
For transporters that bind drug from the inner monolayer of the plasma membrane, such as P-gp (Loo and Clarke, 2005; Lugo and Sharom, 2005) and MRP (Borst et al., 2006), the binding site is a permeability barrier away from where the drug is added. Drug concentration at the binding site within the apical membrane depends on the partition coefficient of the drug to the inner apical membrane. At a minimum, this suggests that passive permeability through the plasma membrane and the partition coefficient should influence the IC50/KI ratio. We have already shown that when the steady-state Michaelis-Menten equations are used to analyze P-gp-mediated transport of a substrate through the confluent cell monolayer the fitted Michaelis constant Km depends on the passive permeability of the substrate through the membranes (Bentz et al., 2005).
We previously fitted the elementary rate constants for substrate binding to P-gp and efflux from P-gp for amprenavir, digoxin, loperamide, and quinidine, using a MDCKII-hMDR1 cell monolayer (Table 1) (Tran et al., 2005; Acharya et al., 2006, 2008). As expected, each of these P-gp substrates inhibited the transport of the other P-gp substrates (Acharya et al., 2006). However, we discovered that the IC50 values we measured experimentally, which agree with those of Rautio et al. (2006), were much larger than the KI predicted using our fitted dissociation constants and partition coefficients of the inhibitors, even at very low substrate concentrations.
Fitted parameter values for MDCKII-hMDR1 confluent cell monolayers
In this work, we explain the source of the difference between an IC50 and a KI in the confluent cell system with experiments and our mass action model. We have derived a simple approximate equation from the mass action model for the IC50/KI ratio in terms of the elementary rate constants for the probe substrate and the inhibitor. Our nonlinear mass action model is more difficult to solve than the standard Michaelis-Menten models (Ho et al., 2000; Bartholomé et al., 2007; Sun and Pang, 2008), but we obtain a deeper understanding of how transport through the confluent cell monolayer works, which cannot be extracted from the simpler steady-state kinetic models. Thus, in vitro to in vivo extrapolations are more reliable when launched from this nonlinear mass action model.
Materials and Methods
Compounds.
Amprenavir and GF120918 were from GlaxoSmithKline (Uxbridge, Middlesex, UK); loperamide and quinidine were from Sigma-Aldrich (St. Louis, MO). [3H]Amprenavir (24 Ci/mmol) was custom-synthesized by GE Healthcare (Little Chalfont, Buckinghamshire, UK). [3H]Quinidine (20 Ci/mmol) was from American Radiolabeled Chemicals (St. Louis, MO). Dimethyl sulfoxide was obtained from Sigma-Aldrich. Dulbecco's modified Eagle's medium with 25 mM HEPES buffer, high glucose (4.5 g/l), l-glutamine, pyridoxine hydrochloride, without sodium pyruvate, and with phenol red was from Invitrogen (Carlsbad, CA). The same medium without phenol red was used for transport experiments. Transwell 12-well plates with polycarbonate inserts (0.4-μM pore size and 12 mm in diameter) were obtained from Corning Life Sciences (Lowell, MA).
Experimental Methods.
Cell line and culture conditions.
The MDCKII-hMDR1 was obtained from The Netherlands Cancer Institute (Amsterdam, The Netherlands). The cells were grown in 175-cm2 culture flasks using Dulbecco's modified Eagle's medium with 10% fetal bovine serum, 1% l-glutamine, 50 units/ml penicillin, and 50 mg/ml streptomycin at 37°C in 5% CO2 atmosphere. Cells were split in a ratio of 1:40 twice a week at 70 to 80% confluence after at least two washes with phosphate-buffered saline and trypsinization with 0.25% trypsin/EDTA. All transport assays were performed with cells from passages 30 to 55.
Inhibition studies.
Cell monolayers were preincubated for 1 h with inhibitor-containing transport medium in both apical and basolateral chambers. After preincubation, fresh medium with an appropriate inhibitor concentration was added to both basolateral and apical chambers along with the radiolabeled substrate on the chosen donor side. After a 4-h incubation period, samples were taken from both apical and basolateral chambers and counted using a TopCount model 9912. Passive permeability of the substrate was determined in the presence of 2 μM GF120918. Lucifer yellow was added to the donor chambers in all cases to assess monolayer integrity. Other details are described in Acharya et al. (2006, 2008).
Simulations.
For all drugs tested, there is an initial increase in the passive permeability coefficients followed by a true steady state (Tran et al., 2005; Acharya et al., 2006). For the simulations in this work, these transients will be ignored and the monolayers treated as static passive permeability barriers where passive permeability coefficients are constant in time. Including these transients would only increase the IC50 overestimate of the KI.
In permeability studies with cell monolayers, it is only possible to measure transport across the entire monolayer, which yields the passive permeability coefficients PBA, basolateral to apical chamber, and PAB, apical to basolateral chamber. However, for fitting the mass action kinetics, other individual membrane passive permeability coefficients are needed, including PAC, apical chamber to cytosol, and PBC, basolateral chamber to cytosol. Another challenge to these simulations is that often PBA does not equal PAB until a true steady state occurs (Tran et al., 2005; Acharya et al., 2006). The simplest mix of experiment and theory is to set PAC = PCA = PAB and PBC = PCB = PBA to account for this asymmetry and to capture the basic elements of the observed kinetic process (see Tran et al., 2005, for more details). We used the stiffest integrator in MATLAB, ode23s, with absolute and relative tolerances set up to 10−8.
Kinetic model of transport across a confluent cell monolayer.
Figure 1 is a cartoon of a confluent cell monolayer, featuring the polarized MDCKII-hMDR1 cells, where the basolateral membrane is attached to the polycarbonate filters and P-gp (upward arrows) is expressed on the apical surface. The apical and basolateral chambers are kept separate by the tight junctions. Active transport by P-gp occurs unidirectionally, with substrate binding to a site on P-gp within the apical membrane inner monolayer and with efflux into the apical chamber (Loo and Clarke, 2005; Lugo and Sharom, 2005). For many substrates, including those used in this study, passive permeability is a significant fraction of total transport and is quantitatively analyzed separately using the P-gp inhibitor, GF120918 (Evers et al., 2000; Acharya et al., 2008).

Model of a confluent cell monolayer, with the apical membrane on top and the basolateral membrane below, where it binds to the polycarbonate insert. Passive permeability occurs in both directions. P-gp expressed on the apical membrane transports substrate from the inner apical membrane monolayer into the apical chamber. The concentrations of substrate in the apical and basolateral chambers, CA and CB, are measured, whereas the concentrations of substrate in the inner plasma membrane, CPC, and the cytosol, CC, are predicted as part of the mass action modeling and data-fitting process. For some compounds, such as digoxin and loperamide, other transporters are expressed by the MDCKII-hMDR1 confluent cell monolayer.
We measure the concentration of substrate in the apical chamber, denoted CA, and in the basolateral chamber, denoted CB. However, the concentration of substrate in the cytosol, denoted CC, and in the inner plasma membrane in contact with the P-gp binding site, denoted CPC, cannot (yet) be measured rigorously in real time. These internal concentrations are variables of the mass action model and are fitted by elementary rate constants for well defined kinetic barriers, according to the measured values of CB and CA over time (Tran et al., 2005; Acharya et al., 2008).
We use the simplest competitive Michaelis-Menten mass action reaction to model P-gp transport:

 where T0 is the empty transporter, CPC is the substrate in the apical membrane inner monolayer, TC is the transporter bound by substrate, and CA is the substrate after efflux into the apical chamber (eq. 1). For the inhibitor, labeled Q, QPC is the inhibitor in the apical membrane inner monolayer, TQ is the transporter bound by inhibitor, and QA is the inhibitor after efflux into the apical chamber (eq. 2). Loperamide and digoxin use additional transporters within the MDCKII cell line (Acharya et al., 2008). Both are used here as inhibitors and the additional transporters are included in the fittings.
Table 1 shows the median consensus values of the elementary parameters used to fit the transport kinetics of amprenavir, digoxin, loperamide, and quinidine (Acharya et al., 2006, 2008). Each parameter fitted gave good fits to all the data for up to 4 to 6 h of transport. The values in Table 1 make considerable sense for P-gp function and structure (Tran et al., 2005; Acharya et al., 2006, 2008). For the MDCKII-hMDR1 cells, all drugs had essentially the same rate constant for association to P-gp, k1, and essentially the same fitted membrane concentration of efflux active P-gp in the apical membrane, which was a benchmark for the validity of our mass action model and kinetic analysis (Tran et al., 2005; Acharya et al., 2006, 2008). We use the term “efflux active” to denote those P-gps whose effluxed substrate can reach the apical chamber, e.g., P-gps near the tips of the microvilli, as opposed to those P-gps near the base of the microvilli, whose effluxed substrate is nearly always reabsorbed back into the membrane before reaching the apical chamber (Acharya et al., 2006).
In our simulations, the value for k1 was fixed at the value shown as it depends on lipid lateral diffusion coefficient and the size to the entry way into the P-gp binding site (Tran et al., 2005). We expect k1 to be roughly cell- and tissue-independent because it depends mostly on lipid lateral diffusion in the inner plasma membrane, although this has not yet been proven. In contrast, the value of the membrane concentration of efflux active P-gp can be changed in the simulations, as this parameter can differ between cultured cells (Polli et al., 2001; Tang et al., 2002) and between tissues (Choo et al., 2006; Kurnik et al., 2008).
To be determined are three other significant parameters characterizing substrate and inhibitor interactions with the confluent cell monolayer and P-gp, all of which are probe substrate parameters:
-
k2, the efflux rate constant of the substrate from P-gp into the apical chamber.
-
kr, the dissociation rate constant of the substrate from P-gp back into the inner apical membrane. The binding constant of the substrate to P-gp from the inner monolayer of the apical membrane is defined by the ratio of the fitted rate constants, i.e., KC = k1/kr. Because k1 is fixed at the consensus value (Table 1), here, kr determines the binding constant.
-
KPC, the partition coefficient of the substrate between the inner monolayer of the apical membrane and the cytosol. The product of KPCKC is binding constant to P-gp relative to the cytosolic concentration of substrate, so that the dissociation constant of the substrate to P-gp, relative to the cytosol, is KD = 1/(KPCKC). When the drug is used as an inhibitor, KI = KD to keep identities straight.
The two other partition coefficients, KBO, between the basolateral chamber and the outer basolateral membrane monolayer, and, KAO, between the apical chamber and the outer apical membrane monolayer (Fig. 1), have also been estimated independently (Tran et al., 2005), and the values in Table 1 are used in the simulations.
Results
Candidate IC50 Functions for Estimating KI.
The “standard” literature function, denoted SF, used to define an IC50 at some particular incubation time is shown in eq. 3 (Gao et al., 2001; Zong and Pollack, 2003; Rautio et al., 2006):
 with 〈Q〉 being the inhibitor concentration added to both compartments; nmol(〈Q〉), nmol(GF120918), and nmol(〈Q〉 = 0) refer to the nanomoles of substrate transported in the presence of 〈Q〉 in both chambers, in the presence of the potent P-gp inhibitor GF120918, and in the absence of inhibitor, respectively. If the data are without error, SF(〈Q〉) varies between 1 and 0. The inhibitor concentration required to reduce substrate transport by 50% is the IC50. Throughout this article, the IC50 calculated by eq. 3 will be called the SF50, to identify clearly which candidate function is being tested. This candidate function can be used for B>A and A>B transport.
Other IC50 candidate functions were tested as well (see Balimane et al., 2008, for a current list of published candidate functions). Kalvass and Pollack (2007) proposed the candidate function in eq. 4 to replace the standard function of eq. 3 for A>B transport only.
 Eq. 4 is identical to Kalvass and Pollock's eqs. 12.1 and 12.4, but translated into our notation. We denote the IC50 obtained from eq. 4 as the KP50.
Another candidate function used to calculate an IC50 is the efflux ratio (ER) in eq. 5:
 ER50 denotes the IC50 from eq. 5. This is a very good numerical approximation to the equation currently recommended in the Food and Drug Administration Guidance on Drug Interactions for measuring the IC50 for P-gp (Balimane et al., 2008), and it is simpler.
We also tested the simplest plausible candidate functions, i.e., just the A>B transport versus inhibition, termed absorption inhibition (AI) and the B>A transport versus inhibition termed secretion inhibition (SI),

 AI50 denotes the IC50 from eq. 6, and SI50 denotes the IC50 from eq. 7.
Experimental IC50 Curves.
The error bars in Figs. 2 and 3 are S.D.s calculated using the equations derived in Supplemental Data Appendix A. These are the appropriate equations to use for functions with products and quotients of variables with error, i.e., the candidate functions (Taylor, 1997). In all cases, our original triplicate data for nanomoles transported had <10% S.D.

Inhibition of 3 μM quinidine A>B transport across the MDCKII-hMDR1 confluent cell monolayer by different P-gp competitive inhibitors/substrates: A, amprenavir (AMP); B, loperamide (LPM); and C, quinidine (QND). The smooth, thick, broken line, denoted HH, is the predicted one-site binding curve using the fitted KI of the inhibitor, i.e., shown where it crosses the dotted line at 50%. □, standard inhibition curve from eq. 3; ▵, Kalvass and Pollock curve from eq. 4; ○, AI equation (eq. 6). Data points show the mean ± S.D. (n = 3). The error bars are S.D.s, calculated using eqs. A.7, A.8, A.9 in Supplemental Data Appendix A, which are the appropriate equations to use for functions that are ratios of variables with error, i.e., the candidate functions (Taylor, 1997).

Digoxin A>B and B>A transport across the MDCKII-hMDR1 confluent monolayers in the presence of inhibitors/substrates: 0.03 μM digoxin (DGX) inhibited by quinidine (QND), A>B (A) and B>A (B); 0.1 μM digoxin (DGX) inhibited by verapamil (VRP), A>B (C) and B>A (D). For A>B transport: □, standard inhibition curve from eq. 3; ▵, Kalvass and Pollock curve from eq. 4; ♦, efflux ratio curve from eq. 5; ○, absorption inhibition curve from eq. 6. For B>A transport: □, standard inhibition curve from eq. 3; ♦, efflux ratio curve from eq. 5; ○, secretory inhibition curve from eq. 7. Data points show the mean ± S.D. (n = 3).
Figure 2 shows the inhibition of 3 μM quinidine A>B transport across the MDCKII-hMDR1 confluent cell monolayer by different P-gp competitive inhibitors/substrates. We chose quinidine as the probe substrate because P-gp is its only kinetically relevant transporter in the MDCKII-hMDR1 cell line, like amprenavir (Acharya et al., 2008). Figure 2A shows amprenavir as inhibitor. The fitted KI for amprenavir is shown by the arrow at ∼5 μM. It is clear that the KP50 ∼10 μM from eq. 4 makes a better estimate of KI than the SF50 ∼30 to 40 μM from eq. 3 or the AI50 ∼20 μM from eq. 6. The inhibition curves have the shape of the one-site competitive inhibition curve denoted HH, for Henderson-Hasselbalch, reasonably well.
Figure 2B shows loperamide as inhibitor. The KP50 ∼0.4 μM from eq. 4 makes a better estimate of the fitted KI ≅ 0.1 μM than the SF50 ∼1 to 2 μM from eq. 3 or the AI50 ∼1 μM from eq. 6. There is also a “bounce” in the KP curve starting at a concentration approximately 1 order of magnitude below the KI. This experiment has been done three times with basically the same result: the fraction transported goes down to 0.8 to 0.9 around 0.01 μM loperamide and rises to approximately 1.1 around 0.01 to 0.05 μM loperamide. For all three experiments the KP50 is in the range 0.3 to 0.5.
This bounce became less variable in magnitude when the cells were preincubated with the inhibitor for 1 h and the measurement was made 2 h later, as we have done here. Shorter preincubation times (0.5 h) or longer measurement times (4 h) typically yielded greater variability. Our simplest hypothesis involves changes in microvilli morphology, e.g., longer or shorter, which can strongly alter passive and active efflux via drug reabsorption by microvilli (Tran et al., 2005; Acharya et al., 2006, 2008).
Figure 2C shows quinidine itself as the inhibitor; i.e., excess cold quinidine was added. The KP50 ∼1 to 2 μM from eq. 4 makes a better estimate of the KI ≅ 0.1 μM than the SF50 ∼4 to 5 μM from eq. 3 or the AI50 ∼3 μM from eq. 6. So, for all three cases in Fig. 2, the Kalvass and Pollock (2007) KP50 was closer to the KI.
Figure 3, shows the inhibition of digoxin transport in both directions. Figure 3, A and B, shows 0.03 μM digoxin transport inhibited by quinidine in the A>B and B>A directions, respectively. The fitted KI values are shown by the arrow and the dotted line represents 50% inhibition of P-gp activity. Figure 3, C and D, shows 0.1 μM digoxin transport inhibited by verapamil in the A>B and B>A directions, respectively. The ER candidate function (eq. 5), is closer to the KI for quinidine, but there is not much difference between the candidate functions. The KI for verapamil has not been fitted yet.
Simulations.
We have observed that the IC50 measured for a number of inhibitors using several commonly used candidate functions overestimate the KI by 2- to 100-fold, depending on the probe substrate and the inhibitor. The mass action kinetic model was analyzed to determine what causes IC50/KI > 1.
The first step is to determine whether simulations show the same overestimate for IC50/KI, which may not be expected because the model fitted the KI in the first place. Figure 4 shows the simulation of the nanomoles transported over time for a 2 μM quinidine-like probe substrate in both directions as a function of concentration for a quinidine-like inhibitor whose KI = 0.1 μM. Complete inhibition of P-gp is shown by the thick black line, denoted as GF120918 here, in the middle and yields the passive permeability of the probe substrate through the bilayer, because there is no transporter for quinidine in the mass action model. Below the GF120918 line is the A>B transport and above the GF120918 line is the B>A transport, as a function of inhibitor concentration (0.3 and 1 μM, respectively). The dashed lines at top and bottom show inhibitor-free transport in both directions; i.e., when 〈Q〉 = 0, and P-gp efflux is fully functioning (e.g., the B>A rate is larger than the A<B rate). According to eq. 3, the SF50 in either direction would be halfway between the dashed line (without inhibitor, 0 μM) and the black solid line (for completely inhibited P-gp, GF120918).
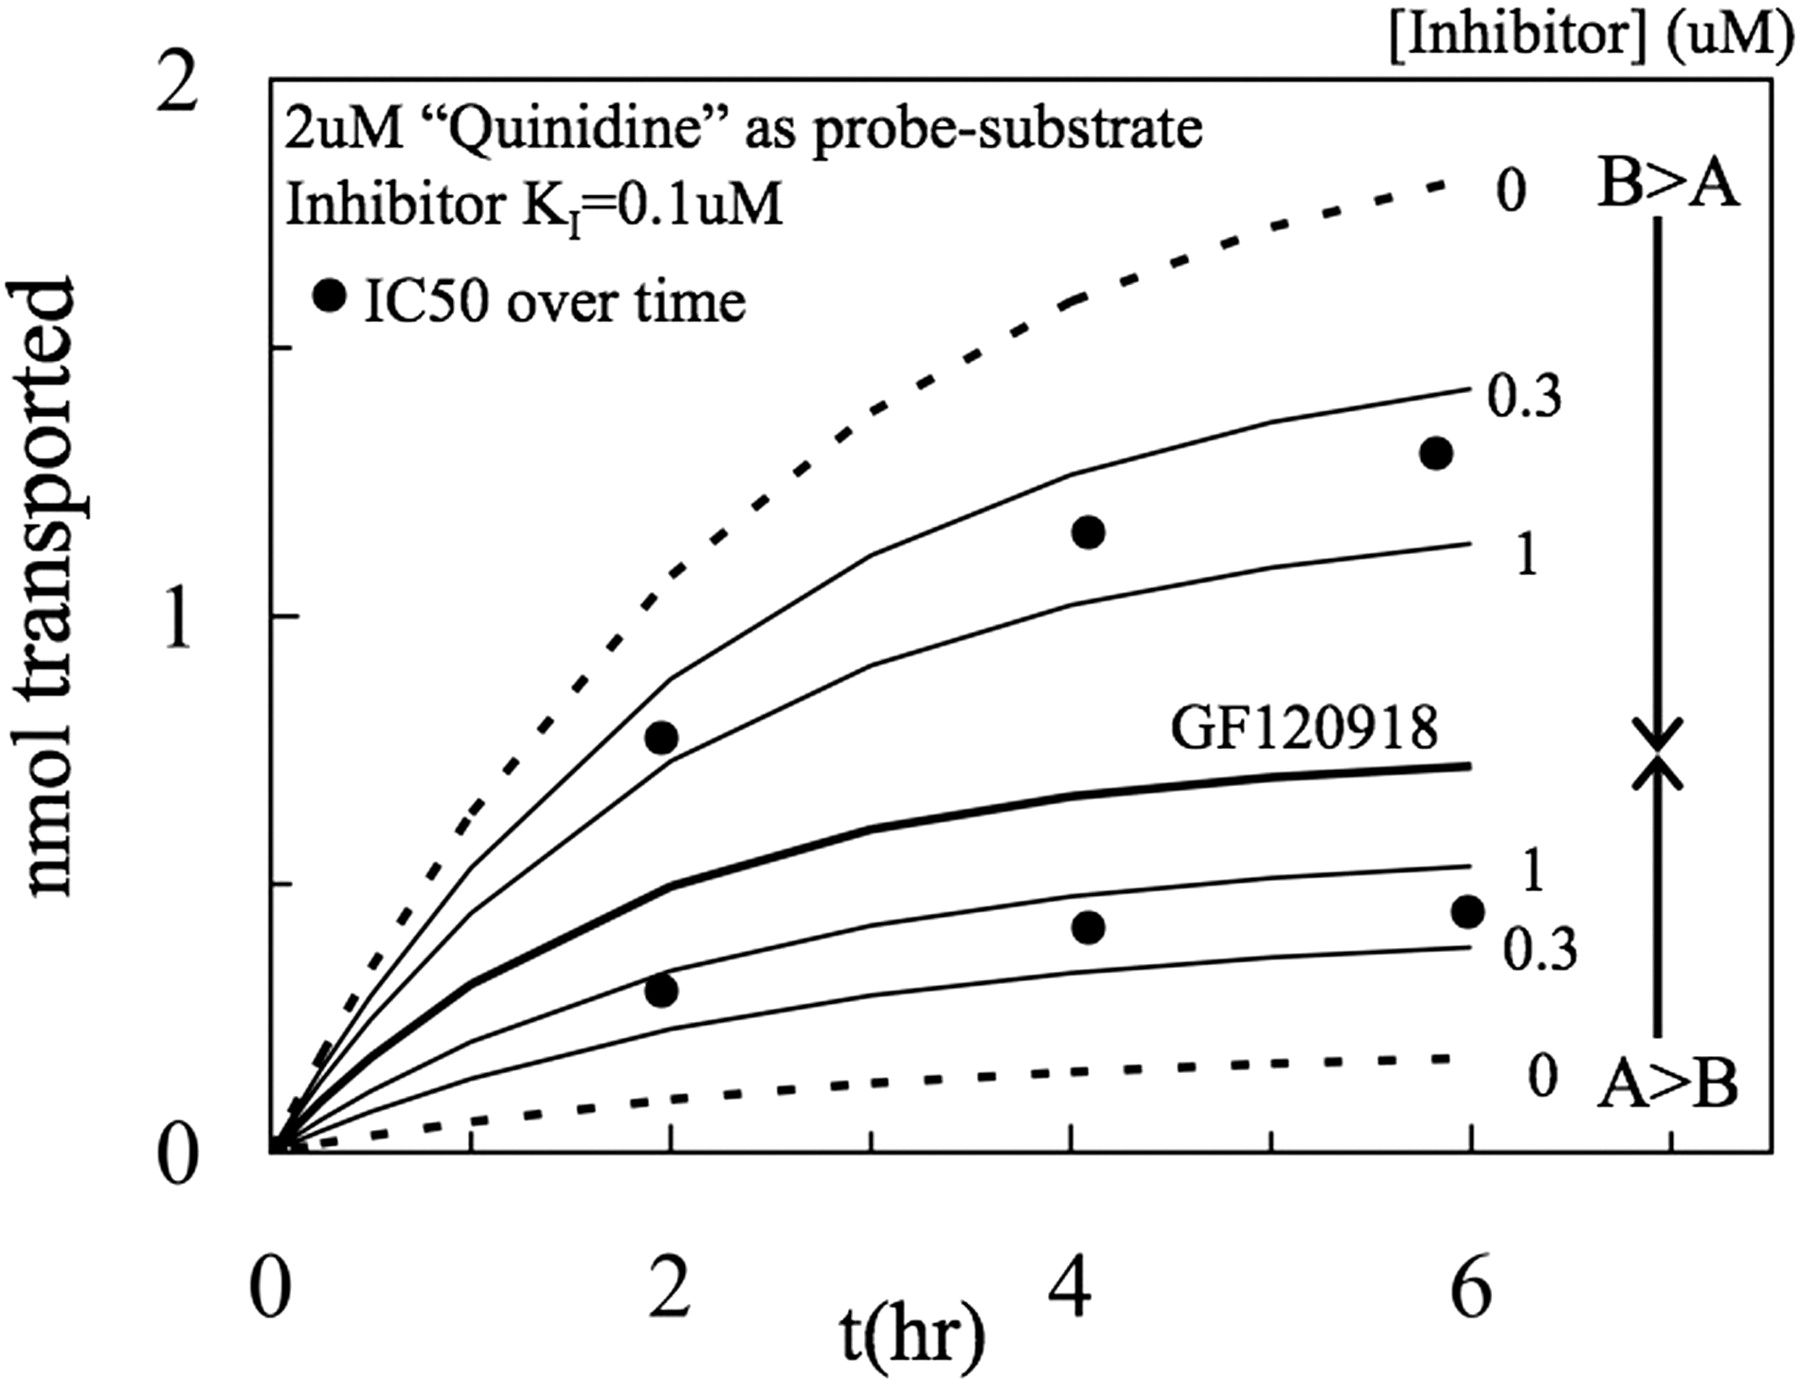
Simulation of nanomoles transported over time for a 2 μM quinidine-like probe substrate, denoted QND, in the presence of increasing concentrations of a quinidine-like inhibitor, i.e., with the same kinetic parameters as quinidine, including KI = 0.1 μM. Complete inhibition of P-gp by GF120918 is simulated by the thick black line in the middle. B>A transport is shown by the thin lines above the GF120918 control, with the inhibitor concentration shown beside as micromolar concentrations. A>B transport is shown by the thin lines below the GF120918 control, with the inhibitor concentration shown beside as micromolar concentrations. It is clear that the IC50 is in the range of 0.7 μM in both directions, i.e., approximately 7 times larger than the KI.
The simulated SF50 is shown by the large black dots at different time points and is approximately 0.7 μM, i.e., 7-fold larger than the KI used to calculate these simulations in the first place. The simulated nanomoles transported starting with either 0.1 or 5 μM probe substrate gave essentially the same results (data not shown), proving that the difference between SF50 and KI is not due to probe substrate concentration. Likewise, because there were no transporters in this simulation, aside from P-gp, the overestimate cannot be due to another transporter, but rather is due to the IC50 candidate function.
The IC50/KI Overestimation Equation.
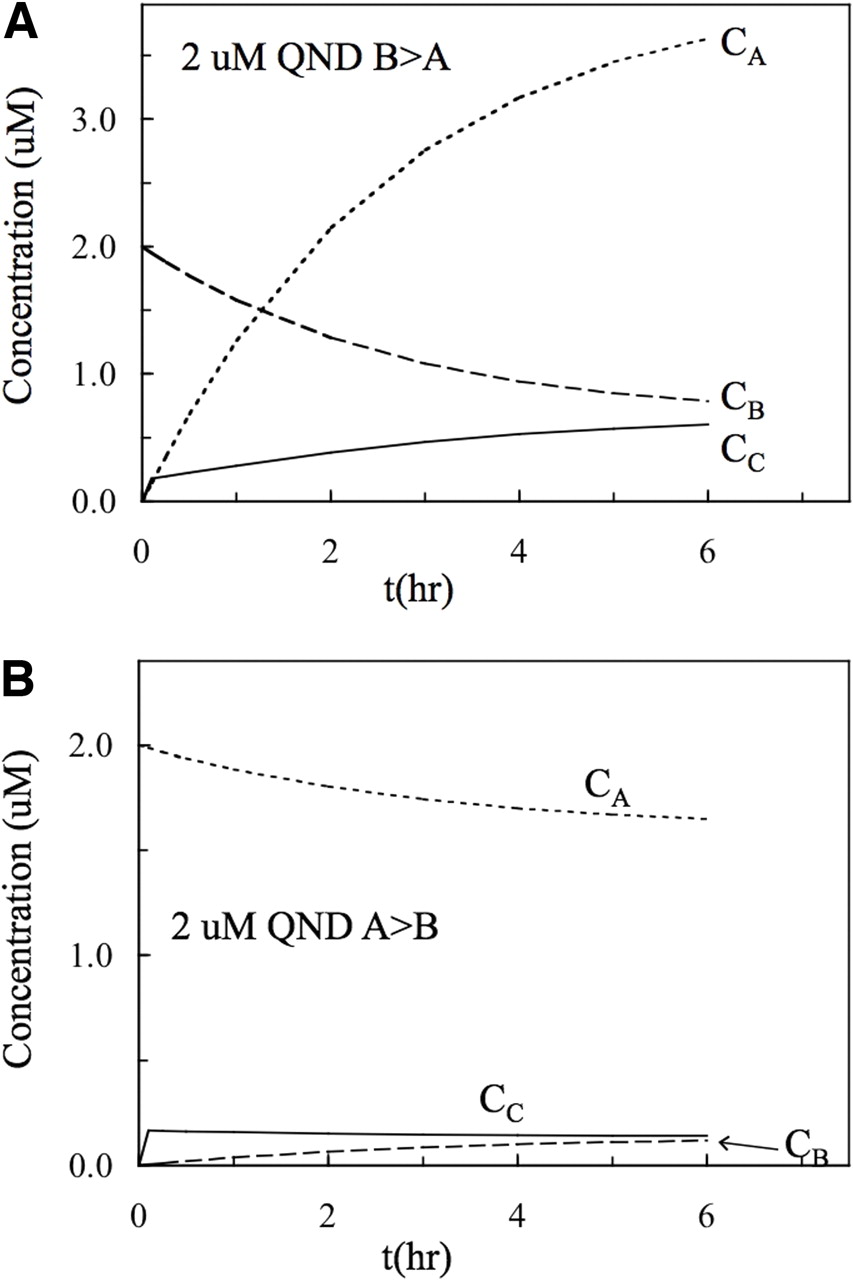
Because our data and the mass action kinetic model predict that the IC50 will overestimate the KI of the inhibitor, we can use simulations to understand why. Figure 5 shows the simulated concentrations of a 2 μM quinidine-like probe substrate over time. Figure 5A shows that for B>A transport, the concentration in the basolateral chamber, CB, starts at 2 μM and decreases continuously, whereas the concentration in the apical chamber, CA, increases continuously to greater than 3 μM, which exceeds the initial concentration in the donor chamber because the volume of the basolateral chamber is 3-fold greater than that of the apical chamber. The cytosolic concentration, CC, rises slowly and converges with CB at steady state. After 6 h, the system has reached its true steady state, at which the flux from the apical chamber by passive permeability into the cytosol equals the ATP-driven active transport by P-gp into the apical chamber, plus the passive permeation from the cytosol to the apical chamber.

Simulations of the concentrations over time of a quinidine-like probe substrate, i.e., using the quinidine kinetic parameters shown in Table 1, in the basolateral, cytosol, and apical compartments, starting with a 2 μM concentration in the donor compartment. A, donor is the basolateral chamber, i.e., B>A. No steady state is established before the true steady state, which will occur when CC = CB. The concentration in the apical chamber will reach somewhat less than 4 μM, because the apical chamber is 0.5 ml and the basolateral chamber is 1.5 ml. B, donor is the apical chamber, i.e., A>B. A quasi-steady state is established within minutes in the cytosol, CC ∼ 0.2 μM, which slowly decreases slightly to the true steady state, which will occur when CC = CB.
The usual assumption of an IC50 experiment is that there is a steady-state period, wherein the rate of product formation is approximately constant over some period of time. For B>A transport, there is no clear steady state for CA until the true steady state, which occurs sometime after 6 h (Fig. 5A). Note that the “jump” of the concentration in the cytosol, CC, at the first time point in the simulation (6 min), is not a computational artifact. This is the first time point taken in our experiments (Tran et al., 2004, 2005; Acharya et al., 2006). This jump is due only to connecting a straight line between t = 0 and t = 6 min and would become smooth if we had plotted earlier time points from the simulation.
Figure 5B shows for A>B transport that there is a striking difference in the shapes of the concentration curves. The concentration in the apical chamber, CA, starts at 2 μM, decreases slowly, and reaches a true steady state at approximately 1.5 μM. The concentration in the cytosol, CC, jumps rapidly to approximately 0.16 μM, a quasi-steady state, and then decreases slightly over time to the true steady state of approximately 0.13 μM. We use quasi-steady state to denote a relatively flat concentration curve in the cytoplasm that eventually reaches the true steady state. The term cannot be defined rigorously because there is a continuum of more or less relatively flat concentration curves observed in these simulations. However, the quasi-steady state in conjunction with the mass action kinetic equations can be used to provide guidance for understanding the overestimate of KI by the IC50 values of the candidate functions.
The conditions met during the quasi-steady state for A>B transport is that the cytosolic CC is essentially constant over time, yielding a time-independent IC50 and that CC ≪ CA. We use these conditions on the mass action kinetic model of P-gp-mediated transport through a confluent cell monolayer to derive an approximate solution for SF50/KI, which is shown in Appendix B in the Supplementary Data. This equation (eq. 8) is
 All terms on the right-hand side, both numerator and denominator, are for the probe substrate and are defined in Table 1 using the same units. The numerator shows all of the parameters that control P-gp-mediated efflux from the cells, including the membrane concentration of efflux active P-gp, denoted [P-gp]. Increasing the numerator leads to a greater overestimate. The denominator shows all of the parameters that control influx into the cells, i.e., the +GF120918 lipid bilayer/tight junction permeation, denoted PBC and PAC, and the transport by other transporters, denoted kB and kA. The bilayer thickness is denoted d, expressed in nanometers, and we use d = 4 nm for our simulations; i.e., 4/d = 1 nm−1. Thus, all of these terms have the units of second−1. Increasing the denominator leads to a smaller overestimate. The value of SF50/KI is always greater than 1 when the approximations used in the derivation are valid. Eq. 8 is the molecular expression of the schematic diagram proposed in Litman et al. (2003).
Using simulations, we assessed the accuracy of eq. 8. Changing each parameter 10-fold, up or down, produced appropriate 7- to 12-fold changes in the predicted values of SF50/KI (data not shown). The decrease in SF50/KI as the passive permeability coefficients of the probe substrates increase is well predicted by eq. 8, R2 > 0.95, for both A>B and B>A transport. This result shows that the direction of transport does not matter for eq. 8, despite the differences in the shapes of the kinetic curves. Thus, the quasi-steady-state condition for A>B transport was not necessary to derive eq. 8, but it was sufficient. This directional independence is not shared by all other membrane-specific candidate functions for IC50 calculations; e.g., the Kalvass and Pollack (2007) equation in the B>A direction, appropriately transformed, has a very different IC50 than that for A>B transport.
Experimental validation of eq. 8 is examined in Table 2 wherein the measured SF50 values in this work are “corrected” by eq. 8 and compared with the KI values shown in Table 1. The kinetically fitted KI and the KI estimated using eq. 8 are in good agreement, except for the case of digoxin as the probe substrate and quinidine as the inhibitor. Because the simulations showed no obvious discrepancy, it appears that there remain other unknown factor(s) in the IC50 experiment. Further work involving a broader database will be required to understand these factors.
SF50 values and corrections to estimate KI
What is the relationship between a KI, an IC50, and the fraction of P-gp bound by the substrate? Figure 6 shows a simulation of the inhibition of 0.03 μM digoxin-like A>B transport by a quinidine-like inhibitor using the standard function (eq. 3), the Kalvass and Pollack equation (eq. 4), and the decrease in the fraction of P-gp bound by the digoxin-like probe substrate relative to that bound without inhibitor. It is interesting to note that the fraction of P-gp bound by digoxin is nearly identical to the inhibition curve of the standard equation. The KP50 ∼2 μM underestimates the concentration of 50 reduction in digoxin binding to P-gp, ∼4 μM.

A simulation of inhibition of 0.03 μM digoxin A>B transport by quinidine as measured by the KP and SF candidate functions (eqs. 3 and 4) and by the fraction of digoxin-bound P-gp relative to the digoxin-bound P-gp without inhibitor. The KI for quinidine is shown, which is more than 10-fold smaller than the KP50, SF50, and the mark for 50% P-gp bound by digoxin. The fraction bound is nearly identical to the SF candidate function.
Compared with the experimental data for the same case (Fig. 3, A and B), the simulation shows a greater separation between KP50 and SF50 than the experimental data. For the data, KP50 ∼6 μM and SF50 ∼10 μM. The larger IC50 values for the experiments may be due to the bounce seen in Fig. 2, B and C, or it may suggest that digoxin and quinidine do not compete as well as the other pairs tested. The simulations assume pure competitive binding using fitted binding constants obtained with drugs alone.
Physical Mechanism for the Overestimate Equation.
The physical mechanism for the overestimate of SF50 compared with that of KI is explained by the basic shape of a single-site competitive binding curve. We can vary any of the kinetic parameters in eq. 8 to show this and have chosen to use the P-gp concentration in the membrane. Figure 7 is a simulation of the concentration of P-gp bound to the digoxin-like probe substrate as a function of concentration of a quinidine-like inhibitor. There is a 0.03 μM digoxin-like probe substrate, and the elementary parameters from Table 1 were used in the simulations. The solid line is for 200 μM as the membrane concentration of efflux active P-gp, as in Table 1. Without inhibitor, approximately 0.12 μM P-gp is bound by substrate after a 2-h incubation. To reduce the substrate-bound P-gp by 50% required approximately 1.2 μM inhibitor. This value simulates the data in Fig. 3, A and B. On the other hand, the dotted line simulation has half the membrane concentration of efflux-active P-gp (100 μM), and the inhibitor-free concentration of digoxin-bound P-gp was 0.1 μM. To reduce this value by 50% requires approximately 0.7 μM inhibitor. A one-site competitive binding curve flattens out as the fraction bound decreases, and more inhibitor is required to reduce the substrate-bound P-gp by 50%. In both cases, KI = 0.1 μM is the same, and thus the overestimate is 7- and 12-fold, respectively.

The concentration of substrate-bound P-gp as a function of inhibitor concentration for A>B transport. The solid line shows the case for a 0.03 μM digoxin-like probe substrate inhibited by a quinidine-like inhibitor, using the parameters from Table 1. To reduce the substrate-bound P-gp from approximately 0.12 to 0.06 μM required approximately a 1.2 μM concentration of inhibitor. When the initial concentration of efflux active P-gp is halved to 100 μM, then the inhibitor-free value of substrate-bound P-gp is decreased to approximately 0.10 μM. To reduce the substrate-bound P-gp by 50%, to 0.05 μM, required approximately a 0.7 μM concentration of inhibitor, i.e., nearly half as much inhibitor, as was predicted by eq. 8.
Inside-Out Vesicles.
Because of the difficulty in getting the confluent cell monolayer system to yield a KI simply, simulations of inside-out plasma membrane vesicles (Glavinas et al., 2008) were undertaken. These vesicles have been proposed as a simpler system for fitting a KI or a Michaelis constant Km, depending on the experiment, because the binding site is directly exposed to the incubation medium. The drug would partition into the membrane, but there is no known permeability barrier from that membrane monolayer to the P-gp binding site, unlike the drug flip-flop across the plasma membrane that is required when the drug binds to the outer basolateral monolayer.
Starting from the appropriate mass action kinetic reactions, shown in Supplemental Data Appendix C, we calculated that the small volume of the vesicles, 1 to 10 μm diameter, would allow the true steady state to be achieved within seconds (eq. D2 in Supplemental Data Appendix D). This allowed approximations that yielded the eq. 9:
 i.e., P-gp in inside-out vesicles should behave like a soluble enzyme (Cheng and Prusoff, 1973). It is important to note that these simulations assumed that the vesicles were unilamellar and that the larger concentration of probe substrate and inhibitor within the vesicle due to P-gp had no impact on the P-gp binding site within the outside monolayer of the vesicle. These assumptions remain to be tested by experiment.
Discussion
The KI and IC50 of an inhibitor are the two basic ways of rank ordering inhibitors with respect to their activity against an enzyme or transporter, but they measure two quite different physicochemical properties. The KI = 1/(KQPCKQ) is the dissociation constant for the inhibitor from P-gp to the cytosol, i.e., the inverse of product of the binding constant of the inhibitor from the bilayer to P-gp, KQ, and the partition coefficient of the inhibitor into the bilayer from the cytosol, KQPC. This is an equilibrium thermodynamic parameter defined by the sum of two equilibrium thermodynamic free energies. The IC50 is the concentration of inhibitor required to reduce the transport of the probe substrate by 50% from a chosen probe substrate concentration and at a chosen incubation time. This is a profoundly kinetic parameter that depends on the KI and the kinetic parameters required to model the evolution of the system. Here, we have discovered which kinetic parameters make this definition.
We previously showed that the measured IC50 was much greater than the fitted KI for P-gp to amprenavir, loperamide, and quinidine (Acharya et al., 2006). Starting from the standard literature equation for the SF50 (eq. 3), we have derived a very simple approximate equation that defines the ratio of SF50/KI (eq. 8), shown in Supplemental Data Appendix A. The SF50/KI ratio increases as the parameters driving substrate efflux increase, e.g., membrane concentration of efflux active P-gp, substrate binding constant, substrate partition coefficient, and substrate efflux rate constant. Increases in these parameters reduce the cytosolic concentration of the substrate and the amount of substrate bound P-gp and increase the concentration of inhibitor needed to reduce the substrate-bound P-gp by 50% (Fig. 7). Eq. 8 also predicts that the SF50/KI ratio decreases as the passive permeability increases, either by bilayer permeation or the presence of other transporters. It is simply the math of a one-site binding reaction with inhibition by competitive binding happening within a small volume.
If it were the case that the MDCKII-hMDR1 cell line had another active transporter in the apical membrane that shared the substrate range of P-gp and was inhibited by GF120918, then the efflux active surface density of P-gp shown in Table 1 would be an average of the efflux active surface densities of P-gp and this other transporter, weighted by their respective kinetic parameters. Although loperamide does use another transporter in the basolateral membrane of this cell line (Table 1) (Acharya et al., 2008), our fits show that it is bidirectional, i.e., not an active transporter like MRP2 and breast cancer resistance protein. It appears that the MDCKII cell line shows no functional expression of MRP2 or breast cancer resistance protein (Lalloo et al., 2004; Wang et al., 2007; Weiss et al., 2007; Solazzo et al., 2009).
Equation 8 can be used to correct the SF50 and yield a good estimate for the KI in most cases (Table 2). The exception was digoxin inhibited by quinidine, for which the correction reduced the overestimate from approximately 90-fold to approximately 20-fold, which is still a large overestimate. Taub et al. (2005) found several P-gp substrates that did not inhibit other P-gp substrates very well and noted that P-gp can bind more than one substrate (Litman et al., 1997; Shapiro and Ling, 1997; Allers et al., 2009). One hypothesis is that digoxin binds predominantly to one site and quinidine binds predominantly to the other site, yielding weaker inhibition compared with that of drugs that bind predominantly to the same site. If so, then the two sites have cooperativity. We are unaware of any study showing that both substrates are transported from the same P-gp simultaneously or synchronously.
A second hypothesis starts with the finding that digoxin transport across the confluent MDCKII-hMDR1 cell monolayer requires one or more transporters other than P-gp, in both the apical and basolateral membranes (Table 1) (Acharya et al., 2008). Our analysis of quinidine transport showed that only P-gp is required for its transport (Acharya et al., 2008). However, this finding does not mean that quinidine cannot interact with these other transporters, it is just that the transporters do not provide a kinetically significant transport pathway for quinidine, whose bilayer permeability is much larger than that of digoxin (Table 1). This hypothesis is consistent with the idea that there are two binding sites for these drugs, but one is on P-gp and the other is on the other digoxin transporter.
Using standard steady-state Michaelis-Menten equations, Kalvass and Pollack (2007) predicted that the standard equation (eq. 3), would overestimate the KI. Our experiments showed that the KP50 and the ER50 values were usually closer to the KI than the IC50 values for the other candidate functions. However, none of the IC50 values of the candidate functions estimated the KI very well (Figs. 2 and 3). It is interesting to note that when the analysis given to the SF candidate function (eq. 3) to derive the overestimation equation (eq. 8) in Supplemental Data Appendix A was performed on the KP candidate function, the result was KP50/KI = 1 (data not shown), even though Figs. 2 and 3 show that was not the case.
The correction factor given by eq. 8 has no effect on the rank order of P-gp inhibitors when a single probe substrate with the same in vitro cell line was used, because it would be the same correction for all inhibitors. Changing the probe substrate with the same in vitro cell line would change the IC50 values but would not affect the rank order.
What is not clear is whether inhibitor rank order would be maintained from one in vitro cell line to another in vitro cell line or when data were extrapolated in vivo. Recall for the P-gp substrate used as a competitive inhibitor that KI = 1/(KQPCKQ). If the binding constant of the inhibitor, KQ, were about the same between two cell types, which is not known but is a reasonable speculation insofar as the acyl chains in plasma membranes are similar, then their rank ordering would depend largely on their relative partition coefficients to the inner apical membrane, KQPC. Whichever drug had the larger partition coefficient would have the smaller KI and possibly a smaller IC50. We found that partition coefficients had a lot of sensitivity between the drugs (Table 1) (Tran et al., 2005). In a different cell line or in vivo, it would be very hard to predict whether the partition coefficients would remain in the same rank order. More measurements of the partition coefficients as a function of liposome composition would clarify this part of the extrapolation problem.
Equation 8 has an immediate application to the in vivo experiments. Choo et al. (2006) found that the tariquidar dose in mice needed to increase the tissue penetration of [11C]N-desmethyl-loperamide to 50% of complete inhibition of P-gp was much higher for the brain than for the testes. They speculated on reasons to explain this, including the possibility that there was a higher P-gp surface density in the blood-brain barrier, following the analysis in Litman et al. (2003). Kurnik et al. (2008) found in humans that tariquidar could fully inhibit P-gp in lymphocytes but not in the blood-brain barrier.
Equation 8 gives us a testable hypothesis to explain these findings. If the ratio of membrane concentration of efflux active P-gp to probe substrate passive permeability coefficients across the apical membrane is greater in the brain than in the testes and the lymphocytes, which seems reasonable, then this equation can explain these observations and allow us to estimate other essential kinetic parameters. If the ratios are opposite, then a very different mechanism than commonly believed must dominate the kinetics of P-gp-mediated transport in these organs.
Equation 8 can also clarify another in vivo issue. Kannan et al. (2009) used an analysis in Kalvass and Pollack (2007) to speculate that the difference between the KP50, identified by them as the KI of the inhibitor, and the SF50, implied that more than 80% of the P-gp in the blood-brain barrier must be bound to achieve 50% inhibition of transport into the brain. They proposed that there could be “spare transporters” in the blood-brain barrier to account for this effect. We see from eq. 8 that the overestimate cited can be explained by our model, without invoking spare transporters. The Kalvass and Pollack (2007) candidate function does not equal the KI for the drugs we have tested, and the SF candidate function predicts the fraction of substrate bound P-gp quite well (Fig. 6).
In summary, we have found that all of the IC50 candidate functions tested in this work overestimate the KI. The SF50/KI overestimate depends on the membrane concentration of efflux active P-gp in the apical membrane and the probe substrate kinetic parameters (eq. 8). This equation can be used to refine the estimate for the KI (Table 2). Thus, our kinetic model yields a simple and accurate equation that can serve as a tool for in vitro-in vivo extrapolation.
Footnotes
-
↵
 The online version of this article (available at http://dmd.aspetjournals.org) contains supplemental material.
 -
Article, publication date, and citation information can be found at http://dmd.aspetjournals.org.
doi:10.1124/dmd.109.029843.
-
- KI
- KD of a P-gp substrate when it is used as an inhibitor
- MDCKII-hMDR1
- Madin-Darby canine kidney II cell line overexpressing human multidrug resistance 1
- KC
- the substrate binding constant to P-gp relative to the lipid bilayer
- P-gp
- the P-glycoprotein product of the hMDR1 gene
- MRP
- multidrug resistance-associated protein
- GF120918
- N-(4-[2-(1,2,3,4-tetrahydro-6,7-dimethoxy-2-isoquinolinyl)ethyl]-phenyl)-9,10-dihydro-5-methoxy-9-oxo-4-acridine carboxamide
- A>B (or B>A)
- transport across the confluent cell monolayer when the donor chamber is apical (or basolateral) and the receiver chamber is basolateral (or apical), respectively
- KD = 1/(KC∗KPC)
- substrate dissociation constant from P-gp relative to the aqueous concentration in the cytosol, where KPC is the substrate’
- Received August 20, 2009.
- Accepted November 2, 2009.

- Copyright © 2010 by The American Society for Pharmacology and Experimental Therapeutics


